A Novel Simplified Model for Blood Coagulation: A piecewise dynamical model for thrombin with robust predictive capabilities
Abstract
Realistic description of patient-specific mechanical properties of clotting dynamics presents a major challenge. Available patient-specific data falls short of robustly characterizing myriads of complex dynamic interactions that happen during clotting. We propose a simplified switching model for a key part of the coagulation cascade that describes dynamics of just four variables. The model correctly predicts prolonged activity of thrombin, an important enzyme in the clotting process, in certain plasma factor compositions. The activity sustains beyond the time which is conventionally considered to be the end of clotting. This observation along with the simplified model is hypothesized as a necessary step towards effectively studying patient-specific properties of clotting dynamics in realistic geometries.
1 Introduction
Patient-specific geometry modeling, simulations with more realistic boundary conditions, multiscale models that combine molecular mechanisms with clinical manifestation are some of the open problems discussed in vascular biomechanics [1]. Blood constituents vary drastically in patients and their composition plays a significant role in determining the mechanical properties of the resulting clot [2, 3, 4].
Current methods model generation and depletion of various constituents in blood flow using convection reaction diffusion equations [5],
| (1) |
where is a constituent, is velocity, are diffusion coefficients, and are source terms due to clotting reaction dynamics. Number of constituents is in the order of thousands; typical models consider between 30 to 40 constituents [6, 5]; and clotting reaction models considering hundreds of constituents have been proposed [7, 8].
1.1 Need for Simple Models
Models accounting for myriads of chemical reactions are considered as a first step towards understanding the complex phenomena of clotting [5]. Further modeling many such constituents are useful in a diagnostic setting where often diseases are reflected as abnormalities in the coagulation cascade [9]. In particular reaction dynamics alone, for example, dynamics of thrombin [10, 11], is known to be associated with many diseases such as acute coronary syndrome [12], acute cerebrovascular disease [13], rheumatoid arthritis [14], etc. Recent studies in this direction include use of machine learning tools to characterize and use such abnormalities for disease classification tasks such as identifying patients prone to heart attacks [15, 16].
However, simplified models for the coagulation cascade are required so that:
-
1.
the model predictions are more readily verifiable using experiments
-
2.
augmenting chemical reaction dynamics in other phenomena such as flow and mechanical characterization of clots in patient-specific terms become feasible and readily comprehensible.
1.2 Challenges in Modeling the Coagulation Cascade
The chemical reaction kinetics particularly poses many challenges. Models describing kinetics using reactions are of the form,
| (2) |
where are stoichiometric coefficients (), are reaction rates, are parameters of the reaction rates, and are the initial plasma composition.
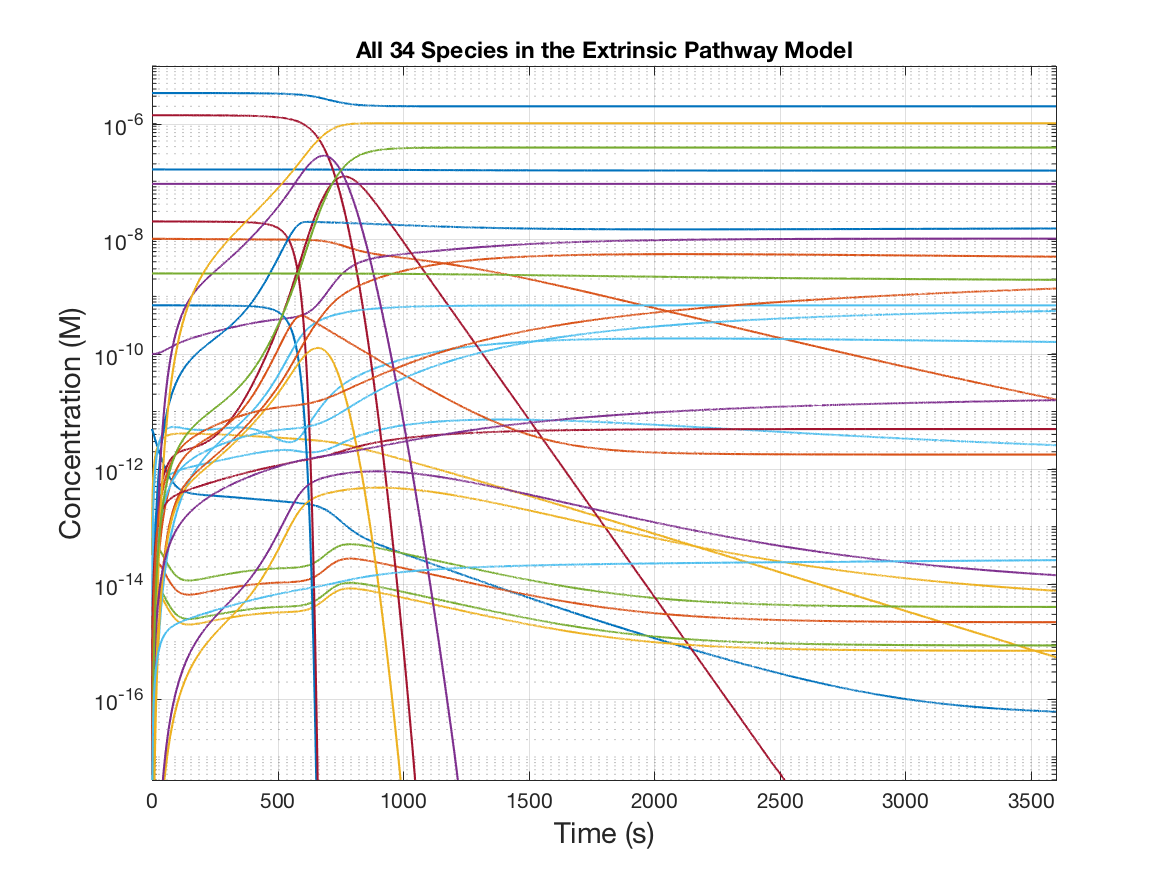
Concentration of proteins involved in coagulation and rates of reactions vary by orders of magnitude (see Figure 1). Essentially, picomoles of trigger results in the formation of hundreds of nanomoles of certain enzymes. This in turn results in macroscopic formation of clots. Typically stochastic methods [17] are used to properly account for low concentrations of species [18, 19].
The nonlinear chemical kinetics is modeled using reaction rates that typically has quadratic terms or Hill-like terms [20] . The models are very stiff and solution trajectories are unstable in many directions [21]. The rates involve negative feedback loop or cycles in the reaction cascade [22]. This poses challenges in numerically coupling chemical reactions with flow simulations.
Moreover, there is uncertainty in the parameters of the reaction kinetics models. It is hard to measure most of these protein factors. Many rate parameters are inferred indirectly rather than being directly measured. Models used to simulate clot in small two dimensional regions (100 m) consider the dynamics of many reactants [23]. These are inappropriate for simulations in realistic 3 dimensional flow conditions in arteries, say, in order to study atheroscelerosis or thrombosis [23]. Reduced dimensional simplified chemical kinetics models will help to advance the quality of patient specific simulations in realistic geometries.
1.3 Relevant Literature on Reduced Order Models
Papadopoulos et al. [23] suggested a phenomenological model for thrombin dynamics. Based on the mechanism of thrombin dynamics, they propose a simplified thrombin dynamics model using four reactions. The reactions include dynamics of thrombin, prothrombin, platelets, and activated platelets. Using the assumption of fast platelet activation, they derive analytical expression for thrombin generation. These are similar to thrombin generation functions prescribed by Hemker et al. [24]. The model essentially fits patient specific thrombin generation profiles and the effect of the plasma factor composition and inhibitors on the dynamics of thrombin were not emphasized.
This motivated Sagar et al. [25] to come up with a dynamical model for thrombin generation using a hybrid strategy. The strategy combines differential equations and several logical rules to model thrombin dynamics. They design their approach to model systems where mechanistic insights are poor and experimental interrogation is difficult. This results in reduced order model that has rates of the product of Hill-like terms and transfer functions that act as the logical rules, i.e.,
| (3) |
where is the reaction rate, and are parameters, and pertains to protein concentration or activity. Though the model shows good performance for thrombin dynamics, the transparency in the mechanistic models such as [24] and [23] is lost, i.e., the functionality of the model parameters and effect of their changes is not evident. We seek a middle ground between the two simplified models where we find a dynamical model that makes use of the mechanistic knowledge of blood coagulation and is able to account for changes in plasma factor composition.
1.4 Proposed Model Properties
We suggest a simple phenomenological model for thrombin dynamics based on chemical kinetics:
-
1.
We model the stoichiometry and dynamics of certain important and easily measurable chemical species. The model is based on the classically viewed initiation, propagation, and termination of thrombin dynamics. Hence the chemistry involved in the simulations offer physiological insight.
-
2.
We model the initiation phase and the propagation/termination phase of thrombin dynamics separately using a switching criteria for the rate parameters. The switch separates the slow initiation phase from the latter which is orders of magnitude faster.
-
3.
The model we propose shows varied responses. The functionality of the parameters are evident and different aspects of thrombin dynamics are easily alterable.
-
4.
A good model should be able to capture the necessary rich behavior of the phenomena as well as generalize well in order to predict important qualitative and quantitative responses. The model accounts for the physiological effect of antithrombin and is able to predict certain important changes in thrombin dynamics due to changes in prothrombin and antithrombin concentration.
-
5.
The model is dynamical in the sense that rates for the model species could be calculated given the current values of the model variables. In other words, we essentially model for the important species in equation 1 so that the model could be extended to account for transport.
The simplified model proposed here is expected to make patient-specific mechanical characterization of clots in realistic geometries feasible.

2 Thrombin Generation in the Extrinsic Pathway
2.1 Full Model
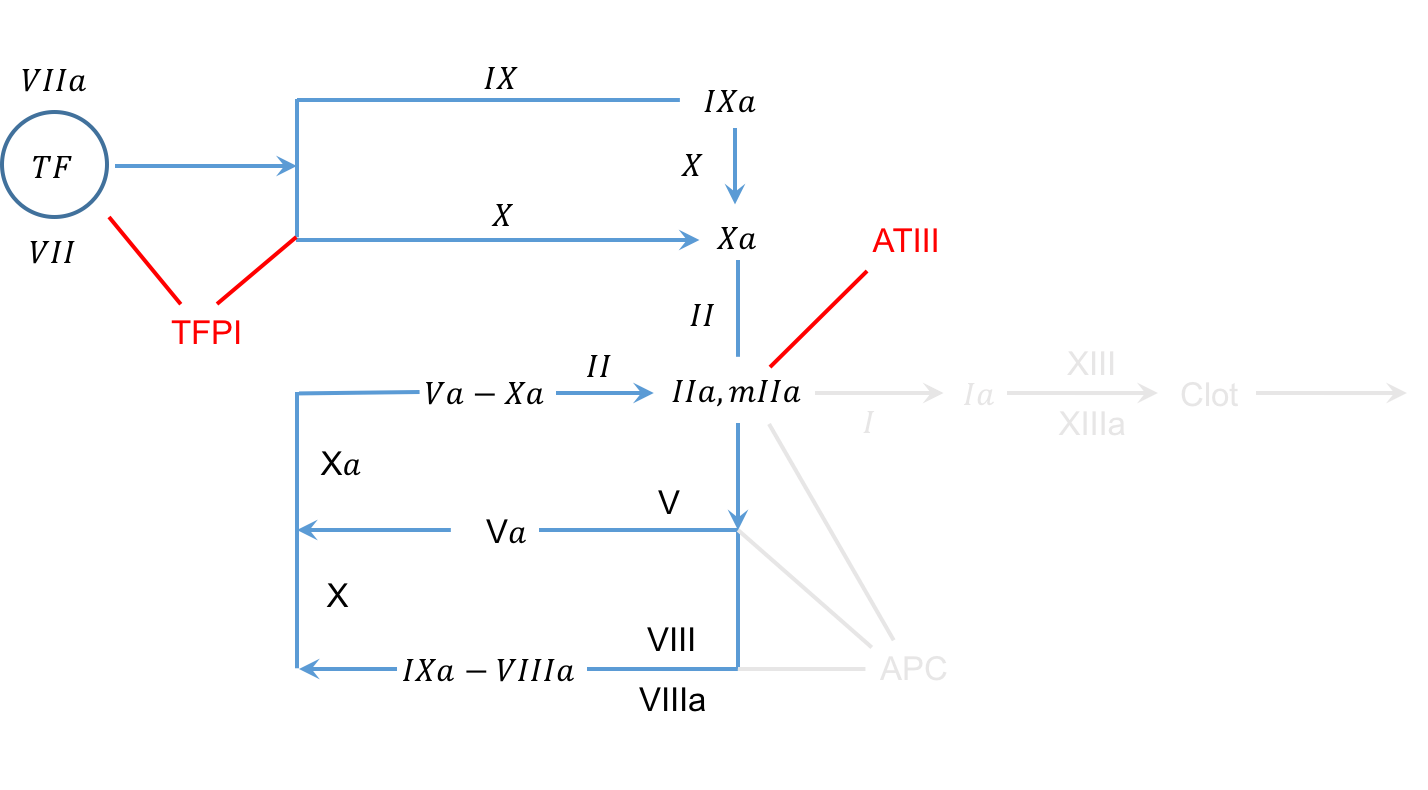
Figure 2 shows a schematic of the key elements of the extrinsic pathway involved during clotting. We consider the extrinsic pathway because hemostasis occurs due to tissue factor initiation. Further, we simply simplify thrombin dynamics. Given that flow properties affect and are affected by fibrin formation, such a simple thrombin dynamics model factors out the two phenomena. Reactions in the intrinsic pathway could be readily accounted for due to the phenomenological aspect of initiation in the proposed model. For simulations of the full model, we use the extrinsic pathway developed by Hockin et al. [6]. A schematic of the model used is shown in Figure 3.
2.2 Key Ideas Used for Simplification
We exploit the following ideas for model simplification:
Dynamical Parametrization:
Patient specificity in blood coagulation is usually modeled using variations in the initial conditions for the differential equations. This leads to a high-dimensional state space and specification of dynamics in that space of many constituents as described earlier. However, we simplify the state of the system using just four important species and then model the dynamics of those four constituents. The effect of other constituents are parametrized in the rates describing the dynamics of the former, i.e., the effect of patient specificity of thrombin dynamics is described using variations in the rate parameters of the simplified model. We show that training the model for a specific choice of initial condition in the original state space (physiological mean) is able to predict qualitative responses of changes in prothrombin and antithrombin concentration in the reduced state space.
Switching:
We separate the parameters in the initiation and propagation/termination phase of thrombin dynamics using a switching model. Such switching models are commonly used to model complex nonlinear systems [26]. Switching models are known to result in simplified models for even chaotic dynamics. For example, piecewise affine models are known to model chaotic behavior of many nonlinear systems well [27]. The proposed model switches from initiation to propagation/termination phase based on the concentration of thrombin. Such threshold-based responses have been used in models describing initiation [23] and platelet activation [5] in the coagulation cascade. The hybrid (switching) model by Makin and Narayanan [28] intends to develop a comprehensive model rather than a simplified model.
2.3 Simplified Model
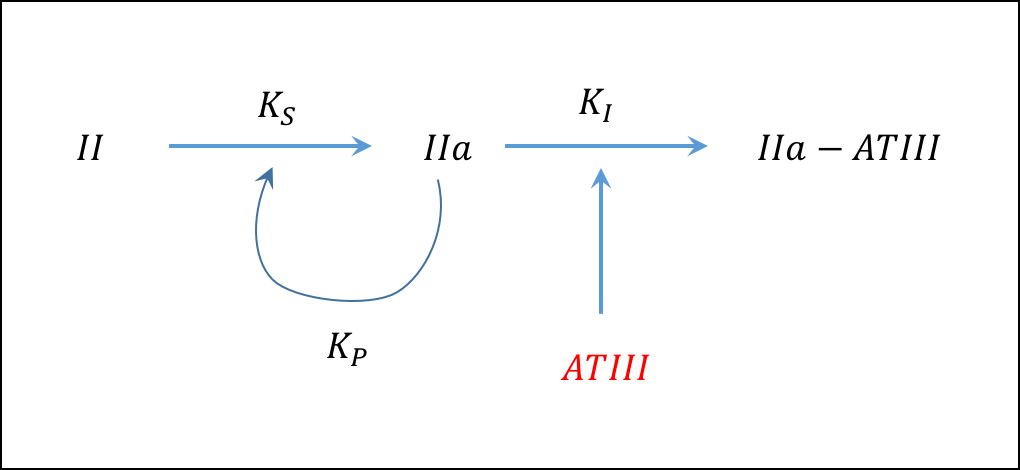
We use the traditional simplification of the thrombin generation cascade and describe kinetics for prothrombin, thrombin, antithrombin, and thrombin-antithrombin using the following set of reactions:
-
1.
Thrombin Initiation: Tissue factor activates prothrombin to form thrombin.
{chemmath}II \reactrarrow0pt2.5cmInitiation IIa
-
2.
Thrombin propagation: Given that sufficient amount of thrombin (2 nM) is activated, clotting propagates via a different set of reactions.
{chemmath}II \reactrarrow0pt2.5cmPropagation IIa
-
3.
Thrombin inhibition: Finally normal hemostasis requires that thrombin generation is controlled.
{chemmath}IIa + AT \reactrarrow0pt2.5cmTermination IIaAT
Corresponding to the reactions, we define the following stoichiometric model:
| (4) |
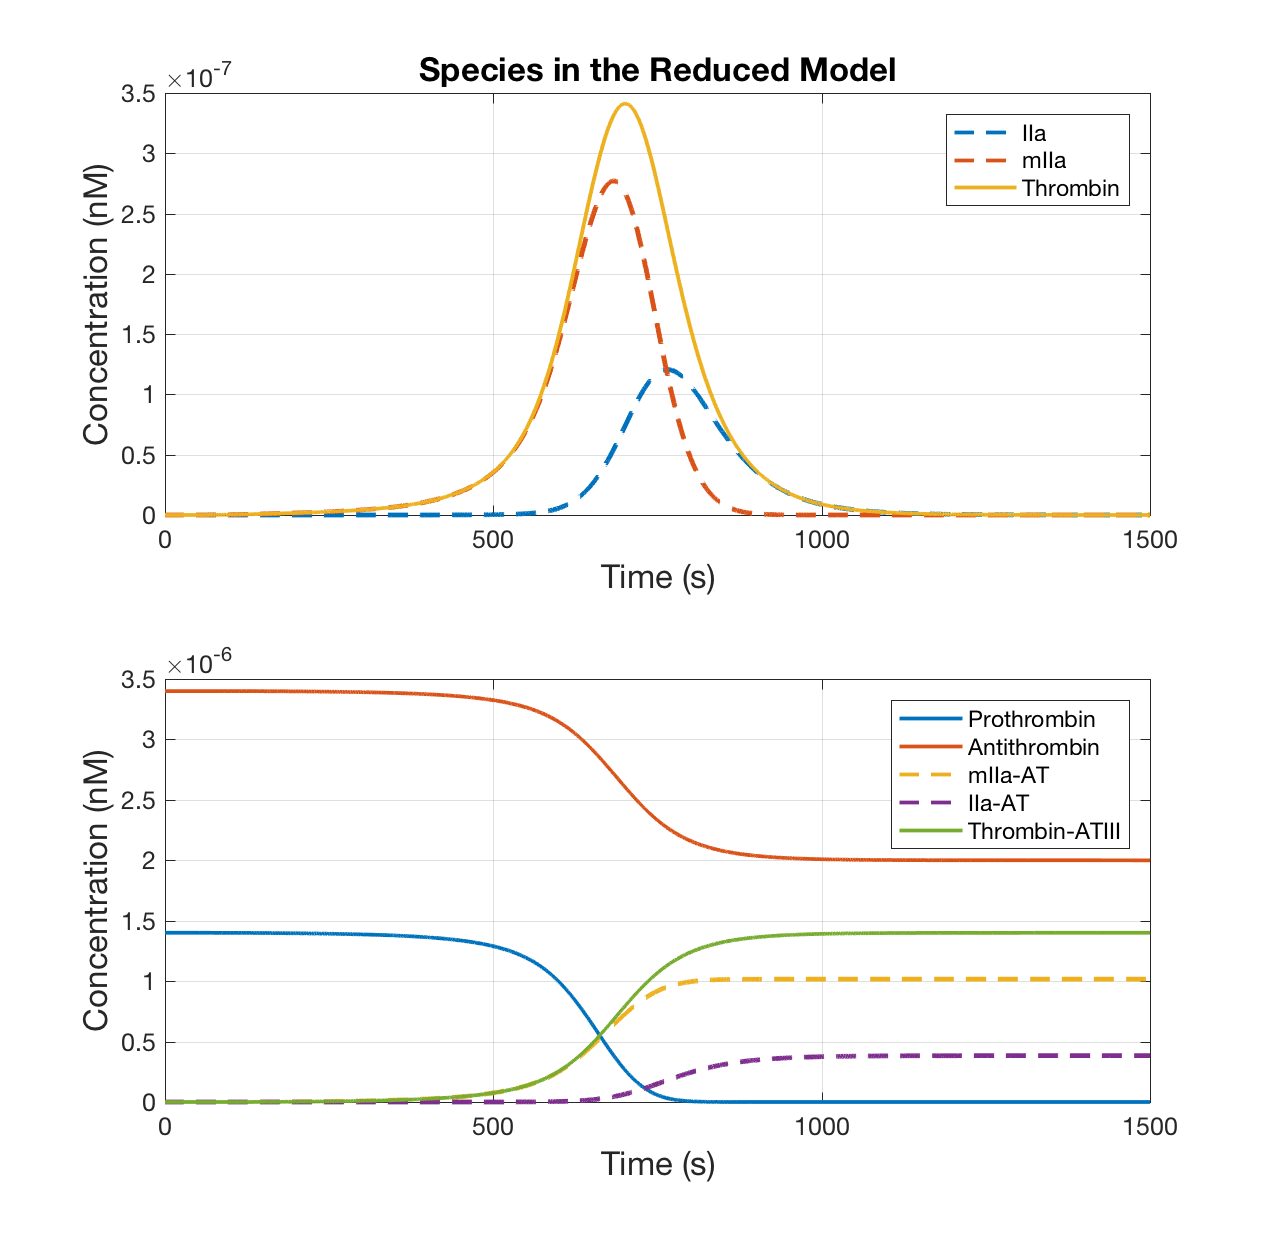
where we model initiation using the rate constant , propagation using the rate constant , and inhibition using the rate constant . In order to be stoichiometrically consistent, our [IIa] is the sum of both forms of thrombin in the full 34 variable model (the variables used in our model are drawn in continuos lines in the full model simulation as seen in Figure 5). [IIa-AT] in our model is the sum of the two antithrombin complex formed due to inhibition111there are other antithrombin complexes formed in the full model but they are 3 orders of magnitude smaller than [IIa-AT] and we neglect them..
Among the four species modeled, methods to measure or infer thrombin, ATIII, and thrombin antithrombin [29, 30, 31, 32] exist. The rates in equation 4 are such that they satisfy a stoichiometric constraint, i.e.,
| (5) |
and are constants defined using the initial conditions. These dependence relations are crucial while designing experiments to properly observe the system. For example, calibrated automated thrombogram assay is inadequate to make proper measurements with deficient ATIII [33] due to fluorogenic substrate depletion. In the results section, we will discuss the possibility of sustained thrombin activity when ATIII is deficient leading to the depletion.
| [IIa] 2 nM | [IIa] 2 nM | |
|---|---|---|
| 0 | ||
| 0 |
We propose the switching rules in Table 1 that changes the response of the model during initiation and propagation/termination. Essentially, thrombin propagation occurs if [IIa] crosses a threshold. For normal clotting, rate of propagation is expected to be orders of magnitude higher than that of rate of initiation. We also use two different inhibition rate constant and so that rate of inhibition could be separately tuned during the two phases.
3 Results and Discussion
3.1 Estimation of Model Parameters
In the simulations of the full model, clotting was initiated with 5 pM and the plasma factor composition was set to physiological mean values [6]. We used the data from the full model to fit parameters for the reduced model. We note that thrombin dynamics of the full model has been corroborated with experimental data [6]. Particle swarm optimization [34] was used for parameter estimation and we obtained one set of parameters for the physiological mean composition.
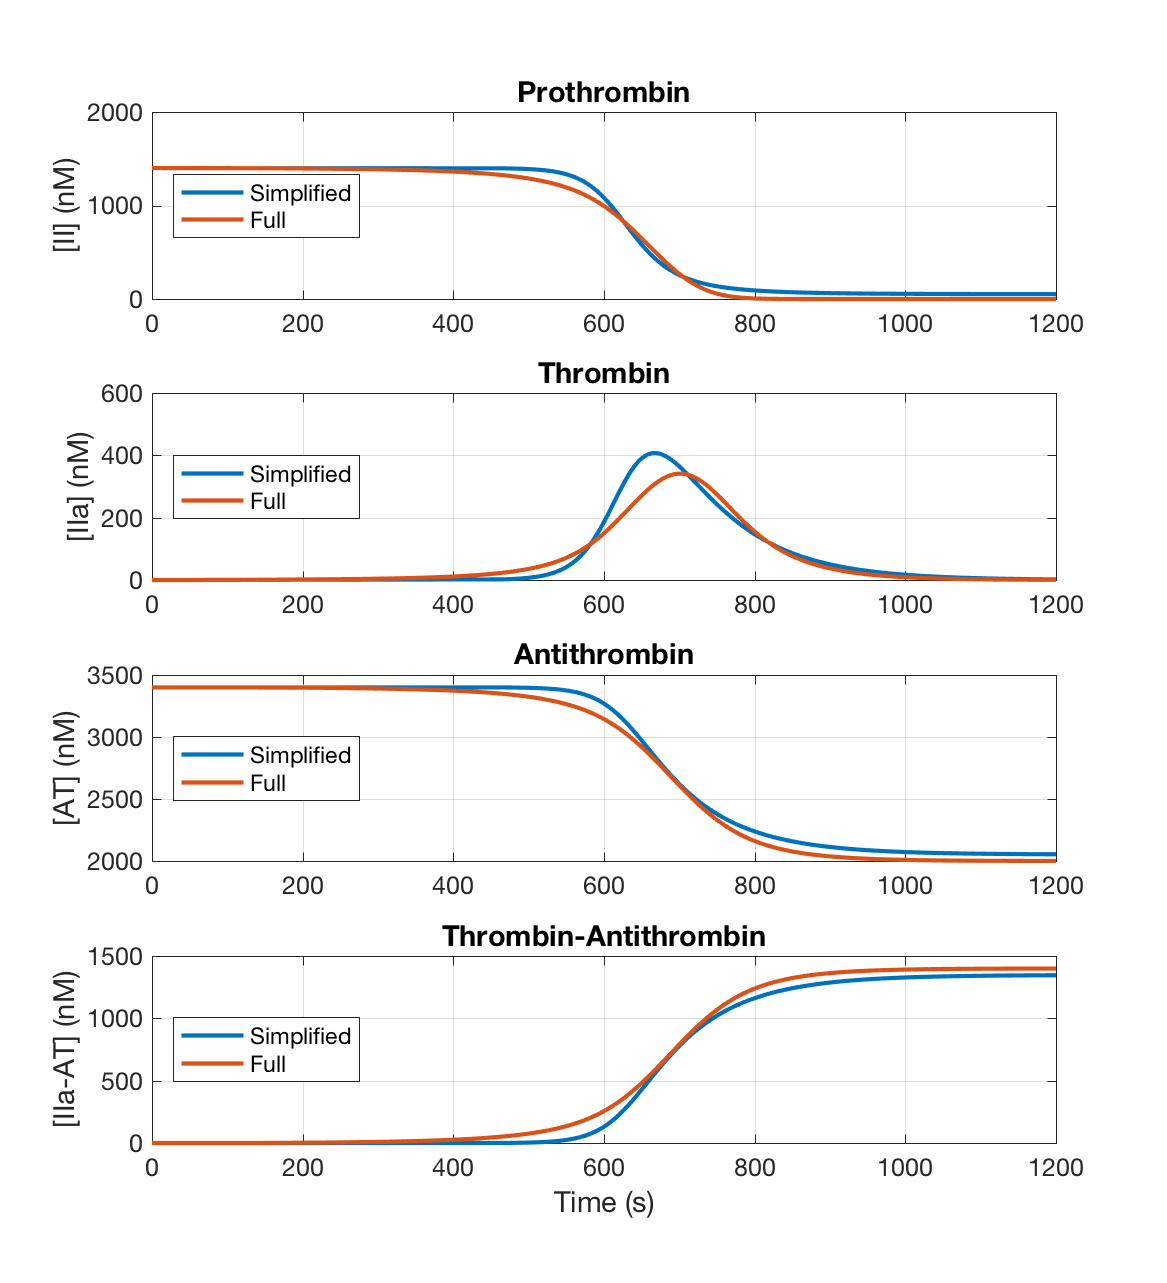
We used the sum of squared differences of the normalized concentration profiles between the common species in the full model and the reduced model as the objective function,
| (6) |
where denotes time points and denotes model species. Mean concentration of prothrombin and antithrombin were used as normalization constants . Comparison of the reduced and full model simulation for the physiological mean initial composition is shown in Figure 6.
3.2 Parameter Study of the Simplified Model
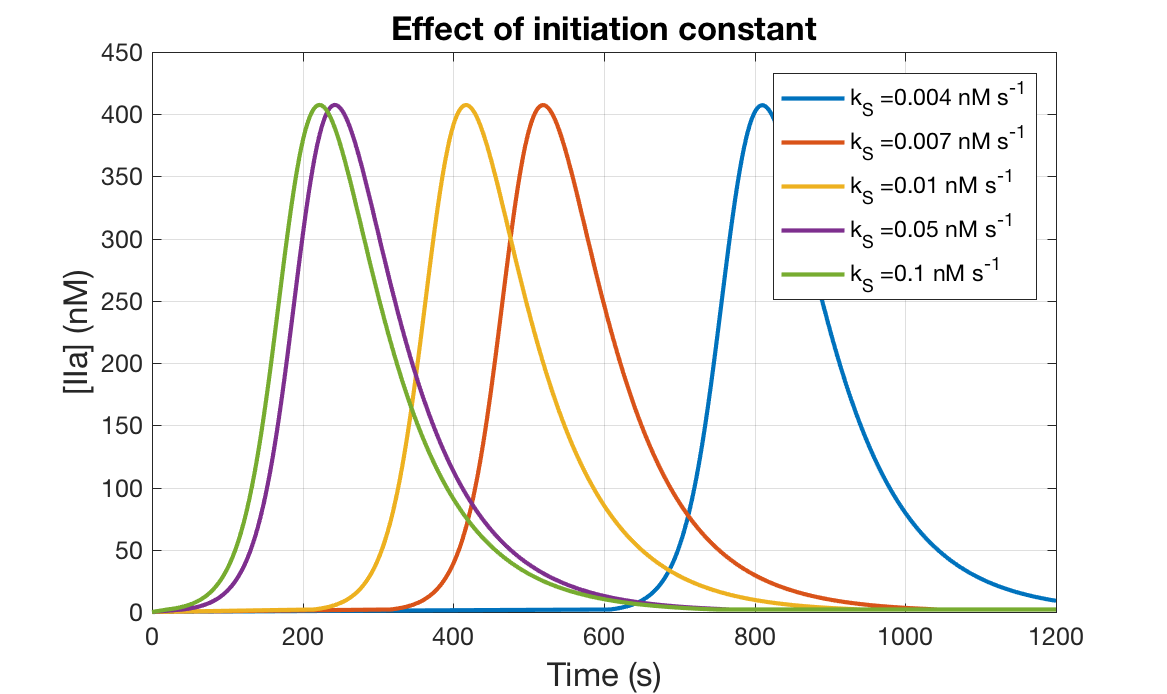
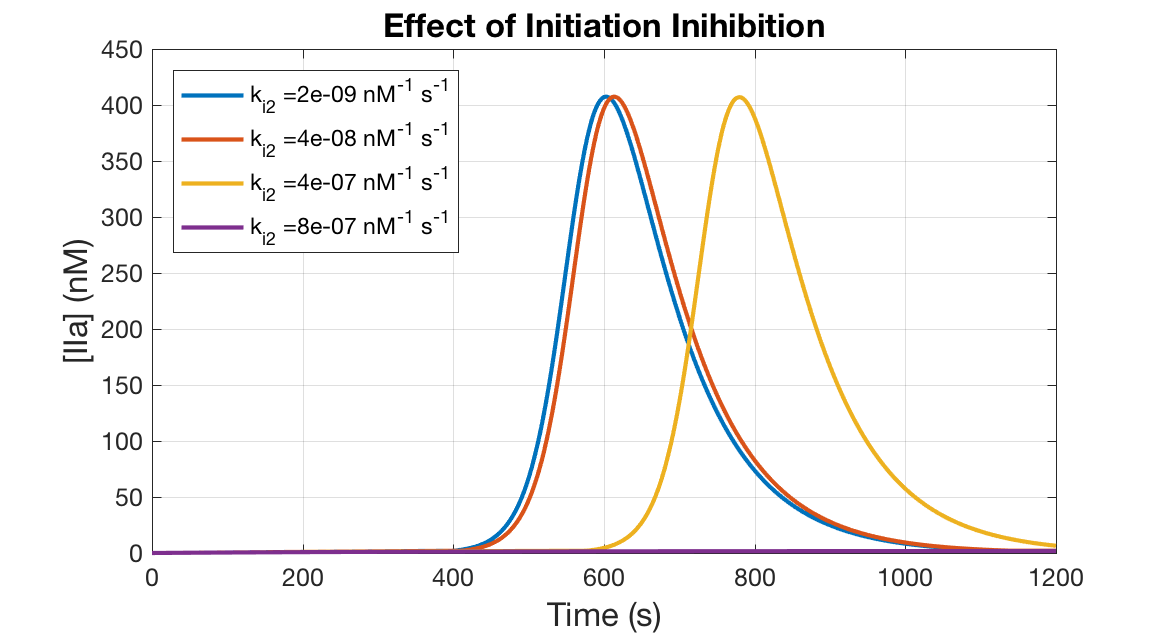
We show the effect of parameters by changing them one at a time. Clot time depends exponentially on (seen in Figure 7). Rate constant also controls the clot time Figure 8. For certain combinations of and it takes more than 1200 seconds for clot initiation. Both the parameters together offer more control over dynamics of clot initiation.
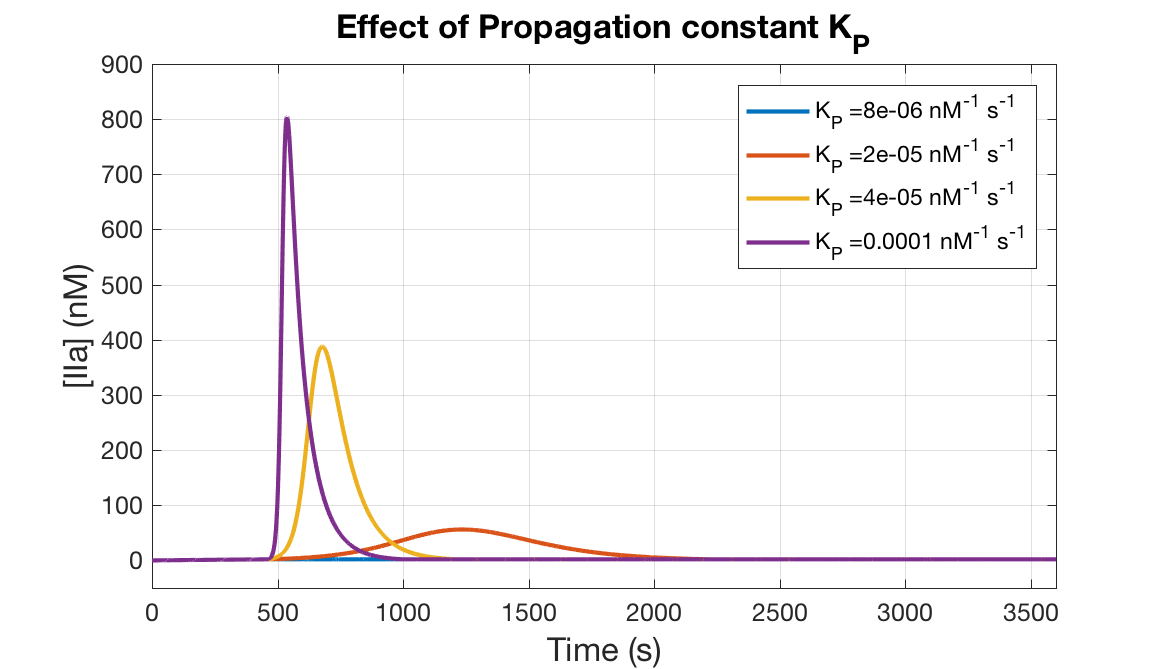
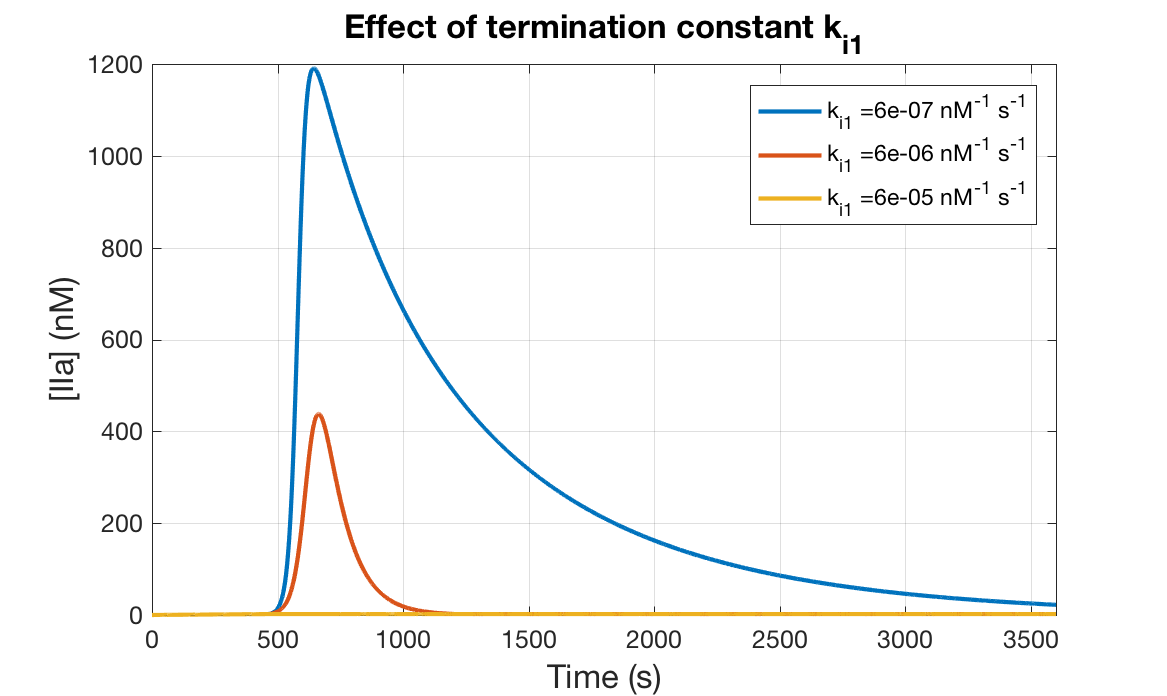
Figures 9 and 10 show the effect of changes in the rate constants and respectively. The parameters offer a wide range of thrombin generation rates. Similar to the initiation, there are certain values of (for a given value of ) and vice versa where thrombin generation is too low. These two parameters together offer control over simulating a wide range of thrombin propagation.
3.3 Prediction of Variation in Prothrombin and Antithrombin
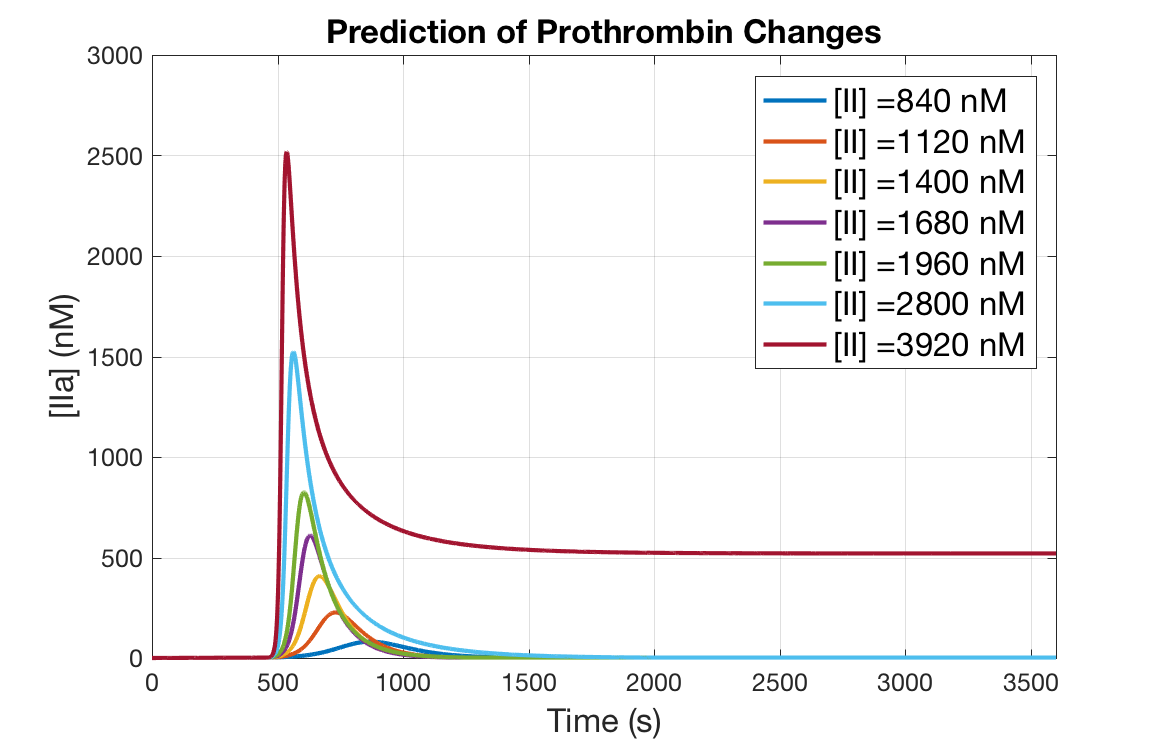
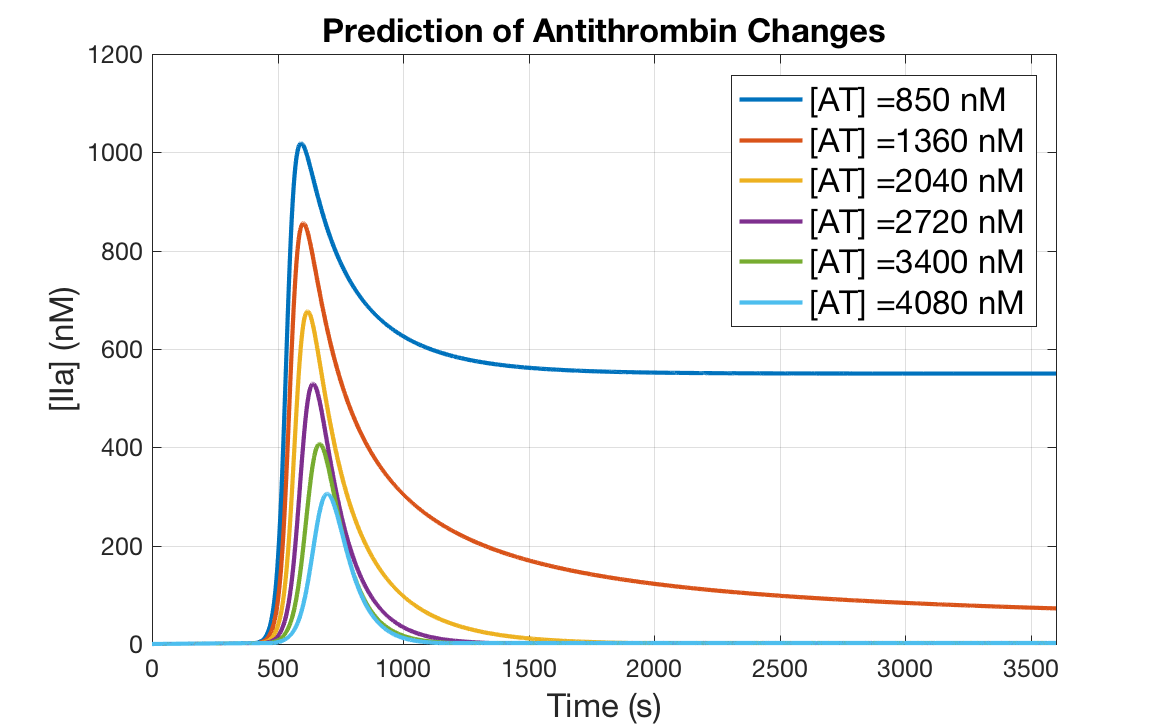
Finally, we check the qualitative response of the model predictions for variations in initial prothrombin and antithrombin concentrations. As seen in Figure 11, higher values of prothrombin are able to predict more thrombin generation. This has been observed in experiments [35]. Thrombin rates during termination could be improved using better training data and using different reaction rates. Similarly, lower values of antithrombin are able to predict higher thrombin generation.
One of the most important predictions of this model is that thrombin termination appears to halt at non-zero values (Figure 12). Such sustained activity is also in observed in experiments when there is too much prothrombin compared to antithrombin [35]. Inhibitors such as activated protein C may need to modeled in order to account for oscillations observed in such sustained activity. In this model, the reaction essentially runs out of the inhibitor [AT] when initiated with a certain plasma factor composition. In such a scenario, other phenomena like diffusion and convection will control the extent of clotting. For example, when there is less inflow of antithrombin concentration, as in the case of stasis, we would expect more clotting due to the presence of excess active thrombin. The significance of antithrombin deficiency in simulations accounting for diffusion has already been reported [36]. For a given value of initial prothrombin, and given that thrombin generation proceeds normally due to sufficient rates, the simplified model quantifies the amount of antithrombin required for thrombin generation to terminate.
Further, active thrombin could be propagated downstream and could potentially cause clotting elsewhere. This observation and model prediction on sustained activity of thrombin are hypothesized to play a necessary role towards effectively studying clotting in realistic geometries.
3.4 Limitations and Improvements
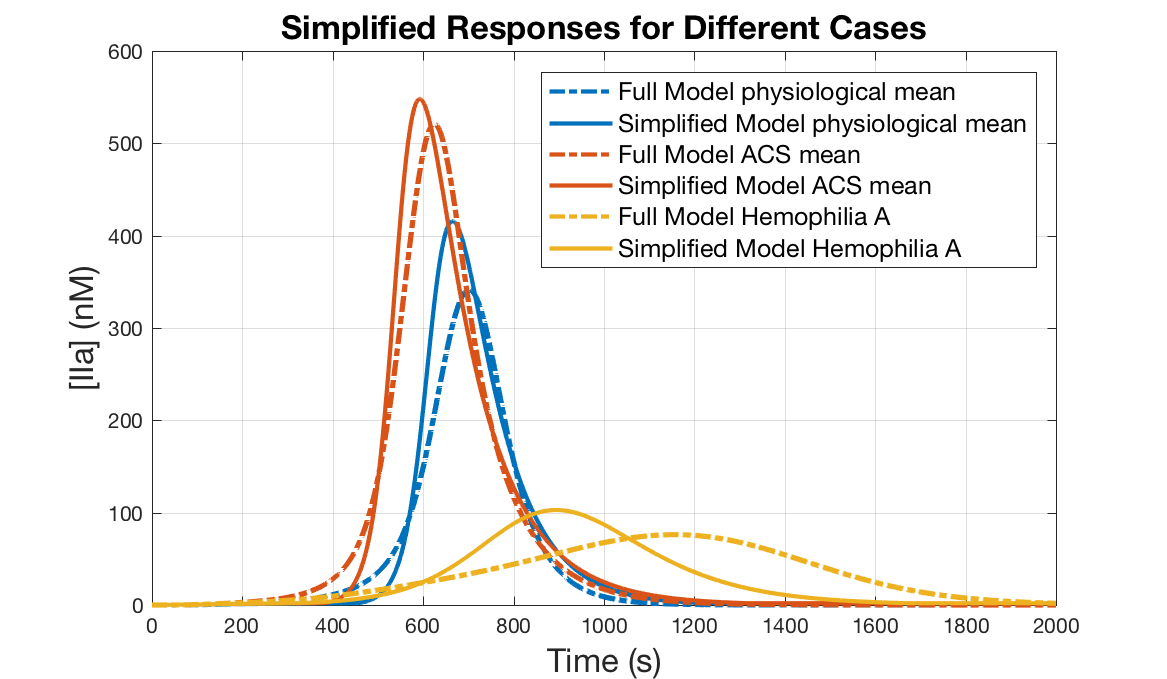
The simplified model proposed here, when coupled with fluid flow and transport models, is expected to make patient-specific mechanical characterization of clots in realistic geometries feasible. The parameters of the model need to be altered in order to better simulate thrombin dynamics on a wider range of plasma factor compositions. Figure 15 shows simulations from parameters identified for acute coronary syndrome population mean composition [12] and a hemophilia patient [11] (plasma factor composition of patient C in Figure 3. (B)). The hemophilia patient simulations suggest the form of rate functions as well as the threshold value (2 nM [IIa]) could be modeled better.
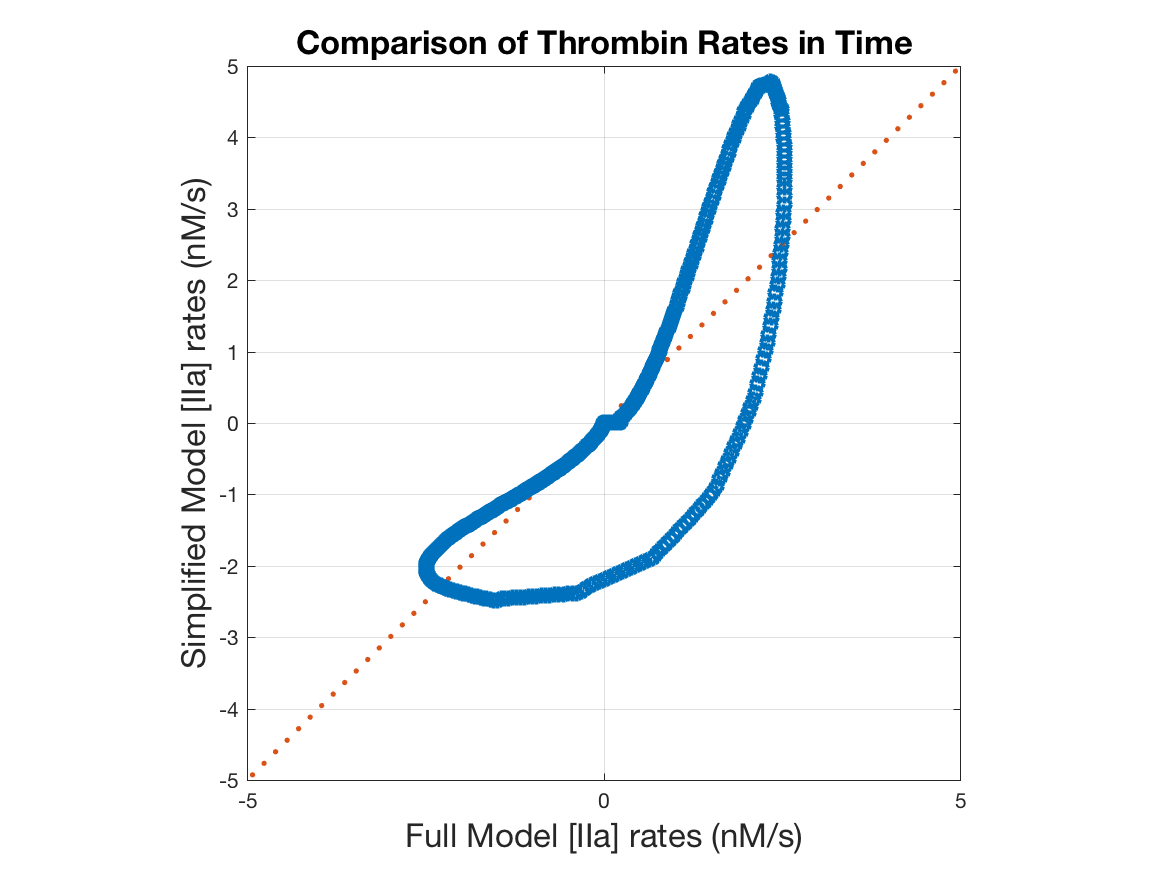
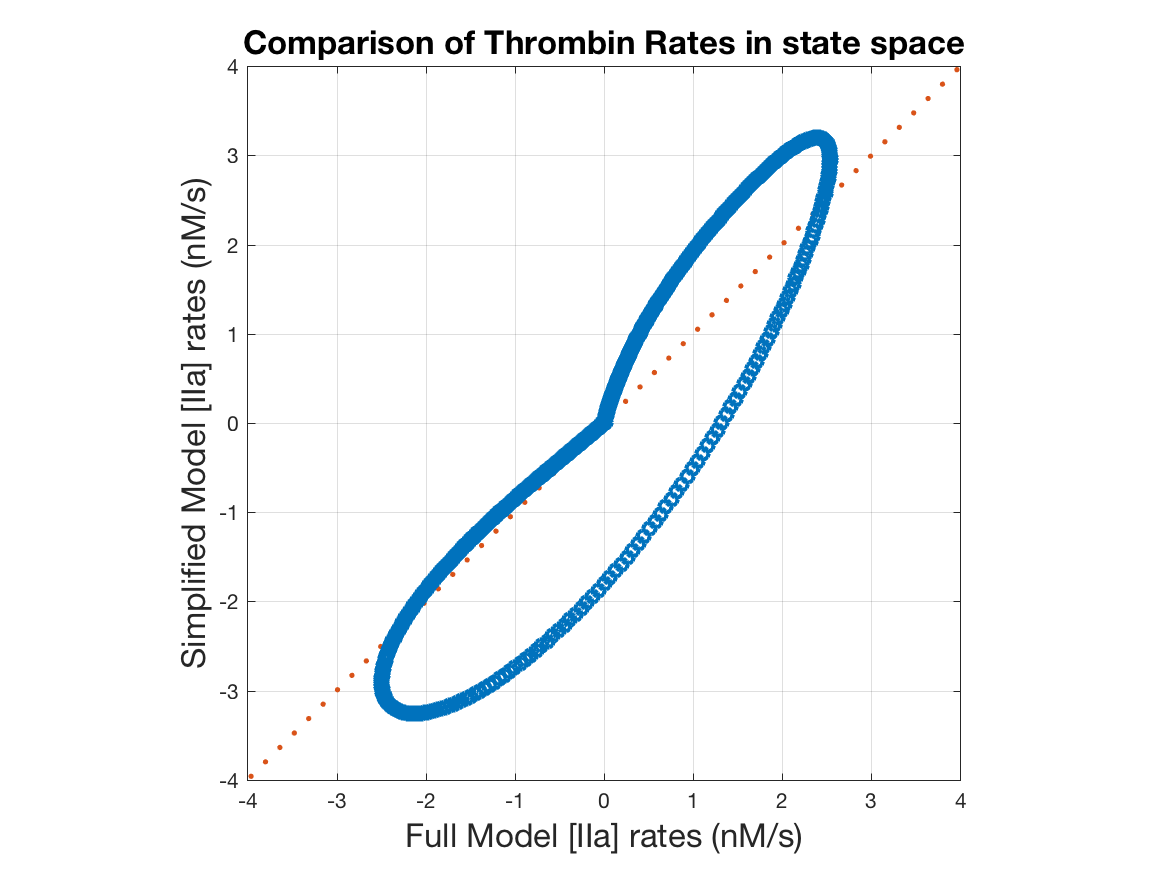
For the mean plasma composition, Figure 15 shows the full model thrombin rates for the simplified model at different times during clotting plotted against the corresponding time points of the full model. The reaction rates could be improved to better align the simulation data with the line. We also note that the objective used for simplification in equation 6 does not explicitly penalize deviations in rates. Figure 15 shows thrombin rates for the simplified model at different points in the state space along a particular trajectory of the full model plotted against the corresponding rates of the full model. The alignment is better in this case compared to figure 15. This suggests that the simplified model takes a slightly different path compared to the full model. We are currently working towards modifying the dynamics and the objective so that the rates could be better simulated. We are also currently testing the performance of the model while accounting for the effects of diffusion.
Augmenting the simplified model with fibrin dynamics would allow patient- and event-specific characterization of thromboelastography experiments [37, 38]. This would be useful to better characterize clotting during surgeries [39]. This work could be further improved by coupling with simplified platelet aggregation models. To conclude, the drastically simplified model proposed here is a novel and a fertile step and subsequent progress has potential applications such as virtual flow-diverter treatment planning [40], predicting thrombotic risk accounting for flow [41], factors like injuries in tandem [42] and stenosed arteries [43].
4 Conclusion
We proposed a simplified model for thrombin dynamics based on the stoichiometry of certain important chemical species. The model, using switching of parameters based on a threshold, describes dynamics of thrombin akin to jump starting a car. The simplified model fits corresponding aspects of the full model well and different features of thrombin dynamics are easily alterable. The model is able to predict certain important changes in thrombin dynamics due to changes in prothrombin and antithrombin concentration. This prediction using the simplified model with the potential for clinical manifestation in hypercoagulable diseases is hypothesized as a necessary step in patient-specific simulations of clotting in realistic geometries.
References
- [1] Charles A Taylor and JD Humphrey. Open problems in computational vascular biomechanics: hemodynamics and arterial wall mechanics. Computer Methods in Applied Mechanics and Engineering, 198(45):3514–3523, 2009.
- [2] Anetta Undas. Fibrin clot properties and their modulation in thrombotic disorders. Thromb Haemost, 112(1):32–42, 2014.
- [3] Thomas HS van Kempen, Wouter P Donders, Frans N van de Vosse, and Gerrit WM Peters. A constitutive model for developing blood clots with various compositions and their nonlinear viscoelastic behavior. Biomechanics and modeling in mechanobiology, 15(2):279–291, 2016.
- [4] Alisa S Wolberg. Thrombin generation and fibrin clot structure. Blood reviews, 21(3):131–142, 2007.
- [5] M Anand, K Rajagopal, and KR Rajagopal. A model incorporating some of the mechanical and biochemical factors underlying clot formation and dissolution in flowing blood: review article. Journal of Theoretical Medicine, 5(3-4):183–218, 2003.
- [6] Matthew F Hockin, Kenneth C Jones, Stephen J Everse, and Kenneth G Mann. A model for the stoichiometric regulation of blood coagulation. Journal of Biological Chemistry, 277(21):18322–18333, 2002.
- [7] Deyan Luan, Michael Zai, and Jeffrey D Varner. Computationally derived points of fragility of a human cascade are consistent with current therapeutic strategies. PLoS Comput Biol, 3(7):e142, 2007.
- [8] Deyan Luan, Fania Szlam, Kenichi A Tanaka, Philip S Barie, and Jeffrey D Varner. Ensembles of uncertain mathematical models can identify network response to therapeutic interventions. Molecular Biosystems, 6(11):2272–2286, 2010.
- [9] SI Rapaport. Blood coagulation and its alterations in hemorrhagic and thrombotic disorders. Western Journal of Medicine, 158(2):153, 1993.
- [10] Kenneth G Mann, Saulius Butenas, and Kathleen Brummel. The dynamics of thrombin formation. Arteriosclerosis, Thrombosis, and Vascular Biology, 23(1):17–25, 2003.
- [11] K Brummel-Ziedins. Models for thrombin generation and risk of disease. Journal of Thrombosis and Haemostasis, 11(s1):212–223, 2013.
- [12] K Brummel-Ziedins, A Undas, T Orfeo, M Gissel, S Butenas, K Zmudka, and KG Mann. Thrombin generation in acute coronary syndrome and stable coronary artery disease: dependence on plasma factor composition. Journal of Thrombosis and Haemostasis, 6(1):104–110, 2008.
- [13] Matthew Gissel, Anetta Undas, Agnieszka Slowik, Kenneth G Mann, and Kathleen E Brummel-Ziedins. Plasma factor and inhibitor composition contributes to thrombin generation dynamics in patients with acute or previous cerebrovascular events. Thrombosis Research, 126(4):262–269, 2010.
- [14] Anetta Undas, Matthew Gissel, Beata Kwasny-Krochin, Piotr Gluszko, Kenneth G Mann, and Kathleen E Brummel-Ziedins. Thrombin generation in rheumatoid arthritis: dependence on plasma factor composition. Thrombosis and Haemostasis, 104(2):224, 2010.
- [15] Jayavel Arumugam, Satish TS Bukkapatnam, Krishna R Narayanan, and Arun R Srinivasa. Random forests are able to identify differences in clotting dynamics from kinetic models of thrombin generation. PloS one, 11(5):e0153776, 2016.
- [16] Jayavel Arumugam. Bad Blood: Combining Data Analytics and Chemical Kinetics to Study Human Blood Coagulation in Certain Diseases. PhD thesis, Texas A&M University, 2017.
- [17] Daniel T Gillespie. Exact stochastic simulation of coupled chemical reactions. The Journal of Physical Chemistry, 81(25):2340–2361, 1977.
- [18] Ian J Laurenzi and Scott L Diamond. Monte carlo simulation of the heterotypic aggregation kinetics of platelets and neutrophils. Biophysical Journal, 77(3):1733–1746, 1999.
- [19] Ken Lo, William S Denney, and Scott L Diamond. Stochastic modeling of blood coagulation initiation. Pathophysiology of Haemostasis and Thrombosis, 34(2-3):80–90, 2006.
- [20] James N Weiss. The hill equation revisited: uses and misuses. The FASEB Journal, 11(11):835–841, 1997.
- [21] Christopher M Danforth, Thomas Orfeo, Kenneth G Mann, Kathleen E Brummel-Ziedins, and Stephen J Everse. The impact of uncertainty in a blood coagulation model. Mathematical Medicine and Biology, 26(4):323–336, 2009.
- [22] Fazoil I Ataullakhanov and Mikhail A Panteleev. Mathematical modeling and computer simulation in blood coagulation. Pathophysiology of haemostasis and thrombosis, 34(2-3):60–70, 2005.
- [23] Konstantinos P Papadopoulos, Manolis Gavaises, and Chris Atkin. A simplified mathematical model for thrombin generation. Medical engineering & physics, 36(2):196–204, 2014.
- [24] R Wagenvoord, PW Hemker, and HC Hemker. The limits of simulation of the clotting system. Journal of Thrombosis and Haemostasis, 4(6):1331–1338, 2006.
- [25] Adithya Sagar and Jeffrey D Varner. Dynamic modeling of the human coagulation cascade using reduced order effective kinetic models. Processes, 3(1):178–203, 2015.
- [26] Emily B Fox. Bayesian nonparametric learning of complex dynamical phenomena. PhD thesis, Massachusetts Institute of Technology, 2009.
- [27] Gleison FV Amaral, Christophe Letellier, and Luis Antonio Aguirre. Piecewise affine models of chaotic attractors: the rössler and lorenz systems. Chaos: An Interdisciplinary Journal of Nonlinear Science, 16(1):013115, 2006.
- [28] Joseph G Makin and Srini Narayanan. A hybrid-system model of the coagulation cascade: Simulation, sensitivity, and validation. Journal of Bioinformatics and Computational Biology, 11(05):1342004, 2013.
- [29] U Abildgaard, M Lie, and OR Ødegård. Antithrombin (heparin cofactor) assay with “new” chromogenic substrates (s-2238 and chromozym th). Thrombosis research, 11(4):549–553, 1977.
- [30] H Pelzer, A Schwarz, and N Heimburger. Determination of human thrombin-antithrombin iii complex in plasma with an enzyme-linked immunosorbent assay. Thrombosis and haemostasis, 59(1):101–106, 1988.
- [31] RG Macfarlane and Rosemary Biggs. A thrombin generation test: the application in haemophilia and thrombocytopenia. Journal of Clinical Pathology, 6(1):3, 1953.
- [32] H Coenraad Hemker, Peter Giesen, Raed Al Dieri, Vé Regnault, Eric De Smedt, Rob Wagenvoord, Thomas Lecompte, and Suzette Béguin. Calibrated automated thrombin generation measurement in clotting plasma. Pathophysiology of Haemostasis and Thrombosis, 33(1):4–15, 2003.
- [33] Sabine Knappe, Susanne Till, Gabriele Gerstenbauer, Friedrich Scheiflinger, and Michael Dockal. The application of thrombin generation test is compromised by antithrombin iii deficiency. Blood, 126(23):4663–4663, 2015.
- [34] Russell Eberhart and James Kennedy. A new optimizer using particle swarm theory. In Micro Machine and Human Science, 1995. MHS’95., Proceedings of the Sixth International Symposium on, pages 39–43. IEEE, 1995.
- [35] Geoffrey A Allen, Alisa S Wolberg, Julie A Oliver, Maureane Hoffman, Harold R Roberts, and Dougald M Monroe. Impact of procoagulant concentration on rate, peak and total thrombin generation in a model system. Journal of Thrombosis and Haemostasis, 2(3):402–413, 2004.
- [36] M Anand, K Rajagopal, and KR Rajagopal. A model for the formation, growth, and lysis of clots in quiescent plasma. a comparison between the effects of antithrombin iii deficiency and protein c deficiency. Journal of theoretical biology, 253(4):725–738, 2008.
- [37] SV Mallett and DJA Cox. Thrombelastography. British journal of anaesthesia, 69(3):307–313, 1992.
- [38] SV Mallett and DJA Cox. Haemostasis and thrombelastography: a cautious note. British journal of anaesthesia, 70(6):699–700, 1993.
- [39] Yoogoo Kang. Thromboelastography in liver transplantation. In Seminars in thrombosis and hemostasis, volume 21, pages 034–044. Thieme Medical Publishers, 1995.
- [40] Thomas Peach, Katerina Spranger, and Yiannis Ventikos. Virtual flow-diverter treatment planning: The effect of device placement on bifurcation aneurysm haemodynamics. Proceedings of the Institution of Mechanical Engineers, Part H: Journal of Engineering in Medicine, page 0954411916673674, 2016.
- [41] Sumanas W Jordan, Matthew A Corriere, Carla Y Vossen, Frits R Rosendaal, and Elliot L Chaikof. Flow simulated thrombin generation profiles as a predictor of thrombotic risk among pre-menopausal women. Thrombosis and haemostasis, 108(2):258, 2012.
- [42] SW Jordan and EL Chaikof. Simulated surface-induced thrombin generation in a flow field. Biophysical Journal, 101(2):276–286, 2011.
- [43] Konstantinos P Papadopoulos, Manolis Gavaises, Ioannis Pantos, Demosthenes G Katritsis, and Nicholas Mitroglou. Derivation of flow related risk indices for stenosed left anterior descending coronary arteries with the use of computer simulations. Medical Engineering & Physics, 38(9):929–939, 2016.