The Signature of Flare Activity in Multifractal Measurements of Active Regions Observed by SDO/HMI
Abstract
Recent studies indicate that measurements of fractal and multifractal parameters of active regions (ARs) are not efficient tools to discriminate ARs on the basis of the flare activity, as well as to predict flare events. Attempting validation of this result on a large data set of higher spatial and temporal resolution, as well as higher flux sensitivity, observations than employed in previous studies, we analyzed high-cadence time series of line-of-sight magnetograms of 43 ARs characterized by different flare activity, which were observed with SDO/HMI from May 2010 to December 2013. On these data, we estimated four parameters, the generalized fractal dimensions and , and the multifractal parameters and . We found distinct average values of the parameters measured on ARs that have hosted flares of different class. However, the dispersion of values measured on ARs that have produced same class events is such that the parameters deduced from distinct classes of flaring regions can also largely overlap. Based on the results of our measurements, C- and M-class flaring ARs are practically indistinguishable, as well as M- and X-class flaring ARs. We found consistent changes on the time series of the measured parameters only on 50% of the studied ARs and 50% of the M- and X-class events considered. We show that these results hold for fractal and multifractal parameter estimates based on both total unsigned and signed flux data of the analyzed ARs.
keywords:
Flares, forecasting; Flares, relation to magnetic field; Magnetic fields, photosphere1 Introduction
Solar flares are among the most energetic events in the solar system. They occur in active regions (ARs), by involving processes at various heights in the solar atmosphere that are powered by the magnetic field (Shibata and Magara, 2011). Observations show that the photospheric topology of magnetic field is one of the key factors in determining the evolution of ARs. There is a general trend for large regions to produce large flares, and for more complex regions to generate more numerous and larger flares than other regions of comparable size (\openciteSammis_etal2000). Emergence of a bipolar region that interacts with preexisting magnetic field in the corona, and activation of a filament with destabilization in the subsisting magnetic region, are known as precursors events preceding the onset of flares. However, the precise conditions required to create the enormously energetic (up to 1032 erg on the timescale of hours) flare events are as yet unknown (\inlineciteLeka_Barnes_2013, and references therein). Because interplanetary disturbances associated with solar flares can impact space- and ground-based infrastructures, identification of precursor conditions leading to solar flares is getting a growing interest for practical applications of space weather forecast (\openciteHapgood_2012).
Any measurement of magnetic energy and complexity in an AR deserves interest for testing its sensitivity to single out the flare activity of the region for space weather forecasts. However, among the various measurements, those concerning multifractal properties of the region in the photosphere have the potential of providing information about the interaction between magnetic field and plasma motions that may lead to flare events. Indeed, these parameters are thought to describe AR properties that can be consequence of a self-organized evolution (see discussion by e.g. \openciteGeorgoulis_2012).
Several studies in the literature indicate that measurements of fractal and multifractal properties of ARs may help assessing the eruptive potential of the regions and also predicting their flare activity (for a list of studies carried out during the last decade see e.g. \inlineciteErmolli_etal2013, hereafter Paper I). Nevertheless, the literature also shows conflicting conclusions on the efficiency of these measurements to discriminate flaring ARs. For example, \inlineciteMcateer_etal2005 reported no discernible differences between the fractal dimension distributions of different Mount Wilson classes of ARs that were studied on Solar and Heliospheric Observatory (SOHO)/Michelson-Doppler Imager (MDI; \openciteScherrer_etal1995) line-of-sight (LOS) magnetograms. However, they also showed that there is a good correlation between the increased flare productivity of ARs, in terms of both flare size and frequency, and increased fractal dimension measured in the ARs. Besides, they identified a lower threshold fractal dimension value which an AR must possess in order to have the potential to produce an M-class (X-class) flare. More recently, \inlineciteGeorgoulis_2012 reported that none of the widely-used multifractal parameters measured in his study on a large data set of SOHO/MDI LOS magnetograms allows to distinguish AR with major flares from flare-quiet ones, though both classes of solar regions show significant fractality and multifractality. Then, from analysis of higher resolution observations than employed in the previous study, \inlineciteGeorgoulis_2013 also found that the multiscale parameters measured on Solar Dynamics Observatory (SDO)/Heliospheric and Magnetic Imager (HMI; \openciteScherrer_etal2012; \openciteSchou_etal2012; \openciteWachter_etal2012) LOS magnetograms of an intensely eruptive AR and of a flare-quiet AR have fairly similar values and temporal evolutions.
Recent results from an analysis of near-simultaneous observations of a flaring AR by SOHO/MDI and SDO/HMI (Paper I) suggested us to further investigate the response of the fractal and multifractal parameters to the flare activity of ARs. In particular, Paper I shows that the measurements derived from SOHO/MDI observations are affected by larger and spurious variations over time than those deduced from analysis of the higher-quality SDO/HMI data. Therefore, analysis of higher quality observations of a larger sample of ARs than analyzed by \inlineciteGeorgoulis_2013 may produce measurements of the multifractal parameters characterized by a significantly reduced dispersion than derived by \inlineciteGeorgoulis_2012. The study presented herein investigates the possibility that a reduced dispersion of multifractal parameters measured on SDO/HMI observations of ARs may help discriminating flaring from flare-quiet regions. To this purpose, we analyzed time series of magnetograms of 43 ARs with different flare activity that were observed with SDO/HMI from May 2010 to December 2013. We also noticed that almost all the studies of multifractal properties in flaring ARs were carried out on the total unsigned flux measurement of the regions, which is considered a standard-flare forecasting tool (\openciteBarnes_Leka_2008). To the knowledge of these authors, only \inlineciteGeorgoulis_2005 reported that discriminating between the two polarities in the studied ARs do not alter the results derived from analysis of total unsigned flux measurements of ARs. New observational evidences on the physical mechanisms driving the evolution of magnetic field in more flaring ARs, concerning e.g. the photospheric magnetic flux change and cancellation (\openciteBurtseva_etal2013; \openciteCliver_etal2012) and the fragmentation of magnetic helicity patches (\openciteRomano_etal2011), suggested us to study multifractal parameters inside ARs, by taking into account the evolution of magnetic regions with different polarities, thus using signed magnetic flux measurements for multifractal parameters estimates rather than total unsigned flux data. It has been also shown that the regions with different polarity in an AR have distinct morphology (see e.g. \openciteYamamoto_2012) and dynamical behavior (\openciteGiannattasio_etal2013). Therefore, we also tested the response of measurements of multifractal parameters based on signed flux measurements to the flare activity of the ARs.
The paper is organized as follows. The data sets and analysis methods employed in our study are described in Section 2. Our main findings are presented in Section 3, whereas the conclusions of this study are summarized in Section 4.
2 Data and Methods
s2
| AR | B | C | M | X | FI | FI max | date | time (UT) | Hem |
|---|---|---|---|---|---|---|---|---|---|
| 11072 | 6 | 0 | 0 | 0 | 1.3 | 0.7 | 2010 05 23 | 00:24 | S |
| 11117 | 55 | 5 | 0 | 0 | 28.1 | 5.7 | 2010 10 25 | 19:24 | N |
| 11143 | 2 | 0 | 0 | 0 | 0.6 | 0.4 | 2011 01 08 | 22:24 | S |
| 11146 | 2 | 0 | 0 | 0 | 0.4 | 0.2 | 2011 01 14 | 14:48 | N |
| 11158 | 6 | 54 | 7 | 1 | 615.6 | 220.0 | 2011 02 13 | 23:59 | S |
| 11166 | 7 | 25 | 4 | 1 | 303.6 | 150.0 | 2011 03 08 | 20:24 | N |
| 11283 | 10 | 16 | 5 | 2 | 602.7 | 210.0 | 2011 09 05 | 20:24 | N |
| 11318 | 0 | 1 | 0 | 0 | 1.4 | 1.4 | 2011 10 12 | 17:24 | N |
| 11429 | 3 | 47 | 15 | 3 | 1342.6 | 540.0 | 2012 03 08 | 22:48 | N |
| 11504 | 8 | 42 | 5 | 0 | 178.9 | 19.0 | 2012 06 15 | 00:24 | S |
| 11513 | 8 | 25 | 7 | 0 | 205.7 | 28.0 | 2012 07 02 | 04:24 | N |
| 11515 | 5 | 77 | 24 | 0 | 1064.1 | 69.0 | 2012 07 02 | 23:24 | S |
| 11520 | 1 | 32 | 8 | 1 | 444.3 | 140.0 | 2012 07 12 | 11:36 | S |
| 11536 | 2 | 20 | 4 | 0 | 166.3 | 61.0 | 2012 08 01 | 11:24 | S |
| 11613 | 1 | 21 | 5 | 0 | 184.9 | 60.0 | 2012 11 16 | 01:36 | S |
| 11618 | 5 | 23 | 5 | 0 | 152.8 | 35.0 | 2012 11 21 | 17:00 | N |
| 11640 | 7 | 6 | 0 | 0 | 15.9 | 4.0 | 2013 01 01 | 05:24 | N |
| 11652 | 3 | 23 | 3 | 0 | 96.9 | 17.0 | 2013 01 11 | 23:24 | N |
| 11660 | 13 | 3 | 0 | 0 | 16.4 | 5.8 | 2013 01 20 | 17:24 | N |
| 11663 | 5 | 1 | 0 | 0 | 2.8 | 1.1 | 2013 01 30 | 04:36 | S |
| 11667 | 19 | 6 | 0 | 0 | 34.8 | 8.7 | 2013 02 07 | 08:24 | N |
| 11670 | 13 | 3 | 0 | 0 | 10.2 | 1.5 | 2013 02 09 | 21:00 | N |
| 11675 | 9 | 5 | 1 | 0 | 31.6 | 19.0 | 2013 02 19 | 06:24 | N |
| 11689 | 5 | 3 | 0 | 0 | 7.2 | 2.2 | 2013 03 10 | 08:48 | S |
| 11691 | 8 | 1 | 0 | 0 | 6.8 | 2.1 | 2013 03 12 | 08:12 | N |
| 11692 | 15 | 14 | 2 | 0 | 64.1 | 16.0 | 2013 03 15 | 22:00 | N |
| 11696 | 6 | 7 | 0 | 0 | 12.2 | 1.4 | 2013 03 14 | 12:36 | N |
| 11708 | 10 | 2 | 0 | 0 | 8.4 | 2.7 | 2013 04 03 | 00:24 | N |
| 11719 | 10 | 16 | 2 | 0 | 125.3 | 65.0 | 2013 04 12 | 08:36 | N |
| 11726 | 16 | 72 | 1 | 0 | 194.5 | 10.0 | 2013 04 20 | 14:24 | N |
| 11731 | 1 | 35 | 3 | 0 | 115.0 | 14.0 | 2013 04 30 | 21:36 | N |
| 11734 | 2 | 27 | 0 | 0 | 51.0 | 3.4 | 2013 05 05 | 01:36 | S |
| 11739 | 2 | 28 | 2 | 0 | 149.8 | 57.0 | 2013 05 09 | 04:24 | N |
| 11756 | 5 | 15 | 0 | 0 | 34.6 | 3.9 | 2013 05 25 | 21:24 | S |
| 11778 | 3 | 11 | 1 | 0 | 65.1 | 29.0 | 2013 06 28 | 22:36 | S |
| 11863 | 1 | 0 | 0 | 0 | 0.0 | 0.0 | 2013 10 10 | 14:48 | S |
| 11868 | 0 | 2 | 0 | 0 | 4.9 | 2.9 | 2013 10 18 | 02:36 | N |
| 11875 | 1 | 66 | 11 | 2 | 829.8 | 230.0 | 2013 10 23 | 09:24 | N |
| 11882 | 0 | 10 | 13 | 2 | 695.6 | 210.0 | 2013 10 30 | 10:24 | S |
| 11890 | 2 | 51 | 5 | 3 | 840.2 | 330.0 | 2013 11 08 | 18:00 | S |
| 11896 | 0 | 1 | 0 | 0 | 1.9 | 1.9 | 2013 11 16 | 20:24 | N |
| 11918 | 0 | 4 | 0 | 0 | 7.3 | 2.2 | 2013 12 14 | 18:24 | S |
| 11923 | 1 | 0 | 0 | 0 | 0.0 | 0.0 | 2013 12 12 | 22:24 | N |
We analyzed 43 ARs characterized by different flare activity that were observed by SDO/HMI from May 2010 to December 2013. Table \ireftbl:0 lists the ARs in our sample, by providing information about the flare events hosted by the region and its flaring level. The latter is described by the flare index (FI; \openciteLI_etal2004), which was computed assuming the flare history of the region depicted by the NOAA’s GOES X-ray archive during the disc transit of the region, as well as by considering the most intense event hosted by the region (hereafter referred to as maximum FI, FI max). FI max is employed in the following to discriminate the analyzed ARs depending on their flaring activity. In particular, the X-, M-, and B or C-class flaring ARs discussed below correspond to the regions whose FI max100, 10FI max100, and FI max10, respectively.
The AR sample analyzed in our study contains 22 regions that have hosted M-class flares and 21 regions that have produced from a single B-class to a few B- or C-class events. The analyzed ARs include all the regions observed from February 2011 to December 2013 that have produced either M- or X-class flares, with the disc position specified in the following, and 17 ARs that were either flare-quiet (FI max1) or less flaring (10FI max100) than the flaring regions, observed over the time interval and disc position of the flaring ARs. The sample also contains 4 flare-quiet ARs observed from May 2010 to January 2011, which were considered for comparison with results of earlier studies.
According to the data and methods applied in Paper I, the selected ARs were analyzed using the time series of SDO/HMI Level 1.5 LOS full-disc magnetograms when the AR longitudinal distance was within of the central meridian. The whole data set consists of 20571 magnetograms, each of 4096 4096 pixels, with a pixel size of 0.505 arcsec and cadence of 720 s. The spatial resolution is set by the instrument aperture to 1 arcsec. The data set was processed as described in Paper I. The main steps are summarized below, following the description given in the original paper.
From each magnetogram, we extracted a sub-array centered on the AR baricenter, whose size slightly exceeds 512512 pixels. On these data, according to results presented in Paper I and other studies in the literature (e.g. \openciteGeorgoulis_2012), geometrical projection effects were not compensated for. Indeed, Paper I shows that additional de-projection correction only slightly alter the fractal and multifractal values obtained for the AR, with differences of measurement results that are well within uncertainties of values. However, it is worth noting that the geometrical de-projection of the data does not allow one to recover the loss of spatial resolution due to the increasing solar area subtended by the resolution element of the recording device when one moves from the disc center to the limb. This resolution loss cannot be compensated for when estimating the fractal and multifractal parameters, but it can be minimized with restriction of the AR positions analyzed. These considerations motivate the restriction of our analysis to un-projected ARs with longitudinal distance within of the central meridian.
On each sub-array, we computed the four parameters describing the fractal and multifractal properties of the photospheric magnetic field: the generalized fractal dimension and , and the multifractal Contribution Diversity and Dimensional Diversity . These parameters are extensively described by e.g. \inlineciteMcateer_etal2005, \inlineciteCriscuoli_etal2009, \inlineciteGeorgoulis_2012, and in Paper I. We investigated the variation of these parameters with respect to the flare activity of the analyzed ARs, by considering results derived from both the unsigned and signed flux measurements of the photospheric magnetic field in the observations. The parameters were computed on the region of interest derived from application of a threshold in the line-of-sight field component in each sub-array. According to results in Paper I, the threshold values employed are 3 times the standard deviation of quiet sun measurements in the data, specifically 20 G (gauss). All the sub-arrays employed in our study are unaffected by flux saturation.
The accuracy of the methods and algorithms employed in our study, as well the effects on the measured values of using different thresholds for the analysis, are discussed in Paper I. The uncertainty associated with the measured values is equal to the 2-sigma uncertainty for the parameters derived as in Paper I. This uncertainty is shown in e.g. Figure \ireff8, for the results of the parameter measurements from unsigned flux data of the analyzed ARs.
3 Results
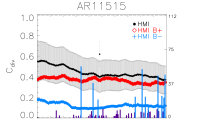
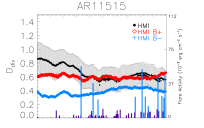
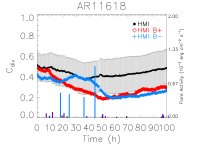
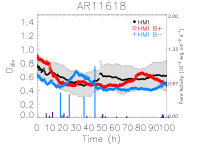
We focussed our attention on the time series of the various parameters measured on the analyzed ARs. Figures \ireff8 and \ireff9 show a sample of the analyzed data, which correspond to the time series of some among the most flaring ARs in the data set. We first studied the main features of these series, aiming at investigating the possibility that a reduced dispersion of the parameters measured on SDO/HMI observations may improve the efficiency of these measurements to discriminate flaring from flare-quiet regions with respect to previous reports in the literature. Section 3.1 presents the average values of the parameters derived from unsigned flux data of the analyzed ARs, in close analogy to previous results in the literature, whereas Section 3.2 shows the findings from the analysis of the signed flux data of the analyzed regions, aiming at singling out effects of flux discrimination on measurement results. Section 3.3 presents the main features of the temporal evolution of the parameters measured from both unsigned and signed flux data of the studied regions, aiming at highlighting any distinctive patterns in the time series that can be associated with the flaring activity.
3.1 Average Values of the Parameters from Unsigned Flux Data
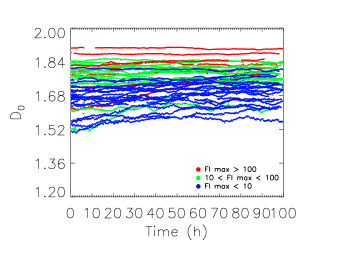
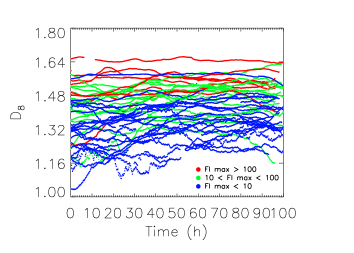
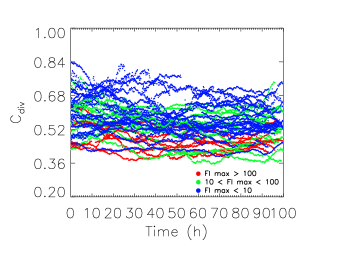
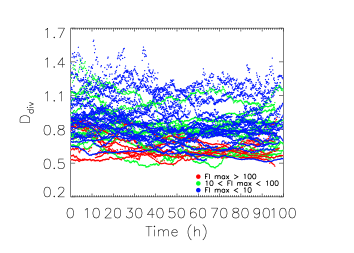
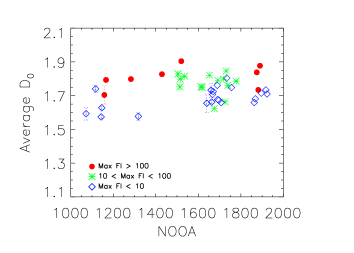
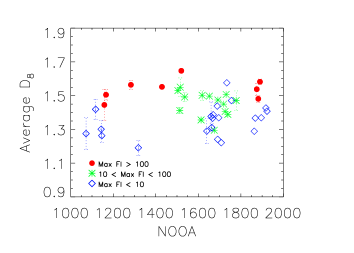
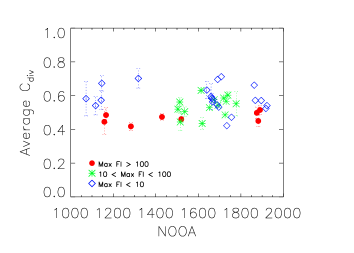
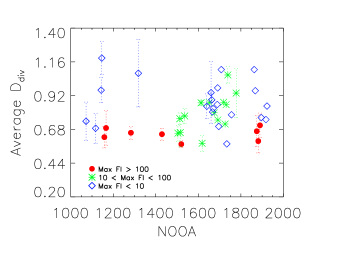
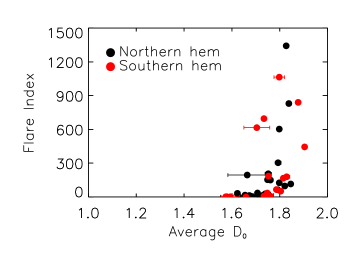
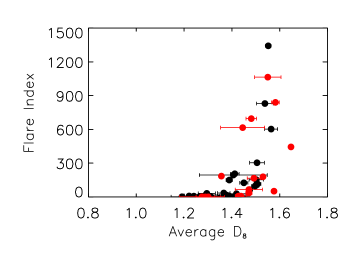
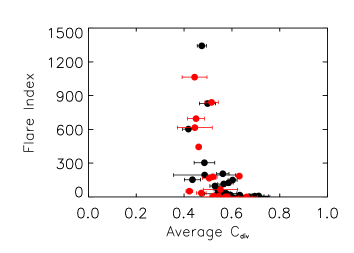
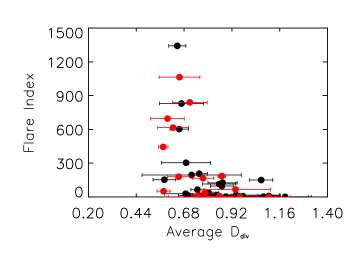
Figure \ireff5 shows the time series of fractal and multifractal parameters derived from total unsigned flux measurements of the analyzed ARs. In order to point out the dependence of measured values on the AR flaring activity, the results were divided into three groups, according to the three classes of flaring ARs introduced in Section 2. The three classes concern the ARs that have hosted B- or C-class, M-class, and X-class events.
Figure \ireff5 shows that the values measured on all ARs range between 1.50 and 1.90, in agreement with previous reports in the literature on a significant fractality of the morphology of the magnetic flux concentration in both flaring and flare-quiet ARs (see e.g. \inlineciteMcateer_etal2005, \inlineciteConlon_etal2008, \inlineciteCriscuoli_etal2009, and \inlineciteGeorgoulis_2012 for results of the fractal dimension estimate of ARs derived from the box-counting method and e.g. \inlineciteCriscuoli_etal2007 and references therein for the findings from other methods). Figure \ireff5 also shows that higher and values, as well as lower and , are estimated, on average, for the most flaring regions in the AR sample, than derived from the more quiet ARs. We found that the difference between the values derived from the extreme classes of flaring ARs in our sample is larger for the and values than for the and parameters, whose trends obtained from the three classes of analyzed ARs overlap more than for the fractal parameters.
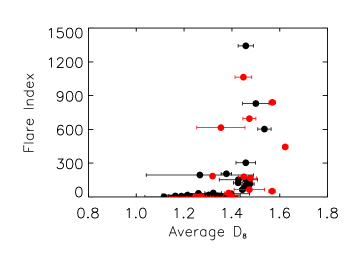
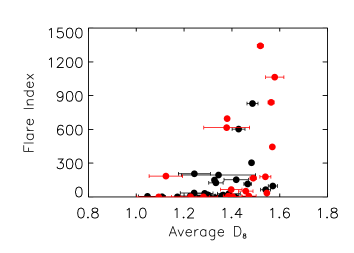
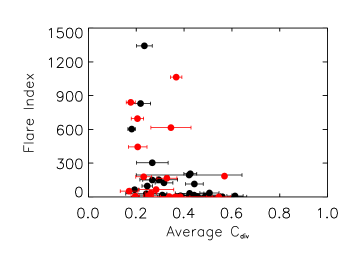
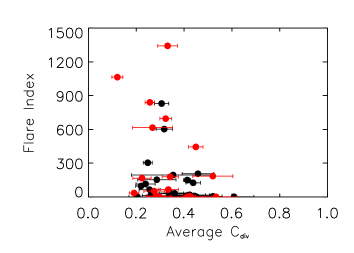
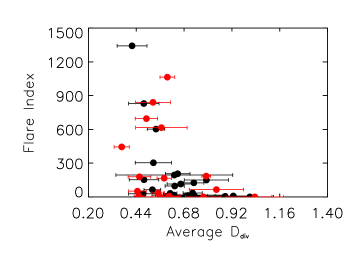
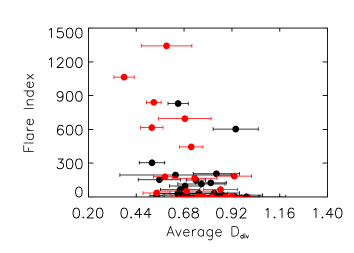
Figure \ireff6 shows the average of the parameters measured on each AR. We found that the parameters derived from the three classes of analyzed ARs are distributed between a lower and an upper limit, but a systematic difference between the trends obtained from distinct classes of flaring ARs seems also to occur. Indeed, Figure \ireff7 shows the relation between the average value of the parameters estimated for each AR in the sample and its FI. The measurements were divided according to the hemisphere hosting the AR, to test any hemispheric signature on them. In agreement with previous works (e.g. \openciteMcateer_etal2005; \openciteAbramenko_2005; \openciteCriscuoli_etal2009), we found that higher values of fractal and parameters, as well as a lower value of and , imply a higher flare activity of the ARs, in terms of their FI that account for the flare size and event frequency. The scatter of data does not support the assumption of a linear relation between the compared quantities, although a non-linear relation may hold between them. Figure \ireff7 shows that this result holds likewise for the ARs of both hemispheres.
| Parameter | flux data | B and C flaring | M flaring | X flaring | All regions |
|---|---|---|---|---|---|
| unsigned | 1.69 0.06 | 1.77 0.06 | 1.810.07 | 1.740.08 | |
| unsigned | 1.350.09 | 1.450.07 | 1.540.06 | 1.420.11 | |
| unsigned | 0.580.07 | 0.540.06 | 0.470.03 | 0.550.08 | |
| unsigned | 0.880.16 | 0.800.13 | 0.650.05 | 0.810.15 | |
| leading polarity | 1.510.08 | 1.610.07 | 1.610.04 | 1.570.10 | |
| leading polarity | 1.300.10 | 1.410.07 | 1.500.08 | 1.370.12 | |
| leading polarity | 0.400.13 | 0.340.10 | 0.230.05 | 0.350.12 | |
| leading polarity | 0.710.18 | 0.640.12 | 0.490.06 | 0.660.17 | |
| trailing polarity | 1.490.11 | 1.580.09 | 1.660.11 | 1.540.14 | |
| trailing polarity | 1.310.13 | 1.400.14 | 1.470.07 | 1.370.14 | |
| trailing polarity | 0.380.11 | 0.330.11 | 0.310.06 | 0.360.11 | |
| trailing polarity | 0.780.13 | 0.710.14 | 0.640.14 | 0.740.14 |
| Flare index | flux data | ||||
|---|---|---|---|---|---|
| FI | unsigned | 0.51 | 0.60 | -0.55 | -0.52 |
| FI | leading polarity | 0.39 | 0.51 | -0.39 | -0.45 |
| FI | trailing polarity | 0.48 | 0.46 | -0.33 | -0.49 |
| FI max | unsigned | 0.48 | 0.53 | -0.45 | -0.44 |
| FI max | leading polarity | 0.32 | 0.48 | -0.42 | -0.43 |
| FI max | trailing polarity | 0.47 | 0.38 | -0.20 | -0.35 |
The results shown in Figures \ireff5 to \ireff7 are quantified in Table \ireftbl:2, which summarizes the average and standard deviation of the parameters measured for each class of analyzed ARs. We found distinct average values of the parameters measured on ARs that have hosted flares of different class. However, the dispersion of values measured on ARs that have produced same class events is such that the parameters deduced from distinct classes of flaring regions can also largely overlap. Based on the results of our measurements, C- and M-class flaring ARs are practically indistinguishable, as well as M- and X-class flaring ARs. However, C- and X-class regions can be either discerned or not depending on the analyzed ARs. These findings give reasons to some conflicting conclusions presented in the literature on the efficiency of the fractal and multifractal measurements to discriminate flaring ARs. In fact, they confirm the statistical trend reported by \inlineciteMcateer_etal2005. They also show that depending on the analyzed ARs, the fractal and multifractal measurements derived from regions hosting distinct classes of events may have or may have not similar values, as reported from the analysis of two flaring and flare-quiet ARs by e.g. \inlineciteGeorgoulis_2013 and by considering the results from the most flaring and most flare-quiet ARs in the sample analyzed in this study, respectively.
Table \ireftbl:3 lists the linear Pearson correlation coefficients between the measured parameters and FI. The absolute values of the coefficients derived by taking into account the parameters deduced from unsigned flux data of the analyzed ARs range from 0.51 to 0.60, being 0.51 (), 0.60 (), -0.55 (), and -0.52 (). These values confirm the weakly significant relation among the compared quantities already reported in the literature.
3.2 Average Values of the Parameters from Signed Flux Data
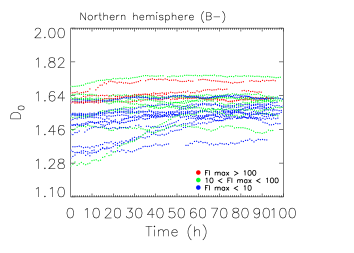
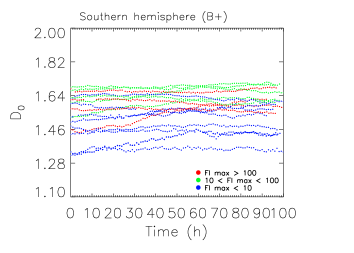
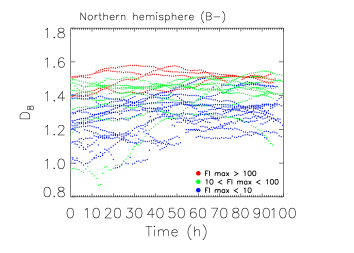
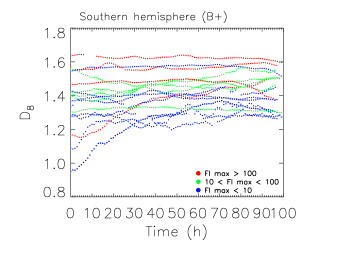
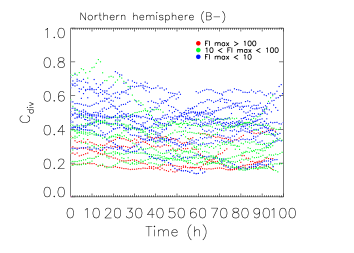
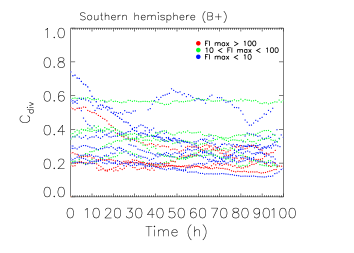
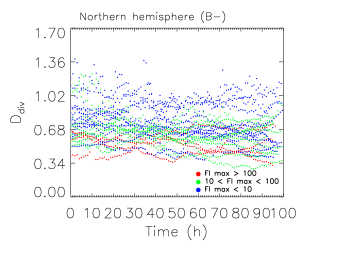
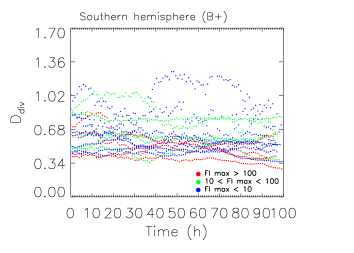
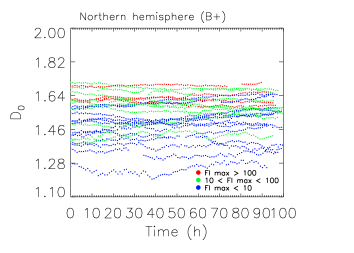
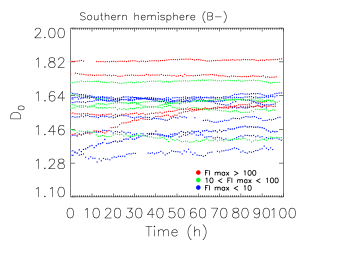
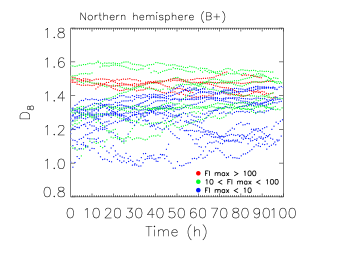
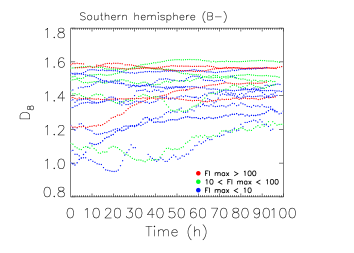
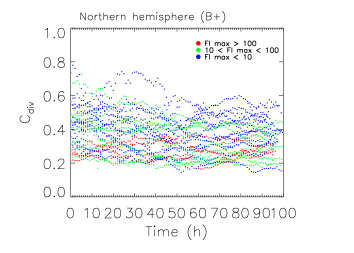
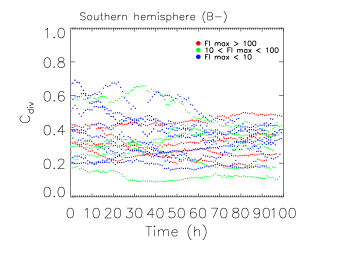
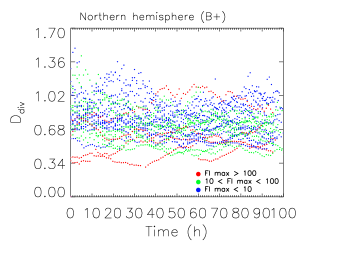
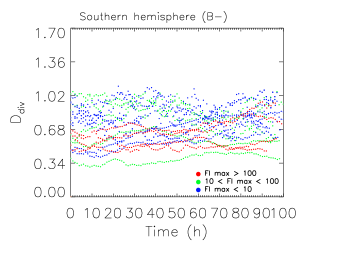
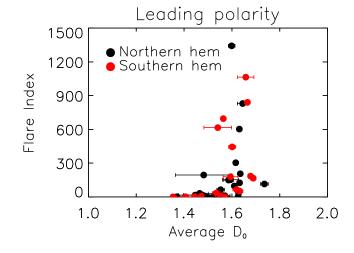
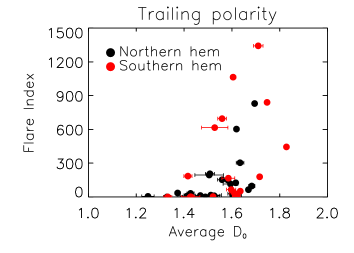
Figures \ireff5a and \ireff5b show the time series of fractal and multifractal parameters derived from signed flux measurements of the analyzed ARs. The regions were divided according to the three classes of flaring ARs mentioned above and depending on the hemisphere hosting the region, aiming at investigating potential signatures on the measurements of the leading and trailing flux polarities in the studied ARs, as well as of the hemisphere hosting the regions. In this respect, it is worth noting that all analyzed ARs follow the main polarity orientation in the hemisphere, but AR NOAA 11429 that showed opposite polarity orientation than the other regions in the northern hemisphere.
For each AR, we found that the fractal values estimated on unsigned flux data are higher than those obtained by taking into account signed flux measurements in the same region, whereas the fractal and multifractal and values derived from the region do not vary significantly with the flux data employed to estimate the parameter.
We ascribe the distinct results obtained for the fractal parameter by taking into account unsigned and signed flux data to the different morphological configuration of magnetic flux concentration in an AR, by considering the region as a whole and its leading and following polarities separately. Indeed, observations (see e.g. Section 1 of \openciteFan_2009) show that the flux of the leading polarity in an AR tends to be concentrated in large well-formed sunspots, whereas the flux of the following polarity tends to be more dispersed and to have a fragmented appearance. At any finite spatial resolution, the latter implies lower average flux values measured in the analyzed region than actual ones and thus a higher sensitivity of morphological measurements based on flux data to threshold selection effects. We found signatures in our measurements of these observational evidences in e.g. the lower average values of the parameters derived from signed flux data with respect to results from unsigned data, as well as of the values from the trailing polarity in the analyzed ARs, with respect to the values obtained from the data of the leading polarity flux in the ARs. The lower sensitivity of the fractal and multifractal and measurements on the flux data employed for the study than obtained from suggests us that measurements of the former parameters on signed flux data may benefit from analysis of higher resolution observations than employed in this study. In fact, the former parameters, by corresponding to a higher order estimates of the fractal dimension than , may require larger data set to allow similar statistical significance of results than obtained for .
Figure \ireff7b shows the relation between the average values of the parameters estimated by taking into account the signed flux data of each analyzed AR and its FI. The results in this Figure confirm the findings derived from the measurements of the parameters based on unsigned flux data of the analyzed ARs. In particular, they confirm both the weak relation between the compared quantities and lack of distinctive hemispheric signatures on the measurements.
Tables \ireftbl:2 and \ireftbl:3 quantify the results discussed above. In particular, the average and standard deviation of values measured by discriminating the flux data in the analyzed ARs reported in Table \ireftbl:2, as well as the Pearson correlation coefficients between the measured values and FI of the analyzed ARs listed in Table \ireftbl:3, confirm previous conclusions by \inlineciteGeorgoulis_2005 on that discriminating between the flux polarities in the ARs do not alter the results derived from analysis of total unsigned flux data of the regions. Indeed, in this study, the lower values obtained for the Pearson coefficients of the parameters based on signed flux data in the analyzed ARs show that discriminating between the flux polarities has even reduced the weak correlation between the compared quantities, with respect to results based on unsigned flux data of the ARs.
3.3 Temporal Evolution of the Parameters
We then focussed our attention on the temporal evolution of the various parameters measured on the whole sample of analyzed ARs, aiming at identifying any clear patterns on the parameter series that can be associated with the flare activity of the ARs. Here in the following the term variation indicates the deviation of measured values with respect to the average and long-term trends of the parameters. These trends were defined as specified in the following. The variation of measured values has been quantified by the variance of the distribution of measured values, as well as by the distinct patterns identified on the analyzed series.
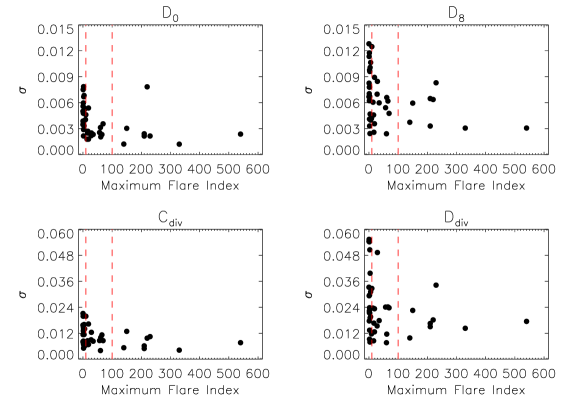
First, we studied the distribution of parameter values measured for each region during its transit over the solar disc and the dependence of the distribution variance on the flaring activity of the AR. In particular, we computed the distribution of parameter values measured for each region with respect to the average and longer-term trends of the parameters, which were obtained with a running average of values measured over 3 and 12 h time interval, respectively. We then estimated the width of the Gaussian function that best fits the measured distribution and assumed this width as an estimate of the distribution variance .
Figure \ireff10 shows the measured for each AR in the analyzed sample with respect to its FI max. We found that the distribution of values derived from the less flaring regions are characterized by a larger variance with respect to the ones obtained from the more flaring ARs. However, the variance of the values derived from all analyzed ARs does not show any clear dependence on the flaring activity of the regions, by disclaiming the idea that more flaring ARs may leave the signature of their activity in more varying time series of the measured parameters. This result holds likewise for the variance of the values measured with respect to both the average and longer-term trends of measured values.
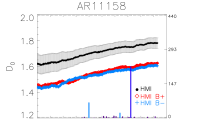
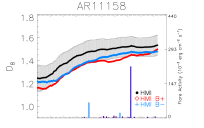
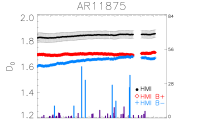
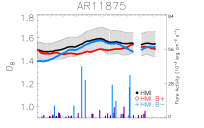
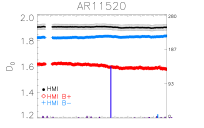
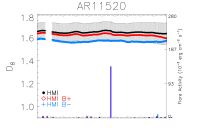
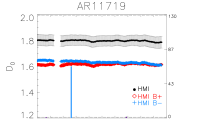
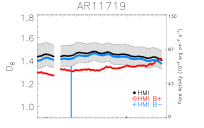
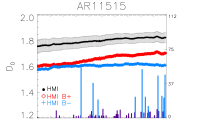
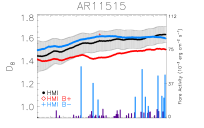
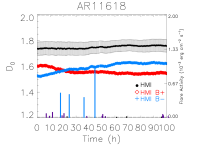
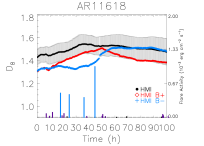
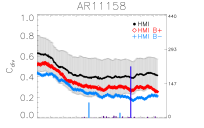
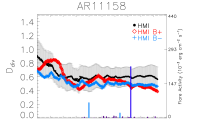
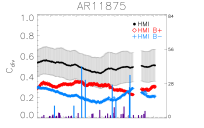
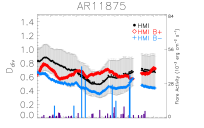
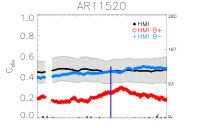
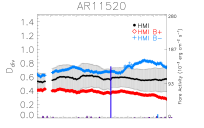
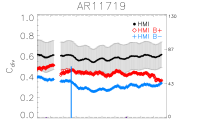
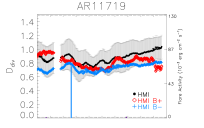
We then analyzed the time series derived from each AR and their main features. A sample of the analyzed data has been already shown in Figures \ireff8 and \ireff9. We found that the time series of the and fractal parameters measured on the whole sample of ARs show smaller and more regular variations during the analyzed time intervals than the corresponding trends of the and multifractal values. This holds for results derived from both unsigned and signed flux data in the studied ARs. We found that shows slightly larger changes than , as also does with respect to , and particularly when results obtained from signed flux data are taken into account. This result suggests us that measurements of these parameters on signed flux data may benefit from analysis of higher resolution data than employed in this study.
We also found that most of the studied series show different evolution during the analyzed time intervals depending on the flux data employed to estimate the parameters. In particular, we found that the time series of the parameters derived from a given field polarity are less consistent with those obtained from unsigned flux data on the same regions, which resulted to be rather representative of the parameter trends deduced from the opposite flux polarity in the ARs. Specifically, the most varying trends for all measured parameters were found to be the ones deduced from the trailing flux data of the analyzed ARs, i.e. the data of the flux concentration with higher fragmentation and thus also higher sensitivity of measurement results to the finite spatial resolution of the analyzed data. The trends of the parameter estimates based on the prevailing leader polarity in the hemisphere hosting the AR were found to be more consistent with those obtained from unsigned flux data. These features of the time series, specifically the similarity between the trends deduced from unsigned and leading polarity flux of the analyzed ARs and the deviation between the same trends and those from the trailing polarity flux, were found to hold for 90% of the studied regions. It is worth noting that the parameter time series of AR NOAA 11429, which is the only region in the analyzed data set that showed opposite polarity orientation than the other regions, do no follow the results derived from most of the data analyzed.
From analysis of the parameter series we also found that several flares occur during a decreasing phase of the and an increasing phase of the values estimated by considering unsigned and signed flux data of the leading polarity of the AR hemisphere. However, those features of the parameter trends were not found to be a consistent pre-flare signature on the whole sample of ARs and events. Indeed, this event signature was found on 50% of the analyzed ARs and on 50% of the M-class events considered. We also found that the trends obtained by considering the trailing polarity of the ARs show changes lasting few hours ( 10) and occurring both prior ( 15 h) and after major events, as shown in Figure \ireff9 for e.g. AR 11158 and AR 11875, where B- and B+ is the trailing polarity in the region, respectively. These changes in , whose amplitude ranges 0.20% to 0.25% of the parameter value independently of the event class, are compatible with a simplification of the photospheric magnetic field in flaring ARs through sudden changes of the trailing flux topology. However, they were found on 50% of the analyzed ARs and events.
4 Conclusion
The present study shows that the analysis of a large data set of higher spatial and temporal resolution, as well as higher flux sensitivity, observations than employed in previous studies does not give the fractal and multifractal parameter measurements a higher efficiency to discriminate ARs depending on their flaring activity than reported in the literature. The measurements derived from our study hint to a signature of the flare activity in the fractal and multifractal parameters of ARs and a potential differentiation depending on their flare activity, but this does not hold in general for all the analyzed ARs. In particular, we found distinct average values of the parameters measured on ARs that have hosted flares of different class, in agreement with the statistical trend reported by \inlineciteMcateer_etal2005. At a first glance, our findings contrast with results presented by e.g. \inlineciteGeorgoulis_2013. However, we also show that the dispersion of values deduced from each class of flaring AR considered in our study is such that results from extreme classes of flaring ARs can also overlap, as shown in e.g. Figure 8 of \inlineciteGeorgoulis_2013.
The results obtained by our study also show that the parameter estimates based on signed flux measurements do not constitute a better predictive tool of the flare activity than derived by using unsigned flux data as in previous studies. In particular, we found that the time series of the parameters obtained from unsigned flux data of the analyzed ARs are rather representative of those deduced from the signed flux measurements of the prevailing leader polarity in the hemisphere hosting the ARs. Both time series show that the flares occur during a decreasing phase of the and an increasing phase of the parameters on 50% of the analyzed ARs and on 50% of the M-class events considered. The times series of parameters deduced from signed flux data of the trailing polarity flux in the analyzed ARs are less consistent with those derived from unsigned flux data of the studied region. The former time series show changes of the evolution of the values lasting few hours and occurring both prior and after major events. These changes, which are compatible with a simplification of the magnetic field in the ARs, were found on 50% of the analyzed regions and events.
The results obtained in this study give reasons to the conflicting conclusions reported in the literature on the efficiency of the fractal and multifractal parameter measurements based on unsigned flux data of ARs to discriminate them depending on their flaring activity. They also extend the validity of the previous findings to results derived from signed flux measurements of the analyzed ARs. It remains to be shown whether other parameters describing the magnetic field evolution and morphological complexity based either on signed or other flux data of the analyzed regions prove to be more ideal tools for discriminating flaring ARs than those analyzed in this study.
Acknowledgements
The research leading to these results has received funding from the European Commission’s Seventh Framework Programme (FP7/2007-2013) under the grant agreements eHEROES (project n 284461, www.eheroes.eu) and SOLARNET (n 312495, www.solarnet-east.eu). This work was also supported by the Istituto Nazionale di Astrofisica (PRIN-INAF-2010). The authors acknowledge useful discussions from Giuseppe Consolini and Gherardo Valori.
References
- Abramenko (2005) Abramenko, V.I.: 2005, Multifractal analysis of solar magnetograms. Sol. Phys. 228, 29 – 42. doi:10.1007/s11207-005-3525-9.
- Barnes and Leka (2008) Barnes, G., Leka, K.D.: 2008, Evaluating the performance of solar flare forecasting methods. ApJ 688, L107 – L110. doi:10.1086/595550.
- Burtseva and Petrie (2013) Burtseva, O., Petrie, G.: 2013, Magnetic flux changes and cancellation associated with X-class and M-class flares. Sol. Phys. 283, 429 – 452. doi:10.1007/s11207-013-0241-8.
- Cliver, Petrie, and Ling (2012) Cliver, E.W., Petrie, G.J.D., Ling, A.G.: 2012, Abrupt changes of the photospheric magnetic field in active regions and the impulsive phase of solar flares. ApJ 756, 144. doi:10.1088/0004-637X/756/2/144.
- Conlon et al. (2008) Conlon, P.A., Gallagher, P.T., McAteer, R.T.J., Ireland, J., Young, C.A., Kestener, P., Hewett, R.J., Maguire, K.: 2008, Multifractal properties of evolving active regions. Sol. Phys. 248, 297 – 309. doi:10.1007/s11207-007-9074-7.
- Criscuoli et al. (2007) Criscuoli, S., Rast, M.P., Ermolli, I., Centrone, M.: 2007, On the reliability of the fractal dimension measure of solar magnetic features and on its variation with solar activity. A&A 461, 331 – 338.
- Criscuoli et al. (2009) Criscuoli, S., Romano, P., Giorgi, F., Zuccarello, F.: 2009, Magnetic evolution of superactive regions. Complexity and potentially unstable magnetic discontinuities. A&A 506, 1429 – 1436.
- Ermolli et al. (2014) Ermolli, I., Giorgi, F., Romano, P., Zuccarello, F., Criscuoli, S., Stangalini, M.: 2014, Fractal and multifractal properties of active regions as flare precursors: A case study based on SOHO/MDI and SDO/HMI observations. Sol. Phys. 289, 2525 – 2545. doi:10.1007/s11207-014-0500-3.
- Fan (2009) Fan, Y.: 2009, Magnetic fields in the solar convection zone. Living Rev. Solar Phys. 6(4). doi:10.12942/lrsp-2009-4.
- Georgoulis (2005) Georgoulis, M.K.: 2005, Turbulence in the solar atmosphere: Manifestations and diagnostics via solar image processing. Sol. Phys. 228, 5 – 27. doi:10.1007/s11207-005-2513-4.
- Georgoulis (2012) Georgoulis, M.K.: 2012, Are solar active regions with major flares more fractal, multifractal, or turbulent than others? Sol. Phys. 276, 161 – 181. doi:10.1007/s11207-010-9705-2.
- Georgoulis (2013) Georgoulis, M.K.: 2013, Toward an efficient prediction of solar flares: Which parameters, and how? Entropy 15, 5022 – 5052. doi:10.3390/e15115022.
- Giannattasio et al. (2013) Giannattasio, F., Stangalini, M., Del Moro, D., Berrilli, F.: 2013, On the asymmetry of velocity oscillation amplitude in bipolar active regions. A&A 550, A47. doi:10.1051/0004-6361/201220103.
- Hapgood (2012) Hapgood, M.: 2012, Astrophysics: Prepare for the coming space weather storm. Nature 484, 311 – 313. doi:10.1038/484311a.
- Leka and Barnes (2013) Leka, K.D., Barnes, G.: 2013, Solar flare forecasting: A ”state of the field” report for researchers. In: Bull. Am. Astron. Soc. 45, 100.82.
- Li et al. (2004) Li, Y., Luhmann, J., Fisher, G., Welsch, B.: 2004, Observational evidence for velocity convergence toward magnetic neutral lines as a factor in CME initiation. J. Atmos. Solar-Terr. Phys. 66, 1271 – 1282. doi:10.1016/j.jastp.2004.03.017.
- McAteer, Gallagher, and Ireland (2005) McAteer, R.T.J., Gallagher, P.T., Ireland, J.: 2005, Statistics of active region complexity: A large-scale fractal dimension survey. ApJ 631, 628 – 635. doi:10.1086/432412.
- Romano and Zuccarello (2011) Romano, P., Zuccarello, F.: 2011, Flare occurrence and the spatial distribution of the magnetic helicity flux. A&A 535, A1. doi:10.1051/0004-6361/201117594.
- Sammis, Tang, and Zirin (2000) Sammis, I., Tang, F., Zirin, H.: 2000, The dependence of large flare occurrence on the magnetic structure of sunspots. ApJ 540, 583 – 587. doi:10.1086/309303.
- Scherrer et al. (1995) Scherrer, P.H., Bogart, R.S., Bush, R.I., Hoeksema, J.T., Kosovichev, A.G., Schou, J., Rosenberg, W., Springer, L., Tarbell, T.D., Title, A., Wolfson, C.J., Zayer, I., MDI Engineering Team: 1995, The Solar Oscillations Investigation - Michelson Doppler Imager. Sol. Phys. 162, 129 – 188. doi:10.1007/BF00733429.
- Scherrer et al. (2012) Scherrer, P.H., Schou, J., Bush, R.I., Kosovichev, A.G., Bogart, R.S., Hoeksema, J.T., Liu, Y., Duvall, T.L., Zhao, J., Title, A.M., Schrijver, C.J., Tarbell, T.D., Tomczyk, S.: 2012, The Helioseismic and Magnetic Imager (HMI) investigation for the Solar Dynamics Observatory (SDO). Sol. Phys. 275, 207 – 227. doi:10.1007/s11207-011-9834-2.
- Schou et al. (2012) Schou, J., Scherrer, P.H., Bush, R.I., Wachter, R., Couvidat, S., Rabello-Soares, M.C., Bogart, R.S., Hoeksema, J.T., Liu, Y., Duvall, T.L., Akin, D.J., Allard, B.A., Miles, J.W., Rairden, R., Shine, R.A., Tarbell, T.D., Title, A.M., Wolfson, C.J., Elmore, D.F., Norton, A.A., Tomczyk, S.: 2012, Design and ground calibration of the Helioseismic and Magnetic Imager (HMI) instrument on the Solar Dynamics Observatory (SDO). Sol. Phys. 275, 229 – 259. doi:10.1007/s11207-011-9842-2.
- Wachter et al. (2012) Wachter, R., Schou, J., Rabello-Soares, M.C., Miles, J.W., Duvall, T.L., Bush, R.I.: 2012, Image quality of the Helioseismic and Magnetic Imager (HMI) onboard the Solar Dynamics Observatory (SDO). Sol. Phys. 275, 261 – 284. doi:10.1007/s11207-011-9709-6.
- Yamamoto (2012) Yamamoto, T.T.: 2012, The area asymmetry in bipolar magnetic fields. A&A 539, A13. doi:10.1051/0004-6361/201014951.