Double Coronal X-ray and Microwave Sources Associated With A Magnetic Breakout Solar Eruption
Abstract
Double coronal hard X-ray (HXR) sources are believed to be critical observational evidence of bi-directional energy release through magnetic reconnection in a large-scale current sheet in solar flares. Here we present a study on double coronal sources observed in both HXR and microwave regimes, revealing new characteristics distinct from earlier reports. This event is associated with a footpoint-occulted X1.3-class flare (25 April 2014, starting at 00:17 UT) and a coronal mass ejection that are likely triggered by the magnetic breakout process, with the lower source extending upward from the top of the partially-occulted flare loops and the upper source co-incident with rapidly squeezing-in side lobes (at a speed of 250 km s-1 on both sides). The upper source can be identified at energies as high as 70-100 keV. The X-ray upper source is characterized by flux curves different from the lower source, a weak energy dependence of projected centroid altitude above 20 keV, a shorter duration and a HXR photon spectrum slightly-harder than those of the lower source. In addition, the microwave emission at 34 GHz also exhibits a similar double source structure and the microwave spectra at both sources are in line with gyro-synchrotron emission given by non-thermal energetic electrons. These observations, especially the co-incidence of the very-fast squeezing-in motion of side lobes and the upper source, indicate that the upper source is associated with (possibly caused by) this fast motion of arcades. This sheds new lights on the origin of the corona double-source structure observed in both HXRs and microwaves.
1 Introduction
During solar flares, a significant amount of magnetic energy is released to accelerate electrons (and other particles) through magnetic reconnection in the corona. The accelerated electrons stream down and bombard the lower chromospheric atmosphere to emit hard X-rays (HXRs), as imaged by instruments such as the Ramaty High Energy Solar Spectroscopic Imager (RHESSI; Lin et al. 2002), while the intrinsic acceleration site in the corona remains much more difficult to detect due to its relatively faint emissivity and the limited dynamic range of the instrument (see the reviews by Krucker et al. 2008, Fletcher et al. 2011, White et al. 2011). Despite these limitations, major steps toward a full understanding of coronal sources have been achieved.
Masuda et al. (1994) discovered with the Yohkoh satellite a HXR coronal source at energy level of 3353 keV, located above the soft X-rays (SXRs) loop top source. This and followup studies (e.g., Tomczak 2001; Petrosian et al. 2002) found that the coronal X-ray sources at higher energies appear at higher altitudes. This has been interpreted with the standard picture of solar flares (e.g., Priest & Forbes 2002), in which higher flare loops are filled with newly reconnected and heated plasmas and energetic electrons of harder spectra, while lower loops are cooler of previously heated plasmas with energetic electrons of softer spectra. The Masuda-type above-the-SXR-loop-top HXR source (or simply referred to as the above-the-loop-top source) is regarded as the extreme of this trend (see, e.g., Liu et al. 2013).
Sui & Holman (2003) discovered a second HXR coronal source lying above the loop-top source. The combination of the two coronal sources, when present simultaneously, are referred to as the double-source structure. They and a series of following studies (e.g., Sui et al. 2004; Veronig et al. 2006; Liu et al. 2008; 2013; Chen & Petrosian 2012) found some peculiar characteristics of this structure, such as energy-dependent centroid locations with the sources getting closer at higher energies (or temperatures), similar temporal variations of HXR fluxes, and close energy spectral indices of the two sources. These observations have been taken as major evidence supporting the existence of a reconnecting current sheet (lying in between the two sources) that acts as the expected bidirectional energy release site of solar flares.
It should be noted that clear observational examples of double coronal X-ray sources are rare and usually require limb occultation of bright footpoint sources, due to the relative faintness of coronal sources and the limited dynamic range of present HXR imaging instruments. These occulted events provide a major source of our knowledge on coronal sources (see the review on this topic by Krucker et al., 2008).
Solar flares are closely related to coronal mass ejections (CMEs). One leading theory of the CME initiation is the so-called magnetic breakout (Antiochos et al. 1999, Antiochos 1998), through which the coronal confinement restraining the eruption can be released via the breakout reconnection occurring high in the corona, within a multi-polar magnetic configuration. The breakout reconnection sets in between two sets of constraining field lines, including the large-scale overlying field lines of the coronal background and the lower arcade of loops that is immediately above the energized core flux system. The core flux consists of a set of sheared or twisted field lines, representative of the magnetic driver or energy source of the eruption. The breakout process can be separated into four evolutionary stages according to previous numerical simulations (e.g., Lynch et al. 2004, 2008, 2009; MacNeice et al. 2004; Devore & Antiochos 2008; Karpen et al. 2012): the initial energy storage process occurring within the central core flux, the breakout reconnection process as just elaborated, the impulsive eruption process during which the flare starts impulsively and the core flux takes off and expands outward while pushing aside nearby side lobes, and the restoration stage which involves the so-called anti-breakout reconnection in the aftermath of the CME evacuation (e.g., Lynch et al., 2008). The anti-breakout reconnection sets in between side lobes to restore the pre-eruption magnetic breakout configuration, after the central arcade is restored through the primary flaring reconnection.
Observational tests of the breakout model have been published by many authors (e.g., Aulanier et al. 2000; Gary & Moore 2004; Harra et al. 2005; Mandrini et al. 2006; Aurass et al 2011, 2013; Shen et al. 2012; Sun et al. 2013). Most studies focus on disk events so as to examine the magnetic configuration. Chen et al. (2016) present a breakout event observed from a novel limb perspective (on April 25 2014, the same event investigated here), revealing many features analogous to simulations. In their study, the presence of breakout reconnection is supported by the overall remarkably-analogous-to-simulation configuration as viewed from the hot passbands (131 and 94 Å) of the Atmospheric Imaging Assembly (AIA; Lemen et al. 2012) on board the Solar Dynamics Observatory (SDO; Pesnell et al. 2012). New clues are also found, such as the presence of heated and slowly-evolving X-shaped morphology with pairs of cusp-like structures, the sequential brightening of loops around this X feature, among other details.
Of particular interest here is the presence of double coronal HXR sources during the impulsive stage of the event. The double sources exhibit as the simultaneous presence of two coronal sources, one lower and one upper, in X-ray images from RHESSI. The lower source is a typical one that is immediately above the partially-occulted flaring loops while the upper source is co-incident with the re-approaching side lobes upon the rapid evacuation of the ejecta. Note that the pre-eruption breakout reconnection is not accompanied by any considerable enhancement of X-ray and microwave emission, indicating insufficient energetic electrons accelerated during that earlier process. The upper X-ray source, of major interest here, is observed during the impulsive stage above the site of the earlier breakout reconnection. Chen et al. (2016) presented a preliminary analysis and found that the upper source reaches an energy level of 70-100 keV. To further explore its nature, in this study we examine the spatially-resolved X-ray imaging spectra, the energy dependence of the source centroid separation, flux variation, as well as the simultaneous microwave sources recorded by the Nobeyama Radioheliogram (NoRH; Nakajima et al. 1994; Takano et al. 1997) at 17 and 34 GHz.
2 Event Overview
The complete evolutionary process of the breakout event has been described in Chen et al. (2016). The event was originated from NOAA AR 12035 on the backside of the Sun (the southwestern quadrant) with the accompanying flare starting at 00:17 UT on 25 April 2014. The eruption is observed by the Solar TErrestrial RElations Observatory (STEREO; Kaiser et al. 2008) B also as a backside event and STEREO-A as a disk event on the southeastern quadrant, with a 5-minute cadence at 195 Å and a 10-minute cadence at 304 Å. According to STEREO-A, the center of the flare ribbons is located at S20E60, 7∘ behind the limb from the SDO-Earth perspective, corresponding to an occultation height of 5 Mm (7”). Thus, a significant part of the flare emission is occulted by the limb. This is why we can observe the faint coronal emission with RHESSI in spite of its limited dynamic range. Note that the STEREO images are largely saturated with large bright regions over the AR during the impulsive stage of the X-1.3 flare of study. Thus, although these data are valuable at inferring the overall morphology of the eruption from different perspectives, like the occultation height as described above, they are not helpful to our study on the origin of HXR emission that lasts only a few minutes.
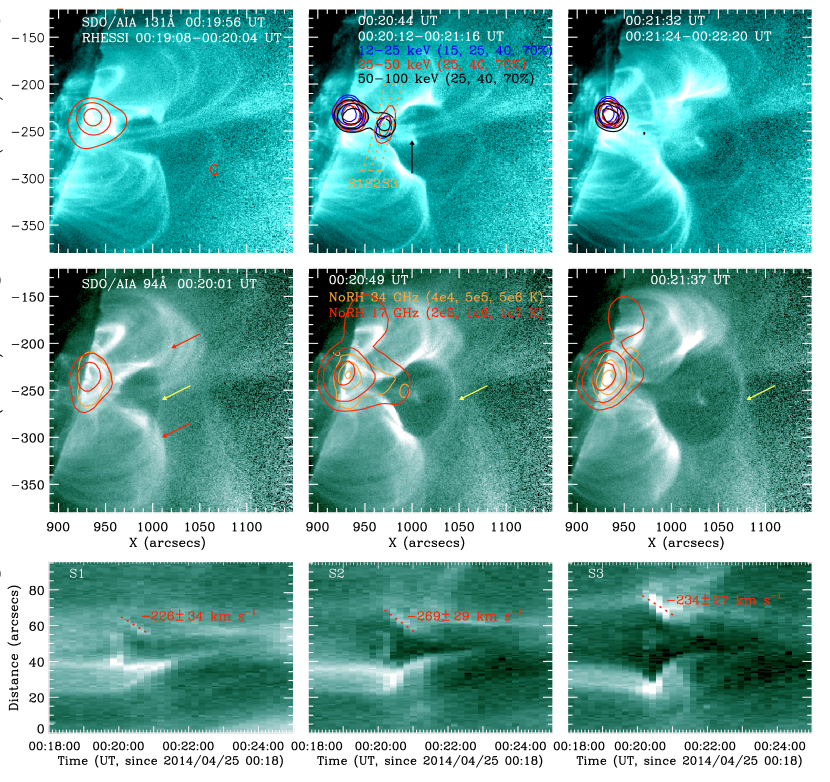
In Figure 1, we show the AIA images in its hot passbands of 131 and 94 Å during the impulsive stage. According to Chen et al. (2016), the pre-impulsive stage of the event is characterized by an at-least 40-minute-long breakout reconnection process occurring across an X-shape structure at a height of 70” above the solar limb. The subsequent outward eruption of the core flux (black arrow) transforms the reconnecting structure into an extended-curved transverse structure of a high temperature (yellow arrows), presumably a current sheet. During this impulsive stage, the two side lobes (red arrows) are pushed aside. Around 00:20 UT when the bright CME core rises to a height of 50”, the side lobes start to move towards each other. This forms a spearhead-like morphology in the distance-time maps along the three slices (S1-S3, see Figure 1c) that capture the dynamics of the lobe-approaching region. The speeds of the loop at the upper side along the slices vary from 220-270 km s-1, comparable with those measured at the lower side. This gives an approaching (or squeezing-in) speed of loops about twice the above value.
Note that approaching coronal structures during a solar flare are frequently observed. Measurements of their speeds have been used to infer the reconnection inflow speed. For example, Lin et al. (2005) deduced that the average reconnection inflow velocities near the presumed current sheet over different time intervals ranged from 10.5 to 106 km s-1, Hara et al. (2011) deduced a flow into the presumed reconnection region (the loop top) with a Doppler velocity of 20 km s-1, and Su et al. (2013) obtained apparent inflow velocities of 50 km s-1 from the south and 20 km s-1 from the north side of the reconnection site. These values are considerably less than those measured here. This rapid squeezing-in motion even results in an inverted-pear like shape of the rear of the ejecta and a second clear X-shaped structure high in the corona (40”50” above the limb). This newly-formed X-shaped structure, considerably lower than the earlier X structure of the pre-flare triggering breakout reconnection, is coincident and co-spatial with the upper HXR coronal source (the focus of this study).
3 HXR and microwave data analysis on the breakout double-source event
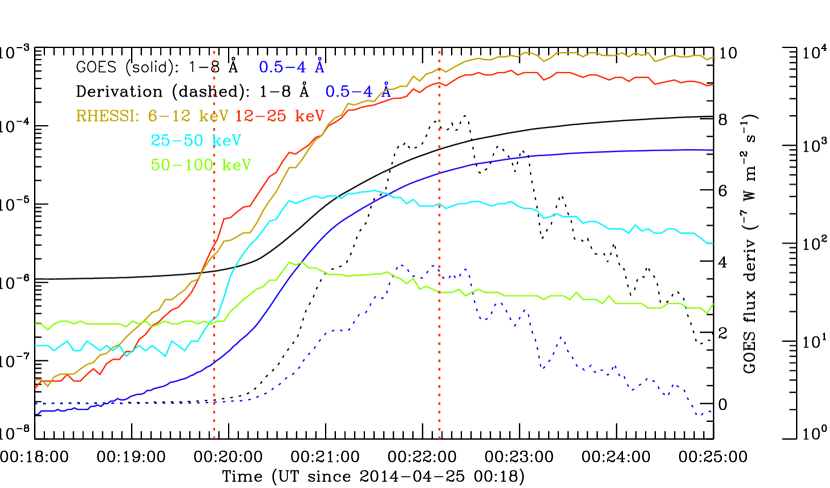
The new X-shape morphology and rapid squeezing-in motion are observed during the impulsive stage, lasting for 2 minutes. After 00:22 UT, both features disappear from the AIA images. During this 2-minute interval, RHESSI recorded a HXR double-source structure. Before examining the spatially-resolved HXR images, we first check the integrated light curves at different energy bands as shown in Figure 2. It can be seen that the 6-12 and 12-25 keV curves rise gradually from the start of the plot (00:18 UT), basically following the rising trend of the two GOES SXR curves, while inconsistent with their derivatives. This suggests that these low-energy fluxes are dominated by thermal emission. On the other hand, the high energy curves (25-50 and 50-100 keV) present impulsive increases just before 00:20 UT, neither following the GOES curves nor their derivatives. This fact, being inconsistent with the well-known Neupert effect (Neupert 1968), may be attributed to the occultation of the footpoint HXR emissions that are the cause of heating the SXR-emitting flare loops, while here the coronal HXR sources have no contribution to the earlier rising SXR emission. Note that the above phenomenon is also reported by Effenberger et al. (2016) in their independent study of the same event.
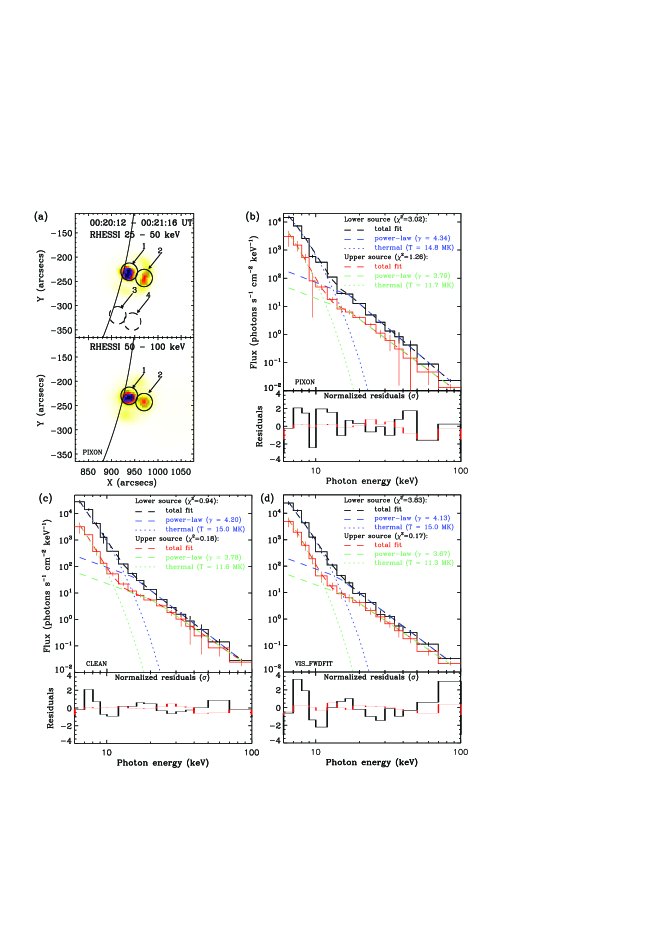
In Figure 1a, we overplotted the flux contours of the spatially-resolved HXR data. We see that, as briefly discussed by Chen et al. (2016), the upper source reaches an energy level of 70-100 keV, and the lower sources concentrate around 10” above the limb, while the upper sources are around 50”. The two sources are spatially separated by 40”. The lower source extends upward from the flare loop top, and the upper source is co-spatial with the above-described X morphology. As seen from Figure 3, before 00:21:24 UT, the centroid distances of the lower source increase in general with increasing energy (below 50 keV). At higher energy (50-100 keV), the lower source (00:20:12 00:21:16 UT) descends considerably. For the upper source, the energy dependence of the source centroids is not significant below 20 keV, while above 20 keV the upper source presents a weak first-rising-then-descending trend with increasing energy. Note that these distance measurements suffer from projection effects. The inferred energy dependence may be different if observed from a different perspective.
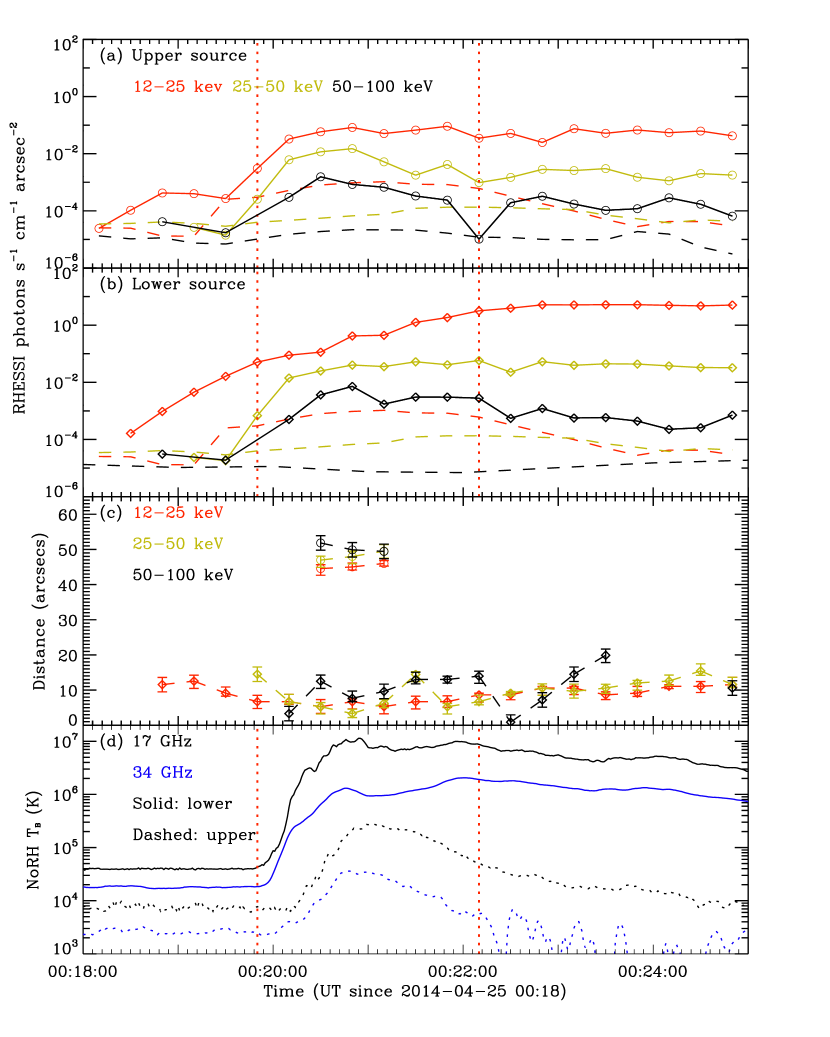
In Figure 4a-4b we plot the light curves within energy bands of 12-25, 25-50, and 50-100 keV for both sources. The areas used for the plots are drawn in Figure 5a (see circles 1 and 2, and the circles 3 and 4 represent the areas used to calculate the background X-ray fluxes). We see that the lower-source 12-25 keV curve start to increase around 00:19 UT, nearly 1 minute earlier than those of the upper source, the 25-50 and 50-100 keV curves of both sources rise almost simultaneously. Two minutes later the upper source declines rapidly while the lower source continues to be at a relatively high level. This indicates that the upper source is more transient. We highlight that the presence of the upper source at 25-50 and 50-100 keV bands is co-temporal and co-spatial with the side-lobe squeezing-in motion observed from 00:20-00:22 UT (see Figure 1c).
In the centroid distance plot of Figure 3, we integrate the 1-minute RHESSI data to get enough photon counts within relatively fine energy bands. To investigate the temporal behavior of the double sources, we consider a shorter interval (20 s) of integration yet using wider energy bands as a tradeoff. The results are shown in Figure 4c. We see that the lower sources are around 5-15” at 00:21 UT with the 50-100 keV source being higher untill 00:22 UT. After 00:22 UT, the lower sources manifest a slow rising trend reaching 10-20” at 00:25 UT. For the upper source the centroid altitudes at higher energy tend to be slightly higher initially, at the following two intervals the centroid altitudes present a converging trend at 50” above the solar limb.
Note that we tried three methods, including the PIXON (Metcalf et al. 1996), CLEAN (Hurford et al. 2002), and VIS FWDFIT (Forward-fit algorithm based on visibilities) algorithms (available in the RHESSI software) to reconstruct RHESSI images, and found consistent results (see Aschwanden et al. (2004) for a comparative study with different algorithms). For the above source centroid measurements, we mainly use PIXON, while doing imaging spectroscopy we use the three methods for a consistency check.
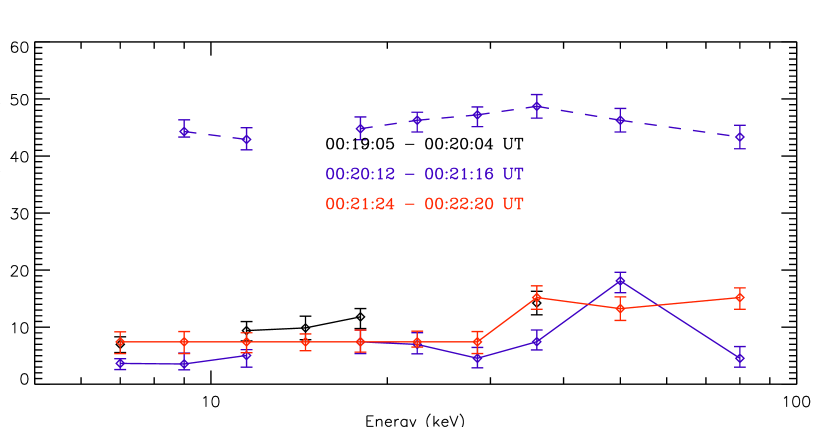
As seen from Figure 5, the obtained three sets of spectral fits, each consisting of a thermal and a broken power-law component (the spectral index of the pre-break lower-energy part is taken to be ), present a spectral index (post-break) of the upper source slightly smaller by 0.5 than that of the lower source. This hardening trend can be clearly seen from the reconstructed photon spectral data from various methods. Both sources are power-law dominated above 15 keV. The residuals (blue for the upper and red for the lower source) fluctuate around zero with an amplitude of 2. The CLEAN method yields in-general smaller residuals ( above 10 keV) than the other two methods. Since we are mainly concerned with the relatively harder spectra of the upper source above 20 keV, the residuals of the spectral fits are in an acceptable range.
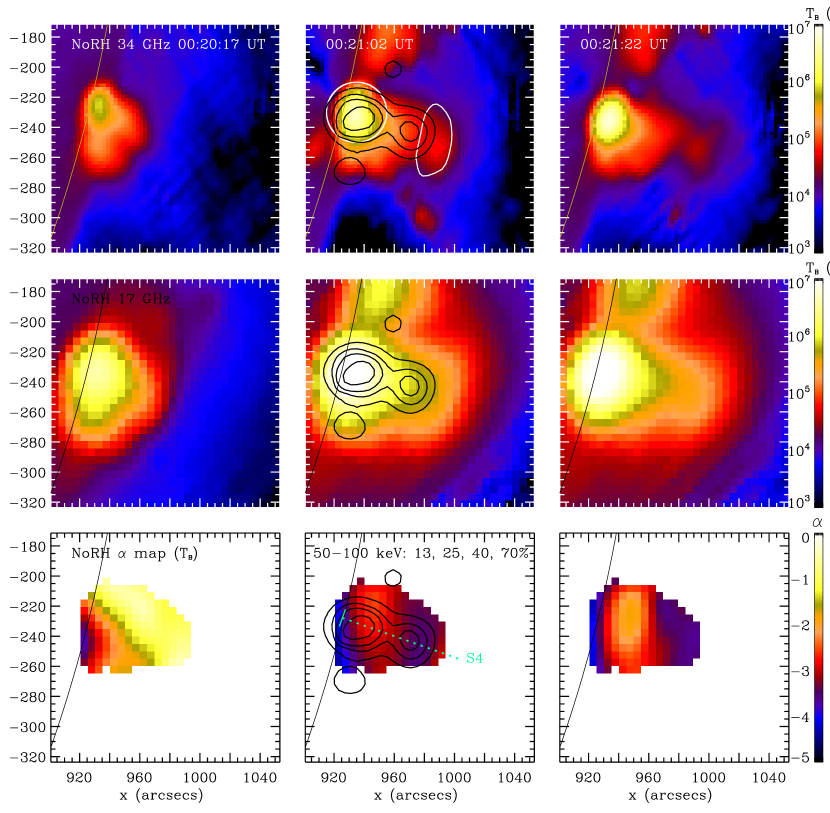
The event is also observed by the NoRH at 17 and 34 GHz with synthesized images and the Nobeyama RadioPolarimeter (NoRP; Torii et al. 1979) from 1-35 GHz with integrated flux densities. The contours at the two frequencies have been overplotted onto the 94 Å images in Figure 1b, from which we see that the 34 GHz contours present a well-defined double source structure that is largely coincident with the double HXR sources, while the 17 GHz data show an elongated feature possibly due to the coarser angular resolution (10” at 17 GHz versus 5” at 35 GHz).
The evolutionary sequence of NoRH sources is shown in Figure 6 with an accompanying movie. Note that the NoRH microwave data presented here have a much higher temporal resolution (1s) than the HXR imaging. This allows more source information to be revealed. Initially at 00:20 UT, only weak emissions ( K) are observed. The 17 GHz loop-top source increases its rapidly to a level of K within 40s. Then, the 34 GHz loop-top source also increases to the same level of , while in the upper source region the s at both frequencies are much lower ( K). In general, the 17 GHz source is brighter than its 34 GHz counterpart. After 00:20:30 UT, the 34 GHz loop-top source starts to present an extended structure. 10 s later, an isolated source appears above the 34 GHz loop-top source, most evident around 00:21 UT. The isolated source fades away after 00:21:30 UT. Later, both 34-17 GHz sources maintain a bright localized loop-top source. Through this process, the 17 GHz loop-top source shows corresponding elongation towards the 34 GHz upper source, yet without an isolated upper source structure.
In Figure 4d, we have plotted the profiles averaged within the areas selected for the 17-34 GHz sources (see Figure 6, white curves). The microwave profiles are consistent with their HXR counterparts (25-50 and 50-100 keV), especially during the rising phase. After the impulsive rise, the lower sources present a double-hump feature. This is different from the upper source that declines rapidly to the pre-eruption level in 2 minutes.
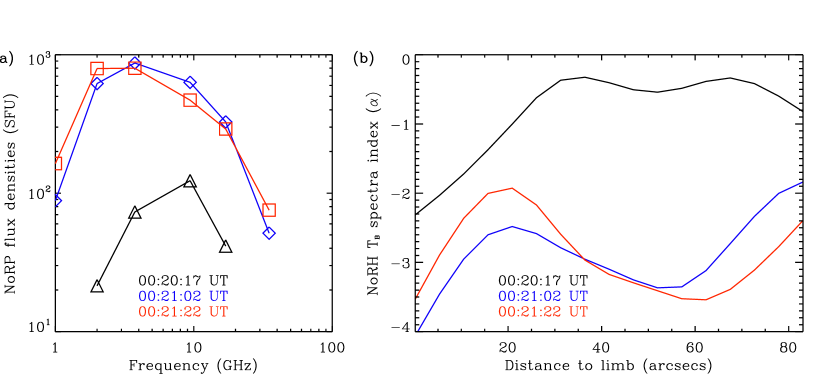
To determine the nature of the microwave emission and its connection to the HXR emission, we examine the deduced microwave spectra. The spatially-unresolved NoRP data can be used to measure the peak (or turn-over) frequency of the total spectrum (see Figure 7a), which is important to determine the optical thickness of NoRH sources. We see that the turn-over frequency during this period is always 10 GHz. This turn-over frequency is mainly relevant to the loop top source due to its dominance of emission. Considering that the upper source is located much higher in the corona with a general weaker magnetic field strength, it is expected that the turn-over frequency of the upper source is even lower (Dulk, 1985). This indicates that the 17-34 GHz data reported here are optically-thin.
The NoRH spectral index () map can be deduced with the measured s at 17-34 GHz (see Figure 6 and the online movie). Values of along the line S4 (shown in Figure 6c) are presented in Figure 7b. We see that during the presence of the upper source, decreases to a value ranging from 3 to 4, a typical index for optically-thin gyro-synchrotron emission (e.g., Dulk et al. 1985; White et al. 2011; Narukage et al. 2014), from 2 for the lower source and from 0 for the upper source. This indicates that emissions from both sources include a significant non-thermal contribution.
The upper HXR source reported here is likely attributed to thin-target bremsstrahlung emission since coronal plasmas are much less dense than chromospheric plasmas of the thick-target footpoint sources (see Krucker et al., 2008, 2010, 2014 for relevant discussions). We then infer the electron energy spectral index () using the thin-target approximation with (Brown 1971; Lin 1974; White et al. 2011), and get = 3.6-3.8 (3.1-3.3) for the lower (upper) source with the three methods. On the other hand, with the non-thermal optically-thin gyro-synchrotron mechanism for the microwave upper source with the spectral index , we deduce the electron energy spectra to be 3 using the Dulk approximation (Dulk 1985). The obtained HXR and microwave energy spectral indices of electrons for the upper source are close to each other indicating that both the HXR and microwave upper sources are generated by the same population of energetic electrons. Note that the above analysis of the electron energy spectra is preliminary and model-dependent.
The above discussion on HXR and microwave emission mechanisms helps in understanding why the 34 GHz upper source has a brightness temperature ( K) much lower than that of the lower source, and why the 34 GHz appears to be displaced (by ) away from the source centroid of the counterpart HXR source (see Figure 6). These observations may be due to the very different dependence of HXR and microwave radiation on coronal parameters. The bremstrahlung HXR emissivity is highly dependent on the electron number density while the gyro-synchrotron microwave emission is proportional to a high power of (thus very sensitive to the change of) the magnetic field strength (e.g., Dulk 1985).
To summarize this section, we find that (1) the double sources, observed in both the HXR and microwave (34 GHz) regimes, are co-incident with the rapid re-approaching motion of side lobes and the presence of the resultant X-shape morphology; (2) the projected centroid distances of the upper source present a weak energy dependence above 20 keV; (3) the upper source is more transient lasting for 1-2 minutes while the lower source is much longer in duration, and their flux curves follow the almost-simultaneous rising trend while the upper-source curve declines much sooner; (4) the HXR upper source presents a spectrum with the power-law spectral index being slightly harder (by 0.5) than that of the lower source, while in microwaves both sources present a typical non-thermal gyro-synchrotron emission with spectral index ranging from to .
4 Summary and discussion
We investigated the flux and spectral characteristics of a coronal double source structure observed in X-rays and microwaves during a foot-point occulted X-1.3 flare. The event has been regarded as a clear example of magnetic breakout observed from a limb perspective, during which the breakout reconnection high in the corona removes the magnetic confinement of overlying arcades on the lower energized central core flux and paves the way for the eruption. The double sources, observed in HXRs by RHESSI and at 34 GHz by NoRH, appear during the impulsive stage of the event when the ejecta moves outward to a certain height and the side lobes that were previously pushed aside now start to move towards each other (or squeeze-in) at a very fast pace (220-270 km s-1 on one side). We suggest that this fast approaching motion of magnetic loops plays an important role in generating the upper HXR and microwave coronal source.
The approaching motion of side lobes can effectively squeeze the field lines on the two sides of the tail of the ejecta along which the presumed vertical current sheet is located. This results in “additional” inward pressure that may have significantly enhanced the rate of reconnection (driven by the very-fast inflows) and thus the electron acceleration at the wake of the ejecta. In addition, pre-accelerated electrons (released by the on-going flare process) may be present as seed particles available for further acceleration around the upper source. This presents a fast squeezing-in picture for the origin of the localised upper coronal source, and explains why the upper source is away from the lower source (among events with the largest double-source separation distance ever reported) with a power-law spectral index harder (by 0.5) than that of the lower source.
In this scenario, the upper source is associated with the squeezing-in motion of the side arcades. It is not necessarily located at the upper tip of the reconnecting current sheet and related to the bidirectional energy release of reconnection across the large-scale current sheet, as usually assumed (e.g., Sui & Holman 2003; Sui et al., 2004). In addition, earlier studies found puzzling that the upper coronal source can remain stationary in location for a few minutes before it vanishes or moves outwards. Sui et al. (2004) tentatively attributed this observation to the formation and development of the current sheet during the early impulsive stage of the eruption, yet no further support was provided. In our scenario, the upper source depends on the rapid approaching motion of side lobes. The motion occurs within a relatively localized area, so does the resultant upper source.
Note that the essential element of the above scenario, i.e., the squeezing-in motion of arcades along the tail of the ejecta, may take place as long as the eruption originates from a multi-polar configuration, where surrounding arcades are first pushed aside by the ejecta and then bounce backwards rapidly. This may result in enhanced pressure towards the tail of the ejecta (likely with a developing current sheet) and efficient reconnection and electron acceleration therein, regardless of the exact triggering process of the eruption (being a magnetic breakout or not). Thus, the proposed scenario for the upper source is mainly related to the global magnetic configuration rather than the exact triggering mechanism. Further studies are required to see whether more events are in line with this scenario.
According to numerical simulations of magnetic breakout (Lynch et al., 2008), anti-breakout reconnection of side lobes sets in after central arcade is completely recovered through the primary flaring reconnection. From the AIA data, during the impulsive stage (from 00:20-00:22 UT) coronal structures between the approaching side lobes brighten diffusively (see the online move provided in Chen et al. 2016). This makes it not possible to separate the anti-breakout reconnection from the primary flaring reconnection with the observations available here. We tentatively suggest that both may have contributed to the generation of the upper HXR source.
For the pre-eruption breakout reconnection (i.e., the triggering process), we did not observe any X-ray and radio signatures of efficient particle acceleration. This is consistent with the deduction that the triggering breakout reconnection mainly converts magnetic energy into plasma thermal energy (Chen et al. 2016). During the impulsive stage, the pre-flare X structure across which the triggering breakout reconnection takes place deforms into a large-scale transversely-curved thin structure with a high temperature (see the yellow arrows in Figure 1). The structure has been suggested to be a transverse current sheet straddling the ejecta (see Chen et al. 2016). During its outward expansion, the structure keeps its shape and does not manifest some usual reconnection-induced behavior, such as the presence of magnetic islands, strong bidirectional flows, or some kind of morphology collapse, nor are there any co-spatial X-ray or microwave sources. This indicates that the structure does not experience fast reconnection and particles there are not efficiently accelerated.
Aurass et al. (2013) presented an observational report on metric radio evidence of breakout reconnection during the impulsive stage of the flare occurring on 2003 November 3, on the basis of X-ray and radio-metric imaging and spectral data. Although their study was conducted in the SOHO era with less dynamical details and temperature coverage, the two studies together show that various reconnection processes associated with the breakout eruption can produce radio signatures at both microwave (at higher frequency and thus lower altitude) and metric (at lower frequency and thus higher altitude) wavelengths.
In an independent study, Effenberger et al. (2016) investigated HXR emission of the same event using the RHESSI data. They also performed an imaging spectroscopy study of the double HXR sources and found that the upper source has a slightly harder power-law spectral index. This allows them to speculate that there exists effective electron acceleration in that part of the loop (co-spatial with the upper source). This is consistent with our result although the two studies have selected different time intervals of RHESSI data, different regions for the imaging spectroscopy, and different fitting methods.
Double coronal sources associated with approaching loops were reported earlier during the impulsive phase of a C2.3 confined flare (Su et al. 2013). In their event, clear reconnection signatures of inflowing cool loops (at a speed of 20 (50) km s-1 on the south (north) side) and newly formed, out-flowing hot loops are observed. The X-ray energy of those coronal sources hardly reaches up to 20 keV, and the X-ray spectra can be well fitted with two isothermal components. This indicates that their coronal sources are likely thermal in nature. Here, our event is associated with a major X-class flare and a fast CME, the X-ray energy in both coronal sources reach up to 70 - 100 keV indicating the presence of nonthermal energetic electrons. The upper source studied here is also co-incident in time and location with approaching loops, yet the process is in the aftermath of a successful eruption, and the approaching speed is 5-10 times faster than those reported by Su et al. (2003). In addition, the side lobes of our event consist of high-temperature plasmas as inferred from the AIA data. This, again, presents our fast squeezing-in picture (driven by rapidly-approaching side lobes, with enhanced reconnection rate) for the origin of the upper coronal source.
References
- Antiochos (1998) Antiochos, S. K. 1998, ApJ, 502, L181
- Antiochos (1999) Antiochos, S. K., DeVore, C. R., & Klimchuk, J. A. 1999, ApJ, 510, 485
- Aschwanden (2004) Aschwanden, M. J., Metcalf, T. R., Krucker, S., Sato, J., Conway, A. J., Hurford, G. J., & Schmahl, E. J. 2004, Sol. Phys., 219, 149
- Aulanier (2000) Aulanier, G., DeLuca, E. E., Antiochos, S. K., McMullen, R. A. & Golub, L. 2000, ApJ, 540, 1126
- Aurass (2013) Aurass, H., Holman, G., Braune, S., Mann, G., & Zlobec, P. 2013, A&A, 555, A40
- Aurass (2011) Aurass, H., Mann, G., Zlobec, P. & Karlický, M. 2011, ApJ, 730, 57
- Brown (1971) Brown, J. C. 1971, Sol. Phys., 18, 489
- Brueckner (1995) Brueckner, G. E., Howard, R. A., Koomen, M. J., et al. 1995, Sol. Phys., 162, 357
- Chen (2012) Chen, Q., & Petrosian, V. 2012, ApJ, 748, 33
- Chen (2016) Chen, Y., Du, G. H., Zhao, D., et al. 2016, ApJ, 820, L37
- DeVore (2008) DeVore, C. R., & Antiochos, S. K. 2008, ApJ, 680, 740
- Dulk (1985) Dulk, G. A., 1985, Ann. Rev. Astron. Astrophys., 23, 169
- Effenberger et al. (2016) Effenberger, F., Rubio da Costa, F., & Petrosian, V. 2016, Journal of Physics Conference Series, 767, 012005
- Fletcher (2011) Fletcher, L., Dennis, B. R., Hudson, H. S., et al. 2011, SSRv, 159, 19
- Gary (2004) Gary, G. A., & Moore, R. L. 2004, ApJ, 611, 545
- Hara (2011) Hara, H., Watanabe, T., Harra, L. K., Culhane, J. L., & Young, P. R. 2011, ApJ, 741, 107
- Harra (2005) Harra, L. K., D moulin, P., Mandrini, C. H., et al. 2005, Astron. Astrophys., 438, 1099
- Hurford (2002) Hurford, G. J., Schmahl, E. J., Schwartz, R. A., et al. 2002, Sol. Phys., 210, 61
- Kaiser et al. (2008) Kaiser, M. L., Kucera, T. A., Davila, J. M., et al. 2008, Space Sci. Rev., 136, 5
- Karpen (2012) Karpen, J. T., Antiochos S. K. & DeVore C. R. 2012, ApJ, 760, 81
- Krucker (2008) Krucker, S., Battaglia, M., Cargill, P. J., et al. 2008, Astron. Astrophys. Rev., 16, 155
- Krucker (2010) Krucker, S., Hudson, H. S., Glesener, L., et al. 2010, ApJ, 714, 1108
- Krucker & Battaglia (2014) Krucker, S., & Battaglia, M., 2014, ApJ, 780, 107
- Lemen (2012) Lemen, J. R., Title, A. M., Akin, D. J., et al. 2012, Sol. Phys., 275, 17
- lin (1974) Lin, R. P. 1974, SSRv, 16, 189
- Lin (2002) Lin, R. P., Dennis, B. R., Hurford, G. J., et al. 2002, Sol. Phys., 210, 3
- Liu (2013) Liu, W., Chen, Q. T., & Petrosian, V. 2013, ApJ, 767, 168
- Liu (2008) Liu, W., Petrosian, V., Dennis, B. R., & Jiang, Y. W. 2008, ApJ, 676, 704
- Lynch (2004) Lynch, B. J., Antiochos, S. K., MacNeice, P. J., Zurbuchen, T. H., & Fisk, L. A. 2004, ApJ, 617, 589
- Lynch (2008) Lynch, B. J., Antiochos, S. K., DeVore, C. R., Luhmann, J. G., & Zurbuchen, T. H. 2008, ApJ, 683, 1192
- Lynch (2009) Lynch, B. J., Antiochos, S. K., Li, Y., Luhmann, J. G., & DeVore, C. R. 2009, ApJ, 697, 1918
- MacNeice (2004) MacNeice, P. J., Antiochos, S. K., Phillips, A., Spicer, D. S., DeVore, C. R., & Olson, K. M. 2004, ApJ, 614, 1028
- Mandrini (2006) Mandrini, C. H., D moulin, P., Schmieder, B., et al. 2006, Sol. Phys., 238, 293
- Masuda (1994) Masuda, S., Kosugi, T., Hara, H., Tsuneta, S., & Ogawara, Y. 1994, Nature, 371, 495
- metcals (1996) Metcalf, T. R., Hudson, H. S.,Kosugi, T., Puetter, R. C.,& Pina, R. K. 1996, ApJ, 466, 585
- Nakajima et al. (1994) Nakajima, H., Nishio, M., Enome, S., et al., 1994, IEEEP, 82, 705
- Narukage et al. (2014) Narukage, N., Shimojo, M., & Sakao, T., 2014, ApJ, 787, 125
- Neupert (1968) Neupert, W. M. 1968, ApJ, 153, L59
- Pesnell (2012) Pesnell, W. D., Thompson, B. J., & Chamberlin, P. C. 2012, Sol. Phys., 275, 3
- petro (2002) Petrosian, V., Donaghy, T. Q., & McTiernan, J. M. 2002, ApJ, 569, 459
- Priest (2002) Priest, E. R. & Forbes, T. G. 2002, Astron. Astrophys. Rev. 10, 313
- Schou (2012) Schou, J., Scherrer, P. H., Bush, R. I., et al. 2012, Sol. Phys., 275, 229
- Shen (2012) Shen, Y. D., Liu, Y. & Su, J. T. 2012, ApJ, 750, 12
- Sui (2003) Sui, L., & Holman, G. D. 2003, ApJ, 596, L251
- Sui (2004) Sui, L., Holman, G. D. & Dennis B. R. 2004, ApJ, 612, 546
- Sun (2013) Sun, X. D., Hoeksema, J. T., Liu, Y., et al. 2013, ApJ, 778, 139
- Takano et al. (1997) Takano, T., Nakajima, H., Enome, S., et al. 1997, LNP, 483, 183
- Tomczak (2001) Tomczak, M. 2001, A&A, 366, 294
- Torri (1979) Torii, C., Tsukiji, Y., Kobayashi, S., Yoshimi, N., Tanaka, H., Enome, S. 1979, Proc. Res. Inst. Atmos., 26, 129
- veronig (2006) Veronig, A. M., Karlick, M., Vrnak, B., et al. 2006, A&A, 446, 675
- White (2011) White, S. M., Benz, A. O., Christe, S., et al. 2011, SSRv, 159, 225