The Effect of Collective Attention
on Controversial Debates on Social Media
Abstract.
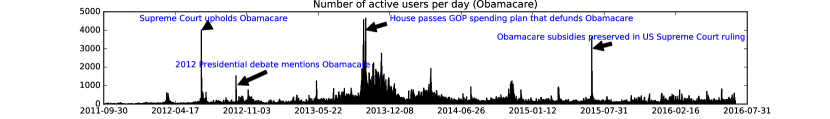
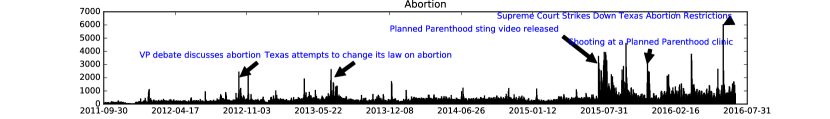
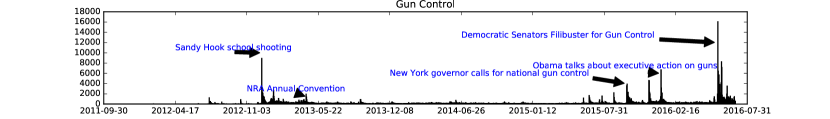
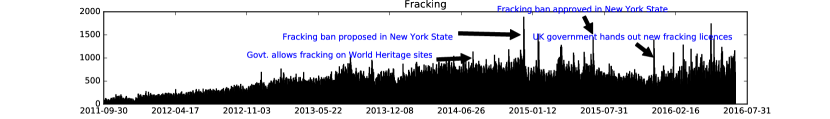
We study the evolution of long-lived controversial debates as manifested on Twitter from 2011 to 2016. Specifically, we explore how the structure of interactions and content of discussion varies with the level of collective attention, as evidenced by the number of users discussing a topic. Spikes in the volume of users typically correspond to external events that increase the public attention on the topic – as, for instance, discussions about ‘gun control’ often erupt after a mass shooting.
This work is the first to study the dynamic evolution of polarized online debates at such scale. By employing a wide array of network and content analysis measures, we find consistent evidence that increased collective attention is associated with increased network polarization and network concentration within each side of the debate; and overall more uniform lexicon usage across all users.
1. Introduction
Social media are a major venue of public discourse today, hosting the opinions of hundreds of millions of individuals. Due to their prevalence they have become an invaluable instrument in the study of social phenomena and a fundamental subject of computational social science. In this work, we study discussions around issues that are deemed important at a societal level — and in particular, ones that are controversial. This work is a step towards understanding how the discussion about controversial topics on social media evolves, and more broadly how these topics shape the discussion at a societal and political level (Abramowitz and Saunders, 2005; Highton and Kam, 2011; Lindaman and Haider-Markel, 2002).
We study how online discussions around controversial topics change as interest in them increases and decreases. We are motivated by the observation that interest in enduring controversial issues is re-kindled by external events, e.g., when a major related story is reported. One typical example is the gun control debate in U.S., which is revived whenever a mass shooting occurs.111See, e.g., http://slate.me/1NswLLD. The occurrence of such an event commonly causes an increase in collective attention, e.g., in volume of related activity in social media.
Given a controversial topic, our focus is to analyze the interactions among users involved in the discussion, and quantify how certain structural properties of the interaction network vary with the change in volume of activity. Our main finding is that the polarization reflected in the network structure of online interactions is correlated with the increase in the popularity of a topic.
Differently from previous studies, we study the dynamic aspects of controversial topics on social media. While the evolution of networks and polarization on social media have been studied in the past (Conover et al., 2011; Leskovec et al., 2005), they have not been studied in conjunction before. In addition, we seek to understand the response of social media to stimuli that cause increased interest in the topics, an issue that only very recently has seen some attention (Romero et al., 2016).
We take a longitudinal approach and collect data from Twitter that covers approximately five years. This dataset gives us a very fine-grained view of the activity on social media, including the structure of the interactions among users, and the content they produced during this period. We track four topics of discussion that are controversial in the U.S., that are recurring, and have seen considerable attention during the 2016 U.S. elections.
Our methodology relies on recent advances in quantifying controversy on social media (Garimella et al., 2016). We build two types of networks: an endorsement network from the retweet information on Twitter, and a communication network from the replies. We aggregate the data at a daily level, thus giving rise to a time series of interaction graphs. Then, we identify the sides of a controversy via graph clustering, and find the core of the network, i.e., the users who are consistently participating to the online discussion about the topic. Finally, we employ a wide array of measures that characterize the discussion about a topic on social media, both from the point of view of the network structure and of the actual content of the posts.
Apart from our main result — an increase in polarization linked to increased interest — we also report on several other findings. We find that most of the interactions during events of interest happen within the different controversy sides, and replies do not cross sides very often, in line with previous observations (Smith et al., 2013). In addition, increased interest does not alter the fundamental structure of the endorsement network, which is hierarchical, with a disproportionately large fraction of edges linking the periphery to the core. This finding suggests that most casual users, who seldom participate in the discussion, endorse opinions from the core of the side they belong to. When looking at the content of the posts on the two sides of a controversy, we find a consistent trend of convergence, as the lexicons become both more uniform and more similar to each other. This result indicates that, while the discussion is still controversial, both sides of the debate focus over the same fundamental issues brought under the spotlight by the event at hand. Conversely, we do not find a consistent long-term trend in the polarization of discussions, which contradicts the common narrative that our society is becoming more divided over time. Finally, we perform similar measurements for a set of topics that are non-political and non-controversial, and highlight differences with the results for controversial discussions.222A limited subset of our results appeared in a poster at ICWSM 2017 (Garimella et al., 2017b).
2. Related Work
A few studies exist on the topic of controversy in online news and social media. In one of the first papers, Adamic and Glance (2005) study linking patterns and topic coverage of political bloggers, focusing on blog posts on the U.S. presidential election of 2004. They measure the degree of interaction between liberal and conservative blogs, and provide evidence that conservative blogs are linking to each other more frequently and in a denser pattern. These findings are confirmed by a more recent study of Conover et al. (2011), who focus on political communication regarding congressional midterm elections. Using data from Twitter, they identify a highly segregated partisan structure (present in the retweet graph, but not in the mention graph), with limited connectivity between left- and right-leaning users. In another recent work, Mejova et al. (2014) consider discussions of controversial and non-controversial news over a span of months. They find a significant correlation between controversial issues and the use of negative affect and biased language. More recently, Garimella et al. (2016) show that controversial discussions on social media have a well-defined structure, when looking at the endorsement network. They propose a measure based on random walks (RWC), which is able to identify controversial topics, and quantify the level of controversy of a given discussion via its network structure alone.
The aforementioned studies focus on static networks, which are a snapshot of the underlying dynamic networks. Instead, we are interested in network dynamics and, specifically, in how it responds to increased collective attention in the controversial topic.
Several studies have looked at how networks evolve, and proposed models of network formation (Leskovec et al., 2005; Leskovec et al., 2008). Densification over time is a pattern often observed (Leskovec et al., 2005), i.e., social networks gain more edges as the number of nodes grows. A change in the scaling behavior of the degree distribution has also been observed (Ahn et al., 2007). Newman et al. (2011) offer a comprehensive review. Most of these studies focus on social networks, and in particular, on the friendship relationship. In our work, we are interested in studying an interaction network, which has markedly different characteristics.
There is a large amount of literature devoted to studying the evolution of networks. For an overview, see the book by Dorogovtsev and Mendes (2013). However, none of these previous studies has devoted much attention to the evolution of interaction networks for controversial topics, especially when tracking topics for a long period of time.
DiFonzo et al. (2014) report on a user study that shows how the network structure affects the formation of stereotypes when discussing controversial topics. They find that segregation and clustering lead to a stronger “echo chamber” effect, with higher polarization of opinions. Our study examines a similar correlation between polarization and network structure, although in a much wider context, and focusing on the influence of external events.
Garimella and Weber (2017) study polarization on Twitter over a long period of time, using content and network-based measures for polarization and find that over the past decade, polarization has increased. We find no consistent trend among the topics we study.
Perhaps the closest work to this paper is the work by Smith et al. (2013), who study the role of social media in the discussion of controversial topics. They try to understand how positions on controversial issues are communicated via social media, mostly by looking at user level features such as retweet and reply rates, url sharing behavior, etc. They find that users spread information faster if it agrees with their position, and that Twitter debates may not play a big role in deciding the outcome of a controversial issue.
However, there are differences with our work: (i) they study one local topic (California ballot), over a small period of time, while we study a wide range of popular topics, spanning multiple years; and (ii) their analysis is mostly user centric, whereas we take a global viewpoint, constructing and analyzing networks of user interaction.
The effect of external events on social networks. A few studies have examined the effects of events on social networks. Romero et al. (2016) study the behavior of a hedge-fund company via the communication network of their instant messaging systems. They find that in response to external shocks, i.e., when stock prices change significantly, the network “turtles up,” strong ties become more important, and the clustering coefficient increases. In our case, we examine both a communication network and an endorsement network, and we focus on controversial issues. Given the different setting, many of our findings are quite different.
Other works, such as the ones by Lehmann et al. (2012) and Wu and Huberman (2007), examine how collective attention focuses on individual topics or items and evolves over time. Lehmann et al. (2012) examine spikes in the frequency of hashtags and whether most frequency volume appears before or after the spike. They find that the observed patterns point to a classification of hashtags, that agrees with whether the hashtags correspond to topics that are endogenously or exogenously driven. Wu and Huberman (2007), on the other hand, examine items posted on digg.com and how their popularity decreases over time.
Morales et al. (2015) study polarization over time for a single event, the death of Hugo Chavez. Our analysis has a more broad spectrum, as we establish common trends across several topics, and find strong signals linking the volume of interest to the degree of polarization in the discussion.
Andris et al. (2015) study the partisanship of the U.S. congress over a long period of time. They find that partisanship (or non-cooperation) in the U.S. congress has been increasing dramatically for over 60 years. Our study suggests that increased controversy is linked to an increase in attention on a topic, whereas we do not see a global trend over time.
3. Dataset
Our study uses data collected from Twitter. Using the repositories of the Internet Archive,333https://archive.org/details/twitterstream we collect a sample of tweets from September 2011 to August 2016,444To be precise, we have data for months from that period for four topics of discussion, related to ‘Obamacare’, ‘Abortion’, ‘Gun Control’, and ‘Fracking’. These topics constitute long-standing controversial issues in the U.S.555According to http://2016election.procon.org. and have been used in previous work (Lu et al., 2015). For each topic, we use a keyword list as proposed by Lu et al. (2015) (shown in Table 1), and extract a base set of tweets which contain at least one topic-related keyword. To enrich this original dataset, we use the Twitter REST API to obtain all tweets of users who have participated in the discussion at least once.666Up to due to limits imposed by the Twitter API. Admittedly, this dataset might suffer from sampling bias, however the topics are specific enough that the distortion should be negligible (Morstatter et al., 2013). There might also be recency bias due to the addition of the latest tweets of the users. However, the data does not show any clear trend in this sense (see Figure 1). In addition, given that we rely on detecting volume peaks, the trend does not affect our analysis. Table 1 shows the final statistics for the dataset.
| Topic | Keywords | #Tweets | #Users |
|---|---|---|---|
| Obamacare | obamacare, #aca | ||
| Abortion | abortion, prolife, prochoice, anti-abortion, pro-abortion, planned parenthood | ||
| Gun Control | gun control, gun right, pro gun, anti gun, gun free, gun law, gun safety, gun violence | ||
| Fracking | fracking, #frack, hydraulic fracturing, shale, horizontal drilling |
We infer two types of interaction network from the dataset: () a retweet network — a directed endorsement network of users, where there is an edge between two users () if retweets , and () a reply network — a directed communication network of users, where an edge () indicates that user has replied to a tweet by user . Note that replies are characterized by a tweet starting with ‘@username’ and do not include mentions and retweets.777See also https://support.twitter.com/articles/14023 for terminology related to different types of Twitter messages.
Polarized networks, especially the ones considered here, can be broadly characterized by two opposing sides, which express different opinions on the topic at hand. It is commonly understood that retweets indicate endorsement, and endorsement networks for controversial topics have been shown to have a bi-clustered structure (Conover et al., 2011; Garimella et al., 2016), i.e., they consist of two well-separated clusters that correspond to the opposing points of view on the topic. Conversely, replies can indicate discussion, and several studies have reported that users tend to use replies to talk across the sides of a controversy (Bessi et al., 2014; Liu and Weber, 2014). These two types of network capture different dynamics of activity, and allow us to tease apart the processes that generate these interactions.
In this paper, we build upon the observation that the clustering structure of retweet networks reveals the opposing sides of a topic. In particular, following an approach from previous work (Garimella et al., 2016), we collapse all retweets contained in the dataset of each topic into a single large static retweet network. Then, we use the METIS clustering algorithm (Karypis and Kumar, 1995) to identify two clusters that correspond to the two opposing sides. This process allows us to identify more consistent sides for the topic. We evaluate the sides by manual inspection of the top retweeted users, URLs, and hashtags. The results are consistent and accurate, and can be inspected online.888https://mmathioudakis.github.io/polarization/
Let us now consider the temporal dynamics of these interaction networks. Given the traditional daily news reporting cycle, we build the time series of networks with the same daily granularity. This high resolution allows us to easily discern the level of interest in the topic, and possibly identify spikes of interest linked to real world external events, as shown in Figure 1. These spikes usually correspond to external newsworthy events, as shown by the annotations. These results support the observation that Twitter is used as an agorá to discuss the daily matters of public interest (De Francisci Morales et al., 2012).
As shown in Figure 1, the size of the active network for each day varies significantly. There is, however, a hard core set of active users who are involved in the discussion of these controversial topics most of the time. Therefore, to understand the role of these more engaged users, we define the ‘core network’ as the one induced by users who are active for more than of the observation time. Specifically, to build a core set of users, we first identify two subsets — one consisting of those users who generated or received a retweet at least once per month for months; and another one defined similarly for replies. We define the core set of users as the union of the aforementioned two sets. Nodes of a network that do not belong to the core are said to belong to the periphery of that network. The size of the core ranges from around to nodes for the four topics. For any given day, the core accounts for at most around of the active users.
3.1. Notation
The set of retweets that occur within a single day gives rise to one retweet network . Each user associated with a retweet is represented with one node in the network. There is a directed edge from user to user only when user has retweeted at least one tweet authored by user . Correspondingly, the set of replies that occur within a single day give rise to a reply network . In addition, each node in the network is associated with a binary attribute that indicates whether the node is part of the core, and an attribute that represents the side the node belongs to. In some cases, we consider undirected versions of the networks defined above. In such cases, we write , to denote the undirected graphs corresponding to , , respectively.
Besides these two types of network, for each day we consider the set of tweets that were generated on that day. Every tweet is associated with an attribute that indicates the side its author belongs to. Moreover, every tweet is associated with the list of words that occur in its text. This information gives rise to two unigram distributions and , one for each side. Each distribution expresses the number of times each word appears in the tweets of nodes from each side.
4. Measures
For each day , we employ a set of measures on the associated networks , , and unigram distributions and . We describe them below.
Polarization. We quantify the polarization of a network by using the random-walk controversy (RWC) score introduced in previous work (Garimella et al., 2016). Intuitively, the score captures whether the network consists of two well-separated clusters.
Clustering coefficient. In an undirected graph, the clustering coefficient of a node is defined as the fraction of closed triangles in its immediate neighborhood. Specifically, let be the degree of node , and be the number of closed triangles involving and two of its neighbors, then
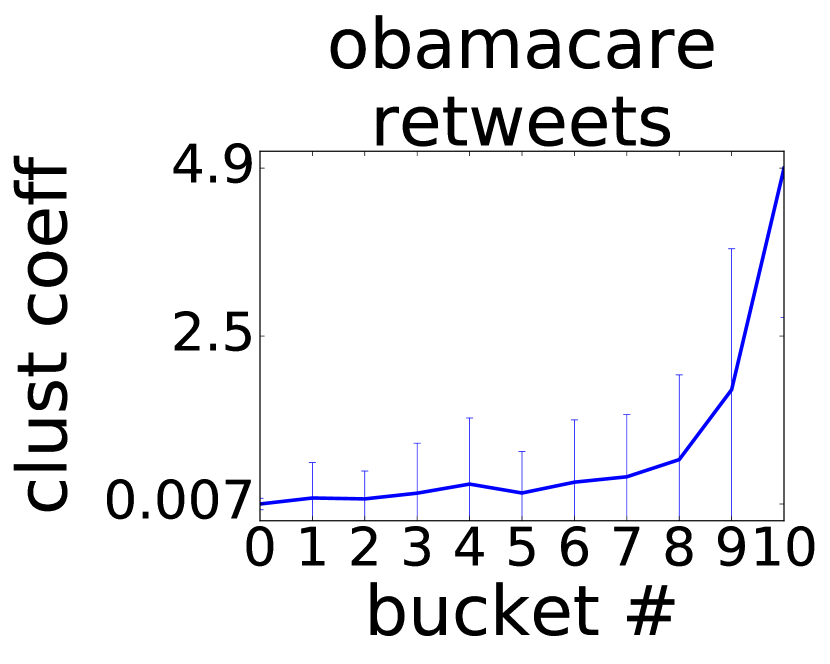
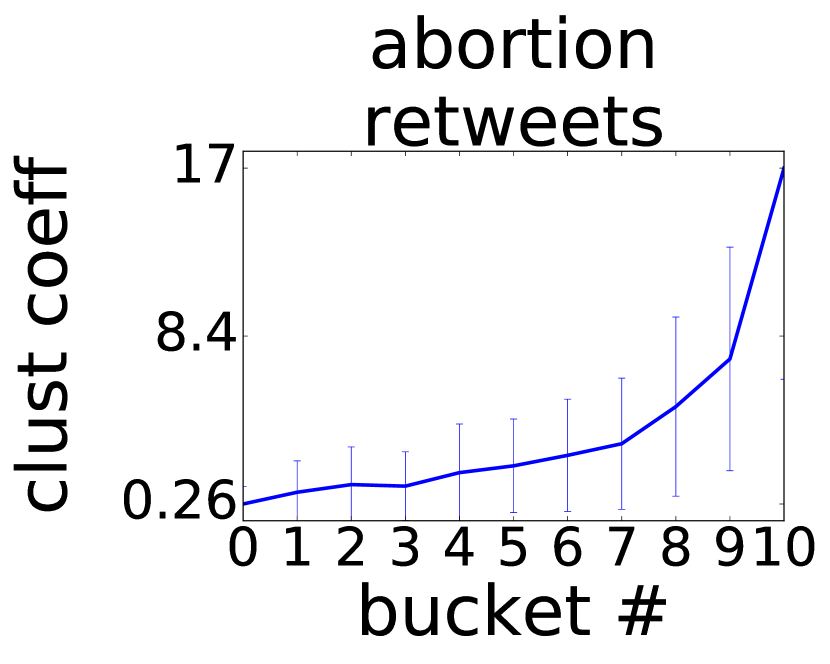
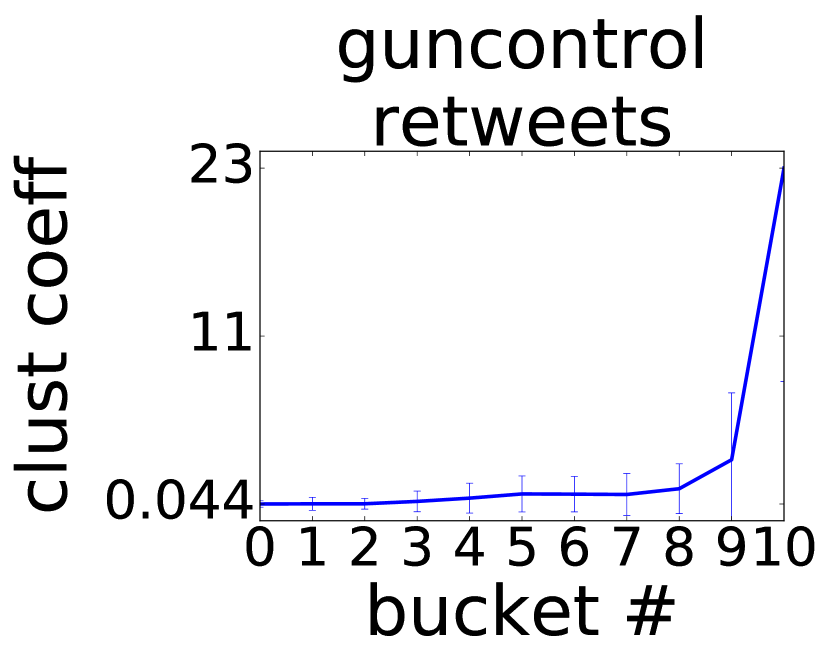
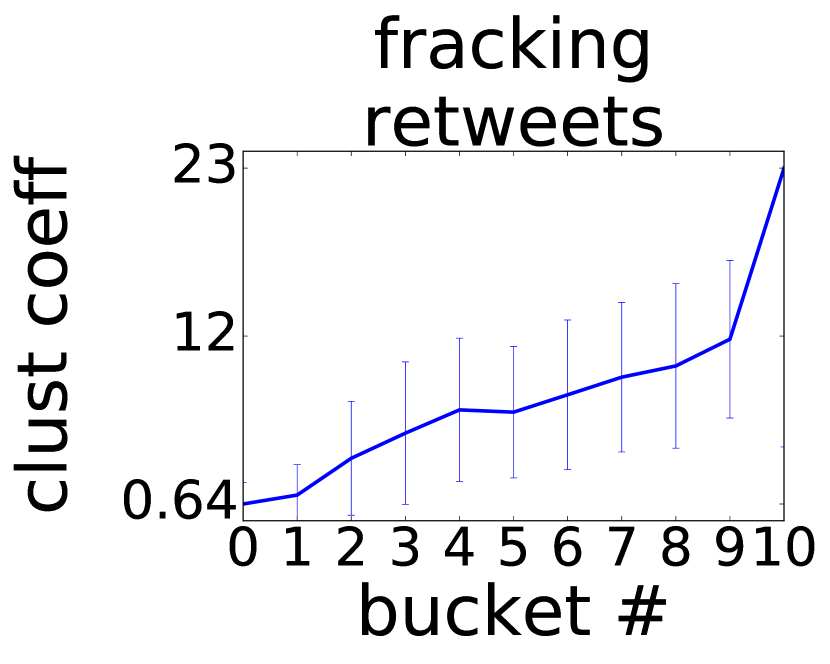
In our case, we consider the undirected graph and compute the average clustering coefficient of all nodes that belong to each side – then take the mean of the two averages as the clustering coefficient of the network.
In order to control for scale effects, i.e., correlation between the size of the network (as determined by the volume of users active on day ) and the clustering coefficient, we employ a normalizer for the score. More in detail, we use an Erdős-Rényi graph as null model (with edges drawn at random among pair of nodes), and normalize the score by the expected value for a null-model graph of the same size. Unless otherwise specified, we apply the same type of normalization for all the methods defined below.
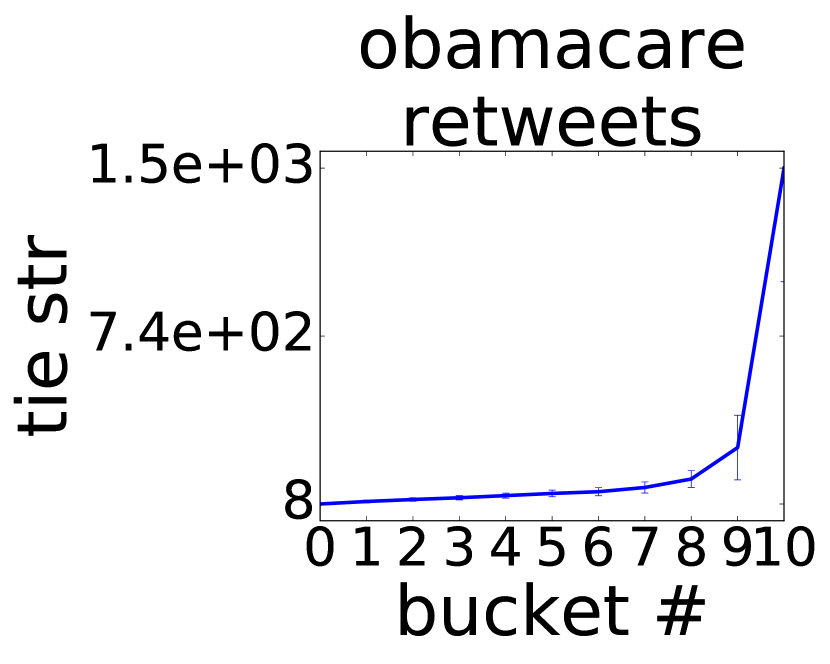
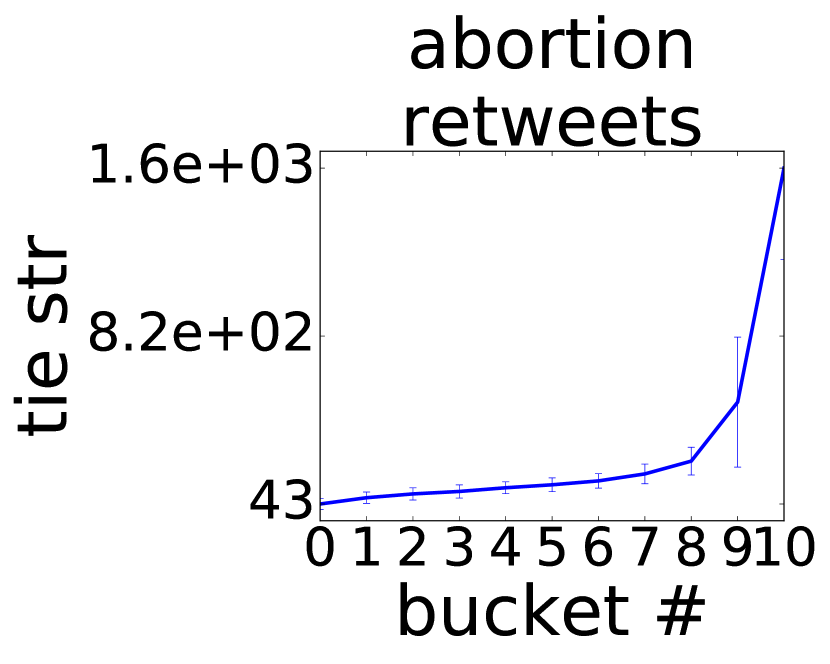
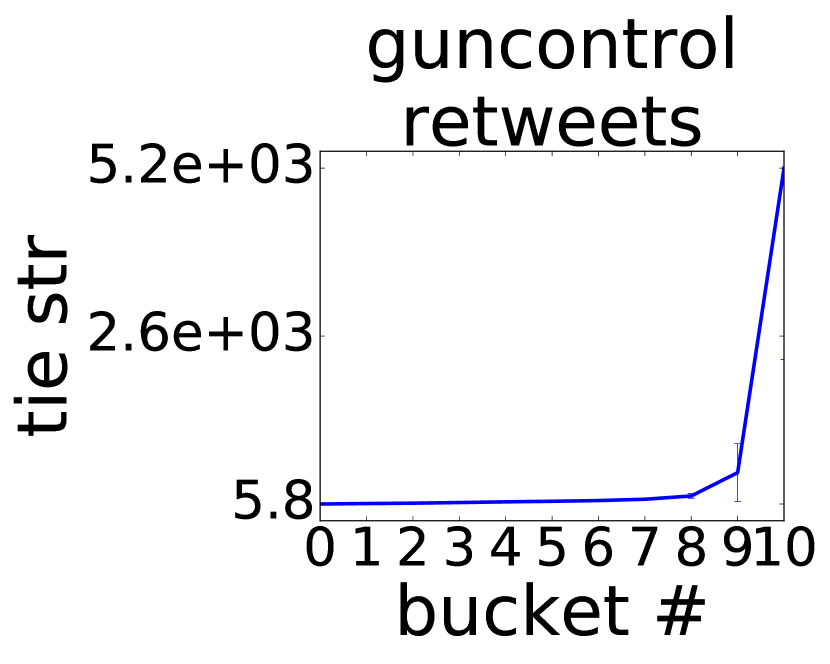
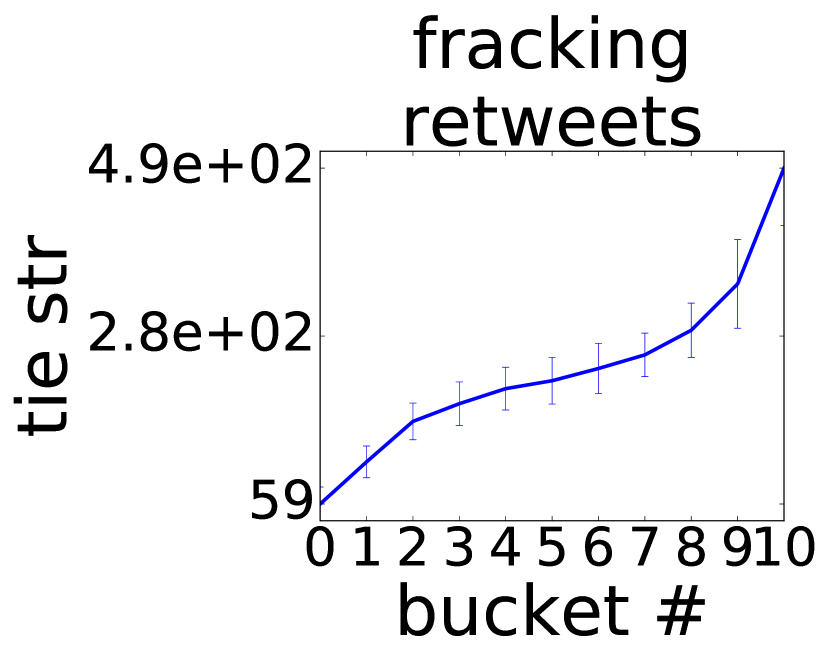
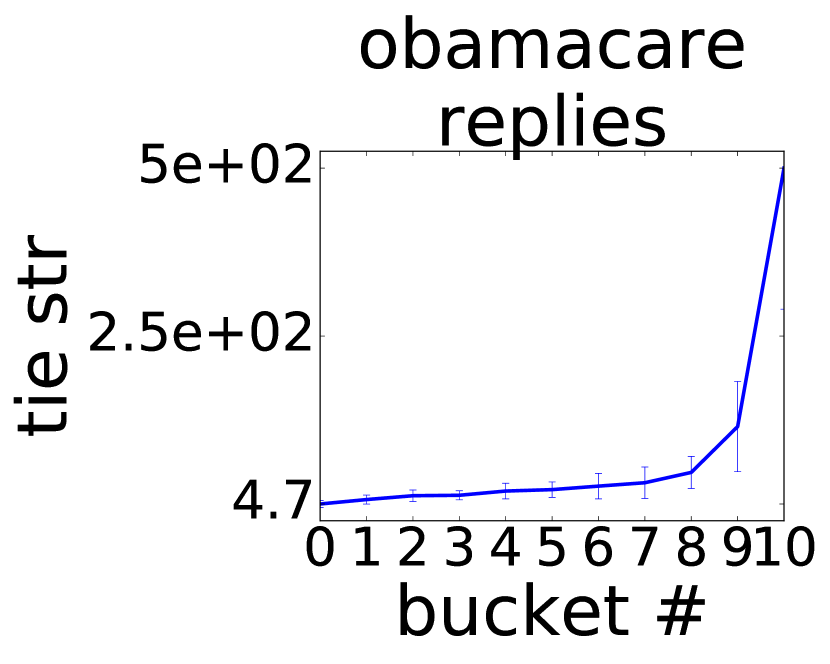
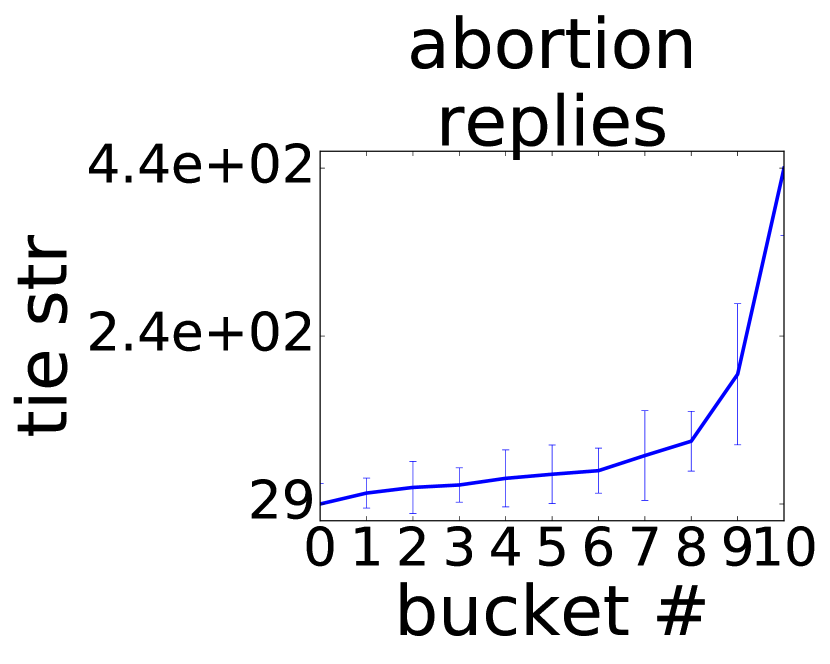
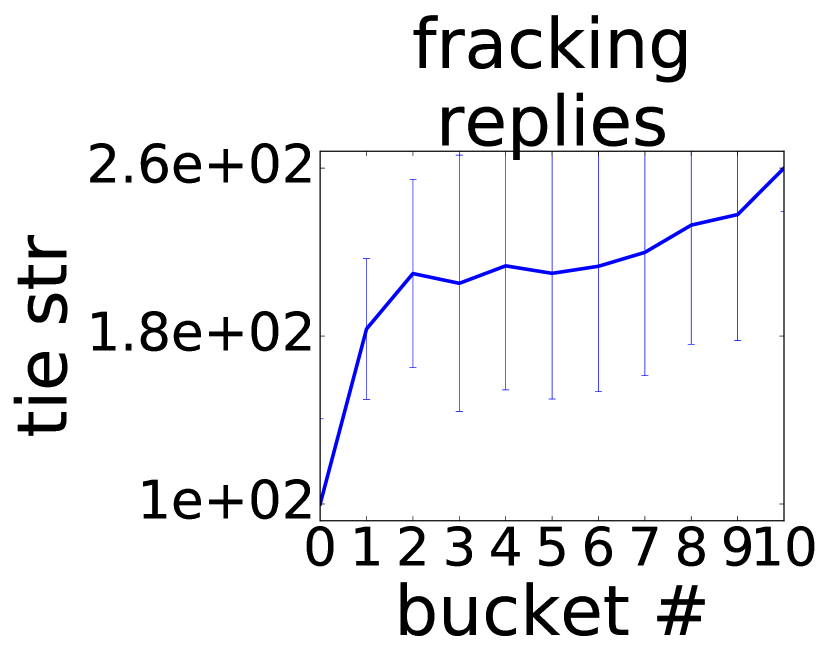
Tie strength. For each node in a graph , we consider all nodes it is connected to across all days, and order them decreasingly by the number of occurrences . That is, the node at the top of the list for is the node to which connects the most consistently throughout the time span of the dataset. Then, we define the strong ties of a node as the top of the nodes ordered as described above. For a given day , we define the tie strength of a node as the number of strong ties it is connected to in the corresponding graph . The tie-strength measure for the day is defined as the average tie strength for all nodes on either side. As described for the previous measure above, we normalize the reported measure by the expected value for a random graph with the same number of nodes and edges.
Cross–side openness. This measure reports the number of edges that connect nodes from opposing sides, and captures the inter-side interaction happening in the network on a given day. Formally, it is defined as
We apply the same normalization as described above.
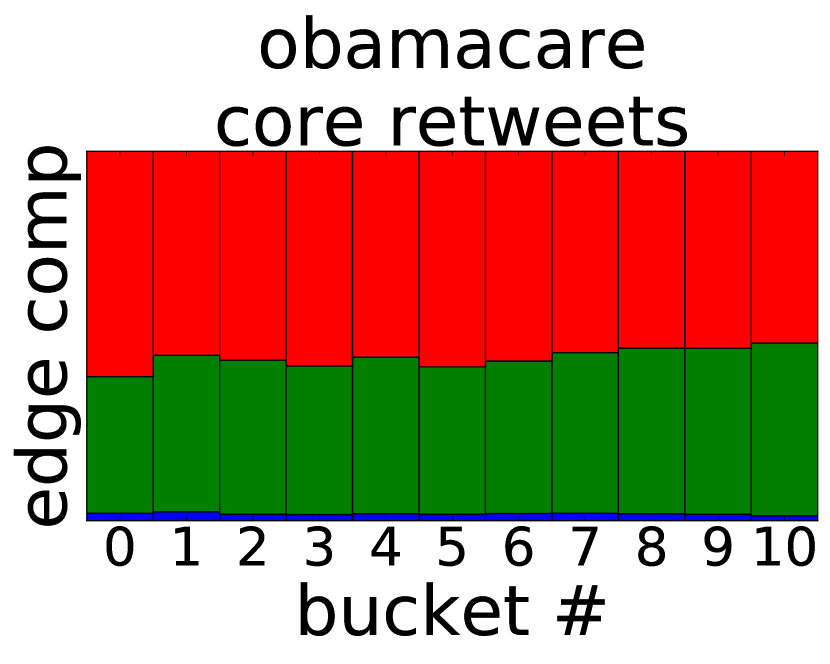
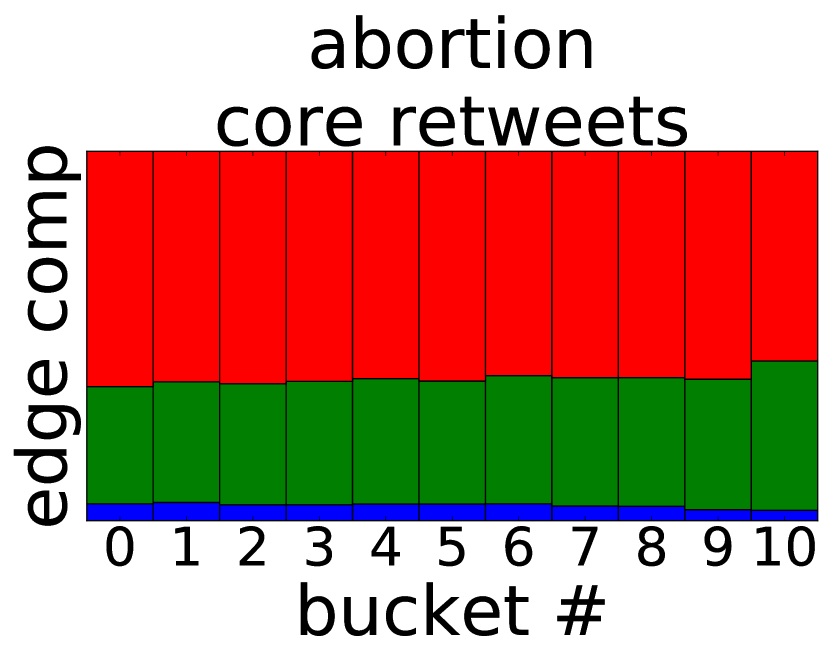
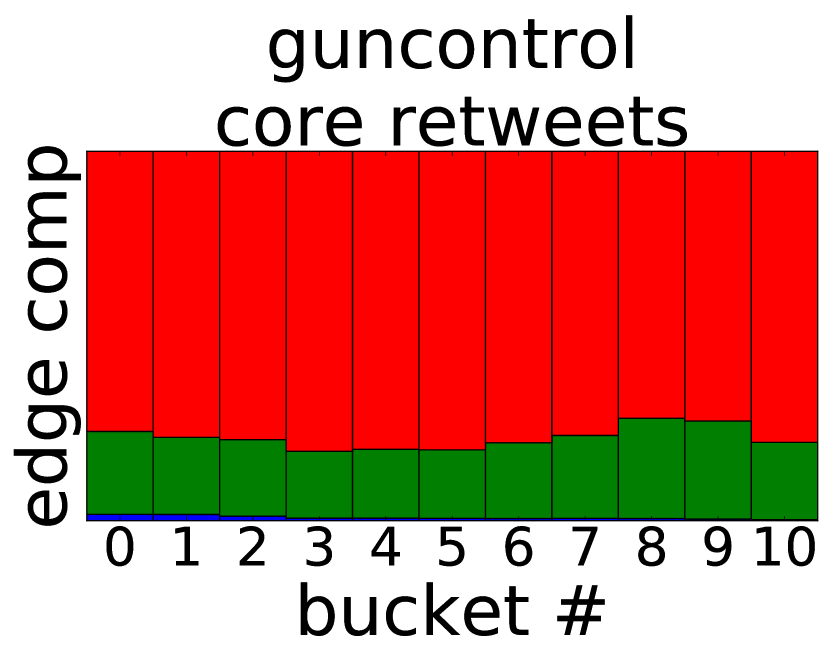
Sides edge composition. For a given network, we distinguish two types of edges: within-sides, where both adjacent nodes belong to the same side, and across-sides, where the adjacent nodes belong to different sides. For each day and network, we track the fraction of the two types of edges.
Core–periphery openness. This measure is defined as the number of edges that connect a node from the core to the periphery. It captures the amount of interaction between the hard core users and the casual ones. Formally,
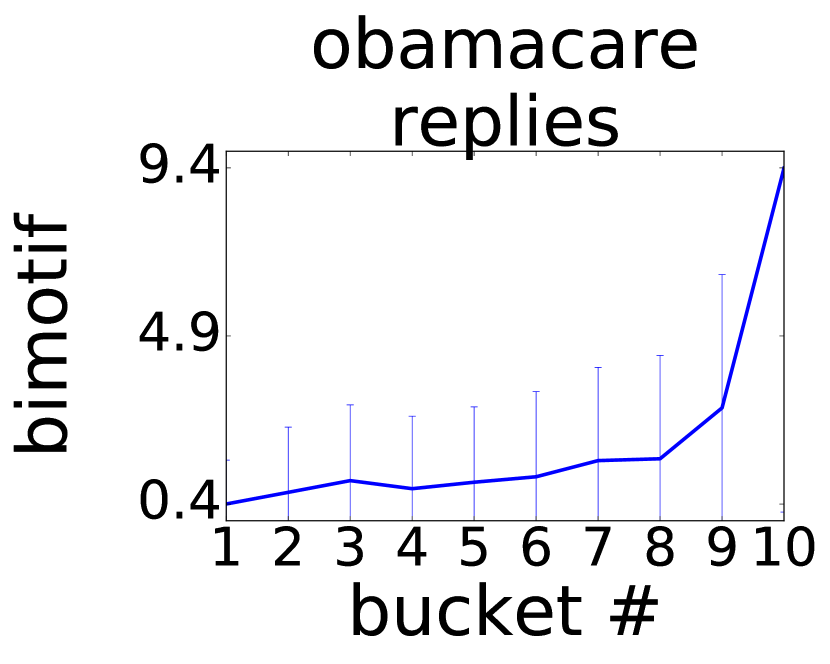
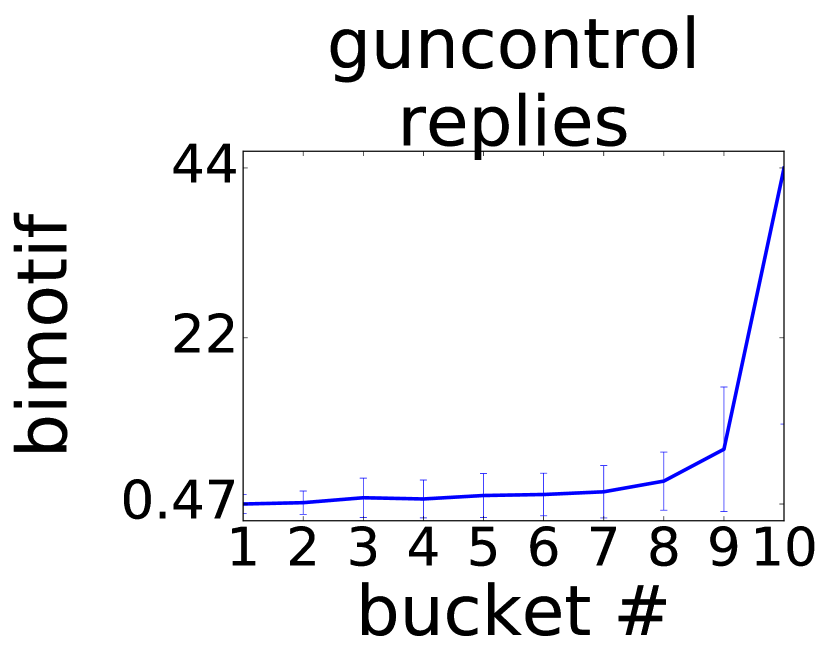
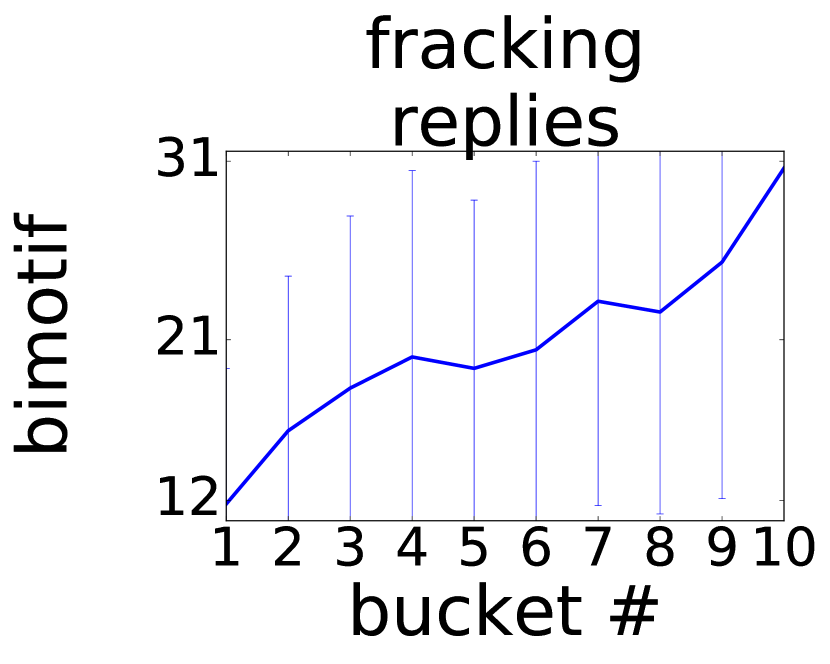
Bimotif. For a network , we define the bimotif measure as the number of directed edges for which the opposite edge also appears in the network
This measure captures the mutual interactions happening within the network. It is also known as ‘reciprocity’ in the literature.
Core Density. This measure captures the number of edges that connect exclusively members of the core
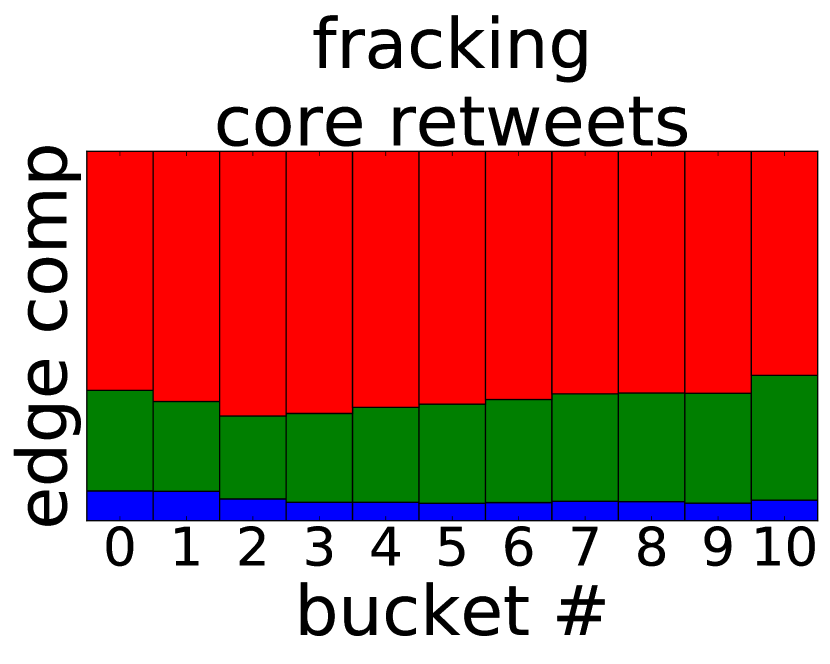
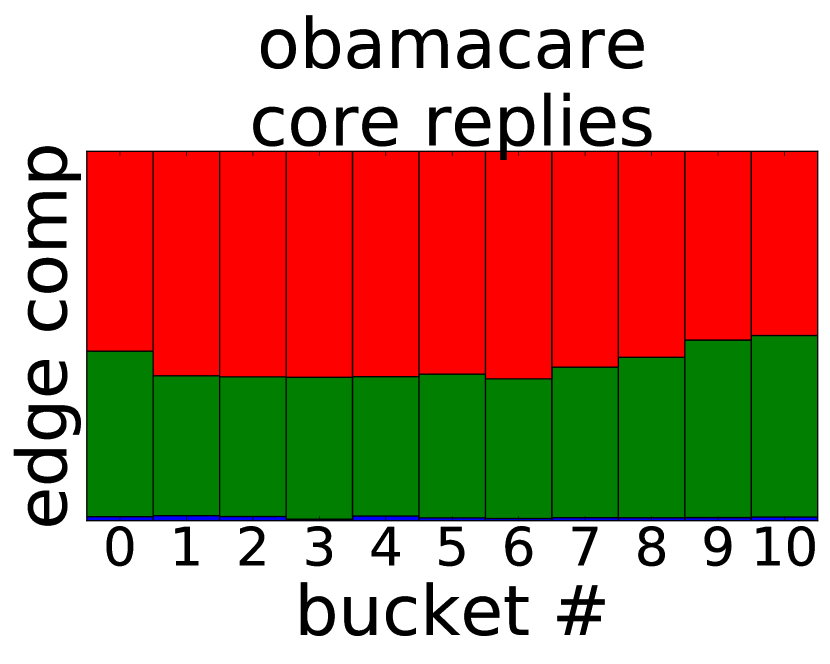
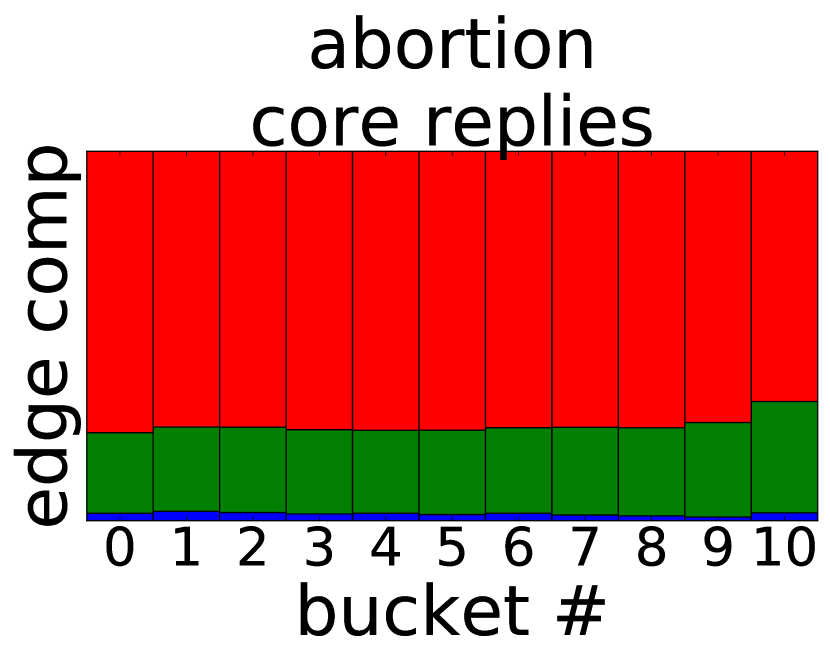
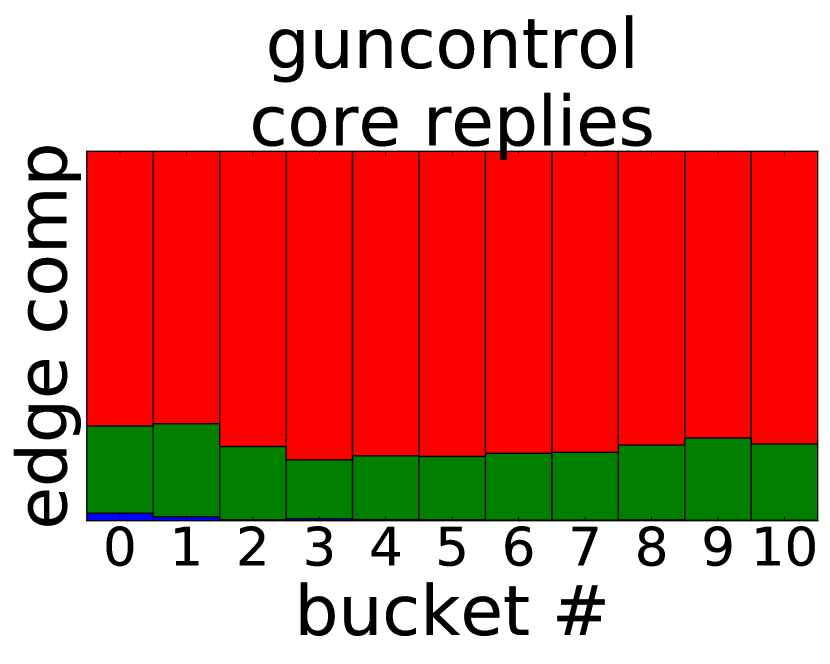
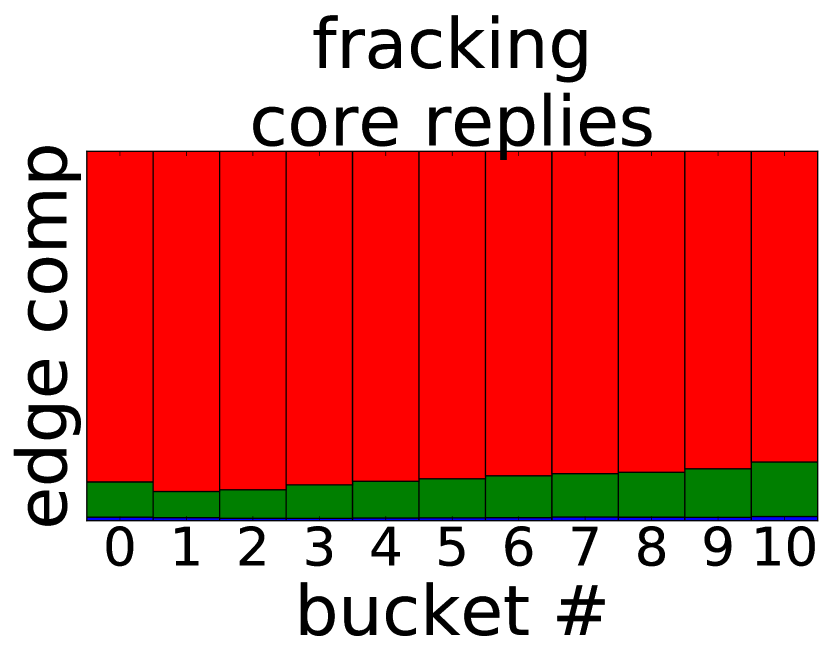
Core–periphery edge composition. For a given network, we distinguish three types of edges: core–core, where both adjacent nodes belong to the core we have identified, core–periphery, where one node belongs to the core and one to the periphery, and periphery–periphery, where both nodes belong to the periphery. For each day and network, we track the fraction of each type of edges.
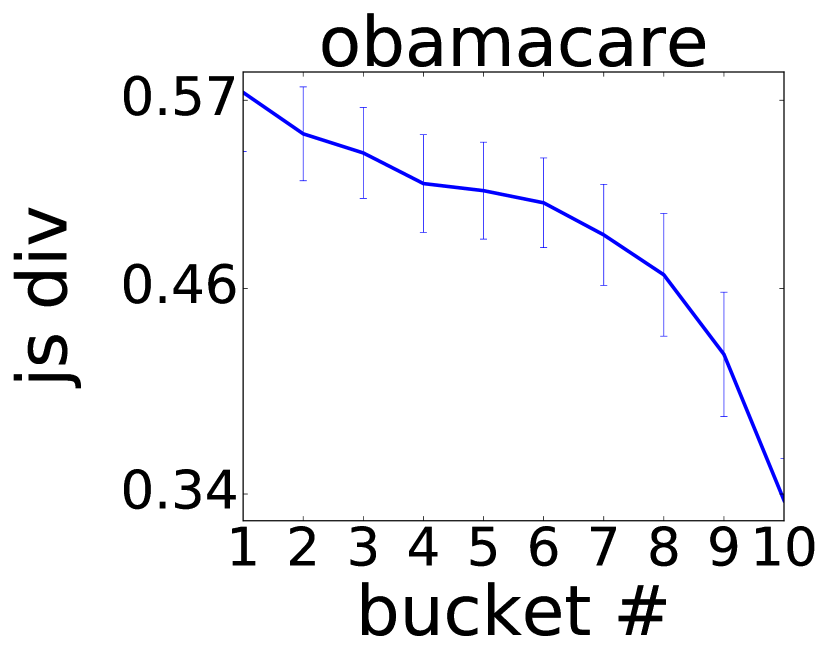
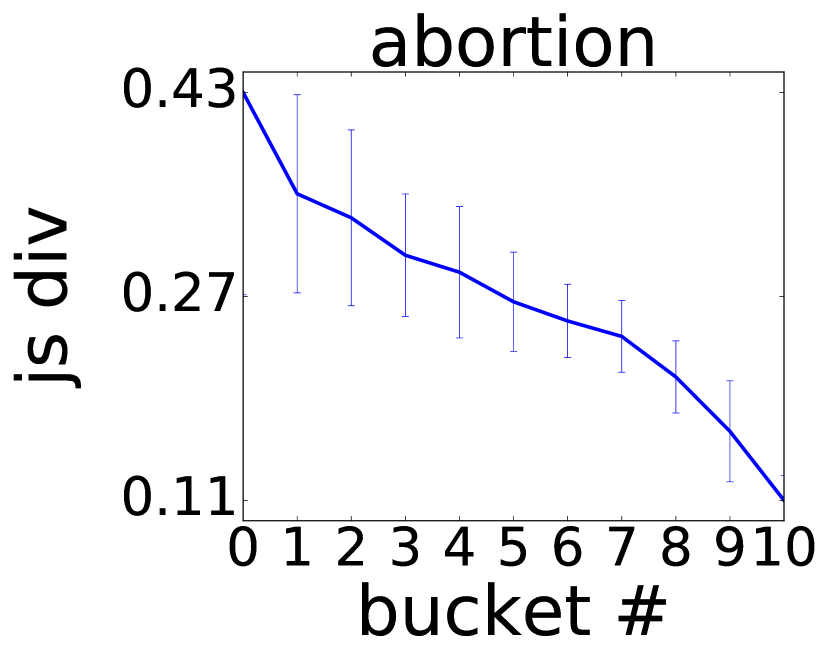
Cross–side content divergence. This measure captures the difference between the word distributions and , and is based on the Jensen-Shannon divergence (Lin, 1991). The Jensen-Shannon divergence is undefined when one of the two distributions is zero at a point where the other is not. Thus, we smooth the distributions by adding Laplace counts to avoid zero entries in either distribution.
The traffic volume on a given day can increase the vocabulary size, and thus induce an unwanted bias in the measure. In order to counter this bias, we employ a sampling procedure similar to bootstrapping from the two distributions. For each smoothed distribution and , we sample with replacement words at random, and compute the Jensen-Shannon divergence of these equal-sized samples. We repeat the process times and report the average sample Jensen-Shannon divergence as the ‘cross-side content divergence’ for day . Intuitively, the higher its value, the more different the word distributions across the two sides.
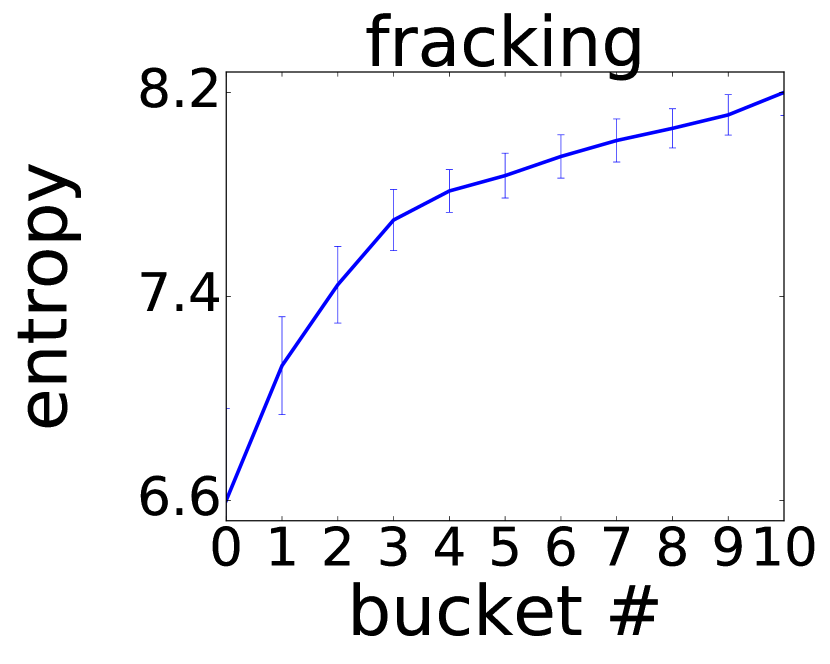
Within-side entropy. This measure captures how ‘concentrated’ each of the two distributions and is. For each side, we compute the entropy for each distribution. The higher its value, the more widely spread is the corresponding distribution. We use the same bootstrap sampling method described above to avoid bias due to activity volume.
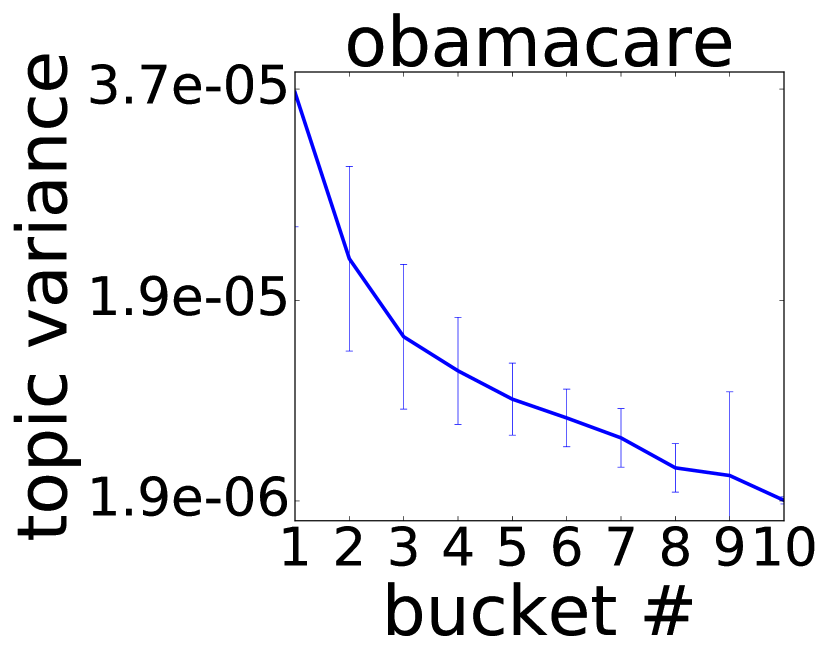
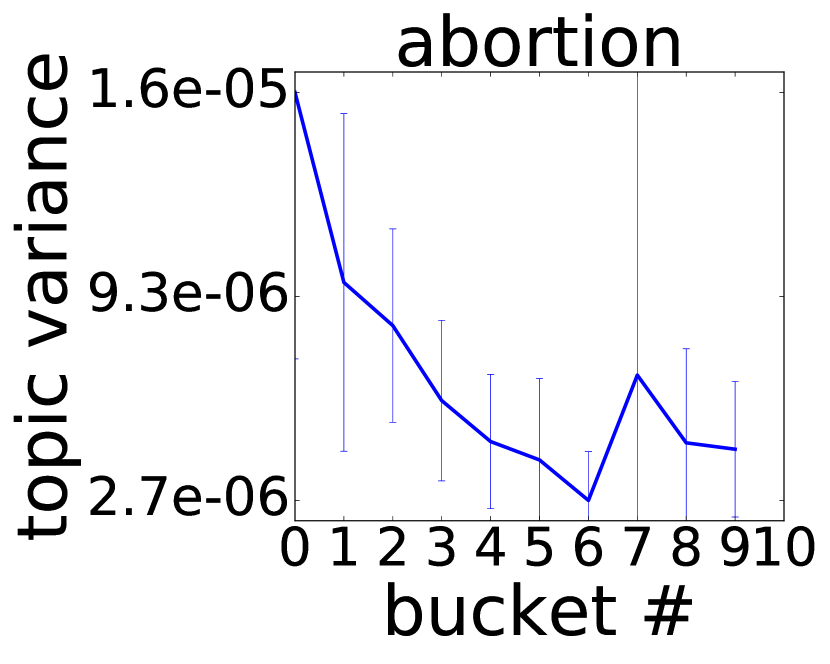
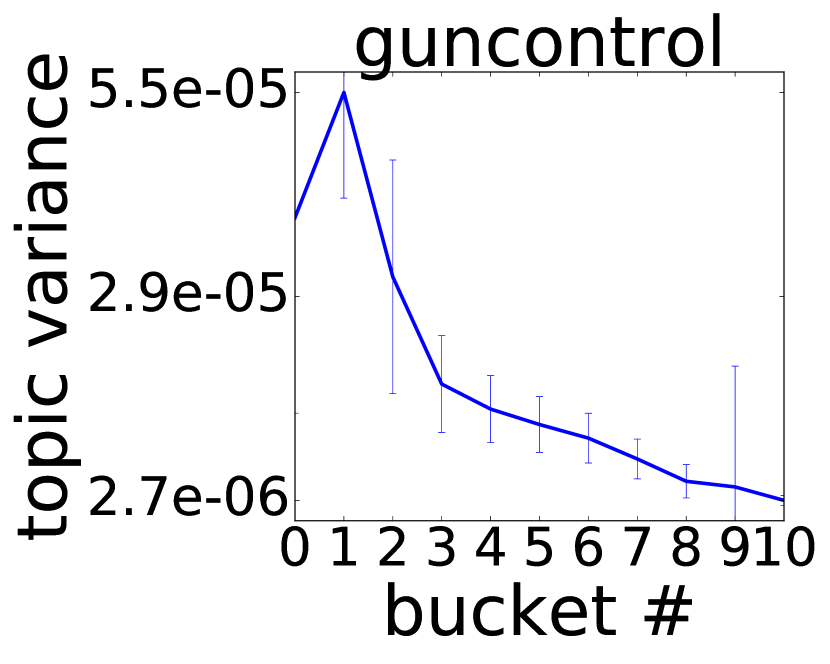
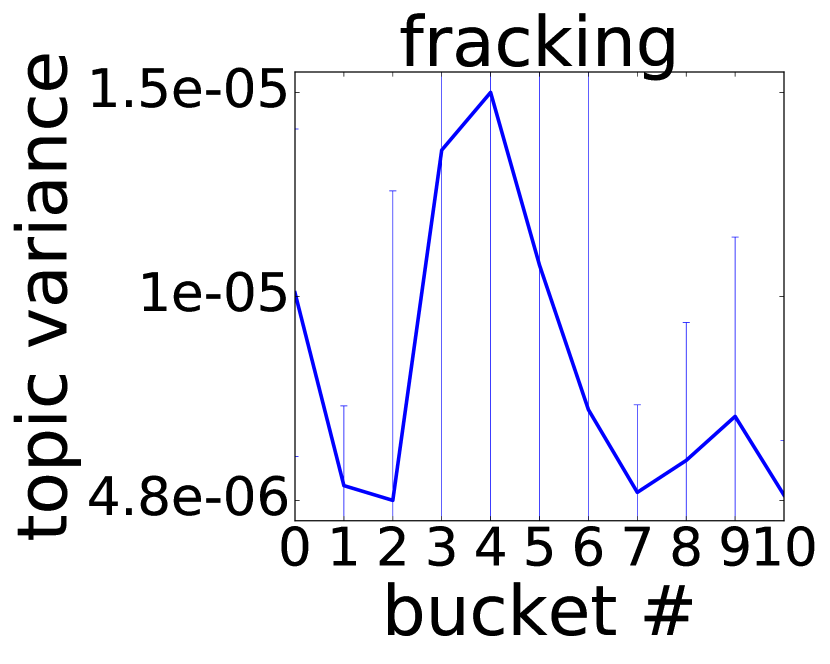
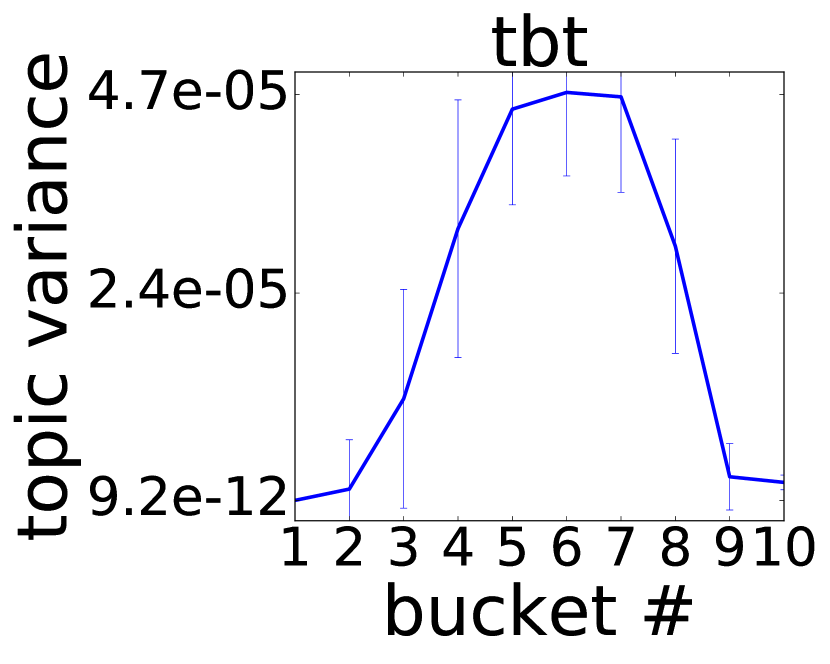
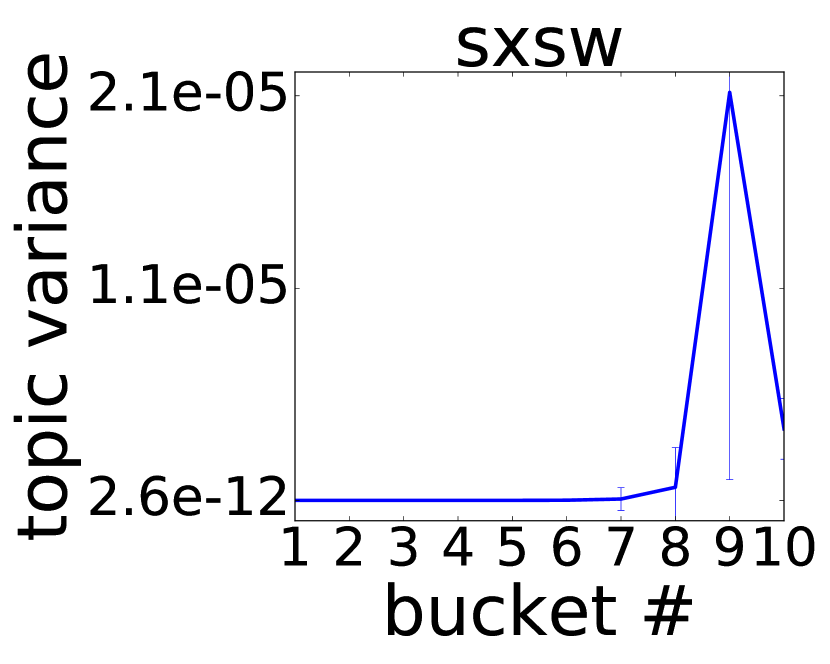
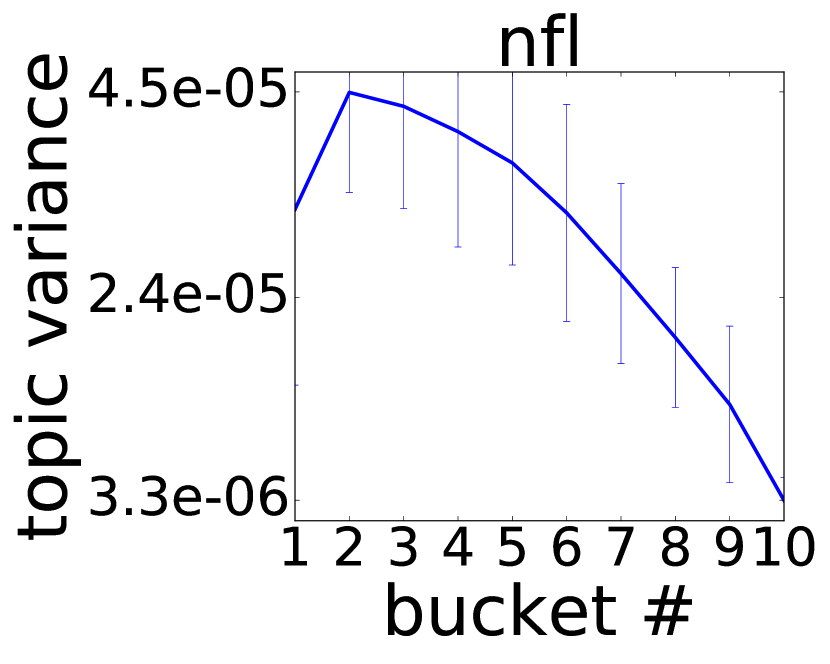
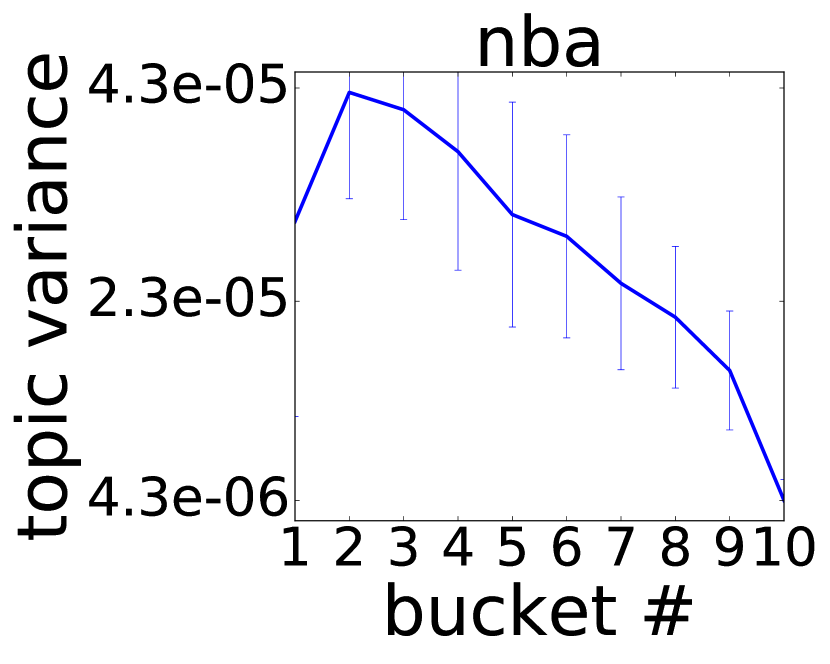
Topic variance. This measure captures, to some extent, is being talked on the two sides of the discussion. We extract a large number of topics by using Latent Dirichlet Allocation (k=100) on the complete tweet corpus. We then compute the distribution of topics in each bucket. This distribution gives an estimate on which of the 100 topics are being talked about in the bucket. We report the variance of this distribution. If the distribution is focused on a small number of topics, the variance is high. Conversely, a low variance indicates a uniform distribution of topics.
Sentiment variance. This measure captures the variance of sentiment valence (positive versus negative) in all the tweets of one day (Garimella et al., 2016).
Psychometric analysis. To understand the if there are behavioral changes in terms of content generated and shared by users with increasing activity, we use the Linguistic Inquiry and Word Count (LIWC) dictionary,999http://liwc.net which identifies emotions in words (Kramer et al., 2014). We measure the fraction of tweets containing the LIWC categories: anger, sadness, posemo, negemo, and anxiety.
4.1. Analysis
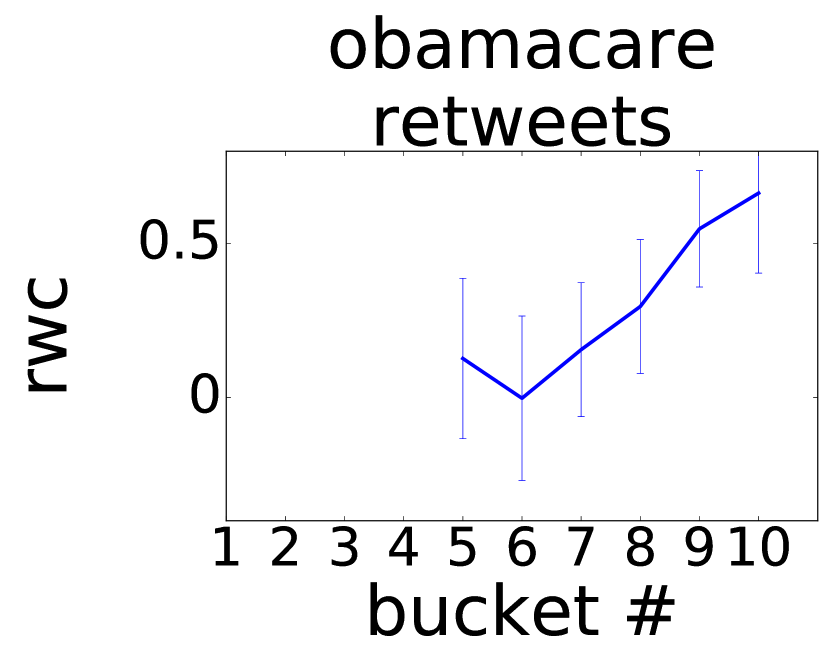
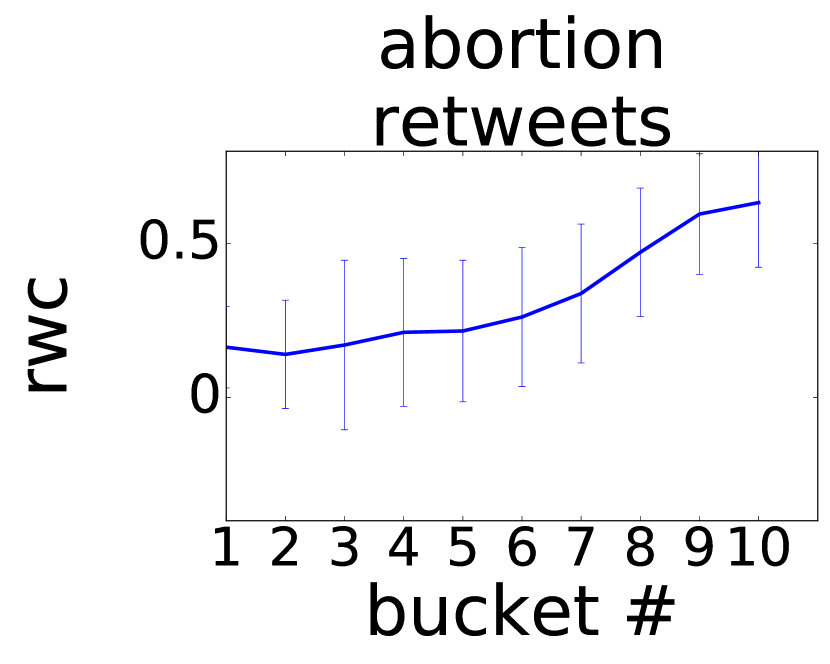
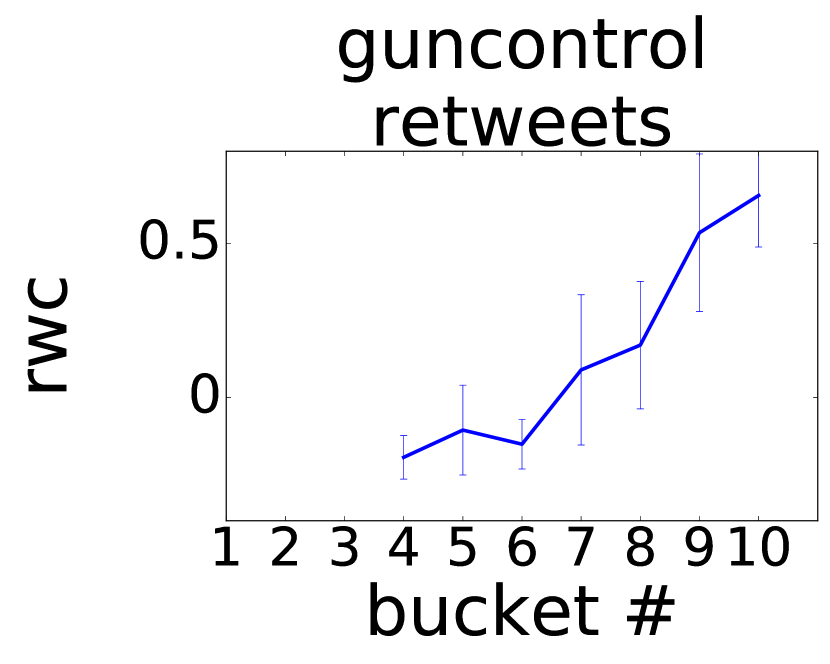
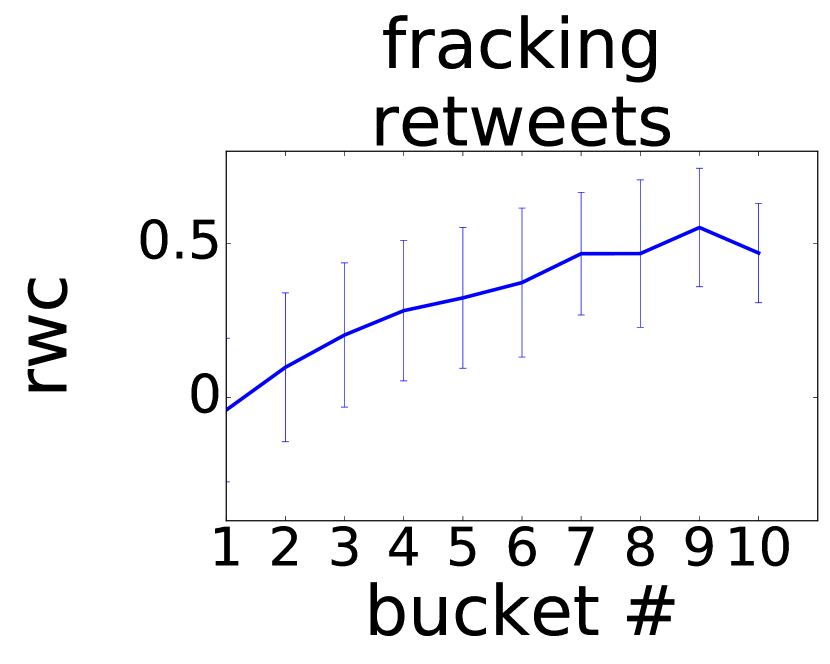
We explore how the aforementioned measures vary with the number of active users in the networks, which is a proxy for the amount of collective attention the topic attracts. We sort the time series of networks by volume of active users, and partition it into ten quantiles (each having an equal number of days), so that days of bucket are associated with smaller volume than those of bucket , for . For each bucket, we report the mean and standard deviation of the values for each measure, and observe the trend from lower to higher volume.
Note that the measures presented in this section are carefully defined so that their expected value does not depend on the volume of underlying activity (i.e., number of network nodes and edges or vocabulary size).
5. Findings
In what follows, we report our findings on the measures defined in Section 4 — starting from the ones related to the retweet and reply networks (Section 5.1), then proceeding to the ones related to content (Section 5.2) and network cores (Section 5.3). We provide additional analysis for the periods around the spikes in interest (Section 5.4), as well as for the evolution of measures over time (Section 5.5).
5.1. Network
We observe a significant correlation between RWC score and interest in the topic. Figure 2 shows the RWC score as a function of the quantiles of the network by retweet volume (as explained in the previous section). There is a clear increasing trend, which is consistent across topics. This trend suggests that increased interest in the topic is correlated with an increase in controversy of the debate, and increased polarization of the retweet networks for the two sides. Conversely, reply networks are sparser and more disconnected, thus, the RWC score is not meaningful in this case (not shown due to space constraints). This difference is expected, and was already observed in the work that introduced RWC (Garimella et al., 2016).
A similar result can be observed for the clustering coefficient, as shown in Figure 3. As the interest in the topic increases, the two sides tend to turtle up, and form a more close-knit retweet network. This result suggests that the echo chamber phenomenon gets stronger when the discussion sparks. Our finding is also consistent with results by Romero et al. (2016). As for the previous measure, the clustering coefficient does not show a significant pattern for the reply networks. Replies are often linked to dyadic interactions, while the clustering coefficient measures triadic ones, so we expect such a difference between the two types of network.
In line with the above results, tie strength is correlated with retweet volume, as indicated by Figure 4. When the discussion intensifies, users tend to endorse the opinions of their closest friends, or their trusted sources of information. Again, this observation indicates a closing up of both sides when the debate gets heated. Interestingly, a similar trend is present for the reply network, as shown in Figure 5. Differently from previous work, we find an increase of communication of users with their strong ties, rather than with weak ties or users of the opposing side. We also observe an increase in back-and-forth communication, indicating a dialogue between users of the same side. Figure 6 shows an increase in bimotifs in the reply network when the discussion intensifies. This measure is inconclusive for the retweet network, for the reasons mentioned above.
Finally, when calculating the fractions of within-side edges and across-side edges for across sides edge composition, we find that reply networks typically contain higher proportions of across-side activity compared to retweet networks, consistently with earlier work. In fact, for retweet networks, almost all edges are classified as within-side edges. Interestingly, we also find that these proportions do not change significantly as the volume increases. The same is true for the cross-side openness measure (not shown).
5.2. Content
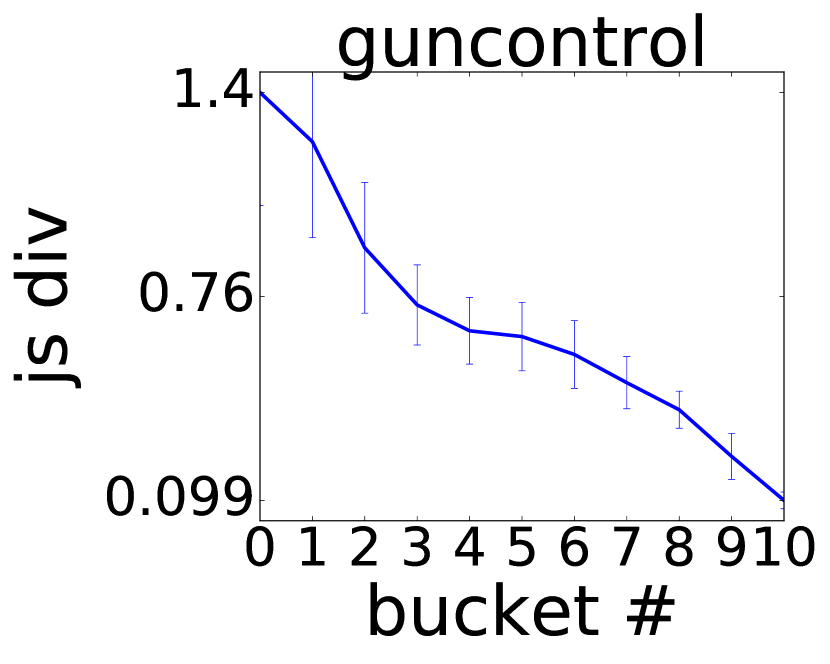
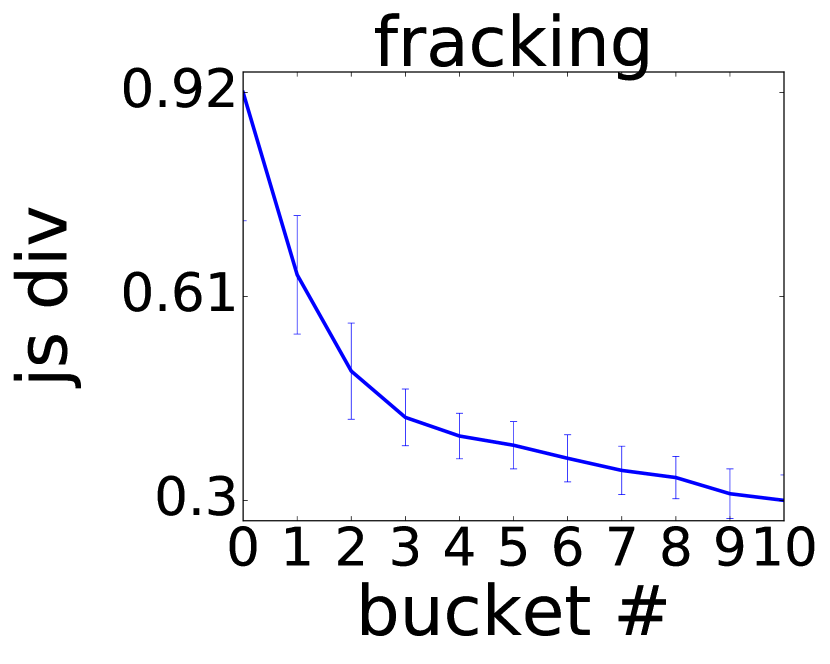
Let us now switch our attention to the content measures. Recall that for these measures we do not distinguish between retweet and reply networks, but only between the two sides of the discussion. The main observation is that the Jensen-Shannon divergence between the two sides decreases, as shown by Figure 7. This decrease indicates that the lexicon of the two sides tends to converge. The cause of this phenomenon might be the participation of casual users to the discussions, who contribute a more general lexicon to the discussion. Alternatively, the cause might be in the event that sparks the discussion, which brings the whole network to adopt similar lexicon to speak about it, i.e., there is an event-based convergence.
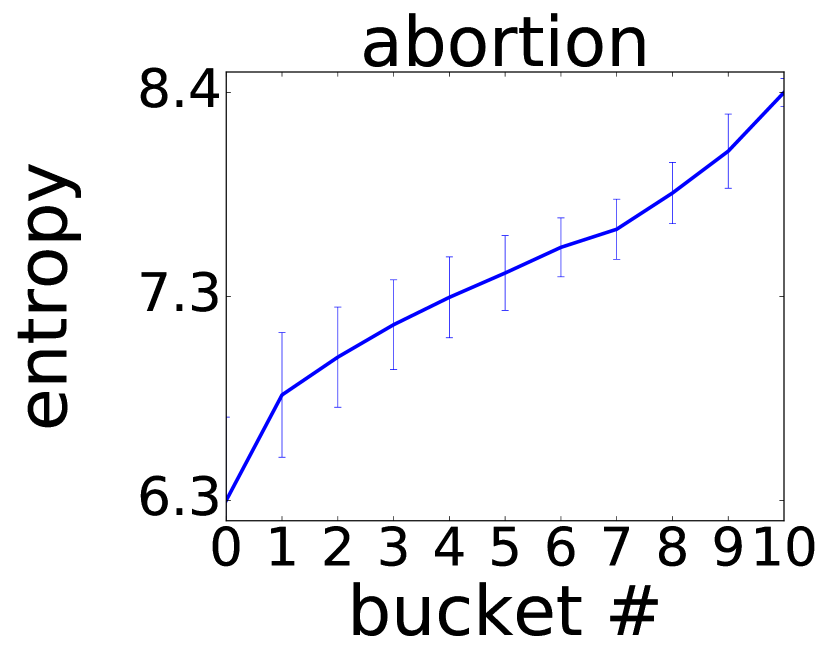
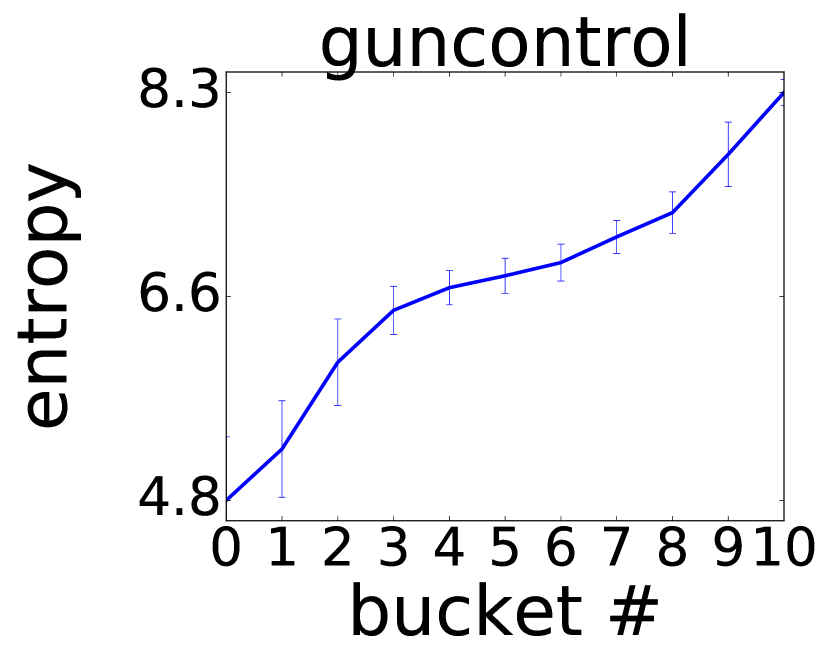
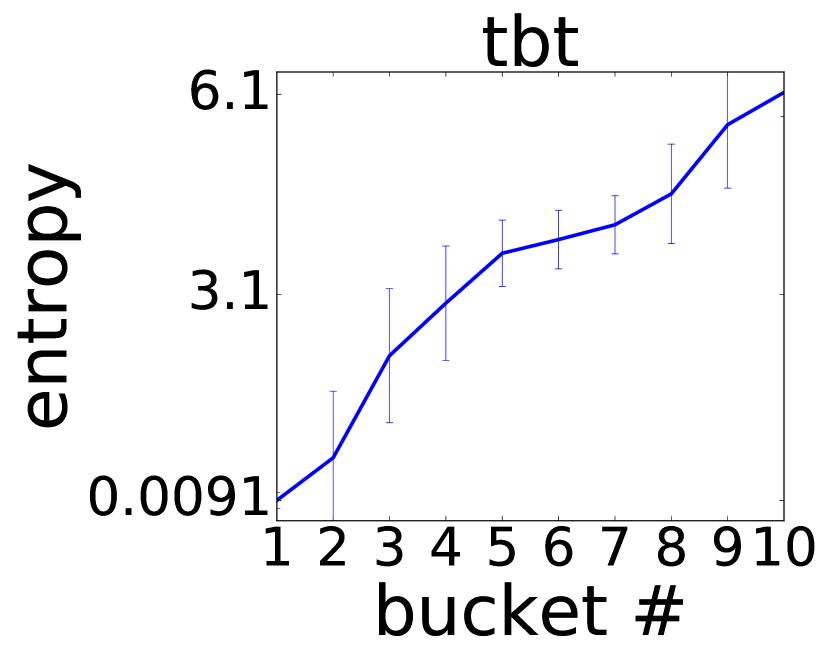
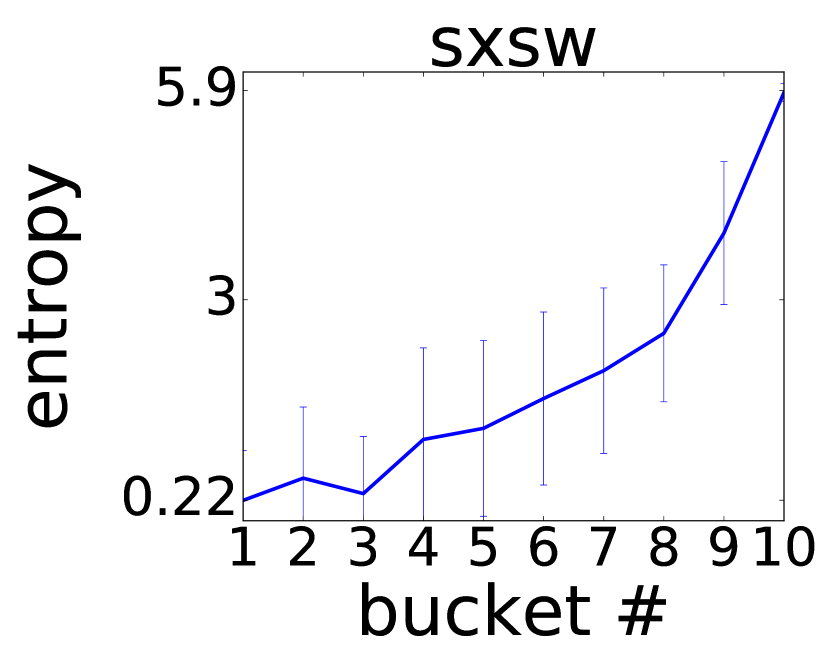
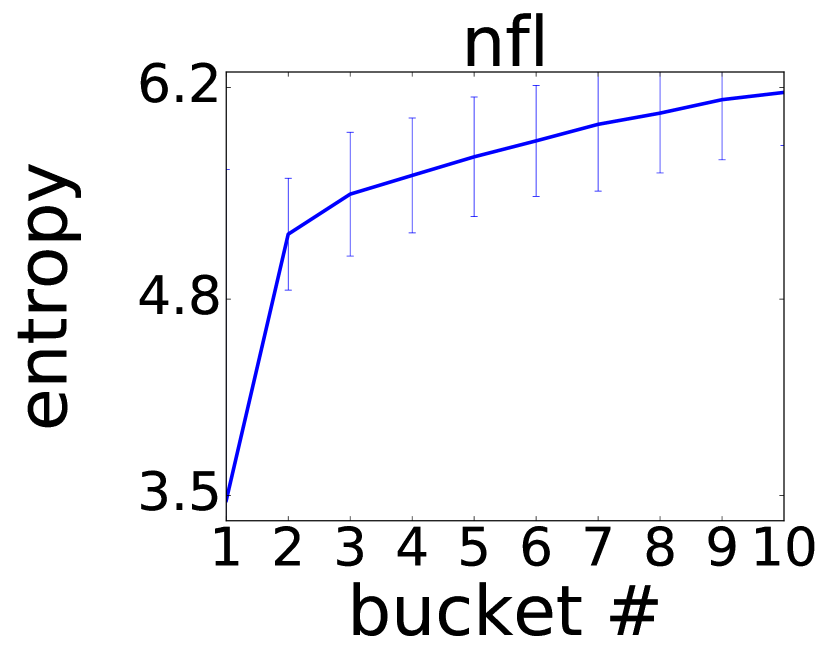
To further examine the cause of the convergence of lexicon, we report the entropy of the unigram distribution. Figure 8 shows that the entropy for one of the sides increases as interest increases (results for the other side show similar trends). Thus, we find that the lexicon is more uniform and less skewed, which supports the hypothesis that a larger group of users brings a more general lexicon to the discussion, rather than the alternative hypothesis of event-based convergence.
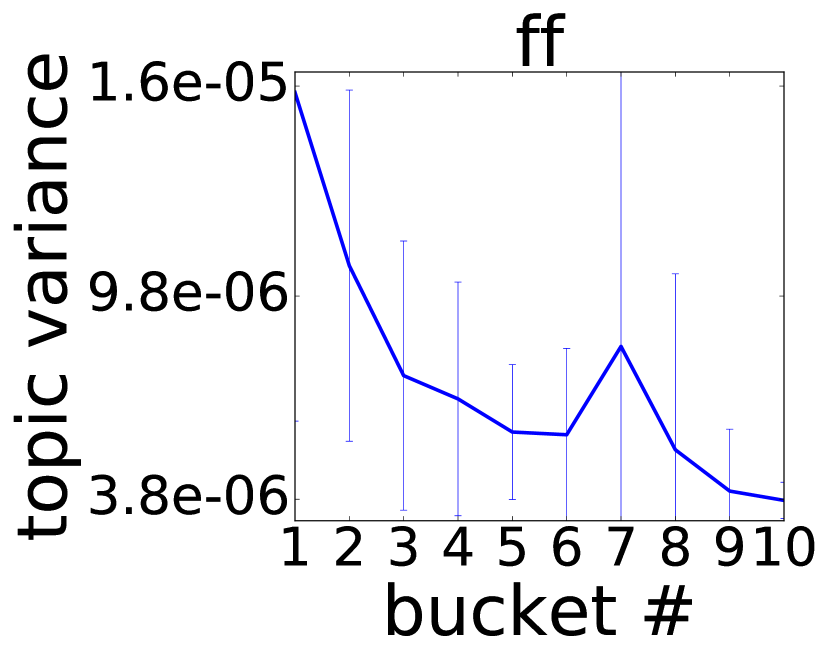
To investigate what causes the lexicon to be generalized, we compute the variance of the topic distribution for each bucket. As we see from Figure 9, the variance decreases with increased activity, meaning that the topic distribution becomes more uniform101010The term ‘fracking’ is also sometimes used as an expletive, which might explain why the effects we measure are not as pronounced for this topic as the other ones. E.g. see https://twitter.com/KitKat0122/status/19820978435522561. This result provides evidence that users do indeed discuss a wider range of topics when there is a spike in activity.
Finally, we also examine how the sentiment and other linguistic cues change with interest. We measure the variance in sentiment, fraction of tweets containing various LIWC categories, such as anger, sadness, positive and negative emotion, and anxiety. Previous work shows that sentiment variance is a measure able to separate controversial from non-controversial topics (Garimella et al., 2016) and linguistic patterns of communication change during shocks (Romero et al., 2016). However, we do not see any consistent trend. We hypothesise that this might be due to the noise in language (slang, sarcasm, short text, etc) on social media.
5.3. Core
Looking at the fractions of the different types of edges (core–core, core–periphery, and periphery–periphery) across the volume buckets in Figures 10 and 11, we see that the composition of edges does not change significantly with increase collective attention. This result suggests that the discussion grows in a self-similar way.
A disproportionately large fraction of edges link the periphery to the core, when taking into account the core size, as seen in Figure 10. During a spike in interest, most casual users, who seldom participate in the discussion, endorse opinions from the core of the side they belong to (red bars). For replies, we see a similar trend with respect to activity volume in Figure 11. In general, the core is less prevalent in the discussion, as shown by the lower fraction of core-periphery edges (green bars).
However, when looking at the core–periphery openness (Figures LABEL:fig:cpo-rt and LABEL:fig:cpo-re), we see that the normalized number of edges between core and periphery increases, i.e., the number of edges between core and periphery increases compared to the expected number based on a random-graph null model. To interpret this result, note that when the network grows, given that the periphery is much larger than the core, most edges for the null model are among periphery nodes. Therefore, the interaction networks show a clear hierarchical structure when growing.
5.4. Local analysis
So far, we have analyzed global trends across the time series. We now focus on local trends, to drill down on what happens around the spikes, and look at local variations of the measures just before and after the spike. We mark a day in the time series as a spike if the volume of active users is at least two standard deviations above the mean. Table 2 shows the Pearson correlation between various measures and network activity, one week before and after the spike. The trends observed globally still hold. There is a positive correlation of RWC with activity, which adds more evidence to our finding that polarization increases during spikes. The trends for bimotif, tie strength, and content divergence also persist, and are much stronger locally.
In addition to the previous measures, we also analyze other content features, such as the fraction of retweets, replies, mentions, and URLs around the spike. Interestingly, we find strong positive correlation of retweets, mentions, and URLs with volume, which indicates that discussion and endorsement increase during a spike. This finding is consistent with the ones by Smith et al. (2013), who find that users tend to add URLs to their tweets when discussing controversial topics. Note that these additional content measures are only indicative for the local analysis, and do not produce consistent results at the global level.
| Measure | Obamacare | Gun Control | Abortion | Fracking |
|---|---|---|---|---|
| RWC | 0.20 | 0.21 | 0.19 | 0.23 |
| Openness | -0.09* | 0.81 | 0.23 | 0.08 |
| Bimotif | 0.27 | 0.36 | 0.33 | 0.23 |
| Tie Strength | 0.96 | 0.98 | 0.95 | 0.86 |
| JSD | -0.66 | -0.86 | -0.63 | -0.46 |
| Entropy | 0.42 | 0.46 | 0.67 | 0.26 |
| Frac. RT | 0.15* | 0.6 | 0.59 | 0.56 |
| Frac. Men. | 0.20 | 0.71 | 0.54 | 0.51 |
| Frac. URL | 0.32 | 0.36 | 0.39 | 0.40 |
5.5. Evolution over time
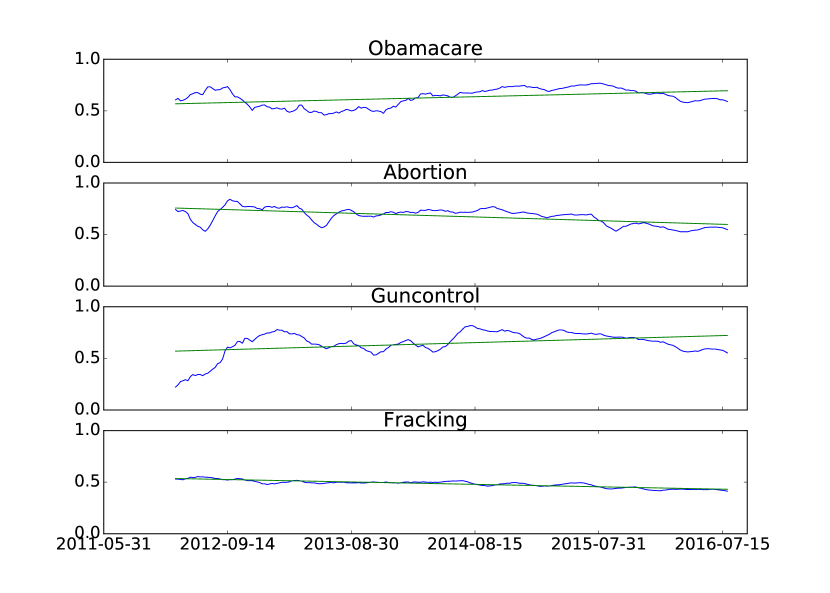
Let us now focus on how the measures change throughout time. The longitudinal span of the dataset of five years allows us to track the long-term evolution of discussion on controversial topics. A common point of view holds that social media is aggravating the polarization of society and exacerbating the divisions in it (Benkler, 2006). At the same time, the political debate (in U.S.) itself has become more polarized in recent years (Andris et al., 2015). However, we do not find conclusive evidence for this argument with our analysis on this dataset.
Figure 12 shows the long-term trends of the RWC measure for the four topics. The trend is downwards for ‘abortion’ and ‘fracking’, while it is upwards for ‘obamacare’ and ‘gun control’. One could argue that the latter topics are more politically linked to the current administration in U.S., and for this reason have received increasing attention with the elections approaching. However, the only safe conclusion that can be drawn from this dataset is that there is no clear signal. The figure suggests that social media, and in particular Twitter, are better suited at capturing the ‘twitch’ response of the public to events and news. In addition, while our dataset spans a quite long time span for typical social media studies, it is still much shorter than other ones used typically in social science (coming from, e.g., census, polls, congress votes). This limit is intrinsic of the tool, given that social media have risen in popularity only relatively recently (e.g., Twitter is 10 years old).
5.6. Non-controversial topics
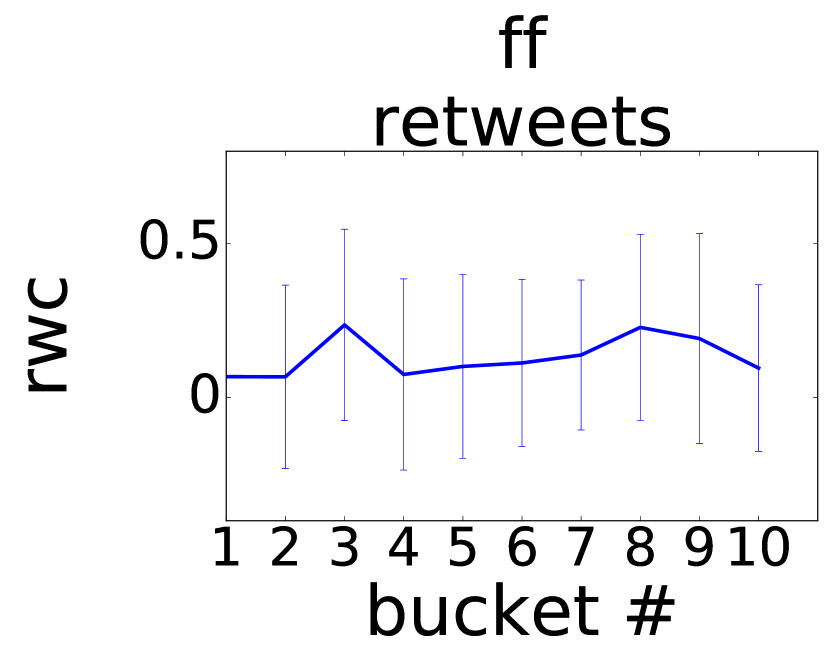
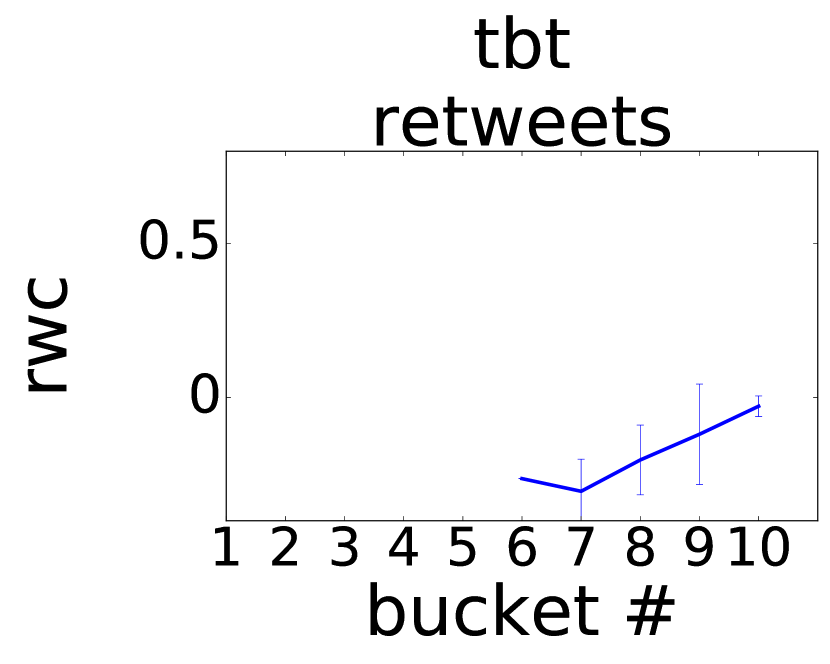
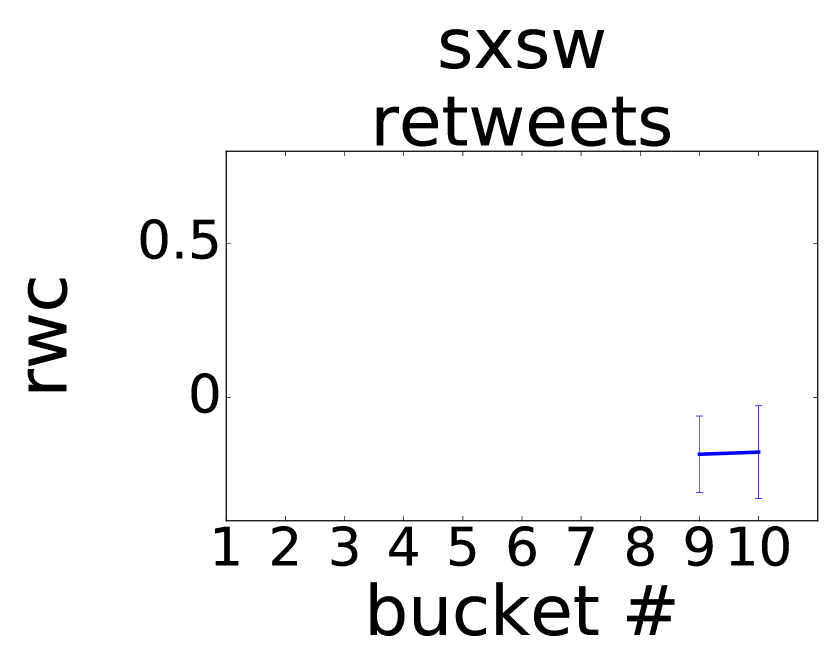
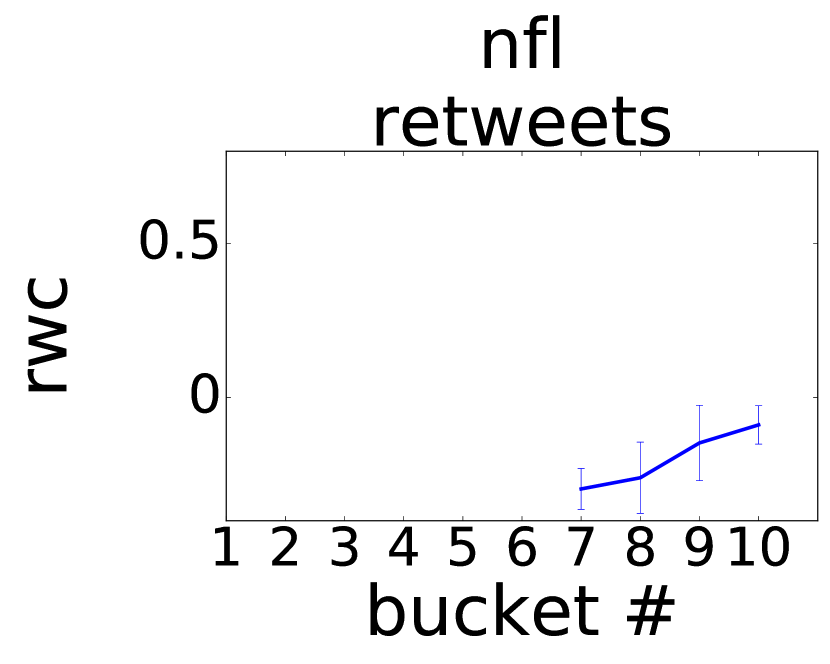
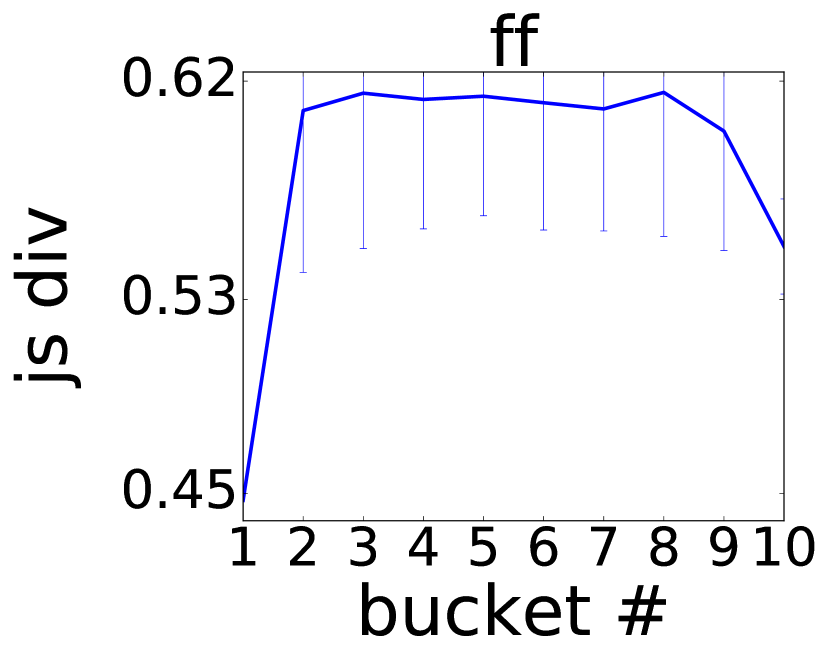
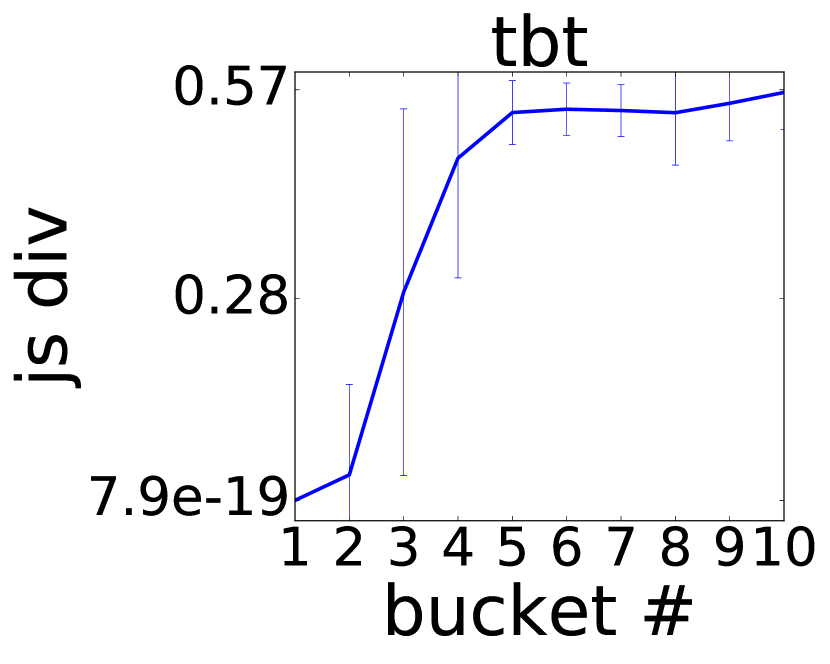
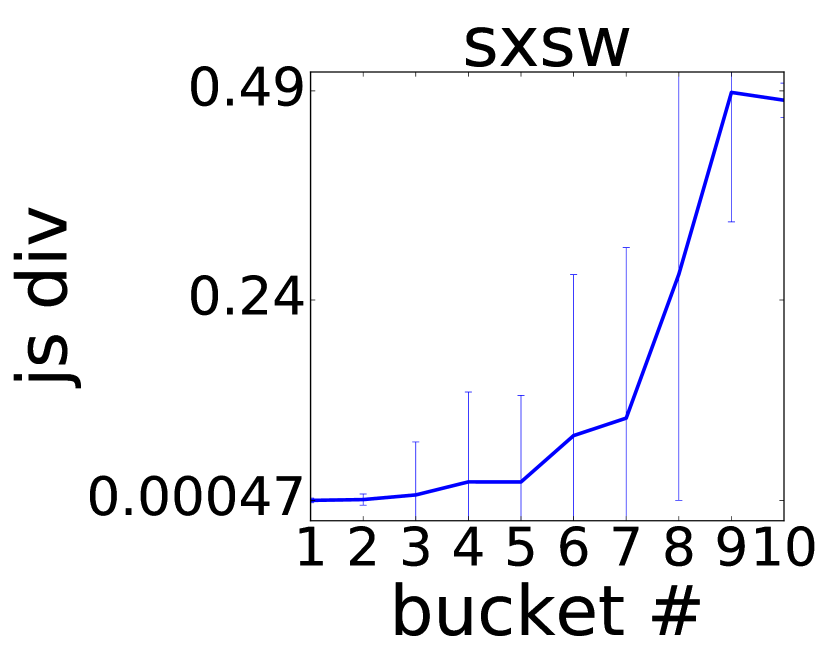
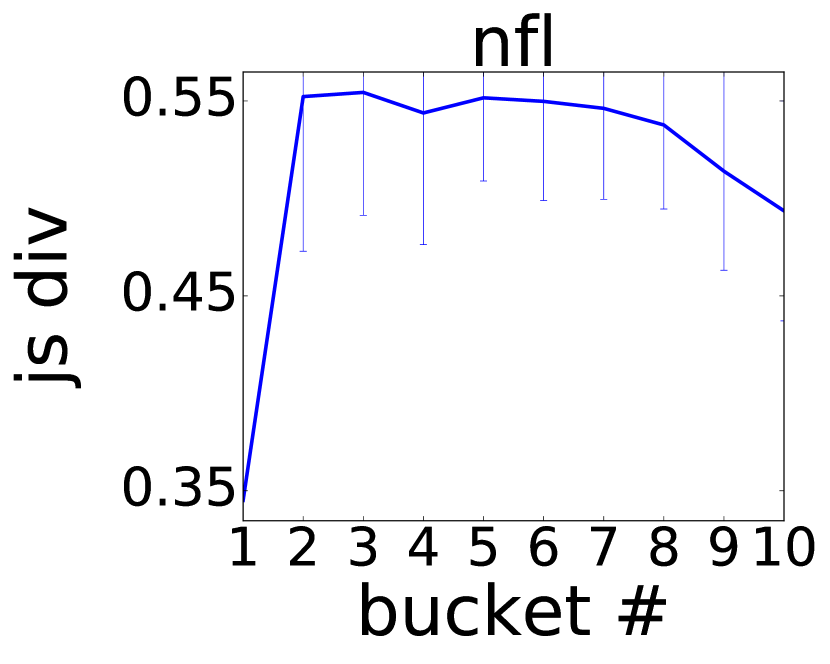
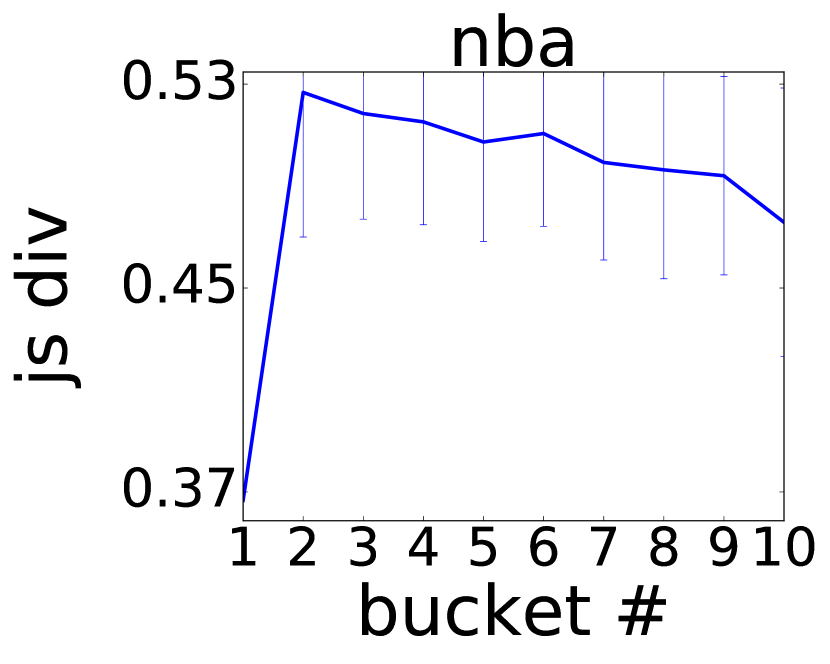
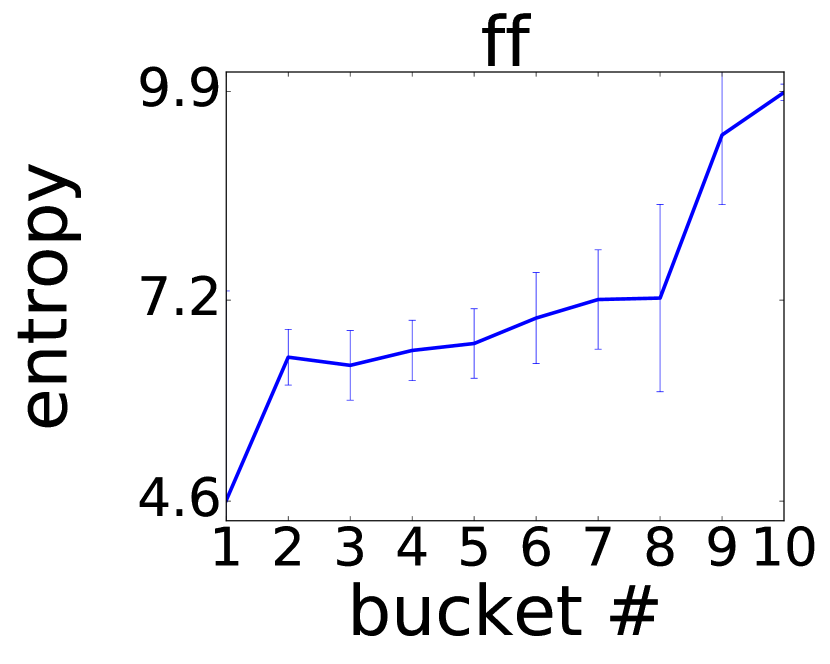
For comparison, we perform measurements over a set of non-controversial topics, defined by the hashtags #ff, standing for ‘Follow Friday’, used every Friday by users to recommend interesting accounts to follow; #nba and #nfl, used to discuss sports games; #sxsw, used to comment on the South-by-South-West conference; #tbt, standing for ‘Throwback Thursday’, used every Thursday by users to share memories (news, pictures, stories) from the past.
We find that several structural measures, namely clustering coefficient, tie strength, and bimotif, behave similarly to the controversial topics, in that they obtain increased values for increased volume of activity. This result is in accordance with the ones by Romero et al. (2016). Conversely, the values of the RWC measure typically remain in ranges that indicate low presence of controversy, even as the volume of activity spikes (Figure 13). Additionally, with the definition of ‘core’ introduced above, we could only identify a negligibly small core for these topics (i.e., found very few users who were consistently active on these topics).
Finally, in terms of content measures we find that, as for the controversial topics, the entropy of the lexicon increases with volume (Figure 15). Topic variance also decreases with volume in most cases, meaning that a wider range of topics are discussed (Figure 16). On the contrary, the Jensen-Shannon divergence stays at relatively constant values across volume levels (Figure 14). It thus behaves differently compared to controversial topics (Figure 7). This result is to be expected, as the two ‘sides’ identified by METIS on the networks of non-controversial topics are not as well defined as they are in the case of controversial topics.


6. Conclusion
The evolution of networks is a well-studied phenomenon in social sciences, physics, and computer science. However, the evolution of interaction networks has received substantially less attention so far. In particular, interaction networks related to discussions of controversial topics, which are important from a sociological point of view, have not been analyzed before. This study is a first step towards understanding this important social phenomenon.
We analyzed four highly controversial topics of discussion on Twitter for a period of five years. By examining the endorsement and communication networks of users involved in these discussions, we found that spikes in interest correspond to an increase in the controversy of the discussion. This result is supported by a wide array of network analysis measures, and is consistent across topics. We also found that interest spikes correspond to a convergence of the lexicon used by the opposite sides of a controversy, and a more uniform lexicon overall. The code and datasets used in the paper are available on the project website.8
Implications of this work relate to the understanding of how our society evolves via continuous debates, and how culture wars develop (Abramowitz and Saunders, 2005; Highton and Kam, 2011; Lindaman and Haider-Markel, 2002). It is often argued that technology, and social media in particular, is having a negative impact on our ability to relate to the unfamiliar (Benkler, 2006), due to the “echo chamber” and “filter bubble” effects. However, while we found instantaneous temporary increase in controversy in relation to external events, our study did not find evidence of long term increase in polarization of the discussions, neither after these events nor as a general longitudinal trend. At the same time, investigating how to reduce the polarization of these discussions on controversial topics is a research-worthy problem (Garimella et al., 2017a, 2017), and taking into account the dynamics of the process is a promising direction to explore.
Our observations pave the way to the development of models of evolution for controversial interaction networks, similarly to how studies about measuring the Web and social media were the stepping stone to developing models for them. A logical next step for this line of work is to investigate how to use early signals from social media network structure and content to predict the impact of an event. Equally of interest is whether the observations made in this study translate to other social media beside Twitter, for instance, Facebook or Reddit. Finally, while we did not find any consistent long-term trend in the polarization of the discussions, it is worth continuing this line of investigation, as the effects of increased polarization might not be easily discoverable from social-media analysis alone.
Acknowledgements. This work has been supported by the Academy of Finland project “Nestor” (286211) and the EC H2020 RIA project “SoBigData” (654024).
References
- (1)
- Abramowitz and Saunders (2005) Alan Abramowitz and Kyle Saunders. 2005. Why can’t we all just get along? The reality of a polarized America. In The Forum, Vol. 3. bepress, 1–22.
- Adamic and Glance (2005) Lada A Adamic and Natalie Glance. 2005. The political blogosphere and the 2004 US election: divided they blog. In LinkKDD. 36–43.
- Ahn et al. (2007) Yong-Yeol Ahn, Seungyeop Han, Haewoon Kwak, Sue Moon, and Hawoong Jeong. 2007. Analysis of topological characteristics of huge online social networking services. In WWW. ACM, 835–844.
- Andris et al. (2015) Clio Andris, David Lee, Marcus J Hamilton, Mauro Martino, Christian E Gunning, and John Armistead Selden. 2015. The rise of partisanship and super-cooperators in the US House of Representatives. PloS one 10, 4 (2015), e0123507.
- Benkler (2006) Yochai Benkler. 2006. The wealth of networks: How social production transforms markets and freedom. Yale University Press.
- Bessi et al. (2014) Alessandro Bessi, Guido Caldarelli, Michela Del Vicario, Antonio Scala, and Walter Quattrociocchi. 2014. Social determinants of content selection in the age of (mis) information. In SocInfo. Springer, 259–268.
- Conover et al. (2011) Michael Conover, Jacob Ratkiewicz, Matthew Francisco, Bruno Gonçalves, Filippo Menczer, and Alessandro Flammini. 2011. Political Polarization on Twitter. In ICWSM.
- De Francisci Morales et al. (2012) Gianmarco De Francisci Morales, Aristides Gionis, and Claudio Lucchese. 2012. From Chatter to Headlines: Harnessing the Real-Time Web for Personalized News Recommendation. In WSDM. 153–162.
- DiFonzo et al. (2014) Nicholas DiFonzo, Jerry Suls, Jason W Beckstead, Martin J Bourgeois, Christopher M Homan, Samuel Brougher, Andrew J Younge, and Nicholas Terpstra-Schwab. 2014. Network structure moderates intergroup differentiation of stereotyped rumors. Social Cognition 32, 5 (2014), 409.
- Dorogovtsev and Mendes (2013) Sergei N Dorogovtsev and José FF Mendes. 2013. Evolution of networks: From biological nets to the Internet and WWW. OUP Oxford.
- Garimella et al. (2017) Kiran Garimella, Gianmarco De Francisc iMorales, Aristides Gionis, and Michael Mathioudakis. 2017. Mary, Mary, Quite Contrary: Exposing Twitter Users to Contrarian News. In WWW. 201–205.
- Garimella et al. (2016) Kiran Garimella, Gianmarco De Francisci Morales, Aristides Gionis, and Michael Mathioudakis. 2016. Quantifying Controversy in Social Media. In WSDM. ACM, 33–42.
- Garimella et al. (2017a) Kiran Garimella, Gianmarco De Francisci Morales, Aristides Gionis, and Michael Mathioudakis. 2017a. Reducing Controversy by Connecting Opposing Views. In WSDM. ACM, 81–90.
- Garimella et al. (2017b) Kiran Garimella, Gianmarco De Francisci Morales, Aristides Gionis, and Michael Mathioudakis. 2017b. The Ebb and Flow of Controversial Debates on Social Media. In ICWSM.
- Garimella and Weber (2017) Kiran Garimella and Ingmar Weber. 2017. A Long-Term Analysis of Polarization on Twitter. In ICWSM.
- Highton and Kam (2011) Benjamin Highton and Cindy D Kam. 2011. The long-term dynamics of partisanship and issue orientations. The Journal of Politics 73, 01 (2011), 202–215.
- Karypis and Kumar (1995) George Karypis and Vipin Kumar. 1995. METIS - Unstructured Graph Partitioning and Sparse Matrix Ordering System. (1995).
- Kramer et al. (2014) Adam DI Kramer, Jamie E Guillory, and Jeffrey T Hancock. 2014. Experimental evidence of massive-scale emotional contagion through social networks. Proceedings of the National Academy of Sciences 111, 24 (2014), 8788–8790.
- Lehmann et al. (2012) Janette Lehmann, Bruno Gonçalves, José J. Ramasco, and Ciro Cattuto. 2012. Dynamical Classes of Collective Attention in Twitter. In WWW. ACM, 251–260.
- Leskovec et al. (2008) Jure Leskovec, Lars Backstrom, Ravi Kumar, and Andrew Tomkins. 2008. Microscopic evolution of social networks. In KDD. ACM, 462–470.
- Leskovec et al. (2005) Jure Leskovec, Jon Kleinberg, and Christos Faloutsos. 2005. Graphs over time: densification laws, shrinking diameters and possible explanations. In KDD. ACM, 177–187.
- Lin (1991) Jianhua Lin. 1991. Divergence measures based on the Shannon entropy. IEEE Transactions on Information theory 37, 1 (1991), 145–151.
- Lindaman and Haider-Markel (2002) Kara Lindaman and Donald P Haider-Markel. 2002. Issue evolution, political parties, and the culture wars. Political Research Quarterly 55, 1 (2002), 91–110.
- Liu and Weber (2014) Zhe Liu and Ingmar Weber. 2014. Is Twitter a public sphere for online conflicts? A cross-ideological and cross-hierarchical look. In SocInfo. Springer, 336–347.
- Lu et al. (2015) Haokai Lu, James Caverlee, and Wei Niu. 2015. BiasWatch: A Lightweight System for Discovering and Tracking Topic-Sensitive Opinion Bias in Social Media. In CIKM. ACM, 213–222.
- Mejova et al. (2014) Yelena Mejova, Amy X Zhang, Nicholas Diakopoulos, and Carlos Castillo. 2014. Controversy and Sentiment in Online News. Symposium on Computation + Journalism (2014).
- Morales et al. (2015) AJ Morales, J Borondo, JC Losada, and RM Benito. 2015. Measuring political polarization: Twitter shows the two sides of Venezuela. Chaos 25, 3 (2015).
- Morstatter et al. (2013) Fred Morstatter, Jürgen Pfeffer, Huan Liu, and Kathleen M Carley. 2013. Is the sample good enough? Comparing data from Twitter’s streaming API with Twitter’s firehose. arXiv:1306.5204 (2013).
- Newman et al. (2011) Mark Newman, Albert-Laszlo Barabasi, and Duncan J Watts. 2011. The structure and dynamics of networks. Princeton University Press.
- Romero et al. (2016) Daniel M Romero, Brian Uzzi, and Jon Kleinberg. 2016. Social Networks Under Stress. In WWW. 9–20.
- Smith et al. (2013) Laura M Smith, Linhong Zhu, Kristina Lerman, and Zornitsa Kozareva. 2013. The role of social media in the discussion of controversial topics. In SocialCom. IEEE, 236–243.
- Wu and Huberman (2007) Fang Wu and Bernardo A. Huberman. 2007. Novelty and collective attention. Proceedings of the National Academy of Sciences 104, 45 (2007), 17599–17601.