A Complete ALMA Map of the Fomalhaut Debris Disk
Abstract
We present ALMA mosaic observations at 1.3 mm (223 GHz) of the Fomalhaut system with a sensitivity of 14 Jy/beam. These observations provide the first millimeter map of the continuum dust emission from the complete outer debris disk with uniform sensitivity, enabling the first conclusive detection of apocenter glow. We adopt a MCMC modeling approach that accounts for the eccentric orbital parameters of a collection of particles within the disk. The outer belt is radially confined with an inner edge of AU and width of AU. We determine a best-fit eccentricity of . Assuming a size distribution power law index of , we constrain the dust absorptivity power law index to be . The geometry of the disk is robustly constrained with inclination , position angle , and argument of periastron . Our observations do not confirm any of the azimuthal features found in previous imaging studies of the disk with HST, SCUBA, and ALMA. However, we cannot rule out structures AU in size or which only affect smaller grains. The central star is clearly detected with a flux density of mJy, significantly lower than predicted by current photospheric models. We discuss the implications of these observations for the directly imaged Fomalhaut b and the inner dust belt detected at infrared wavelengths.
1 Introduction
The proximity of Fomalhaut ( pc, van Leeuwen, 2007) has resulted in its debris disk being one of the best-studied. With an age of Myr (Mamajek, 2012), Fomalhaut is at a stage when significant dynamical activity can still occur, as indicated by the period of Late Heavy Bombardment in our own Solar System, an epoch that has important implications for the final architecture of the planetary system. The outer debris disk is located at AU, and has been resolved at a range of wavelengths spanning from optical to radio (Holland et al., 1998; Kalas et al., 2005, 2008, 2013; Acke et al., 2012; Ricci et al., 2012; Boley et al., 2012; White et al., 2016). In addition to the cold ( K) outer belt, the system has a warm ( K), unresolved inner component detected as excess emission at infrared wavelengths with both Spitzer and Herschel (Stapelfeldt et al., 2004; Su et al., 2013). Su et al. (2016) placed limits on the radial location of this inner belt between AU with a non-detection from the Atacama Large Millimeter/submillimeter Array (ALMA). Direct imaging has also revealed the presence of a very low mass object, Fomalhaut b, near the outer disk and with a highly eccentric orbit (Kalas et al., 2008, 2013). Given its unique characteristics and architecture, the Fomalhaut system is a Rosetta stone for understanding the interaction between planetary systems and debris disks studying which will enhance our physical understanding of more distant planetary systems.
Dusty debris disks, like the Fomalhaut system, are produced from the continual collisional erosion of larger planetesimals, similar to asteroids or comets. The resulting dust is shaped by the larger bodies or planets in the system through collisions and gravitational perturbations, imprinting observable signatures in the structure of the disk. For example, an interior planet on an eccentric orbit can impose a forced eccentricity on the dust particles in the disk (Wyatt et al., 1999). Such a planet could also sculpt a sharp interior edge (Quillen, 2006; Chiang et al., 2009). The outward migration of a planet can radially confine the belt between resonances (Hahn & Malhotra, 2005), similar to Neptune in our own Solar System, or trap dust into mean motion resonance outside its orbit (Kuchner & Holman, 2003; Wyatt, 2003; Deller & Maddison, 2005). Observations at millimeter wavelengths offer an advantage for probing these planetary-induced structures, since the large grains that emit predominantly at these wavelengths are not significantly perturbed by radiation forces and better trace the location of the larger planetesimals. Previous resolved images have revealed that the Fomalhaut debris disk is both radially confined and significantly eccentric. However, there has yet to be a complete map of the disk structure at millimeter wavelengths, necessary to probe for azimuthal disk structure that might stem from planetary interactions.
Here, we present new mosaic observations with the Atacama Large Millimeter/submillimeter Array (ALMA) of the Fomalhaut debris disk, which build the first complete millimeter map of the system at the current epoch. By mapping the outer belt with uniform sensitivity, we are able to place constraints on the azimuthal structure of the belt and make the first robust observational detection of apocenter glow. In Section 2 we present the new ALMA observations. In Section 3 we discuss the structure of the continuum emission (3.1), our modeling approach (3.2), and the results of our modeling (3.3). In Section 4, we discuss the significance of the results in the context of apocenter glow (4.1), the structure and geometry of the disk (4.2), implications for the directly imaged Fomalhaut b (4.3), and constraints on the emission of the central star (4.4). Section 5 presents our conclusions.
2 Observations
We observed the Fomalhaut system with ALMA in Band 6 (1.3 mm, 223 GHz). To map the entire outer dust belt, we constructed a seven pointing mosaic covering the star and the disk circumference. The phase center for the central pointing was , (J2000), corresponding to the position of the star corrected for its proper motion (328.95, -164.67) mas yr-1. One pointing was positioned on each of the disk ansae, and the remaining four pointings were spaced evenly on either side of the ring. All of these seven pointings were observed within a single 45 minute scheduling block (SB), which was executed four times on 2015 December 29-30 with 38 antennas in the array and an average precipitable water vapor (pwv) of mm. An additional three executions were carried out on 14 January 2016 with antennas in the array and pwv mm. Table 1 summarizes these observations including the dates, baseline lengths, weather conditions, and time on-source. The two-week difference between observations produces a negligible pointing difference due to proper motion compared with the natural weight beam size, which we ignore.
The correlator set-up for these observations was designed to optimize the continuum sensitivity, while also covering the 12CO J transition at 230.538 GHz. To achieve this, four basebands were centered at 213.98, 215.98, 229.59, and 231.48 GHz, in two polarizations. The baseband covering the 12CO spectral line included 3840 channels over a bandwidth of 1.875 GHz with a velocity resolution of 1.27 km/s. The remaining three continuum basebands included only 128 channels with a total bandwidth of 2 GHz each.
The raw datasets were processed by ALMA staff using the CASA software package (version 4.5.2). The absolute flux calibration was determined from observations of Pallas, J2357-5311, and J2258-275, with a systematic uncertainty of . Observations of J2258-2758 were also used to determine the bandpass calibration and to account for time-dependent gain variations. To reduce the size of the dataset, the visibilities were averaged into 30 second intervals. We generated continuum images using the multi-frequency synthesis CLEAN algorithm in CASA, and correct for the telescope primary beam. In Band 6, the primary beam of the ALMA 12-m antennas has FWHM. The imaging of the 12CO data is described in Matrà et al. (2017).
3 Results and Analysis
3.1 Continuum Emission
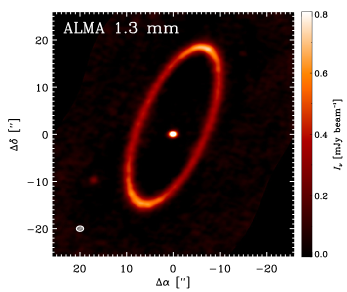
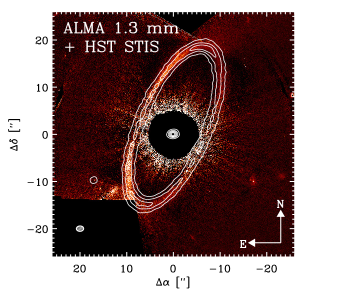
Figure 1 (left panel) shows the primary beam corrected ALMA 1.3 mm continuum image of Fomalhaut. With natural weighting, the rms noise level is 14 Jy/beam and the synthesized beam size is ( AU at 7.7 pc) with a position angle of . The right panel of Figure 1 shows the ALMA 1.3 mm image overlaid as contours on a Hubble Space Telescope (HST) STIS coronographic image of optical scattered light (Kalas et al., 2013). The millimeter continuum emission structure appears to match well with the narrow belt structure observed in the previous HST image. Overall, the new ALMA image shows emission from three components: (1) a narrow, eccentric ring (), (2) an unresolved central point source at the stellar position (), and (3) an unresolved point source on the eastern side of the disk (). Most strikingly, we note a significant flux difference between the apocenter (NW) and pericenter (SE) sides of the disk of Jy (), which we attribute to ‘apocenter glow,’ a result of the disk’s eccentricity (Pan et al., 2016, see Section 4.1 for further discussion).
We attribute the unresolved point source in the southeast quadrant to a background galaxy. The total flux density for this source is mJy, determined by fitting a point source model to the visibilities using the uvmodelfit task in CASA. Recent deep ALMA surveys have built up statistics on the number of faint background sources expected in a given field of view (Hatsukade et al., 2013; Carniani et al., 2015). Given these (sub)millimeter source counts, the number of sources with flux density of mJy expected within our field of view is . The measured position of this point source is , (J2000). This region has been imaged with HST/STIS in the optical (GO-13726; PI Kalas) where the nearest background source is west and north of the ALMA position. Given that the ALMA beam radius is along Right Ascension, it is likely the ALMA source is the same background object as observed in optical data.
3.2 Modeling Approach
Given the clear observed eccentricity in the Fomalhaut debris disk, we construct models that account for the orbital parameters of particles in the disk. A particle orbiting within a circumstellar disk has both a proper and forced eccentricity, and , respectively, as well as a proper and forced argument of periastron, and . We begin by populating the complex eccentricity plane defined by these four parameters following Wyatt et al. (1999). The forced eccentricity and argument of periastron, and , are imposed on the particles by the massive perturber forcing the eccentricity in the disk, and are free parameters in our model. The proper eccentricity is also left as a free parameter, , and describes the additional scatter in the eccentricity of each particle’s orbit; the associated with a given is assumed to be randomly distributed from to . By assuming a semi-major axis, , for each particle and random mean anomalies, we iterate to find the true anomaly, , using the newtonm code from ast2body (Vallado, 2007). Then, the radial orbital locations of each particle can be found simply using
| (1) |
To create our two-dimensional model, we complete this calculation for individual disk particles. By creating a two-dimensional model, we assume that the disk structure has a negligible vertical component. This assumption is motivated by the result from Boley et al. (2012) that the vertical scale height of the disk is described by an opening angle of from the mid-plane. Adding a vertical component to the model would likely loosen the constraints we are able to place on the width of the belt (see Section 4.2.2 for further discussion).
To create an image, we bin the determined orbital locations into a two dimensional histogram with the bin size equal to the desired pixel scale and impose a radial temperature profile, . The belt semi-major axis () and range of semi-major axes (), are both free parameters. In this eccentric disk model, the belt semi-major axis is the mean inner edge location, , where and are the radial location of the disk inner edge at pericenter and apocenter, respectively. The total flux density of the disk is normalized to . A point source with flux density, , is added to account for the central stellar emission. In addition to fitting for both fluxes, we fit for the geometry of the disk (inclination, , and position angle, ), as well as offsets of the stellar position from the pointing center of the observations ( and ).
For a given model image, we compute synthetic model visibilities using vis_sample 111vis_sample is publicly available at https://github.com/AstroChem/vis_sample or in the Anaconda Cloud at https://anaconda.org/rloomis/vis_sample, a python implementation of the Miriad uvmodel task. Following our previous approach (e.g. MacGregor et al., 2013, 2016a), we evaluate these model visibilities using a likelihood function that incorporates the statistical weights on each visibility measurement. This iterative process makes use of the emcee Markov Chain Monte Charlo (MCMC) package (Foreman-Mackey et al., 2013). Given the affine-invariant nature of this ensemble sampler, we are able to explore the uncertainties and determine the one dimensional marginalized probability distribution for each independent model parameter.
3.3 Results of Model Fits
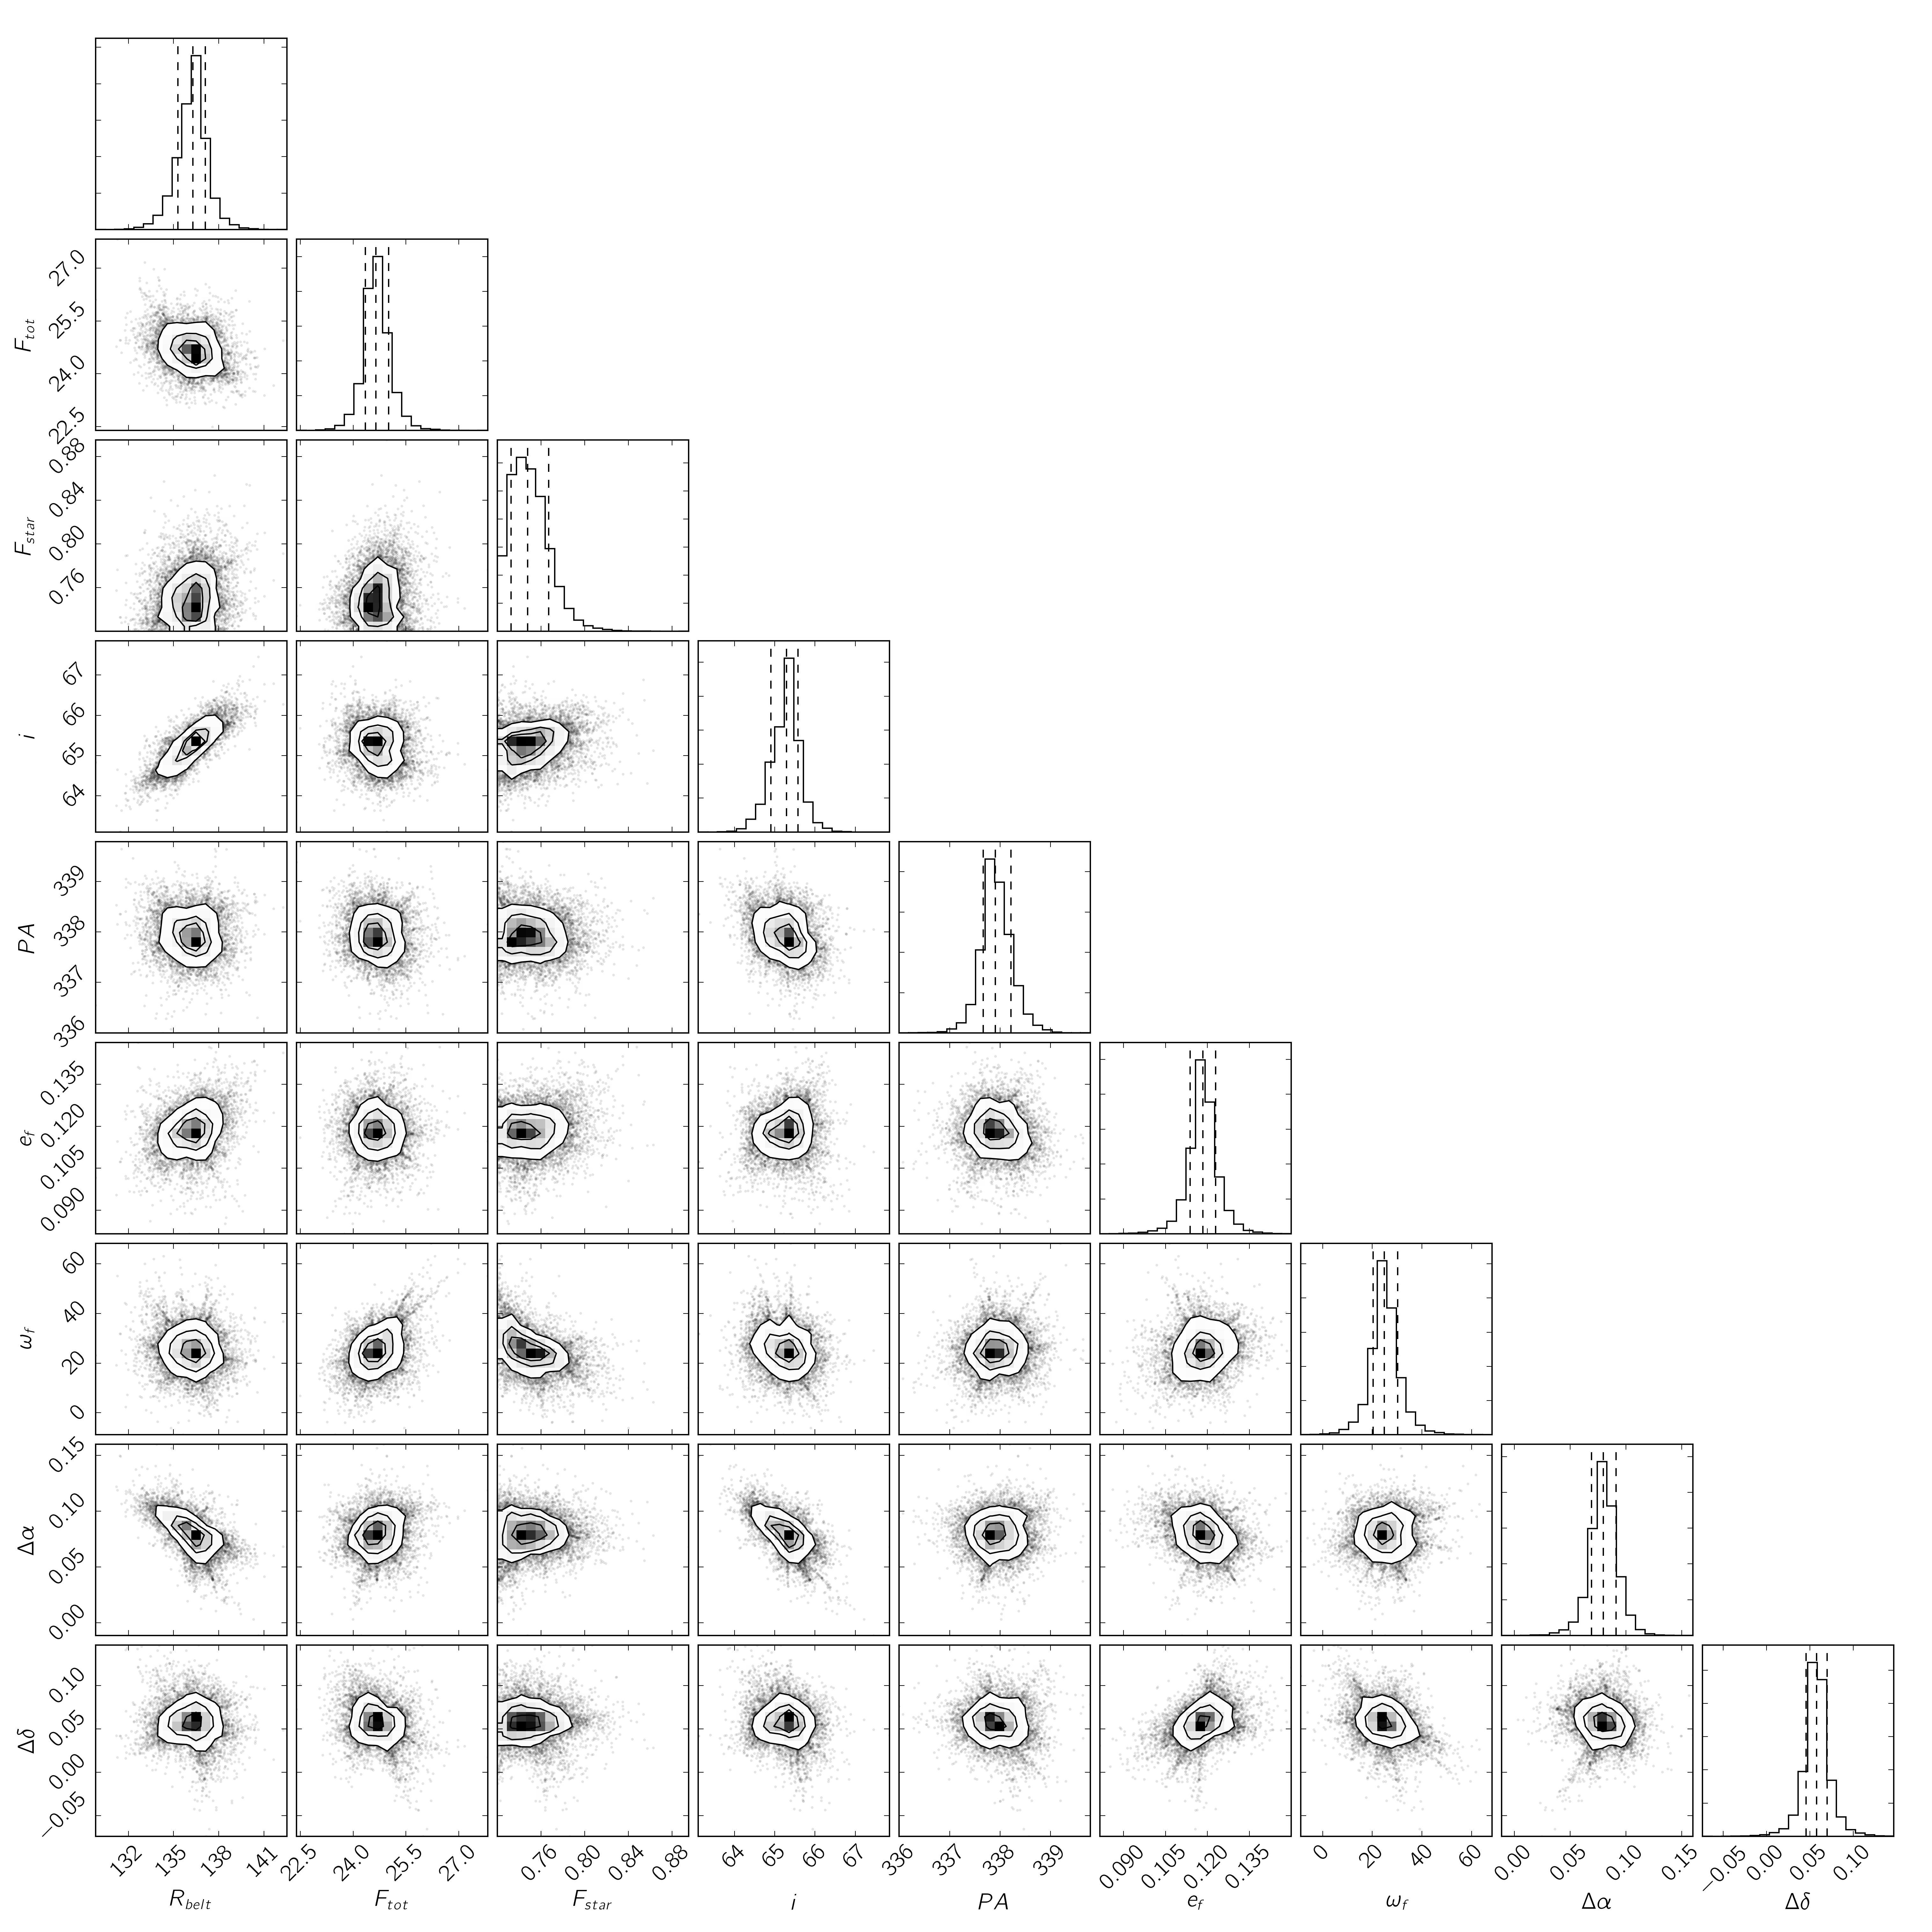
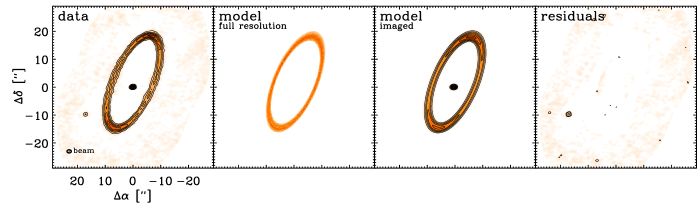
Table 2 presents the best-fit model (reduced ) parameters and their () uncertainties. Figure 2 shows the ALMA 1.3 mm data (left panel) along with the best-fit model displayed at full resolution and imaged like the ALMA data (center panels). The rightmost panel shows the imaged residuals resulting from subtracting this best-fit model from the data, which are mostly noise. The only significant peak corresponds to the background galaxy discussed in Section 3.1. The full MCMC output is shown in the appendix.
The total belt flux density determined for the best-fit model is mJy (with an additional uncertainty from flux calibration), consistent with previous flux measurements at slightly shorter wavelengths. Boley et al. (2012) determine a total flux density at 860 m of mJy, estimated from ALMA observations of the NW half of the ring. Holland et al. (1998) and Holland et al. (2003) determine flux densities of mJy and mJy from SCUBA imaging at 450 and 850 m, respectively. Assuming a millimeter spectral index of (Ricci et al., 2012), the measurement from Boley et al. (2012) extrapolates to mJy at 1.3 mm, consistent with our results within the uncertainties. Using ALMA observations at 233 GHz ( mm), White et al. (2016) obtain a flux density of mJy by fitting directly to the visibilities and mJy by fitting in the image plane, again consistent with our results within the mutual uncertainties. For optically thin dust emission, the total dust mass is given by , where pc is the distance, is the Planck function at the dust temperature, , and is the dust opacity. We assume a dust opacity at 1.3 mm of cm2 g-1 (Beckwith et al., 1990), which may be a source of systematic uncertainty. Given the best fit radial location of the disk, AU, the radiative equilibrium temperature is K. Thus, the total mass of the dust belt is .
We find good agreement with all previous determinations between the belt semi-major axis, eccentricity, inclination, and position angle for our best-fit model with previous results. The best-fit belt semi-major axis from our modeling is AU. At pericenter, the inner edge of the belt is located at a radial distance of AU. At apocenter, the inner edge of the belt is at AU. HST imaging yields a value of AU (Kalas et al., 2005, 2013), while Acke et al. (2012) obtain AU from Herschel observations. Boley et al. (2012) determine a semi-major axis of from ALMA imaging of the NW half of the disk, and White et al. (2016) determine a belt center location of AU from their model fits. These same observational studies yield inclination and position angles that range from and , respectively. We obtain robust constraints on both angles of and . The best-fit eccentricity is , consistent with both the Herschel result of and with the HST and previous ALMA results of .
4 Discussion
For the first time, we have resolved the complete Fomalhaut outer debris disk at 1.3 mm with ALMA. This map of the dust continuum emission reveals a narrow, eccentric ring surrounding the primary star. Apocenter glow, a result of increased surface density at apocenter in an eccentric ring, is evident as a significant brightness difference between the NW and SE sides of the disk. Our modeling results place strong constraints on the disk position, width, geometry (inclination and position angle), eccentricity, and argument of periastron. We now use these new results to discuss implications for the grain composition, azimuthal structure of the disk, the directly imaged object interior to the disk, Fomalhaut b, and the central star.
4.1 Observational Evidence for Apocenter Glow
Our new ALMA image is the first conclusive observational evidence for apocenter glow. The Keplerian orbital velocity in an eccentric disk is slower at apocenter than at pericenter producing an overdensity of material at apocenter. At mid-infrared wavelengths, the observed flux is strongly dependent on the grain temperature; grains at pericenter glow more brightly since they receive more flux from the star, masking the apocenter overdensity. This effect is evident as ‘pericenter glow’ (Wyatt et al., 1999) in Herschel images of the Fomalhaut disk at 70 m, where the SE (pericenter) side of the disk appears brighter (Acke et al., 2012). In contrast, previous imaging of the Fomalhaut debris disk at longer far-infrared to millimeter wavelengths suggests a slight excess () of emission at the NW (apocenter) side of the disk, farthest from the star (Holland et al., 2003; Marsh et al., 2005; Ricci et al., 2012). To explain this phenomenon, Pan et al. (2016) construct a model of ‘apocenter glow’ where the enhancement of the surface density of the disk at apocenter results in wavelength-dependent surface brightness variations. At millimeter wavelengths, larger grains dominate the emission. Since these grains radiate efficiently at the blackbody peak, the pericenter-apocenter temperature difference has less impact on the total flux. As a result, the larger surface density at apocenter dominates and the apocenter appears brighter.
Figure 3 shows the apocenter to pericenter flux ratio for Fomalhaut as a function of wavelength, including our new ALMA measurement at 1.3 mm of . Plotted together with the observational results are curves showing the smallest (purple dotted line) and largest (red solid line) apocenter to pericenter flux ratios obtained with a grid of simulated Fomalhaut disks. A detailed description of the disk simulations is given by Pan et al. (2016); here, we include a brief overview. We created disks with the forced eccentricity , radial location , and semimajor axis range given in Table 2 orbiting stars with effective temperature K and radius cm (Mamajek, 2012). We populated the disks with particles of sizes following power-law size distributions and grain absorptivities . We drew each model disk’s and values from a grid covering the ranges , . We then calculated the radially-integrated disk brightness as a function of longitude assuming passively heated, optically thin disks in thermal equilibrium. The ALMA flux ratio measurement falls well within the range obtained in our model grid.
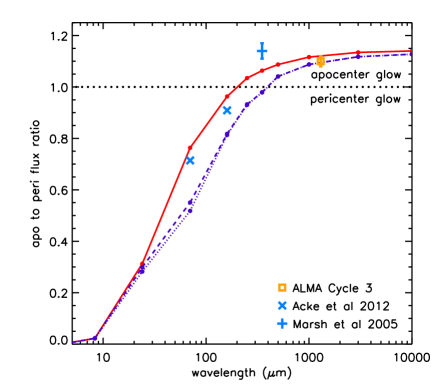
As Figure 3 suggests, the observed apocenter to pericenter flux ratios can be diagnostic of disk grain properties including , the grain absorptivity, and , the size distribution power law index. The long wavelength spectral index, , of dust emission constrains the size distribution of dust grains in the disk. Again assuming that the differential number of grains of size is a power law, , then (Ricci et al., 2012; MacGregor et al., 2016b). Here, (see discussion in MacGregor et al., 2016b), and , the dust opacity spectral index in the small particle limit for interstellar grain materials (Draine, 2006). We note that different assumptions for the dust opacity can produce steeper grain size distributions (Gáspár et al., 2012). Ricci et al. (2012) measured the flux density of Fomalhaut at 6.66 mm with ATCA. By pairing our new ALMA flux density with this previous measurement, we determine and thus . This result is consistent with the determination of White et al. (2016) of and . Using the flux ratios measured at 70 m, 160 m, and 1.3 mm respectively, and with a slight extension in the parameter range for our models, our uncertainty range in implies , , and .222Extending our parameter grid range up to did not increase the range of flux ratios attained in our models enough to fix an upper bound on the values using the 1.3 mm data point. The overlap between these indicates an allowed range of , consistent within with the quoted by Draine (2006).
4.2 Structure of Fomalhaut’s Outer Debris Disk
4.2.1 Constraints on Azimuthal Belt Structure
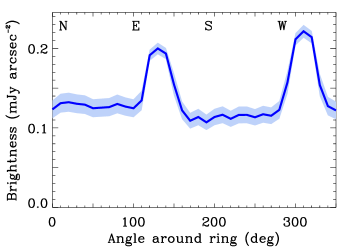
The ALMA 1.3 mm mosaic map of the outer Fomalhaut debris disk was designed to cover the complete ring with equal sensitivity, allowing us to examine azimuthal structure along the belt. After subtracting our best-fit model, any azimuthal structure should be clearly visible in the imaged residuals. Figure 2 shows the resulting residuals and no significant peaks are visible along the disk. Figure 4 shows the azimuthal profile of the disk in the sky-plane. The mean brightness is calculated in small annular sections of around the ring starting in the North and moving counterclockwise to the East. Uncertainties are obtained by dividing the rms noise of the image by the square root of the number of beams in each annular sector. The two disk ansae are visible as two peaks in the SE and NW, and apocenter glow is indicated by the significant brightness difference between these two peaks. No other significant peaks or fluctuations are present. We note a slight brightness difference () between the NE and SW sides of the disk (along the direction of the disk minor axis). The median belt flux density measured between (SW side) is mJy arcsec-2 and mJy arcsec-2 between (NE side). A similar dimming of the SW side of the disk is seen by Boley et al. (2012), which they interpret as resulting from a loss of sensitivity at the edges of the ALMA primary beam. However, it is likely that this slight asymmetry between the NE and SW sides of the disk presents further evidence for apocenter glow. The expected overdensity of particles at apocenter forms an arc, which would cover much of the eastern side of the disk given the observed disk geometry (Pan et al., 2016; Pearce & Wyatt, 2014).
Previous imaging surveys at optical to infrared wavelengths have indicated several azimuthal features, which our millimeter observations do not confirm. Kalas et al. (2013) demonstrate that the dust belt has a deficit of optical scattered light in an azimuthal wedge at position angle , just north of the current location of Fomalhaut b. The sky-plane width of the gap is ( AU), corresponding to a deprojected width of AU. One possibility is that the gap in scattered light represents a deficit of material, where grains collect on horseshoe orbits on either side of a planet embedded in the gap. The brightness deficit could also result from self-shadowing in an optically thick, vertically thin belt. Millimeter observations are minimally affected by optical depth effects and should reveal the true surface density of grains. Since our ALMA observations do not detect the same gap, it is likely that this feature results from a shadowing effect. However, we cannot rule out smaller structures AU that would remain unresolved in our current map.
SCUBA imaging at 450 m shows evidence for an arc of emission at position angle interior to the outer belt at AU separation from the star Holland et al. (2003). Boley et al. (2012) note a broadening of the disk width on the northwestern side of the belt, to the right of the disk ansae. We do not confirm either of these features in our ALMA map. White et al. (2016) also note that the disk appears azimuthally smooth.
4.2.2 Determining the Belt Width
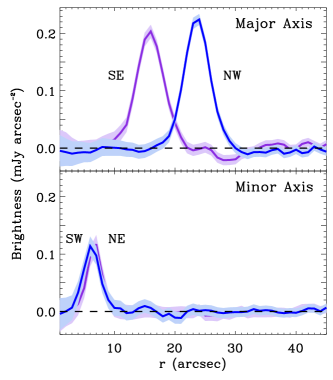
The FWHM width of our best-fit model is AU. Boley et al. (2012) estimate a half-maximum width for the disk of AU given a power-law belt model and AU given a Gaussian model, consistent with our results. White et al. (2016) determine a belt width of AU from their recent ALMA data. Figure 5 shows the surface brightness of our ALMA image in four cuts from the star along both the disk major (SE and NW sides) and minor (SW and NE) axes. We do not see any fluctuation in width along the belt. The flux difference between apocenter and pericenter is evident. Also of note is the offset of the star from the disk centroid to the SW by ( AU) in RA and ( AU) in DEC.
Given the best-fit parameters of our two-dimensional model, we can constrain the fractional width of the belt to be . Adding a vertical component to the model likely adds to the uncertainty of this constraint. The Fomalhaut debris disk is similarly narrow to the main classical Kuiper Belt in our own Solar System, which is radially confined between the 3:2 and 2:1 orbital resonances with Neptune implying a fractional width of (Hahn & Malhotra, 2005). In contrast, both the HD 107146 (Ricci et al., 2015) and Corvi (Marino et al., 2017) debris disks appear much broader with fractional widths of . Boley et al. (2012) propose that the narrow ring observed in Fomalhaut may also result from interactions with planets, namely two shepherding planets on the inner and outer edges of the belt. If the structure of the belt is indeed due to truncation by interior and exterior planets, we would expect to see sharp edges. However, given the resolution of our observations ( AU) compared with the width of the belt ( AU), we are unable to place any strong constraints on the sharpness of the disk edges.
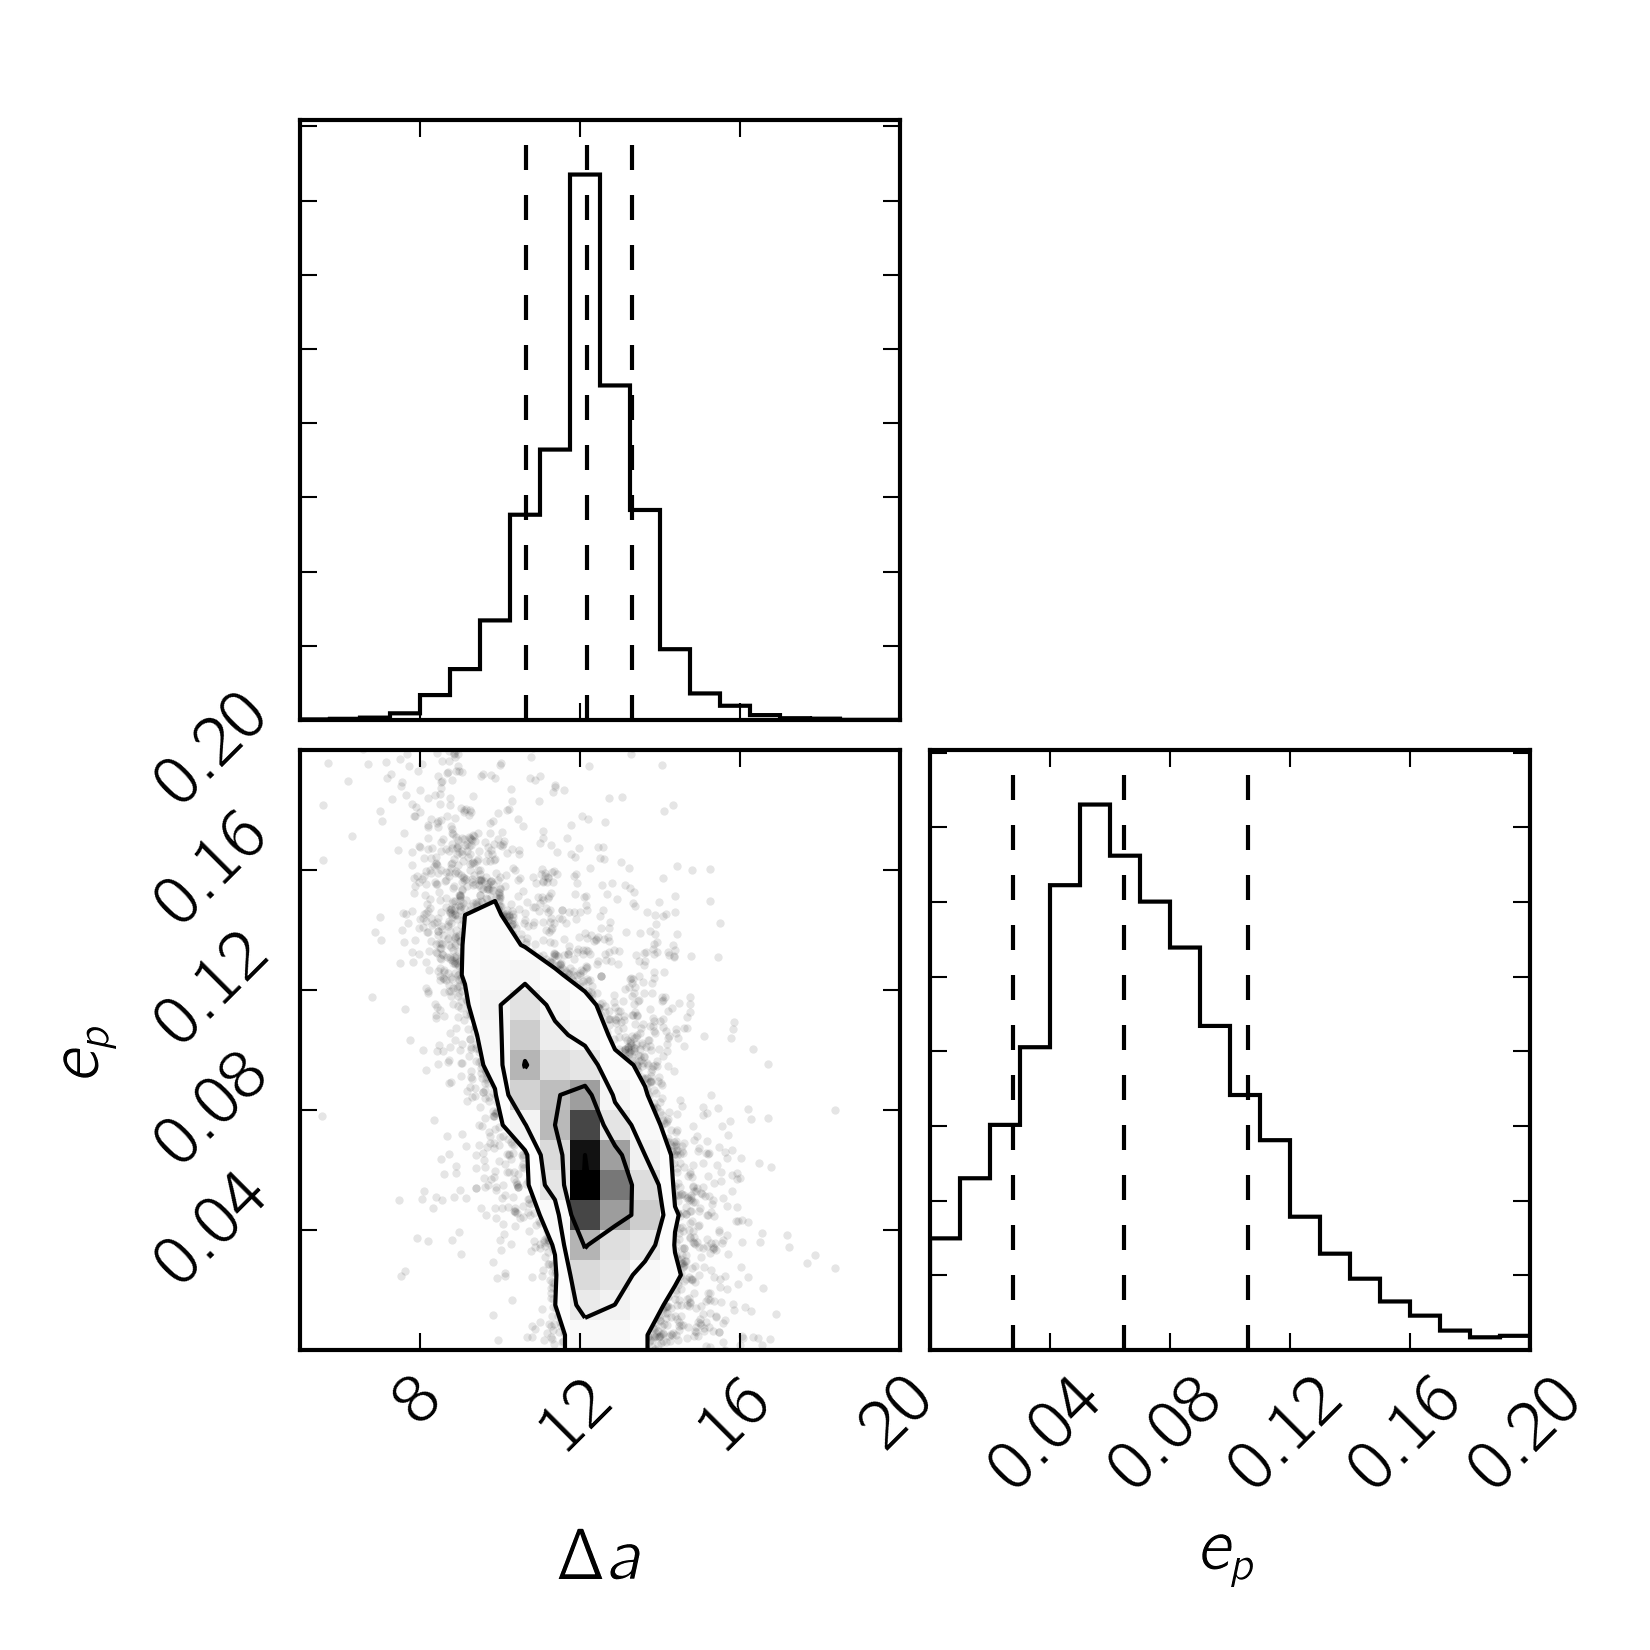
In our models, there are two parameters that contribute to the width of the belt: the range of semi-major axes assigned to the particles () and the proper or intrinsic eccentricity () of a particle’s orbit. As expected, these parameters are highly degenerate and we are unable to place strong constraints on either of these parameters independently given the moderate resolution of our observations. The best-fit values for both parameters are AU and . Figure 6 shows the MCMC output for and ; the degeneracy between the two parameters is clearly seen by the slope in the contours. Altering the proper eccentricity of the particles predicts azimuthal variations in the width of the belt. For a low proper eccentricity (), the particle orbits are apsidally aligned and the belt appears narrower at pericenter than at apocenter. For a high proper eccentricity (), the width of the belt is closer to uniform around the entire circumference of the ring. Future ALMA observations of the disk apocenter and pericenter locations, but with higher resolution, could distinguish between these two cases, and place the first robust constraints on the proper eccentricity of the Fomalhaut debris disk. Whereas White et al. (2016) have higher angular resolution in their recent ALMA observations (synthesized beam of ), the two disk ansae are outside of the primary beam of their single ALMA pointing.
4.2.3 Geometry of the Disk: The Argument of Periastron
There has been much debate in the literature over the argument of periastron, , of the Fomalhaut ring. Acke et al. (2012) find based upon the location of the observed pericenter glow along the disk major axis. However, the resolution of the Herschel 70 m image is not high enough to detect an offset in the stellar position off the disk major axis by a few AU. Kalas et al. (2013) determine a value of by fitting only for the offset of the expected stellar position from the disk centroid. Boley et al. (2012) are unable to constrain the argument of periastron, since they only image half of the belt with ALMA.
Our new ALMA data provides the first resolved image of emission from both the complete outer disk and the central star with high enough angular resolution to determine an offset of the star from the disk centroid. As discussed in Section 4.2.2, the star is noticeably offset to the SW from the disk centroid. This observation is consistent with the result of Kalas et al. (2013). Adopting our modeling approach, we can fit independently for all three angles describing the disk geometry: the inclination (), the position angle (), and the argument of periastron (). The best-fit argument of periastron from our models is . This value is comparable to the result from Kalas et al. (2013), and matches both the stellar position relative to the disk centroid and the position along the belt of both the observed pericenter (Acke et al., 2012) and apocenter glow. There is still a large uncertainty in this best-fit value due to the difficulty disentangling the argument of periastron from the significant inclination of the disk ().
4.3 Implications for Fomalhaut b
Fomalhaut b was first discovered through HST direct imaging (Kalas et al., 2008) at a location consistent with theoretical predictions for a massive planet orbiting interior to the eccentric debris disk (Quillen, 2006; Chiang et al., 2009). However, follow-up observations at later epochs revealed that Fomalhaut b is instead on a highly eccentric, possibly ring-crossing orbit (Kalas et al., 2013; Beust et al., 2014). Furthermore, this object appears brighter at optical wavelengths than in the infrared, contrary to predictions from models of planetary atmospheres. Kennedy & Wyatt (2011) discuss the possibility of a collisional swarm of irregular satellites surrounding a planet. Alternatively, Fomalhaut b may instead be a dust cloud generated through collisions between larger planetesimals (Currie et al., 2012; Galicher et al., 2013; Kalas et al., 2013; Kenyon et al., 2014; Tamayo, 2014; Lawler et al., 2015). To date, the true nature of Fomalhaut b remains uncertain.
If Fomalhaut b is indeed a dust cloud, our ALMA observations provide useful constraints on its possible dust mass. We can place a robust upper limit on the flux density of mJy, assuming a point source. Following the approach for optically thin emission described in Section 3.3, we can determine an upper limit on the potential dust mass. The current separation of Fomalhaut b is AU. In radiative equilibrium, this location implies a dust temperature of K. The resulting upper limit on the dust mass is ( g), which is consistent with estimates of the g in total sub-micron dust mass needed to account for the scattered light (Kalas et al., 2008). We can also consider optically thick dust emission and instead derive an upper limit on the size of the dust clump: . Given the upper limit of mJy, must be AU for an optically thick clump.
4.4 Stellar Emission at Millimeter Wavelengths
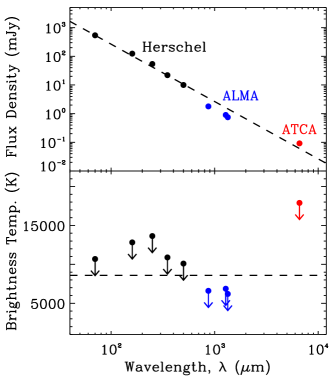
The best fit flux density for the central star is mJy (with an additional uncertainty for flux calibration). CHARA measurements of the stellar bolometric flux robustly determine the effective temperature to be K (Boyajian et al., 2013). Given this effective temperature, a PHOENIX stellar atmosphere model (Husser et al., 2013) predicts a flux density of mJy at 1.3 mm (with uncertainty), in excess of our flux measurement. At long wavelengths, however, this stellar model is essentially a Rayleigh-Jeans extrapolation. Boley et al. (2012) measure a stellar flux of mJy at 850 m with ALMA in Cycle 0, which extrapolates to mJy at 1.3 mm, consistent with atmospheric model predictions, but not consistent with our ALMA flux. It is important to note, however, that this measurement is strongly influenced by the primary beam correction applied to the data, since the star is located at the edge of the single pointing. ALMA Cycle 1 observations at 870 m by Su et al. (2016) detect a central point source as well with a lower flux density of mJy. Extrapolating to 1.3 mm, this measurement yields an expected flux density of , more comparable to our result. White et al. (2016) also determine a low stellar flux density of mJy from recent ALMA observations at a 1.3 mm (233 GHz, a slightly higher frequency than our observations). Figure 7 shows the flux density spectrum (top) and brightness temperature (bottom) of Fomalhaut from Herschel (Acke et al., 2012), ALMA (this work; Su et al., 2016; White et al., 2016), and ATCA (Ricci et al., 2012). To calculate the brightness temperature, we follow Liseau et al. (2016) and adopt a photospheric radius of (Mamajek, 2012). The stellar flux density at infrared wavelengths from Herschel is inferred, since the measured flux includes contributions from both the star and the inner belt which are unresolved in these observations. Given the possible contribution from an inner warm belt at all wavelengths, we quote only upper limits on the brightness temperature. At the Herschel wavelengths, the brightness temperature is mostly consistent with the effective temperature. However, at millimeter wavelengths, the brightness temperature dips to K and K at 870 m and 1.3 mm, respectively. The ATCA flux measurement at 6.66 mm suggests a brightness temperature of K.
It is clear that the brightness temperature of Fomalhaut is significantly lower than the measured photospheric effective temperature at millimeter wavelengths before increasing again at longer, centimeter wavelengths. Similar behavior is seen for a number of K and M giants by Harper et al. (2013). With the advent of ALMA, there are a growing number of stars with robust millimeter flux measurements. Excess emission at long wavelengths has been observed for several other Sun-like stars, including Cen A/B, Eridani, and Ceti (Liseau et al., 2015, 2016; MacGregor et al., 2015, 2016a), which is consistent with emission from a hot stellar chromosphere. Liseau et al. (2016) observe a temperature minimum, like we observe for Fomalhaut, for both Cen A and B at shorter, sub-millimeter wavelengths with ALMA, which they attribute to a change in the sign of the temperature gradient above the stellar photosphere, as is seen in our own Sun. At 1.3 mm wavelength, the flux densities of these stars have recovered and their brightness temperatures are similar to their effective temperature. For Fomalhaut, it seems likely that the flux density measured by ATCA at 6.66 mm is dominated by chromospheric emission. However, the long wavelength spectrum of A-type stars, like Fomalhaut, is further complicated by ionized stellar winds, which flatten the spectral slope at radio wavelengths (Aufdenberg et al., 2002). The ability to measure these behaviors with ALMA will enable advances in our understanding of stellar radiative transfer and chromospheres, and of stellar winds.
For the Fomalhaut system, understanding the stellar flux contribution at long wavelengths is especially critical. Spitzer and Herschel observations reveal excess emission at infrared wavelengths (Stapelfeldt et al., 2004; Acke et al., 2012), which is attributed to a warm inner dust belt similar to the asteroid belt in our Solar System (Su et al., 2013). However, no inner belt has been detected or resolved with ALMA (Su et al., 2016). Robustly determining the spectral energy distribution of the star at long wavelengths will help to determine the nature of such an inner asteroid belt.
5 Conclusions
We present new ALMA observations at 1.3 mm of the continuum dust emission from the Fomalhaut system. These observations provide the first millimeter map covering the complete outer debris disk with uniform sensitivity. We adopt a MCMC modeling approach that generates models of an eccentric ring by calculating the orbital parameters of a collection of particles. The main results from this analysis are as follows.
-
1.
The Fomalhaut outer debris disk is radially confined with a model best-fit inner edge of AU and width of AU, implying a fractional width of . Given the measured total flux density and assuming optically thin dust emission, the total dust mass of the disk is , consistent with previous measurements. Given the resolution of our observations, we do not place strong constraints on the sharpness of the belt edges.
-
2.
Our ALMA image is the first conclusive observation of apocenter glow, a brightness asymmetry due to a surface density enhancement at apocenter (Pan et al., 2016). We determine a best-fit eccentricity for the ring of . Given the apocenter to pericenter flux ratio from our ALMA measurement and previous (sub)millimeter observations, and assuming a size distribution power law index of , we constrain the dust absorptivity power law index to be .
-
3.
By adopting a modeling approach that accounts for the orbital parameters of disk particles, we are able to robustly constrain the geometry of the disk. The best fit values for the inclination and position angle are and , respectively. By resolving both the stellar position relative to the disk centroid and both the pericenter and apocenter sides of the disk, we are able to determine the argument of periastron to be , consistent with the results from HST images (Kalas et al., 2013).
-
4.
After subtracting our best-fit belt model from the data, the resulting residuals do not show any evidence for significant azimuthal structure. The only significant peak visible to the east of the disk is attributable to a background galaxy. We do not confirm any of the azimuthal features, including the gap at position angle, that have been seen in previous imaging studies with HST, SCUBA, and ALMA. However, we cannot rule out smaller structure AU, which would be unresolved with the current resolution of our image.
-
5.
The flux density at 1.3 mm of the central star, mJy, is significantly lower than predicted by current photospheric models. Indeed, the implied brightness temperature of Fomalhaut falls below the stellar effective temperature at millimeter wavelengths before increasing significantly at longer, centimeter wavelengths. Similar spectra have been observed for the Sun-like stars Cen A and B (Liseau et al., 2016). For Fomalhaut, it is especially critical to determine the long wavelength stellar spectrum in order to better constrain the contribution from the inner dust belt.
The proximity (7.66 pc) and young age ( Myr) of the Fomalhaut system make it a unique target to explore the early stages of planetary system formation and reorganization. Future ALMA observations with higher angular resolution will allow for further exploration of the outer disks’s azimuthal structure, as well as enabling studies of structural variability over time.
M.A.M. acknowledges support from a National Science Foundation Graduate Research Fellowship (DGE1144152) and from NRAO Student Observing Support. L.M. acknowledges support by STFC through a graduate studentship and, together with M.C.W. and A.S., by the European Union through ERC grant number 279973. P.K. and J.R.G. thank support from NASA NNX15AC89G and NNX15AD95G/NEXSS, NSF AST-1518332 and HST-GO-13726. This work benefited from NASA’s Nexus for Exoplanet System Science (NExSS) research coordination network sponsored by NASA’s Science Mission Directorate. G.M.K. is supported by the Royal Society as a Royal Society University Research Fellow. M.P. acknowledges support from NASA grants NNX15AK23G and NNX15AM35G. A.M.H. is supported by NSF grant AST-1412647. The work of O.P. is supported by the Royal Society Dorothy Hodgkin Fellowship. A.S. is partially supported by funding from the Center for Exoplanets and Habitable Worlds. The Center for Exoplanets and Habitable Worlds is supported by the Pennsylvania State University, the Eberly College of Science, and the Pennsylvania Space Grant Consortium. This paper makes use of the following ALMA data: ADS/JAO.ALMA #2015.1.00966.S. ALMA is a partnership of ESO (representing its member states), NSF (USA) and NINS (Japan), together with NRC (Canada) and NSC and ASIAA (Taiwan) and KASI (Republic of Korea), in cooperation with the Republic of Chile. The Joint ALMA Observatory is operated by ESO, AUI/NRAO and NAOJ. The National Radio Astronomy Observatory is a facility of the National Science Foundation operated under cooperative agreement by Associated Universities, Inc. Figures 6 and 8 were generated using the corner.py code (Foreman-Mackey, 2016).
References
- Acke et al. (2012) Acke, B., Min, M., Dominik, C., et al. 2012, A&A, 540, A125
- Aufdenberg et al. (2002) Aufdenberg, J. P., Hauschildt, P. H., Baron, E., et al. 2002, ApJ, 570, 344
- Beckwith et al. (1990) Beckwith, S. V. W., Sargent, A. I., Chini, R. S., & Guesten, R. 1990, AJ, 99, 924
- Beust et al. (2014) Beust, H., Augereau, J.-C., Bonsor, A., et al. 2014, A&A, 561, A43
- Boley et al. (2012) Boley, A. C., Payne, M. J., Corder, S., et al. 2012, ApJ, 750, L21
- Boyajian et al. (2013) Boyajian, T. S., von Braun, K., van Belle, G., et al. 2013, ApJ, 771, 40
- Carniani et al. (2015) Carniani, S., Maiolino, R., De Zotti, G., et al. 2015, A&A, 584, A78
- Chiang et al. (2009) Chiang, E., Kite, E., Kalas, P., Graham, J. R., & Clampin, M. 2009, ApJ, 693, 734
- Currie et al. (2012) Currie, T., Debes, J., Rodigas, T. J., et al. 2012, ApJ, 760, L32
- Deller & Maddison (2005) Deller, A. T., & Maddison, S. T. 2005, ApJ, 625, 398
- Draine (2006) Draine, B. T. 2006, ApJ, 636, 1114
- Foreman-Mackey (2016) Foreman-Mackey, D. 2016, The Journal of Open Source Software, 24, doi:10.21105/joss.00024
- Foreman-Mackey et al. (2013) Foreman-Mackey, D., Hogg, D. W., Lang, D., & Goodman, J. 2013, PASP, 125, 306
- Galicher et al. (2013) Galicher, R., Marois, C., Zuckerman, B., & Macintosh, B. 2013, ApJ, 769, 42
- Gáspár et al. (2012) Gáspár, A., Psaltis, D., Rieke, G. H., & Özel, F. 2012, ApJ, 754, 74
- Hahn & Malhotra (2005) Hahn, J. M., & Malhotra, R. 2005, AJ, 130, 2392
- Harper et al. (2013) Harper, G. M., O’Riain, N., & Ayres, T. R. 2013, MNRAS, 428, 2064
- Hatsukade et al. (2013) Hatsukade, B., Ohta, K., Seko, A., Yabe, K., & Akiyama, M. 2013, ApJ, 769, L27
- Holland et al. (1998) Holland, W. S., Greaves, J. S., Zuckerman, B., et al. 1998, Nature, 392, 788
- Holland et al. (2003) Holland, W. S., Greaves, J. S., Dent, W. R. F., et al. 2003, ApJ, 582, 1141
- Husser et al. (2013) Husser, T.-O., Wende-von Berg, S., Dreizler, S., et al. 2013, A&A, 553, A6
- Kalas et al. (2005) Kalas, P., Graham, J. R., & Clampin, M. 2005, Nature, 435, 1067
- Kalas et al. (2013) Kalas, P., Graham, J. R., Fitzgerald, M. P., & Clampin, M. 2013, ApJ, 775, 56
- Kalas et al. (2008) Kalas, P., Graham, J. R., Chiang, E., et al. 2008, Science, 322, 1345
- Kennedy & Wyatt (2011) Kennedy, G. M., & Wyatt, M. C. 2011, MNRAS, 412, 2137
- Kenyon et al. (2014) Kenyon, S. J., Currie, T., & Bromley, B. C. 2014, ApJ, 786, 70
- Kuchner & Holman (2003) Kuchner, M. J., & Holman, M. J. 2003, ApJ, 588, 1110
- Lawler et al. (2015) Lawler, S. M., Greenstreet, S., & Gladman, B. 2015, ApJ, 802, L20
- Liseau et al. (2016) Liseau, R., De la Luz, V., O’Gorman, E., et al. 2016, A&A, 594, A109
- Liseau et al. (2015) Liseau, R., Vlemmings, W., Bayo, A., et al. 2015, A&A, 573, L4
- MacGregor et al. (2016a) MacGregor, M. A., Lawler, S. M., Wilner, D. J., et al. 2016a, ApJ, 828, 113
- MacGregor et al. (2015) MacGregor, M. A., Wilner, D. J., Andrews, S. M., Lestrade, J.-F., & Maddison, S. 2015, ApJ, 809, 47
- MacGregor et al. (2013) MacGregor, M. A., Wilner, D. J., Rosenfeld, K. A., et al. 2013, ApJ, 762, L21
- MacGregor et al. (2016b) MacGregor, M. A., Wilner, D. J., Chandler, C., et al. 2016b, ApJ, 823, 79
- Mamajek (2012) Mamajek, E. E. 2012, ApJ, 754, L20
- Marino et al. (2017) Marino, S., Wyatt, M. C., Panić, O., et al. 2017, MNRAS, 465, 2595
- Marsh et al. (2005) Marsh, K. A., Velusamy, T., Dowell, C. D., Grogan, K., & Beichman, C. A. 2005, ApJ, 620, L47
- Pan et al. (2016) Pan, M., Nesvold, E. R., & Kuchner, M. J. 2016, ApJ, 832, 81
- Pearce & Wyatt (2014) Pearce, T. D., & Wyatt, M. C. 2014, MNRAS, 443, 2541
- Quillen (2006) Quillen, A. C. 2006, MNRAS, 372, L14
- Ricci et al. (2015) Ricci, L., Carpenter, J. M., Fu, B., et al. 2015, ApJ, 798, 124
- Ricci et al. (2012) Ricci, L., Testi, L., Maddison, S. T., & Wilner, D. J. 2012, A&A, 539, L6
- Stapelfeldt et al. (2004) Stapelfeldt, K. R., Holmes, E. K., Chen, C., et al. 2004, ApJS, 154, 458
- Su et al. (2016) Su, K. Y. L., Rieke, G. H., Defrére, D., et al. 2016, ApJ, 818, 45
- Su et al. (2013) Su, K. Y. L., Rieke, G. H., Malhotra, R., et al. 2013, ApJ, 763, 118
- Tamayo (2014) Tamayo, D. 2014, MNRAS, 438, 3577
- Vallado (2007) Vallado, D. A. 2007, Fundamentals of Astrodynamics and Applications
- van Leeuwen (2007) van Leeuwen, F. 2007, A&A, 474, 653
- White et al. (2016) White, J. A., Boley, A. C., Dent, W. R. F., Ford, E. B., & Corder, S. 2016, ArXiv e-prints, arXiv:1612.01648
- Wyatt (2003) Wyatt, M. C. 2003, ApJ, 598, 1321
- Wyatt et al. (1999) Wyatt, M. C., Dermott, S. F., Telesco, C. M., et al. 1999, ApJ, 527, 918
| Observation | # of | Projected | PWV | Time on |
|---|---|---|---|---|
| Date | Antennas | Baselines (m) | (mm) | Target (min) |
| 2015 Dec 29 | 38 | 0.76 | 41.9 | |
| 38 | 0.65 | 41.9 | ||
| 38 | 0.83 | 30.7 | ||
| 2015 Dec 30 | 38 | 1.1 | 26.6 | |
| 2016 Jan 14 | 46 | 2.3 | 41.9 | |
| 46 | 2.4 | 41.9 | ||
| 44 | 2.7 | 41.9 |
| Parameter | Description | Best-fit Value |
|---|---|---|
| Total flux density [mJy] | ||
| Total stellar flux [mJy] | ||
| Belt inner edge [AU] | ||
| Range of semi-major axes [AU] | ||
| Belt FWHM [AU] | ||
| Disk inclination [] | ||
| Disk position angle [] | ||
| Forced eccentricity | ||
| Proper eccentricity | ||
| Forced argument of periastron [] | ||
| RA offset [] | ||
| DEC offset [] |