Optical variability of narrow and broad line Seyfert 1 galaxies
Abstract
We studied optical variability (OV) of a large sample of narrow-line Seyfert 1 (NLSy1) and broad-line Seyfert 1 (BLSy1) galaxies with 0.8 to investigate any differences in their OV properties. Using archival optical -band light curves from the Catalina Real Time Transient Survey that span years and modeling them using damped random walk, we estimated the amplitude of variability. We found NLSy1 galaxies as a class show lower amplitude of variability than their broad-line counterparts. In the sample of both NLSy1 and BLSy1 galaxies, radio-loud sources are found to have higher variability amplitude than radio-quiet sources. Considering only sources that are detected in the X-ray band, NLSy1 galaxies are less optically variable than BLSy1 galaxies. The amplitude of variability in the sample of both NLSy1 and BLSy1 galaxies is found to be anti-correlated with Fe II strength but correlated with the width of the H line. The well-known anti-correlation of variability-luminosity and the variability-Eddington ratio is present in our data. Among the radio-loud sample, variability amplitude is found to be correlated with radio-loudness and radio-power suggesting jets also play an important role in the OV in radio-loud objects, in addition to the Eddington ratio, which is the main driving factor of OV in radio-quiet sources.
=1
1 Introduction
Active galactic nuclei (AGNs) are among the luminous extragalactic sources in the sky persistently emitting radiation with bolometric luminosities as large as 1048 erg s-1 (Woo & Urry, 2002). They are believed to be powered by accretion of matter onto supermassive black holes (SMBH) at the center of galaxies (Lynden-Bell, 1969; Rees, 1984). A small fraction (15%) of AGNs are radio-loud and emit in the radio band, thereby possessing powerful relativistic jets (Kellermann et al., 1989). One of the important observed characteristics of all categories of AGN is that they show variations in their emitted flux. This was known since their discovery as a class of object (Schmidt, 1963; Greenstein, 1963). The flux variations in AGN are random and occur on different time scales of minutes, hours and days, and has been observed over the complete accessible wavelengths (Wagner & Witzel, 1995; Ulrich et al., 1997).
In the recent years, AGNs have been extensively studied for their optical variability (OV). Several theoretical models have been proposed to explain the observed flux variations such as accretion disk instabilities (Kawaguchi et al., 1998), multiple supernovae (Aretxaga et al., 1997), micro-lensing (Hawkins, 2000), Poisson process (Cid Fernandes et al., 2000) and damped random walk (DRW; Kelly et al., 2009). However, we still do not have an understanding of the underlying physical processes that cause flux variability. Extensive optical photometric monitoring of large samples of AGN has revealed important connections between the observed variability and the various important physical properties of the sources. Some of the observed correlations are the dependency of the amplitude of variability with wavelength (di Clemente et al., 1996), luminosity (Hook et al., 1994; Kelly et al., 2009; Meusinger et al., 2011), redshift (Vanden Berk et al., 2004; Meusinger et al., 2011), black hole mass and Eddington ratio (Wold et al., 2007; Bauer et al., 2009; Kelly et al., 2009; MacLeod et al., 2010). Variability is thus an important tool to investigate the complex nature of the central engine and accretion processes in AGN.
Past variability studies mainly focused on broad line AGN, however, only limited reports are available in the literature on the OV characteristics of Narrow Line Seyfert 1 (NLSy1) galaxies. NLSy1 galaxies are a peculiar type of Seyfert 1 galaxies having full width at half maximum (FWHM) of the permitted line FWHM and flux ratio of [O III] to H (Osterbrock & Pogge, 1985; Goodrich, 1989). They usually show strong Fe II emission compared to their broad line counterparts (Véron-Cetty et al., 2001). NLSy1 galaxies also show strong soft X-ray variability and steep X-ray spectra than BLSy1 galaxies (Leighly, 1999b; Grupe, 2004). They harbor low mass black hole (106 - 10) and have high Eddington ratio compared to the BLSy1 galaxies that are believed to be hosted by heavier ( 10) black holes (Zhou et al., 2006; Xu et al., 2012). However, recent studies indicate that NLSy1 galaxies do have black hole masses similar to that of blazars (Calderone et al., 2013; Baldi et al., 2016). Several authors have studied the reasons for mass deficit in NLSy1 galaxies and suggest geometrical factors to be the reason for observing narrow emission lines and consequently leading to low black hole mass determination from virial estimates (Decarli et al., 2008; Calderone et al., 2013; Liu et al., 2016). Though there are some differences in the observed properties of BLSy1 and NLSy1 galaxies, we do not as of now have a clear picture on the similarities and/or differences in the OV properties between these two classes of objects. A comparative analysis of the OV properties of BLSy1 and NLSy1 galaxies could provide clues to the cause of the peculiar observational characteristics of NLSy1 galaxies.
Though NLSy1 galaxies have not been studied extensively for optical variability, a few studies do exist in the literature. Such studies though limited to a handful of sources have focused both on flux variations within a night (Young et al., 1999; Miller et al., 2000) as well as on time scales of days (Young et al., 1999; Miller et al., 2000). Doroshenko et al. (2006) performed long-term optical photometric monitoring of a NLSy1 galaxy Ark 564 and found a low variability amplitude of mag. Similar results have also been found by Klimek et al. (2004) who studied 6 NLSy1 galaxies and concluded that NLSy1 galaxies as a class show less variability than BLSy1 galaxies and the extreme variability seen in the soft X-ray is not present in the optical. Both these studies lack a proper sample of NLSy1 galaxies. Benefited from the Solan Digital Sky Survey (SDSS) multi-wavelength, multi-epoch-repeated photometric data and the extended catalog of NLSy1 galaxies compiled by Zhou et al. (2006), a comparative study of NLSy1 and BLSy1 galaxies with a moderate sample of 55 NLSy1 galaxies and a control sample of 108 BLSy1 galaxies was first made by Ai et al. (2010) and subsequently by Ai et al. (2013). They found: (1) NLSy1 galaxies have systematically smaller variability than BLSy1 galaxies; (2) the amplitude of variability increases with the width of H and strength of [O III] lines but decreases with the strength of Fe II emission; (3) variability is anti-correlated with Eddington ratio but insignificant with luminosity; (4) a positive correlation with black hole mass is found which, however, vanishes after controlling Eddington ratio in the analysis, which the authors noted could be due to the limited ranges of luminosity and black hole mass of their sample. However, these findings are based on the poorly sampled SDSS photometric light curves having only about 27 observations over a duration of 5 years.
Earlier studies on the OV of a large sample of NLSy1 galaxies were limited because (i) a small number of NLSy1 galaxies known at that time and (ii) the lack of long-term photometric data. Recently, Rakshit et al. (2017) have compiled a new catalog of NLSy1 galaxies consisting of 11,101 sources, which is a factor of five increase in the number of NLSy1 galaxies than the previous catalog. During the course of NLSy1 galaxies selection, Rakshit et al. (2017) have also arrived at a large sample of BLSy1 galaxies. Long-term -band observations of many of these objects are available from the Catalina Real Time Transient Survey (CRTS; Drake et al., 2009). Motivated by the availability of large sample of BLSy1 and NLSy1 galaxies and the CRTS data, we carried out a comparative study of OV of both BLSy1 and NLSy1 galaxies to understand the correlation of variability amplitude to different physical characteristics of these two populations of sources. In this paper, we present the results of this study. This paper is organized as follows. In section 2, we present the sample of NLSy1 and BLSy1 galaxies and the photometric data used for this study followed by the analysis presented in section 3. The results are given in section 4 followed by a summary and conclusion in section 5. A cosmology with , , and is assumed throughout.
2 Sample and data
2.1 NLSy1 and BLSy1 galaxies sample
Our sample of NLSy1 galaxies is taken from Rakshit et al. (2017). This was extracted from a systematic re-analysis of the spectra of objects in SDSS DR12 (Alam et al., 2015) that are classified as “QSO” by the automatic SDSS spectroscopic pipeline (Richards et al., 2002). The custom made emission line fitting process by Rakshit et al. (2017) to identify new NLSy1 galaxies from SDSS DR12 database also allowed them to compile a sample of BLSy1 galaxies that have FWHM (H) . Since the number of BLSy1 galaxies is very large, for this work, we created a sub-sample of BLSy1 galaxies having median SNR in the SDSS spectra resulting in 14,894 BLSy1 galaxies. Thus, the sample of sources selected for this study consists of 11,101 NLSy1 galaxies and 14,894 BLSy1 galaxies.
2.2 Photometric data
For OV studies of the sample selected above, we used the data from CRTS***http://nesssi.cacr.caltech.edu/DataRelease (Drake et al., 2009). It provides light curves with much higher temporal sampling thereby enabling us to study the variability characteristic of our sample (Graham et al., 2015). CRTS streams data from three telescopes; the 0.7 m Catalina Schmidt Telescope with a field of view of 8 deg2, the 1.5 m Mount Lemmon Survey reflector telescope having a 1 deg2 field of view located at north of Tucson, Arizona, and the 0.5 m Uppsala Schmidt telescope at Siding Spring, Australia having a 4.2 deg2 field of view. CRTS covers about 2500 deg2 sky per night taking 4 exposures per visit that are separated by 10 min. Observations are made over 21 nights per lunation reaching -band magnitude of around mag. All data are processed in real time using an automated software and calibrated to Johnson -band. CRTS data contains light curves of about 500 million sources. The detailed information regarding CRTS survey and the optical light curves can be found in Drake et al. (2009, 2013) and Graham et al. (2015).
We cross-correlated our sample of sources with CRTS within a search radius of 3. This cross-correlation yielded optical light curves for a reduced sample of 9069 NLSy1 galaxies and 13,928 BLSy1 galaxies. A common practice in dealing with light curves obtained in large surveys is to identify and consequently remove any spurious outliers that might have been caused by photometric or technical errors. To remove such outliers we applied an iterative 3 clipping algorithm around local group of data points to all the light curves. For any given light curve we removed points with more than 3 deviation from the mean and repeat this process until no points with 3 deviation is present in the light curve or the number of points in the light curve between two consecutive iterations remain the same. Since our aim is to study OV, we further considered only those light curves that have a minimum of 50 epochs of data. This brings down the sample size to 9063 NLSy1 and 13,831 BLSy1 galaxies.
.
.
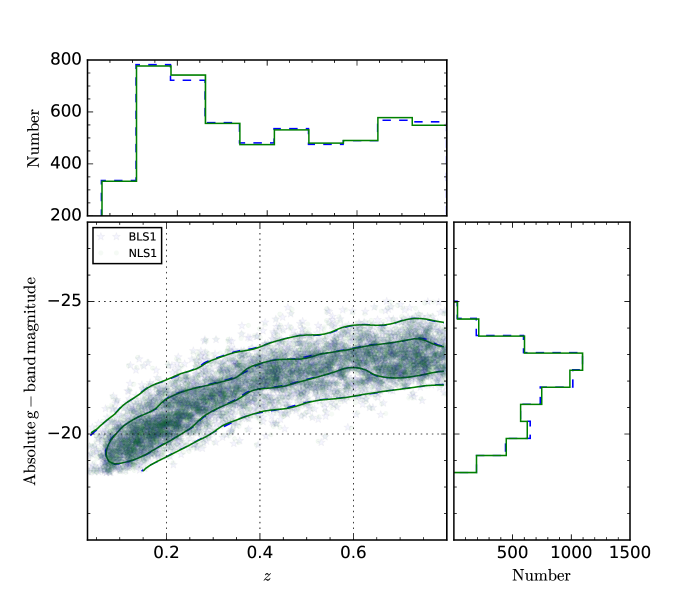
The motivation of this work is to carry out a systematic comparative study of the OV properties between NLSy1 and BLSy1 galaxies. It is, therefore, imperative that the sample so selected must match as close as possible to each other in the luminosity-redshift plane. For that, we divided both the samples in small redshift and luminosity bins, and randomly selected an equal number of NLSy1 and BLSy1 galaxies from each bin. This resulted in a final working sample of 5510 NLSy1 and 5510 BLSy1 galaxies. The distribution of the sample of NLSy1 and BLSy1 galaxies () in the luminosity-redshift plane is shown in Figure 1. From the figure, it is evident that both the sample of galaxies resemble each other. The two-dimensional Kolmogorov–Smirnov (K-S) test (Press et al., 1992) yields a statistics of 0.007 and a -value of 0.98 confirming that both samples have the same distribution.
3 Analysis of variability
The CRTS -band†††The -band has an effective wavelength () of 5510 Å with a bandwidth of 880 Å thus, covering a wavelength range of about 4600 Å to 6400 Å. It can, thus, be contaminated by strong broad emission lines such as redshifted Mg II ( Å) and H ( Å), which also vary with time and follow the nuclear continuum variations. Since our sample spans to 0.8, H will contribute to the -band flux for the objects having while Mg II will contribute for objects having . Therefore, it is very difficult to disentangle the relative contribution of broad emission lines and the continuum to the broad -band photometry. light curves of the sources studied for variability contain a minimum of 50 epochs of data and the total duration of the light curves span years. Various studies show that optical variability of quasar can be well described by a damped random walk (DRW; Kelly et al., 2009), which is a stochastic process with an exponential covariance function
| (1) |
where is the amplitude and is a characteristic time scale of variability (Kozłowski et al., 2010; MacLeod et al., 2010; Zu et al., 2011, 2013, 2016). DRW is shown to provide a realistic explanation of quasar optical variability and both the model parameters, and , are correlated with the physical parameters of AGN such as luminosity, black hole mass and Eddington ratio (Kelly et al., 2009; Kozłowski et al., 2010; MacLeod et al., 2010; Andrae et al., 2013; Kozłowski, 2016c). DRW model is a powerful tool to quantify variability characteristics on time scales of several days to years although recently some limitations of the DRW model has been noticed especially when dealing with light curves that have duration of observations about ten times shorter than the true DRW timescale (Kozłowski, 2016a, b).
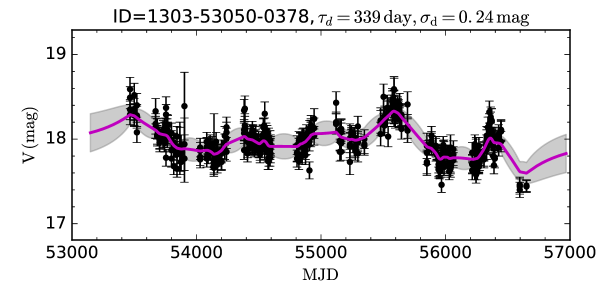
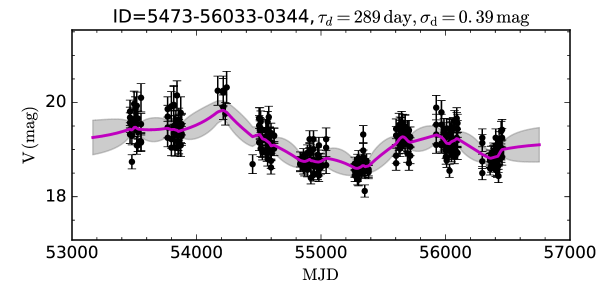
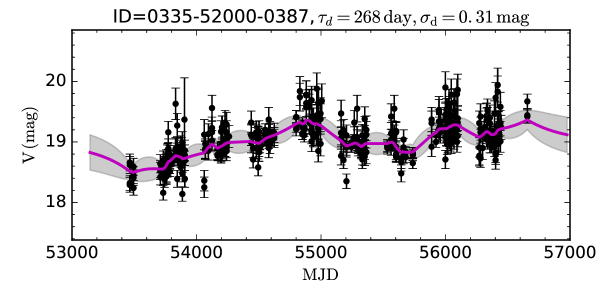
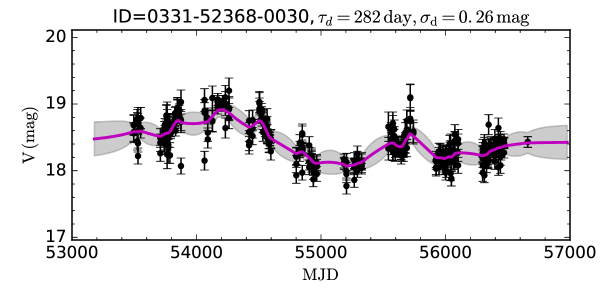
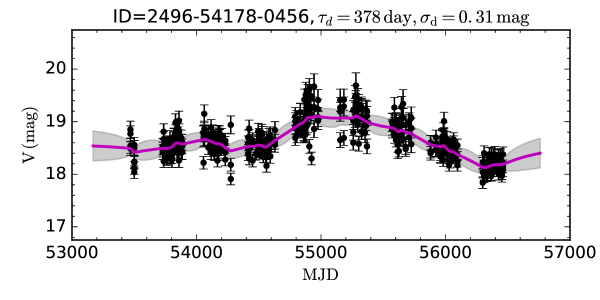
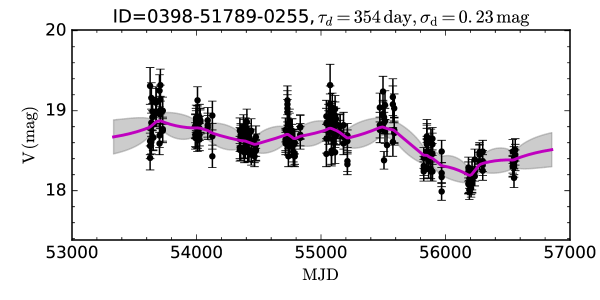
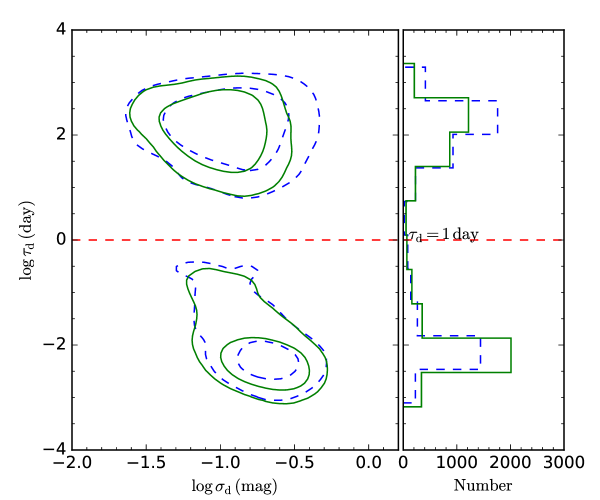
To quantify the variability characteristics of all the sources in our sample, we fit each of their -band CRTS light curves using DRW model implemented in JAVELIN‡‡‡http://bitbucket.org/nye17/javelin which is a python code developed by Zu et al. (2011). Logarithmic priors for both and have been used for fitting the light curves. JAVELIN has been used widely in literature to model the continuum and line emission light curves of AGN reverberation mapping data (Grier et al., 2012; Pancoast et al., 2014). Few examples of fitting done on the light curves are shown in Figure 2. The estimated values of the parameters after fitting all light curves is plotted in Figure 3, where is the rest frame time scale i.e., the time scale of variability corrected for the redshift. A bimodal distribution along the time axis is clearly visible and delineated by a gap at about 1 day. Since the time sampling of CRTS is larger than 1 day, any variability on time scales shorter than 1 day is unreliable and cannot be used for variability analysis. Also, these sources have poor quality light curves with no noticeable variability trend as confirmed by visual examinations. Therefore, only objects having greater than 1 day was considered for further variability analysis. This leads us to a sample of 2161 (39.2%) NLSy1 and 2919 (52.9%) BLSy1 galaxies for further variability analysis. This also suggests that only 39% of NLSy1 galaxies from our original sample are variable while 61% NLSy1 galaxies are non-variable on time scales larger than a day. However, in the case of BLSy1 galaxies, about 53% of our original sample is variable which implies that overall BLSy1 galaxies are more variable than NLSy1 galaxies on time scales longer than a day.
Following Ai et al. (2010), we also calculated the intrinsic amplitude of variability (). This was estimated from the measured variance of the observed light curves after subtracting the measurement errors. The is estimated using the following formalism (see Sesar et al., 2007)
| (2) |
where is the weighted average and the amplitude of variability is
Here, represents the contribution of measurement errors to the variance and it is estimated directly from the errors of individual observed magnitudes ,
| (3) |
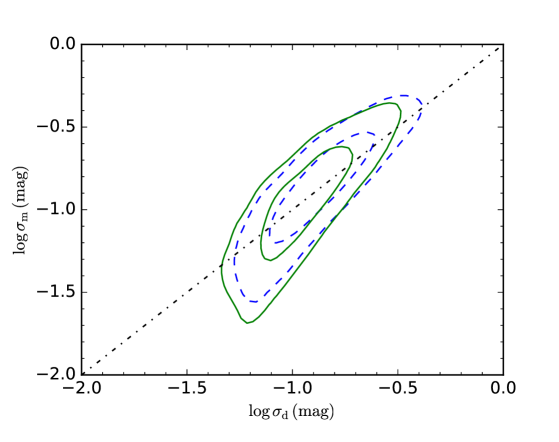
In Figure 4, we show the two indicators of variability amplitude for our sample of sources, obtained from fitting the light curves using JAVELIN and estimated directly from the observed light curves. The dashed-dot line indicates one to one correspondence between the two values. In this work, we used as the indicator of the amplitude of variation unless specified otherwise.
.
.
.
4 Results
4.1 NLSy1 vs BLSy1 galaxies
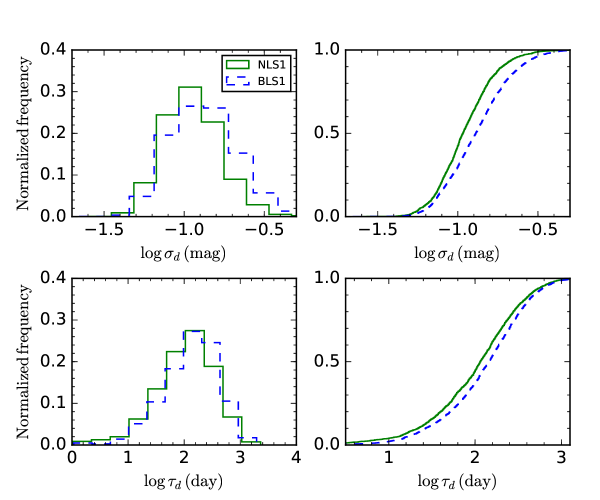
We compare the variability amplitudes and time scales for the 2161 NLSy1 and 2919 BLSy1 galaxies in Figure 5. The normalized histogram (left panel) and cumulative distribution (right panel) of variability amplitude are shown in the upper panels while the same for time scales are shown in the lower panels. The distribution has a median of mag and mag for NLSy1 and BLSy1 galaxies respectively. When distribution is considered, we find the median values are and for NLSy1 and BLSy1 galaxies respectively. Within errors, the median amplitude of variability found in BLSy1 and NLSy1 are similar, however, a two-sample K-S test applied to the distribution of for NLSy1 and BLSy1 galaxies yields a -statistic value of 0.17 and -value of 6 10-31, confirming that the two distributions are significantly different. NLSy1 galaxies as a class are thus less variable than BLSy1 galaxies. Therefore, the strong variability shown by NLSy1 galaxies in X-rays relative to BLSy1 galaxies is not seen in the optical band. The distribution of time scales for NLSy1 galaxies has a peak slightly smaller than that of BLSy1 galaxies, having a median value of days. This is smaller than the median value of days found in BLSy1 galaxies, though the scatter in the distribution is very large. A two-sample K-S test of distribution for NLSy1 and BLSy1 galaxies yields a -statistic value of 0.09 and -value of 2 10-8. As the -statistics is small it is difficult to draw any conclusion on the distribution of between NLSy1 and BLSy1 galaxies. According to Kozłowski (2016b) for reliable estimation of , one needs to have data with a minimum duration of about 10 times longer than the true DRW time scale. As our data span 5 to 9 years, about 18% of NLSy1 galaxies and 24% of BLSy1 galaxies have the duration of light curve . Thus, for those light curves may not represent the true time scale. However, is independent of the duration of light curves and only affected by the photometric noise. As our main motivation is to have a comparative analysis of the amplitude of variability () of NLSy1 and BLSy1 galaxies, we restricted ourselves to further analysis of only.
This study using a matched sample of NLSy1 and BLSy1 galaxies has clearly demonstrated the difference in their OV properties with NLSy1 galaxies showing lower variability amplitude than BLSy1 galaxies. This finding is consistent with the results of Klimek et al. (2004) who studied optical variability using a small sample and the ensemble variability study of Ai et al. (2010, 2013) who analyzed a sample of 55 NLSy1 galaxies and a control sample of 108 BLSy1 galaxies. The weaker variability of NLSy1 galaxies compared to BLSy1 galaxies can be understood in terms of them having smaller width and stronger Fe II emission compared to BLSy1 galaxies. As accretion disk is normally thought to be responsible for optical/UV radiation from AGN, the difference in the OV properties leads us to speculate differences in the physical processes operating in the accretion disks of NLSy1 and BLSy1 galaxies. One possibility could be the slim disk scenario in NLSy1 galaxies compared to the standard Shakara-Sunyaev, geometrically thin optically thick accretion disk in BLSy1 galaxies (Ai et al., 2013).
4.2 Radio subsample
The observed optical emission from radio-loud and radio-quiet objects can be due to a combination of the different physical process. One of the ways to ascertain this is to see if there is any difference in the OV properties of both NLSy1 and BLSy1 galaxies when they are subdivided based on their radio properties. We, therefore, cross-correlated our sample of NLSy1 and BLSy1 galaxies with the Faint Images of the Radio Sky at Twenty centimeters (FIRST)§§§http://sundog.stsci.edu catalog (Becker et al., 1995) within a search radius of 2. We found 122 out of 2161 NLSy1 galaxies and 276 out of 2919 BLSy1 galaxies are detected in FIRST. Depending on their radio-loudness (defined as the logarithmic flux ratio of 1.4 GHz to -band flux, i.e., ), we further divided the radio detected NLSy1 and BLSy1 galaxies into radio-quiet (RQ; ) and radio-loud (RL; ) sub-categories. This resulted in 48 (54) radio-quiet and 74 (222) radio-loud NLSy1 (BLSy1) galaxies.
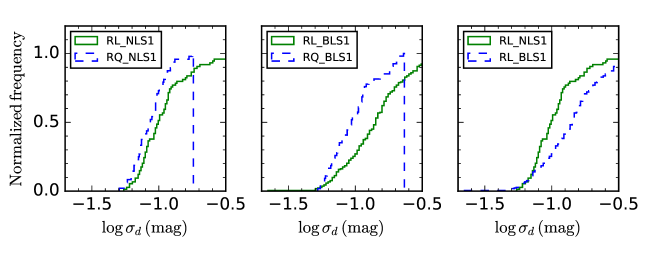
The cumulative distributions of their values are plotted in Figure 6. In both NLSy1 and BLSy1 galaxies (left and middle), radio-loud objects show more variability than their radio-quiet counterparts. Comparing the radio-loud sample of both NLSy1 and BLSy1 galaxies (right panel), we found RL-BLSy1 galaxies are more variable than RL-NLSy1 galaxies. The median values of distributions are () mag and () mag for RL-NLSy1 (RL-BLSy1) and RQ-NLSy1 (RQ-BLSy1) galaxies respectively. When the median variability amplitudes are compared, we find that within error bars, both radio-loud and radio-quiet sources have similar variability amplitudes. However, K-S test indicates that their intrinsic distributions are different. A two-sample K-S test applied on the distributions of RL-NLSy1 and RQ-NLSy1, RL-BLSy1 and RQ-BLSy1, as well as RL-NLSy1 and RL-BLSy1 galaxies yield a -value of 4 10-2 (-statistics , left panel), 1 10-6 (-statistics , middle panel) and 6 10-7 (-statistics , right panel) respectively, confirming that the distributions are different. Therefore the OV of radio-loud sources must be due to some other mechanisms in addition to variations caused due to accretion disk instabilities that operate in radio-quiet sources.
.
.
| Test | Sample | Size | FWHM(H) | z | |||||
|---|---|---|---|---|---|---|---|---|---|
| (1) | (2) | (3) | (4) | (5) | (6) | (7) | (8) | (9) | (10) |
| NLSy1 | 2161 | 0.07(4e04) | 0.08(1e04) | 0.17(7e15) | 0.13(1e09) | 0.08(7e05) | 0.00(9e01) | 0.35(3e65) | |
| BLSy1 | 2919 | 0.18(9e25) | 0.08(2e06) | 0.23(2e37) | 0.27(3e50) | 0.23(4e38) | 0.07(2e05) | 0.44(9e137) | |
| All | 5080 | 0.22(2e60) | 0.09(3e11) | 0.25(3e73) | 0.27(3e86) | 0.21(3e55) | 0.16(1e30) | 0.40(1e200) |
.
4.3 X-ray subsample
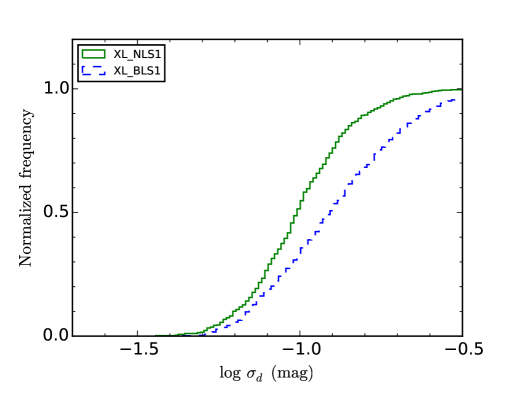
NLSy1 galaxies are known to show strong soft X-ray variability than their broad line counterparts (Leighly, 1999a; Grupe, 2004). To ascertain if this nature of NLSy1 galaxies holds true in their OV properties too, we created a subsample of X-ray detected (XL) NLSy1 and BLSy1 galaxies from the work of Rakshit et al. (2017). A total of 577 NLSy1 galaxies and 653 BLSy1 galaxies, out of 2161 NLSy1 galaxies and 2919 BLSy1 galaxies are detected in the second ROSAT all-sky (2RXS) source catalog (Boller et al., 2016). The cumulative distribution of their values is shown in Figure 7. The distribution has a median of mag and mag for XL-NLSy1 and XL-BLSy1 galaxies respectively. A two-sample K-S test confirms distributions to be significantly different (-statistics and -value 10-18). Hence, the XL-BLSy1 galaxies are more variable than XL-NLSy1 galaxies. As the high flux variation shown by NLSy1 galaxies relative to BLSy1 galaxies in the X-ray band is not seen in the OV light curves, it is clear that the physical processes causing the X-ray flux variation and OV are different.
| Sample | redshift | Size | FWHM(H) | |||||
|---|---|---|---|---|---|---|---|---|
| NLSy1 | 270 | 0.03(5e) | 0.11(5e02) | 0.17(4e03) | 0.04(5e01) | 0.09(1e01) | 0.07(2e01) | |
| BLSy1 | 367 | 0.03(5e01) | 0.11(2e02) | 0.17(1e03) | 0.07(1e01) | 0.14(4e03) | 0.01(8e01) | |
| All | 637 | 0.01(8e01) | 0.11(2e03) | 0.16(3e05) | 0.04(3e01) | 0.11(4e03) | 0.01(6e01) | |
| NLSy1 | 685 | 0.07(4e02) | 0.03(4e01) | 0.23(2e09) | 0.12(7e04) | 0.08(2e02) | 0.01(8e01) | |
| BLSy1 | 863 | 0.19(1e08) | 0.08(1e02) | 0.19(1e08) | 0.21(1e10) | 0.11(5e04) | 0.16(2e06) | |
| All | 1548 | 0.21(4e18) | 0.06(8e03) | 0.25(1e23) | 0.23(6e21) | 0.13(1e07) | 0.18(1e13) | |
| NLSy1 | 612 | 0.09(1e01) | 0.00(9e01) | 0.24(1e09) | 0.10(1e02) | 0.30(1e14) | 0.27(3e12) | |
| BLSy1 | 847 | 0.20(3e09) | 0.06(4e02) | 0.39(3e31) | 0.12(4e04) | 0.27(4e16) | 0.25(2e14) | |
| All | 1459 | 0.28(2e28) | 0.03(1e01) | 0.38(2e51) | 0.21(1e16) | 0.17(8e11) | 0.34(6e42) | |
| NLSy1 | 571 | 0.00(9e01) | 0.09(1e02) | 0.29(8e13) | 0.35(4e18) | 0.49(2e36) | 0.33(1e16) | |
| BLSy1 | 841 | 0.23(2e12) | 0.10(2e03) | 0.34(1e24) | 0.11(6e03) | 0.42(7e39) | 0.32(1e22) | |
| All | 1412 | 0.27(3e25) | 0.09(6e04) | 0.37(3e48) | 0.16(2e10) | 0.32(4e35) | 0.37(2e49) |
4.4 Correlation of variability and emission line parameters
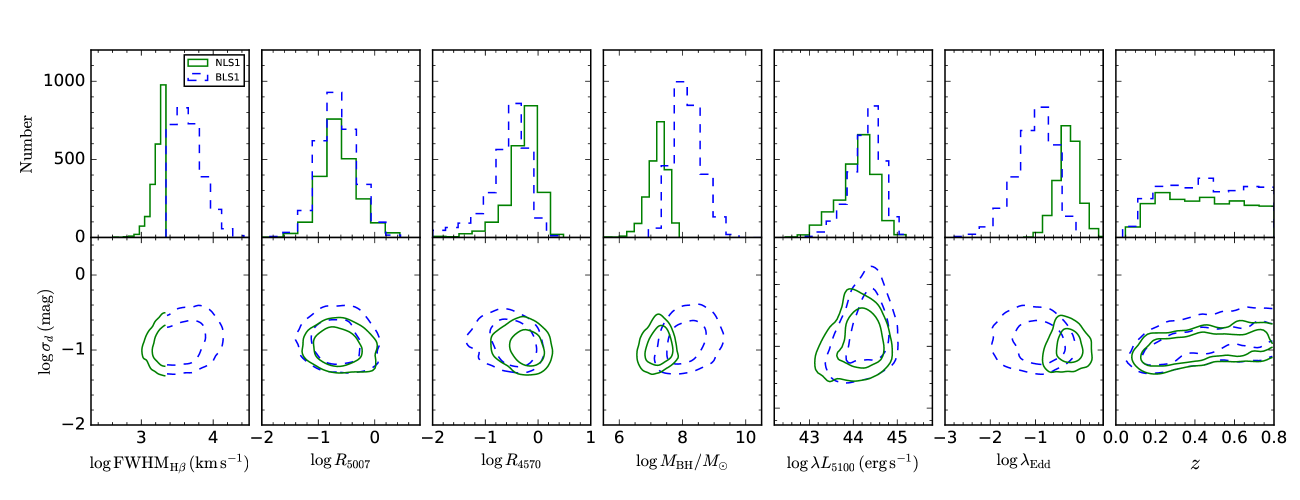
The work of Rakshit et al. (2017) has yielded various emission line parameters of the sources in our sample. To understand how variability is related to the key physical properties of AGN, we tested several correlations between variability and various physical characteristics of the sources such as FWHM(H), strength of [O III] line (defined as ), Fe II strength relative to H (defined as Fe II()/H), and monochromatic luminosity at 5100 (). All these parameters were taken from the work of Rakshit et al. (2017). In Figure 8, the distributions of individual parameters are shown in the top panel, while in the bottom panel the correlations of them with is shown. Table 1 summarizes the Spearman’s rank correlation coefficient and the two-sided -values for the null hypothesis of no correlation.
The amplitude of variability is positively correlated with the width of H line but negatively correlated with . Spearman’s rank correlation test confirms both the correlations to be significant. The above correlations are found to remain when all the sources are considered together or separately for the sample of BLSy1 and NLSy1 galaxies. The strong anticorrelation of variability amplitude with found here implies a lower variability in NLSy1 than BLSy1 galaxies since the former has stronger Fe II emission than the latter. However, no correlation between and has been found. These results are consistent with the findings of Ai et al. (2010) although their sample is very small compared to this work. It is likely that the low amplitude of variability in NLSy1 galaxies compared to BLSy1 galaxies is an outcome of the correlation seen between and width of H line and . A positive correlation is also found between and .
4.5 Dependence of variability with redshift
Though the redshift range of this study is limited to (demanded by the presence of both H and H in the SDSS spectra; Rakshit et al., 2017), a strong positive correlation is found between and with a Spearman’s rank correlation coefficient of 0.40 and -value of 1 10-200 with the high sources showing larger amplitude of variability than their low counterparts. This is the strongest correlation among all the other correlations investigated here. Such redshift evolution of variability was also noticed in quasars by Vanden Berk et al. (2004) up to although Kozłowski et al. (2010) and MacLeod et al. (2010) found a negligible trend with redshift suggesting that the variability is intrinsic to the quasar and do not evolve over cosmic time for fixed physical parameters of the quasars (black hole mass, absolute magnitude etc). Since AGNs are more variable at shorter wavelengths and therefore, positive correlation observed between and in this work is most likely a manifestation of the anticorrelation known between variability and wavelength (Cid Fernandes et al., 1996) because higher redshifts probe shorter rest frame wavelengths.
4.6 Dependence of variability with
In the process of selection of new NLSy1 galaxies, Rakshit et al. (2017) has carried out spectral fitting of SDSS spectra for all the candidates selected in their study. The results of that fitting was used to derive the black hole mass of each of the sources assuming virial relationship using the following equation
| (4) |
where, is the FWHM of the broad component of H emission line and is a scale factor that depends strongly on the geometry and kinematics of the BLR (Rakshit et al., 2015). Considering the spherical distribution of clouds we used . In Figure 8 the correlation between variability amplitude and BH mass is shown. It is clear from the figure that is positively correlated with . The positive correlation found here between is consistent with Wold et al. (2007), Wilhite et al. (2008) and Ai et al. (2010). However, Ai et al. (2010) found the correlation to vanish when the dependency of is considered in the relation. Li & Cao (2008) suggested that such a positive correlation between variability amplitude and black hole mass can be explained in terms of an accretion disk model having the mean accretion rate of and a variation of .
.
4.7 Dependence of variability with Eddington ratio
The Eddington ratio, defined as the ratio of the bolometric luminosity to Eddington luminosity is a very important physical parameter that characterizes the accretion rate of an AGN. For the sources in our sample, Eddington ratio () is estimated as
| (5) |
where and (Kaspi et al., 2000). The correlation between and is shown in Figure 8, wherein an anti-correlation is observed. This correlation will have effects due to uncertainties in calculation of and consequently . Such a correlation is also observed by Kelly et al. (2009), MacLeod et al. (2010), Ai et al. (2010) and many others. It has been shown by Ai et al. (2010) that the correlation between and remains significant even after taking the dependency of leading them to conclude the existence of a robust negative correlation between and .
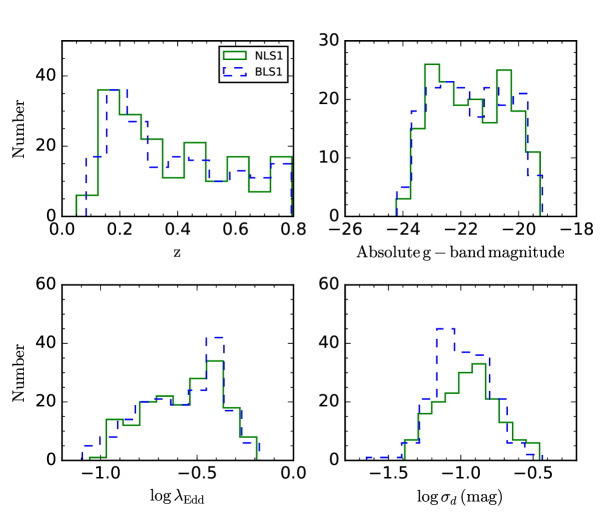
To study the effect of on , we created a subsample of 176 NLSy1 and BLSy1 galaxies each, by matching as close as possible their , and . The distribution of (upper-left), (upper-right) and (lower-left) for this sub-sample of NLSy1 (solid) and BLSy1 (dashed) galaxies are shown in Figure 9. The distributions look similar. A K-S test gave -statistics (-values) of 0.04 (0.99), 0.05(0.93) and 0.05 (0.93) for the distributions of , and , that indicates of no differences in the distributions of , and between the sub-samples of NLSy1 and BLSy1 galaxies. Also, the distribution of (lower-right) for this sub-sample is shown in Figure 9. A two sample K-S test applied to the distributions of for this subsample of NLSy1 and BLSy1 galaxies gives a -statistics and -value of 0.10 and 0.30 respectively indicating that this sub-sample of NLSy1 and BLSy1 galaxies have similar distributions. Therefore, when matched in , both NLSy1 and BLSy1 galaxies are indistinguishable in their amplitude of OV. However, when considering the full sample of NLSy1 and BLSy1 galaxies, the larger amplitude of OV shown by BLSy1 galaxies relative to their NLSy1 counterparts is due to them having lower compared to NLSy1 galaxies which is also manifested in the negative correlation between and .
The correlation between and found here can be understood from the simple standard accretion disk model (Shakura & Sunyaev, 1973). If the emission originates from the inner accretion disk, the emission decreases as it propagates outward. As the Eddington ratio increases, the radius () of emission region at a given wavelength moves outward i.e., increases with Eddington ratio since , where is the temperature of the disk, is the wavelength and is the mass accretion rate normalized by the Eddington rate. Since NLSy1 galaxies have higher Eddington ratio compared to BLSy1 galaxies at a given wavelength, the size of emission region is larger in NLSy1 galaxies than BLSy1 galaxies and thus variability amplitude is lower in the former than the latter.
.
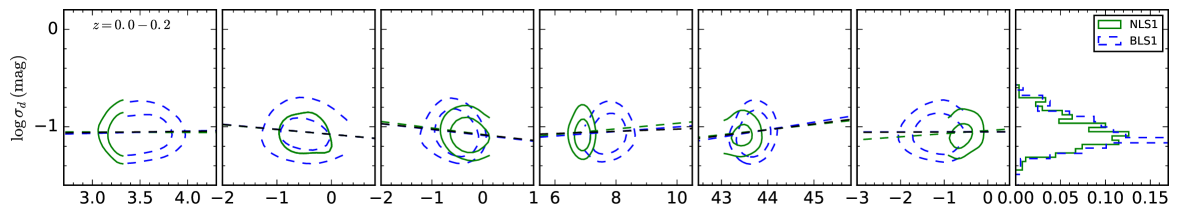
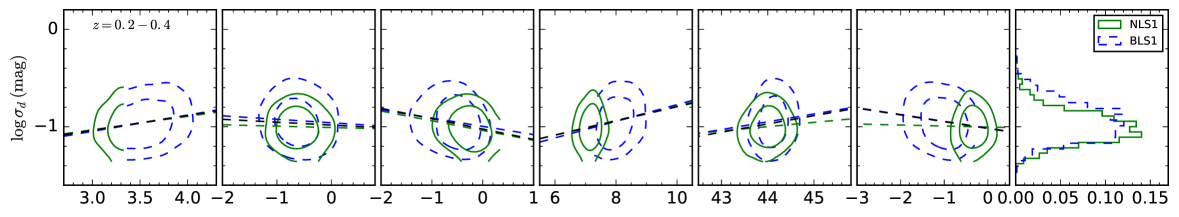
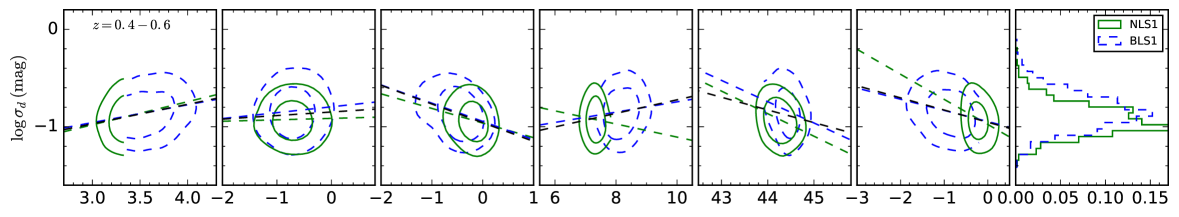
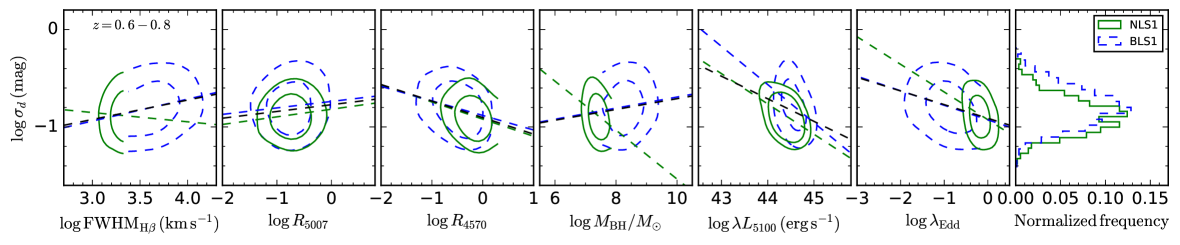
4.8 Variability vs physical parameters in redshift bins
To study the correlations mentioned in the earlier sections in detail, we further divided the sample into different redshift bins (, , , ). All the correlations are shown in Figure 10 and results of the correlation analysis are given in Table 2. It seems that at lower redshifts (), the correlation between and all the physical parameters investigated here is insignificant but for higher redshifts (), is strongly correlated with FWHM(H), , and . increases with FWHM(H) but decreases with Fe II strength, luminosity, and Eddington ratio. Analyzing the correlation between and we found it to be weak when dividing all the objects in different redshift bins.
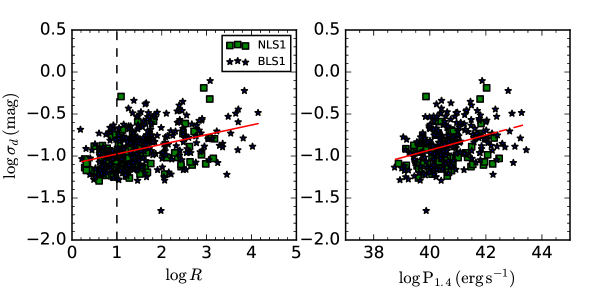
4.9 Correlation of variability and radio-loudness
A small sub-set of our sample of NLSy1 and BLSy1 galaxies have radio counterparts from the FIRST survey. In both the population of BLSy1 and NLSy1 galaxies radio-loud sources are found to be more variable than radio-quiet sources (see section 4.2). Though Eddington ratio plays an important role an additional mechanism might be at work in radio-loud objects. Since the origin of radio emission is relativistic jets, some contribution of it might influence the optical variability. In Figure 11, we plotted the variability amplitude against radio-loudness (left panel) and radio-power (right panel) for both NLSy1 and BLSy1 galaxies. Interestingly, a moderately strong correlation between variability amplitude and radio-loudness is found. This correlation is also present when the two samples are considered separately. The optical variability is also positively correlated with radio-power ( and -value=) suggesting that objects with strong jet show a large amplitude of variation in optical. The variation of with radio-loudness and radio-power can be explained by the following relations
| (6) | |||||
| (7) |
This finding leads us to hypothesize that the mechanisms for OV in radio-loud and radio-quiet objects can be quite different. It is likely that the optical emission in radio-quiet sources is due to the presence of both non-thermal emission from the jet in addition to the thermal emission from the accretion disk. Alternatively, in radio-quiet sources, the optical emission is due to accretion disk thermal emission.
.
5 Summary and Conclusion
We studied the OV of a large sample of NLSy1 and BLSy1 galaxies using archival -band data from CRTS. The present study is a manifold increase compared to the earlier work in terms of (a) the number of objects used, (b) the epochs of data used for each of the objects, and (c) the duration of observations. In this work we have used a sample of 5510 NLSy1 and 5510 BLSy1 galaxies well matched in the plane. Each of these objects has a minimum of 50 epochs of data spanning 5 to 9 years. Therefore, the present sample along with the rich data set is ideal for a comparative study of the OV properties of NLSy1 and BLSy1 galaxies. The -band light curves of our sample sources were modeled using DRW to understand their variability. From our sample, 2161 (39.2%) NLSy1 and 2919 (52.9%) BLSy1 show variability in CRTS long-term light curve on time scale larger than a day. The sources that showed variability on time scale larger than a day are further considered for detailed analysis. Our main findings are as follows.
-
•
The median amplitude of variability is found to be mag for NLSy1 galaxies and for BLSy1 galaxies. Though the median values of agree within error bars, a K-S test confirms with high significance that the two distributions are indeed different. Thus, NLSy1 galaxies as a class show lower amplitude of variation in the optical than BLSy1 galaxies. However, in a sub-sample of NLSy1 and BLSy1 galaxies that have nearly identical , the distribution of is found to be similar. Therefore, the larger amplitude of OV seen in BLSy1 galaxies relative to NLSy1 galaxies is due them having lower than NLSy1 galaxies.
-
•
Radio-loud objects in our sample in general are found to be more variable than their radio-quiet counterparts. Also, radio-loud BLSy1 galaxies are more variable than radio-loud NLSy1 galaxies as confirmed by K-S test. This increased variability in radio-loud sources both in NLSy1 and BLSy1 galaxies relative to radio-quiet sources might be due to the presence of non-thermal jet emission in addition to the thermal disk emission in them, compared to the contribution of only thermal emission from the accretion disk to the optical light in radio-quiet sources.
-
•
When X-ray detected NLSy1 and BLSy1 galaxies are considered separately, we find median amplitude of variations of mag for XL-NLSy1 and mag for XL-BLSy1 galaxies. According to K-S test XL-BLSy1 galaxies are more variable than XL-NLSy1 galaxies.
-
•
A strong anti-correlation is found between the amplitude of variability and and suggesting accretion disk as the main driver of the OV in both broad and narrow line Seyfert 1 galaxies.
-
•
The amplitude of OV is found to be correlated with radio-loudness and radio-power. This hints for the contribution of jets in the OV of RL-NLSy1 and RL-BLSy1 galaxies in addition to Eddington ratio which is the main factor of OV in their radio-quiet counterparts.
References
- Ai et al. (2013) Ai, Y. L., Yuan, W., Zhou, H., et al. 2013, AJ, 145, 90
- Ai et al. (2010) Ai, Y. L., Yuan, W., Zhou, H. Y., et al. 2010, ApJ, 716, L31
- Alam et al. (2015) Alam, S., Albareti, F. D., Allende Prieto, C., et al. 2015, ApJS, 219, 12
- Andrae et al. (2013) Andrae, R., Kim, D.-W., & Bailer-Jones, C. A. L. 2013, A&A, 554, A137
- Aretxaga et al. (1997) Aretxaga, I., Cid Fernandes, R., & Terlevich, R. J. 1997, MNRAS, 286, 271
- Baldi et al. (2016) Baldi, R. D., Capetti, A., Robinson, A., Laor, A., & Behar, E. 2016, MNRAS, 458, L69
- Bauer et al. (2009) Bauer, A., Baltay, C., Coppi, P., et al. 2009, ApJ, 696, 1241
- Becker et al. (1995) Becker, R. H., White, R. L., & Helfand, D. J. 1995, ApJ, 450, 559
- Boller et al. (2016) Boller, T., Freyberg, M. J., Trümper, J., et al. 2016, A&A, 588, A103
- Calderone et al. (2013) Calderone, G., Ghisellini, G., Colpi, M., & Dotti, M. 2013, MNRAS, 431, 210
- Cid Fernandes et al. (2000) Cid Fernandes, R., Sodré, Jr., L., & Vieira da Silva, Jr., L. 2000, ApJ, 544, 123
- Cid Fernandes et al. (1996) Cid Fernandes, Jr., R., Aretxaga, I., & Terlevich, R. 1996, MNRAS, 282, 1191
- Decarli et al. (2008) Decarli, R., Dotti, M., Fontana, M., & Haardt, F. 2008, MNRAS, 386, L15
- di Clemente et al. (1996) di Clemente, A., Giallongo, E., Natali, G., Trevese, D., & Vagnetti, F. 1996, ApJ, 463, 466
- Doroshenko et al. (2006) Doroshenko, V. T., Sergeev, S. G., Gaskell, C. M., et al. 2006, Astronomy Reports, 50, 708
- Drake et al. (2009) Drake, A. J., Djorgovski, S. G., Mahabal, A., et al. 2009, ApJ, 696, 870
- Drake et al. (2013) Drake, A. J., Catelan, M., Djorgovski, S. G., et al. 2013, ApJ, 763, 32
- Goodrich (1989) Goodrich, R. W. 1989, ApJ, 342, 224
- Graham et al. (2015) Graham, M. J., Djorgovski, S. G., Stern, D., et al. 2015, MNRAS, 453, 1562
- Greenstein (1963) Greenstein, J. L. 1963, Nature, 197, 1041
- Grier et al. (2012) Grier, C. J., Peterson, B. M., Pogge, R. W., et al. 2012, ApJ, 744, L4
- Grupe (2004) Grupe, D. 2004, AJ, 127, 1799
- Hawkins (2000) Hawkins, M. R. S. 2000, A&AS, 143, 465
- Hook et al. (1994) Hook, I. M., McMahon, R. G., Boyle, B. J., & Irwin, M. J. 1994, MNRAS, 268, 305
- Kaspi et al. (2000) Kaspi, S., Smith, P. S., Netzer, H., et al. 2000, ApJ, 533, 631
- Kawaguchi et al. (1998) Kawaguchi, T., Mineshige, S., Umemura, M., & Turner, E. L. 1998, ApJ, 504, 671
- Kellermann et al. (1989) Kellermann, K. I., Sramek, R., Schmidt, M., Shaffer, D. B., & Green, R. 1989, AJ, 98, 1195
- Kelly et al. (2009) Kelly, B. C., Bechtold, J., & Siemiginowska, A. 2009, ApJ, 698, 895
- Klimek et al. (2004) Klimek, E. S., Gaskell, C. M., & Hedrick, C. H. 2004, ApJ, 609, 69
- Kozłowski (2016a) Kozłowski, S. 2016a, MNRAS, 459, 2787
- Kozłowski (2016b) —. 2016b, ArXiv e-prints, arXiv:1611.08248
- Kozłowski (2016c) —. 2016c, ApJ, 826, 118
- Kozłowski et al. (2010) Kozłowski, S., Kochanek, C. S., Udalski, A., et al. 2010, ApJ, 708, 927
- Leighly (1999a) Leighly, K. M. 1999a, ApJS, 125, 297
- Leighly (1999b) —. 1999b, ApJS, 125, 317
- Li & Cao (2008) Li, S.-L., & Cao, X. 2008, MNRAS, 387, L41
- Liu et al. (2016) Liu, X., Yang, P., Supriyanto, R., & Zhang, Z. 2016, International Journal of Astronomy and Astrophysics, 6, 166
- Lynden-Bell (1969) Lynden-Bell, D. 1969, Nature, 223, 690
- MacLeod et al. (2010) MacLeod, C. L., Ivezić, Ž., Kochanek, C. S., et al. 2010, ApJ, 721, 1014
- Meusinger et al. (2011) Meusinger, H., Hinze, A., & de Hoon, A. 2011, A&A, 525, A37
- Miller et al. (2000) Miller, H. R., Ferrara, E. C., McFarland, J. P., et al. 2000, New A Rev., 44, 539
- Osterbrock & Pogge (1985) Osterbrock, D. E., & Pogge, R. W. 1985, ApJ, 297, 166
- Pancoast et al. (2014) Pancoast, A., Brewer, B. J., Treu, T., et al. 2014, MNRAS, 445, 3073
- Press et al. (1992) Press, W. H., Teukolsky, S. A., Vetterling, W. T., & Flannery, B. P. 1992, Numerical recipes in FORTRAN. The art of scientific computing
- Rakshit et al. (2015) Rakshit, S., Petrov, R. G., Meilland, A., & Hönig, S. F. 2015, MNRAS, 447, 2420
- Rakshit et al. (2017) Rakshit, S., Stalin, C. S., Chand, H., & Zhang, X.-G. 2017, ApJS, 229, 39
- Rees (1984) Rees, M. J. 1984, ARA&A, 22, 471
- Richards et al. (2002) Richards, G. T., Fan, X., Newberg, H. J., et al. 2002, AJ, 123, 2945
- Schmidt (1963) Schmidt, M. 1963, Nature, 197, 1040
- Sesar et al. (2007) Sesar, B., Ivezić, Ž., Lupton, R. H., et al. 2007, AJ, 134, 2236
- Shakura & Sunyaev (1973) Shakura, N. I., & Sunyaev, R. A. 1973, A&A, 24, 337
- Ulrich et al. (1997) Ulrich, M.-H., Maraschi, L., & Urry, C. M. 1997, ARA&A, 35, 445
- Vanden Berk et al. (2004) Vanden Berk, D. E., Wilhite, B. C., Kron, R. G., et al. 2004, ApJ, 601, 692
- Véron-Cetty et al. (2001) Véron-Cetty, M.-P., Véron, P., & Gonçalves, A. C. 2001, A&A, 372, 730
- Wagner & Witzel (1995) Wagner, S. J., & Witzel, A. 1995, ARA&A, 33, 163
- Wilhite et al. (2008) Wilhite, B. C., Brunner, R. J., Grier, C. J., Schneider, D. P., & vanden Berk, D. E. 2008, MNRAS, 383, 1232
- Wold et al. (2007) Wold, M., Brotherton, M. S., & Shang, Z. 2007, MNRAS, 375, 989
- Woo & Urry (2002) Woo, J.-H., & Urry, C. M. 2002, ApJ, 579, 530
- Xu et al. (2012) Xu, D., Komossa, S., Zhou, H., et al. 2012, AJ, 143, 83
- Young et al. (1999) Young, A. J., Crawford, C. S., Fabian, A. C., Brandt, W. N., & O’Brien, P. T. 1999, MNRAS, 304, L46
- Zhou et al. (2006) Zhou, H., Wang, T., Yuan, W., et al. 2006, ApJS, 166, 128
- Zu et al. (2016) Zu, Y., Kochanek, C. S., Kozłowski, S., & Peterson, B. M. 2016, ApJ, 819, 122
- Zu et al. (2013) Zu, Y., Kochanek, C. S., Kozłowski, S., & Udalski, A. 2013, ApJ, 765, 106
- Zu et al. (2011) Zu, Y., Kochanek, C. S., & Peterson, B. M. 2011, ApJ, 735, 80