Formation of complex molecules in prestellar cores: a multilayer approach
Abstract
We present the results of chemical modeling of complex organic molecules (COMs) under conditions typical for prestellar cores. We utilize an advanced gas-grain astrochemical model with updated gas-phase chemistry, with a multilayer approach to ice-surface chemistry and an up-to-date treatment of reactive desorption based on recent experiments of Minissale et al. (2016b). With the chemical model, radial profiles of molecules including COMs are calculated for the case of the prototypical prestellar core L1544 at the timescales when the modeled depletion factor of CO becomes equal to that observed. We find that COMs can be formed efficiently in L1544 up to the fractional abundances of 10(-10) wrt. total hydrogen nuclei. Abundances of many COMs such as CH3OCH3, HCOOCH3, and others peak at similar radial distances of 2000–4000 AU. Gas-phase abundances of COMs depend on the efficiency of reactive desorption, which in turn depends on the composition of the outer monolayers of icy mantles. In prestellar cores, the outer monolayers of mantles likely include large fractions of CO and its hydrogenation products, which may increase the efficiency of reactive desorption according to Minissale et al. (2016b), and makes the formation of COMs efficient under conditions typical for prestellar cores, although this assumption is yet to be confirmed experimentally. The hydroxyl radical (OH) appears to play an important role in gas-phase chemistry of COMs, which makes it deserving further detailed studies.
1 Introduction
Evolution of organic matter and build-up of molecular complexity during the process of star- and planet formation is one of the most important but still not well understood questions in astochemistry (Herbst & van Dishoeck, 2009). While the formation of exotic “carbon-chain” molecules known in cold interstellar cores for several decades can be explained via gas-phase ion-molecular and neutral-neutral reactions, the mechanisms of formation of saturated complex organic molecules (COMs) such as CH3OH, CH3OCH3, HCOOCH3 and others are more uncertain. Formation of COMs in hot cores and corinos is reasonably well explained by the “warm-up scenario” (Garrod & Herbst, 2006; Garrod et al., 2008), in which complex organic molecules first form via surface radical-radical reactions at 30–40 K and then evaporate to the gas at higher temperatures reaching fractional abundances of about 10-8–10-7 with respect to hydrogen similar to those observed (Blake et al., 1987; Cazaux et al., 2003; Bottinelli et al., 2004b, a). However, organic molecules in cold cores (e.g., Öberg et al., 2010; Bacmann et al., 2012; Cernicharo et al., 2012; Vastel et al., 2014) require other mechanisms to explain their formation, since warm-up develops in later stages, after the switch on of a protostar.
To date, several scenarios have been proposed to explain the formation of COMs typical for terrestrial chemistry during the earliest stages of star formation prior to the warm-up phase. Note that all of them involve grain-surface chemical processes and non-thermal desorption of species from cold dust grains into the gas phase. The first attempt to explain terrestrial-type COMs discovered in L1689b and B1-b was made by Vasyunin & Herbst (2013b). In that study, the authors proposed that COMs in the cold gas may be formed via ion-molecule and radiative association reactions between precursor molecules formed on cold grains and then ejected in the gas phase via efficient reactive desorption. While the observed abundances of COMs were satisfactorily explained, the model significantly overestimated abundances of CH3OH and H2CO in the gas phase. Balucani et al. (2015) improved this scenario by adding a neutral-neutral reaction linking methyl formate and dimethyl ether in the gas phase, and adjusting rates of several other important gas-phase reactions. These improvements allowed Balucani et al. (2015) to reach better agreement with observations for methanol and establish a clear chemical link between CH3OCH3 and HCOOCH3. Reboussin et al. (2014) showed that impulsive heating of interstellar grains via cosmic ray particles may increase the mobility of species on grain surface and enhance formation of COMs, making their abundances somewhat closer to observed values. However, Reboussin et al. (2014) do not take into account the locality of cosmic ray heating of a dust grain and icy mantle which has been shown to have major effect on the chemistry in the ice (Ivlev et al., 2015). Recently, Ruaud et al. (2015) showed that the Eley-Rideal surface reaction mechanism which does not require surface mobility of species, and normally not considered in astrochemical models, assisted by complex induced reactions may be efficient in producing observed amounts of complex organic molecules at 10 K. However, the abundances of some important complex organic molecules such as methyl formate are below observed values by 1–2 orders of magnitude. Using microscopic Monte-Carlo simulations, Chang & Herbst (2016) showed that non-diffusive chain chemical reactions may lead to the formation of complex organic molecules in icy mantles of interstellar grains at low temperatures of 10 K. However, we note that the ejection of COMs from the grain surface to the gas phase does not consider the results from recent laboratory experiments (see below, and Dulieu et al. (2013) and Minissale et al. (2016a)).
Although models published to date have shed some light on the mystery of low-temperature formation of complex organic molecules, they rely on poorly known assumptions and parameters. At low temperatures of about 10 K, the only way to establish the required feedback from grain-surface chemistry to the gas phase chemistry is to invoke non-thermal desorption of species. Under the conditions typical for cold dark clouds, the most efficient type of non-thermal desorption is likely the so-called reactive desorption (a.k.a. chemical desorption, or desorption upon formation; Garrod et al. 2006, 2007). By reactive desorption (RD) we call the process of breaking the surface-molecular bond of a reaction product due to the release of formation energy in surface two-body association reaction. Reactive desorption is a complex process which is controlled by a number of factors, e.g. internal structure of molecules, type of surface etc. The efficiency of reactive desorption (fraction of products of a surface reaction ejected into the gas phase) is a matter of debate in the community and a subject of both experimental and theoretical studies. In the early theoretical study by Garrod et al. (2007) based on Rice-Ramsperger-Kessel (RRK) theory, the authors proposed the efficiency of RD to be of about 1–3% and only slightly dependent on the type of desorbing molecule. Vasyunin & Herbst (2013b) showed that for the explanation of observed abundances of COMs in cold clouds one needs to assume efficiency of RD of about 10% at least for methanol and formaldehyde.
In a series of laboratory experiments on reactive desorption, which are the most comprehensive to date, Dulieu et al. (2013) and Minissale & Dulieu (2014) found surprisingly high efficiency of reactive desorption for certain systems (e.g., 80% for the reaction O+OO2 on bare silicate) but also strong dependence of desorption efficiency on the particular chemical reaction and the type of surface. One of the important results for astrochemistry is that the efficiency of reactive desorption in laboratory experiments is dramatically reduced if bare silicate is covered by water ice. As summarized in Minissale et al. (2016b), for the majority of studied reactions, the efficiency of reactive desorption falls below the upper limit of 5–10% measurable in experiments, if surface is amorphous solid water. Using the experimental data, Minissale et al. (2016b) derived a semi-empirical theory that describes the dependence of the efficiency of RD on the type of surface, enthalpy of reaction and internal structure of desorbing molecule. The theory predicts negligible efficiency of reactive desorption for methanol and formaldehyde from the surface of water ice, which is believed to be the dominant constituent of icy mantles of grains in cold clouds (e.g., Öberg et al., 2011). This fact can be considered as a serious argument against the scenario of formation of COMs in cold clouds proposed by Vasyunin & Herbst (2013b).
However, water ice is not the only major constituent of icy mantles in cold clouds. A number of observations over the last four decades revealed the main constituents of interstellar ices to be water (Gillett & Forrest, 1973), carbon monoxide (Lacy et al., 1984), carbon dioxide (de Graauw et al., 1996), methanol (Grim et al., 1991), ammonia (van Dishoeck, 2004) and methane (Lacy et al., 1991). The ice compositions appears to be somewhat different in protostellar objects at different stages of development, but surprisingly similar between objects from the same evolutionary class (Öberg et al., 2011). In particular, the fraction of solid CO in ice is lower in high-mass protostars (0.1), and significantly higher towards low-mass protostars, or prestellar cores (0.3) (see Table 2 in Öberg et al., 2011). From the analysis of the shapes of IR absorption bands, constraints on the ice structure were also inferred. In quiescent molecular dark clouds, e.g. in prestellar cores, icy mantles likely consist of two phases: water-rich polar phase and water-poor but CO-rich apolar phase Tielens et al. (1991). It is likely that the CO-rich apolar phase is on top of water-rich mantles, because it is mainly formed from CO accreted from the dense gas after dense clouds are formed. Observed large (90%) depletion of gas-phase CO in prestellar cores (e.g., Caselli et al., 1999) and results of multilayer modeling of icy mantles (Garrod & Pauly, 2011; Vasyunin & Herbst, 2013a) are in favor of this assumption. As such, it is likely that the ice surface in prestellar clouds is mostly covered by CO ice, and, probably, by the product of CO hydrogenation such as formaldehyde and methanol. Indeed, Bizzocchi et al. (2014) showed that the observed methanol towards the prestellar core L1544 exhibits low degree of deuteration compared to N2H+ and NH3, which implies that its emission comes from the outer parts of the cloud where CO is on the onset of depletion. The CH3OH map obtained by these authors toward L1544 shows a ring-like structure surrounding the dust continuum emission, which peaks at a distance similar to where CO depletion occurs within the core. As such, it is likely that CO accretion onto ices and the formation of CH3OH and other COMs happens simultaneously, dominating the outer shells of icy mantles. This is in line with the recent results of Jiménez-Serra et al. (2016) who have shown that COMs are enhanced toward this CH3OH-rich, ring-like structure in L1544 with respect to its center. Efficiencies of RD from CO ice have not been studied experimentally so far. However, according to the semi-empirical theory by Minissale et al. (2016b), they must be significantly higher than in the case of water ice. This makes prestellar cores excellent laboratories where to test whether the formation of COMs in cold objects occurs via the scenario proposed by Vasyunin & Herbst (2013b).
In this work, we present an extended model of formation of complex organic molecules in prestellar cores. The model by Vasyunin & Herbst (2013b) is improved by adding a state-of-the-art treatment of reactive desorption by Minissale et al. (2016b). For the first time, we theoretically explore the impact of the composition of ice surface on the efficiency of reactive desorption and, thus, on the formation of complex organic molecules. To better treat the composition of the surface and interior (bulk) of thick icy mantles of interstellar grains in dark clouds, we employ a multilayer approach to grain-surface chemistry, and treat grain-surface and bulk chemistry separately. In addition, we consider the impact of new gas phase reactions recently proposed by Shannon et al. (2013, 2014) and Balucani et al. (2015) on the formation of complex organic molecules. By combining our chemical model with the physical model of the prestellar core L1544 by Keto & Caselli (2010), we predict radial abundance profiles for complex organic molecules across this prototypical object.
The paper is organized as follows. In Section 2, we describe our chemical model and employ the physical model of the prestellar core L1544. In Section 3, modeling results are presented. Section 4 is devoted to the comparison with available observational data and discussion. Finally, in Section 5 the summary of the study is given.
2 Chemical and physical models
2.1 A three-phase code with bulk chemistry
In cold dark clouds, the thickness of icy mantles on interstellar grains is significant, and reach up to several hundreds monolayers (e.g., Gibb et al., 2004; Garrod & Pauly, 2011; Vasyunin & Herbst, 2013a). The formation of such thick mantles occurs on a timescale of at least several hundred thousands years (Garrod & Pauly, 2011; Vasyunin & Herbst, 2013a) and happens in parallel with ongoing physical evolution of a prestellar core. As such, it is likely that the composition of ice surface and outer layers of icy mantles is different from its bulk composition. Since one of the main goals of this study is to investigate the impact of the surface composition of icy mantles on the formation of COMs in prestellar clouds, it is reasonable to employ a multilayer approach to ice chemistry. This allows us to study the composition of icy mantles surfaces explicitly, and discriminate between chemistry that occurs on the surface and in the bulk of ice. This approach is qualitatively similar to that described by (e.g. Taquet et al., 2012), Garrod (2013) and Ruaud et al. (2016).
For this study, we modified the chemical code utilized in Vasyunin & Herbst (2013b). The code is based on chemical rate equations for gas phase chemical reactions and modified rate equations (Garrod, 2008; Garrod et al., 2009) for chemical reactions in icy mantles of interstellar grains. The evolution of abundances of gas-phase species is governed by the equation:
| (1) |
where is the abundance of the -th species in the gas phase, and are the rate constants of gas-phase reactions, is the rate constant for accretion of the -th species to grain surface, and is the rate of desorption of the -th species from grains to the gas.
The equations governing the chemistry on interstellar grains are constructed in a way to take into account the complex structure of icy mantles. The following assumptions are made. In the icy mantle, two chemically distinct phases can be picked out: surface and bulk. In both phases, chemical reactions may occur. Species can be transferred between surface and bulk when the total number of molecules in the icy mantle is changed due to accretion or desorption or, alternatively, due to thermal diffusion of molecules in the mantle. The difference between the surface and the bulk is twofold. First, desorption of species to the gas phase is only allowed from the surface, i.e. a bulk species must appear on the surface of icy mantles before desorption. Second, diffusion of species on the surface is much faster than inside the bulk. Garrod (2013) proposed that diffusion energy of species in the bulk is twice higher than on the surface. In this work, we utilize that value. The following pair of equations describe the chemical evolution of the -th species in the icy mantle of an interstellar grain under the above assumptions:
| (2) |
| (3) |
In equations (2) and (3), the first term describes the evolution of the abundance of the -th species due to chemical reactions. In equation (2) the first term also includes processes of accretion and desorption. This term can be expressed either as a rate equation similar to that constructed for a gas-phase species, or as a modified version of a rate equation that is capable to take into account stochastic effects in surface chemistry (Garrod, 2008). Although the developed code is capable of using both types of equations, below we use modified rate equations for surface chemistry, unless otherwise stated. As shown in Garrod et al. (2009), in contrast to standard rate equations, modified rate equations produce numerical results close to those obtained with the rigorous Monte Carlo approach even in the case of accretion-limited regime of surface chemistry at which stochastic effects are important. This regime is likely to be in action in this study due to the adopted parameters of surface chemistry (tunneling for H and H2, see below).
The second term in equations (2) and (3) is the rate of transfer of species between the surface and the bulk due to processes of accretion and desorption or change in number of molecules on surface due to chemical reactions, i.e. due to the processes that deposit or physically remove species to/from the icy mantle. In other words, this term represents the instant change of what is surface and what is bulk of the ice rather than the physical transfer of the material in the icy mantle. This term is defined in a way similar to that in previously developed models of e.g. Hasegawa & Herbst (1993) and Garrod & Pauly (2011):
| (4) |
Here, is the total number of particles of species on the ice surface,
| (5) |
is the net rate of change of the total number of particles on the surface due to chemical reactions, accretion and desorption. Note that by varying we can change the number of upper monolayers of the ice that belong to virtual “surface” in our model. This could be necessary to better satisfy experimental data, e.g. on desorption. Following finding of Vasyunin & Herbst (2013a), we set equal to four times the number of surface binding sites, thus assigning the upper four monolayers to the “surface”, or the most chemically active fraction of ice.
The last term in equations (2) and (3) describes real transfer of species between bulk and surface due to diffusion. In a thick mantle consisting of several hundreds of monolayers, an average atom or molecule must perform a series of jumps before reaching the surface due to 3D brownian motion. On each jump, a species has a chance to react with another reactive species or dissociate due to impact with a cosmic ray or photon absorption. As such, the surface is only reached by those species which do not undergo any chemical transformation along its way to the surface.
Garrod (2013) defines the rate of diffusion of a species from bulk to surface with his Eq. (3). Essentially, his definition assumes that any atom or molecule can reach the surface of the ice in one jump, regardless its initial position in the mantle. We believe that it is a too optimistic estimation, since it assumes that in a series of intramantle swaps needed for a species to reach the surface, no encounter with reactive species that would lead to a chemical reaction that will eliminate a swapping species will happen. Thus, the probability that the species will reach the ice surface rather than undergo a chemical reaction inside the bulk is , where is the probability for a species to react on a single swap and is the number of swaps needed to reach the surface. Observational data on ice composition (e.g., Öberg et al., 2011) imply that the fraction of chemically active species such as CO that can react with the most mobile species (e.g., atomic hydrogen) is tenths of percents. Assuming efficient tunneling through activation barriers of surface reactions, including that with CO (Hasegawa et al., 1992), one can roughly assume that the swapping species can undergo a chemical reaction on each swap with a probability of 25%, based on the average fraction of reactive species (mainly CO and H2CO) obtained from ice observations (Öberg et al., 2011); thus we get the probability of a species to reach the surface from the layers beneath the 10th below 5%, e.g. . Thus, we assume that species that start to migrate from deeper positions have a negligible probability to reach the surface when compared to the probability to undergo intra-bulk chemical reactions. As such, the diffusion rate from bulk to surface (b2s) is defined as:
| (6) |
where is a total number of molecules in the bulk of ice, and is the rate of swapping of a species in the bulk of ice, defined in the same way as in Garrod (2013), i.e., twice the surface diffusion rate of a species, is the current number of monolayers in the mantle.
Photochemistry and chemistry induced by direct cosmic ray impacts are treated in the same way both on surface and in the bulk of ice, and is cloned from gas-phase processes included in the model. Although it is clearly a simplification of real physical processes (see e.g., Fayolle et al., 2011; Muñoz Caro et al., 2014; Ivlev et al., 2015), we prefer this basic approach due to the lack of experimental data on details of surface photochemistry. Five types of desorption processes are included in the model: thermal desorption, cosmic ray–induced desorption (Hasegawa & Herbst, 1993), cosmic ray-induced photodesorption (Prasad & Tarafdar, 1983), photodesorption, and reactive (or chemical) desorption. Note that the efficiency of photodesorption in releasing the methanol from icy mantles of grains to the gas phase in the outer shells of prestellar cores, is quite uncertain. Although experiments by Öberg et al. (2009) showed high efficiency of photodesorption with a yield of 10-3 molecule per incident photon, newer experiments by Bertin et al. (2016) and Cruz-Diaz et al. (2016) suggest that at least for methanol the yield does not exceed 10-5 molecule per incident photon, thus making the photodesorption process less efficient than e.g. ice sputtering by cosmic rays, as shown by Dartois et al. (2015). Given the discrepancy between the old and new experimental results, in the current study we assumed a photodesorption yield equal to 10-5 molecule per incident photon.
2.2 Surface formation of methanol and formaldehyde
The network of surface reactions used in this work is taken from Vasyunin & Herbst (2013b). In this network, formaldehyde and methanol are formed on surface via the hydrogenation of CO molecule in the sequence CO HCO H2CO CH2OH CH3OH, which was experimentally confirmed by e.g. Fuchs et al. (2009). Hydrogen addition reactions leading to the formation of HCO and CH2OH have activation barriers of 2500 K (Ruffle & Herbst, 2001) (see below Section 2.5 for the discussion on the shape of the reaction activation barriers). Note that this hydrogenation sequence of CO forming formaldehyde and methanol may not reflect the actual complexity of the CO hydrogenation process. Recently, Minissale et al. (2016c) showed that hydrogenation of HCO and H2CO is a more complex process accompanied by “backward” H2 abstraction reactions H + HCO CO + H2 and H + H2CO HCO + H2. These processes may increase the efficiency of the reactive desorption of CO and suppress the formation of methanol. Although these newly introduced processes may be of importance for the formation of COMs in cold clouds, they are not included in the present study. Branching ratios between H abstraction and H addition reactions have not been measured accurately yet Minissale et al. (2016c). Thus, the incorporation of abstraction reactions with poorly known rates will not reduce the resulting uncertainty of our model. Mechanism of surface formation of methanol is a problem of fundamental importance in astrochemistry. A separate study must be devoted to its reconsideration.
2.3 Treatment of reactive desorption
The treatment of desorption in our three-phase model is similar to that described in Vasyunin & Herbst (2013b) with the exception of reactive desorption. For this type of desorption, we adopt the recent results by Minissale et al. (2016b). They derived a semi-empirical formula that describes the dependence of the efficiency of reactive desorption on the surface composition, exothermicity of a surface reaction and binding energies of reaction products:
| (7) |
Here, is the efficiency of reactive desorption, i.e., the fraction of products of a surface reaction directly ejected to the gas, is the binding energy of a species, is the number of vibrational modes in a molecule–surface bond system, is the fraction of kinetic energy retained by the reaction product with the mass colliding with the surface element with effective mass . Experiments on scattering of molecules on surface (Hayes et al., 2012) showed that upon collision, molecules interact with a surface structural element consisting of several atoms or molecules forming the surface, not with a single one. This is due to collective effects caused by the surface rigidity. As such, the effective mass of the surface element is typically much higher than the mass of single atoms or molecules the surface consists of.
The formula (7) has been established for rigid surface (graphite), where an effective mass has been measured by other experimental methods to be close to 1.8 masses of graphite carbon ring (M130 a.m.u.; Minissale & Dulieu (see discussion in 2014). Application of formula (7) for molecular surfaces also requires assigning a collective mass larger than the individual molecules constituent of the ice, because, e.g., chemical desorption of H2O is still measurable from H2O surface, whereas the strict use of the formula gives zero (Minissale et al., 2016b). Given the much lower efficiencies of reactive desorption from water surface observed in experiments, the value of M for water surface has been chosen equal to 48 a.m.u. as best matching data from experiments (Minissale et al., 2016b). Recent experiments involving surfaces made of CO and H2CO ice, showed relatively efficient reactive desorption of these two species into the gas (Minissale et al., 2016c), thus advocating quite high effective mass for such surfaces. Any equivalent mass between 80 and 120, indeed agrees with these measurements. Also, in case of CO ice, the binding energy of adsorbates may be lowered with respect to water ice, which also contributes to raise the chemical desorption efficiency on CO ice. Thus, in order not to include any new poorly controlled parameter in the model, we have chosen an effective mass M for CO ice equal to 100. Although variations of M in the range 80–120 may change the maximum values of modeled abundances within an order of magnitude, they will not change the general conclusions of this work.
The fraction of kinetic energy retained by the reaction product is an important parameter that governs the dependence of the efficiency of reactive desorption on surface composition. Its physical meaning is the fraction of kinetic energy retained by a molecule with mass upon collision with a structural element of the surface with mass , under the approximation of classic elastic collision. As such, the efficiency of reactive desorption depends not only on the type of desorbing molecule and enthalpy of reaction, but also on the surface composition, e.g., on the outer layers composition of a thick icy mantle. In Figure 1, the efficiency of the reactive desorption is shown as a function of M for two key species, H2CO and CH3OH. The vertical text, “CO ice”, “water ice” and “bare grain” indicate the value for the corresponding surface types. We assume that the value for “CO ice” is also used for species of similar molar weight, such as N2, H2CO and CH3OH, since these species have similar molecular masses and no experimental data on scattering of molecules on surfaces consisting of those species are available. These species are expected to constitute a significant fraction of an ice surface under the conditions typical of prestellar cores. Therefore, the total efficiency of reactive desorption is calculated as a sum of efficiencies of reactive desorption on different types of surfaces: bare grain, water ice, “heavy ice” (CO + N2 + H2CO + CH3OH ices) times the fraction of the corresponding surface type within the whole surface.
2.4 Updates to the chemical network
Since Vasyunin & Herbst (2013b), several important studies concerning chemistry of complex organic molecules in cold environments were published. We updated our chemical network with new gas-phase reactions proposed in Shannon et al. (2013, 2014) and Balucani et al. (2015). Namely, Shannon et al. (2013, 2014) discovered that reactions between hydroxyl radical OH and oxygenated hydrocarbons such as methanol and dimethyl ether are efficient at low temperatures due to tunneling through activation barrier and formation of a hydrogen-bonded complex:
| (8) |
| (9) |
Also, Balucani et al. (2015) proposed a gas-phase chemical link between dimethyl ether (CH3OCH3) and methyl formate (HCOOCH3) through the radical CH3OCH2:
| (10) |
| (11) |
The discovery of a new class of gas-phase reactions with hydroxyl radical efficient at low temperatures as well as a chemical link between dimethyl ether and formaldehyde are important findings for the problem of formation of COMs. To the best of our knowledge, this combination of new reactions has not been included into a full-scale astrochemical model before.
The gas-phase formation route of formamide (NH2CHO) has been updated according to the recent studies by Barone et al. (2015) and Skouteris et al. (2017). Using quantum chemical calculations, Skouteris et al. (2017) updated the previous result by Barone et al. (2015), and estimated the rate constants for the reaction
| (12) |
to be equal to =7.810-16 cm, =-2.56, =4.88 K. This gives the value of modified Arrhenius rate constant which is defined as equal to 2.910-11 cm3s-1 at 10 K. As such, reaction (12) is expected to be a major route of formation of formamide in cold clouds (as long as NH2 and H2CO are abundant in the gas phase).
Finally, we altered the gas-phase chemistry of acetaldehyde (CH3CHO) by including four gas-phase reactions in our model:
| (13) |
| (14) |
| (15) |
and
| (16) |
Processes (13) and (14) are the two most likely outcomes of the reaction between CH and CH3OH experimentally studied by Johnson et al. (2000). They found this reaction to be barrierless, pressure-independent with negative dependence on temperature. The total rate of the reaction between CH and CH3OH at 300 K is reported by Johnson et al. (2000) to be 2.510-10 cm with a temperature dependent Arrhenius factor -1.93. Since channel (14) is more thermodynamically favorable than channel (13), we assume 90% probability for the channel (14) to occur vs. 10% probability for the channel (13) (see Table 1). Interestingly, channel (13) is added to the UDFA12 database (McElroy et al., 2013), but is absent in KIDA database (Wakelam et al., 2015). On the contrary, channel (14) does not exist in UDFA12, but added to KIDA.
Reaction (15) is taken from Husain & Ioannou (1999). This reaction is expected to reduce the gas-phase abundance of acetaldehyde at early times when atomic carbon is relatively abundant in the gas phase. A similar reaction between carbon atoms and formaldehyde from Husain & Ioannou (1999) is also added to the chemical network to better constrain the abundance of H2CO at early times.
The rate for reaction (16) has been taken from Callear & Cooper (1990), who studied the reaction experimentally, under the temperature range 373 K — 473 K. We assume that the rate of reaction (16) remains the same down to 10 K: 510-11 cm3 s-1, although, it is possible that at low temperature the rate of the reactions could be higher due to more efficient stabilization of initially vibrationally excited CH3CHO. The details of all newly included reactions are summarized in Table 1.
2.5 Physical model of L1544 and initial conditions for chemistry
To model the radial profiles of COMs in L1544, we use the results from a 1D physical model of the prestellar core developed by Keto & Caselli (2010), see Figure 2. In the core, one can single out the very dense and dark central part, an intermediate shell with moderate density, and the outer part with low density and penetrating UV field. We took the visual extinction at the edge of the core equal to AV=2 mag to simulate the fact that L1544 is embedded in a molecular cloud. In total, our physical model has 128 radial points with different physical conditions. For each point, chemistry has been calculated independently using our 0D chemical model. Single grain size of 10-5 cm is used to calculate visual extinction and chemical evolution in the current study.
To obtain the initial abundances of the molecular species at t=0 yr in our simulations, we ran the chemical code for the time span of 106 years using physical conditions typical for a translucent cloud: hydrogen column density nH=102 cm-3, temperature T=20 K, visual extinction AV=2 mag, and “low metals” atomic initial conditions, corresponding to the values listed as EA1 in Table 1 in Wakelam & Herbst (2008). Final abundances from these simulations were taken as initial values for the simulations presented in this study.
The mobility of species on grain surfaces is a matter of debate in the astrochemical community. At low temperatures typical for prestellar clouds, only a limited number of species should be mobile on grain surfaces. Among them, atomic and molecular hydrogen. For these species, the main source of mobility is assumed to be quantum tunneling through a rectangular barrier of width 1Å separating the binding sites (e.g., Hasegawa et al., 1992). Although the efficiency of quantum tunneling for H and H2 on grain surfaces has been debated for a long time, no solid agreement is reached on this point so far (see e.g., for review, Hama & Watanabe, 2013). In this study, we enabled tunneling for diffusion of H and H2 in the model. The importance of tunneling for the simulations results is highlighted in Section 4. Tunneling was also claimed to be efficient for oxygen atoms at low temperatures (Minissale et al., 2013). However, in a more recent experiment by He et al. (2014), mobility of atomic oxygen was only observed at T40 K, which contradicts the assumption of efficient tunneling for O atoms. As such, we have chosen not to include atomic oxygen tunneling in our model. For other species, the main diffusion mechanism is due to thermal hopping, with a rate defined by the binding–desorption energy ratio, Eb/ED. Following recent estimates by Minissale et al. (2016a), we select the value of Eb/ED=0.55. However, at dust temperatures 10 K with enabled tunneling for H and H2 diffusion, this value is not expected to play a crucial role for the chemical evolution of icy mantles, even when set to the lowest value considered in literature, Eb/ED=0.3 (Hasegawa et al., 1992). As mentioned above, for bulk chemistry, this value is doubled. However, at low dust temperatures, bulk chemistry is well separated from surface chemistry, and all the essential processes affecting abundances of gas-phase species discussed below are impacted by the composition of the surface layers of icy mantles. This is explicitly simulated in the model in a framework of a three-phase formalism “gas-surface-bulk”.
Tunneling through potential barriers is not only important for surface mobility of light species such as H and H2, but also for calculations of the rates of reactions with activation barriers. Several approaches have been proposed to calculate the transmission probabilities through the reaction activation barriers on surface. Hasegawa et al. (1992) proposed to calculate the transmission probability through the rectangular activation barrier of 1 Å width, while Garrod & Pauly (2011) proposed to use the width of the rectangular activation barrier of 2 Å. Also, Taquet et al. (2013), recently employed the Eckart’s model to calculate the transmission probability. Here, we use transmission probabilities through rectangular barriers with widths of = 1.2 Å. Our simulations show that the composition of the gas phase in the considered model is stable with respect to the choice of the width in the range [1.0 — 1.5] Å, while the composition of the bulk of the ice is quite sensitive to the exact value of , and resemble the observed ice composition best at = 1.2 Å. As such, by the choice of the particular value of we do not aim to put exact constraints on transmission probabilities for reactions with activation barriers in interstellar ice. Instead, we rather aim to show that our model is capable of reproducing simultaneously abundances of COMs in L1544, and produce a reasonable composition of the icy mantles of interstellar grains.
3 Results
3.1 Radial profiles of chemical abundances
Observed values of fractional abundances of species towards prestellar cores and other astronomical objects are usually inferred from the observed column densities of species divided by the column density of H2. This provides abundances averaged over the line of sight. As such, in compact objects with strong gradients of physical parameters such as prestellar cores, the abundances derived from column densities differ from true local fractional abundances. However, since the goal of this work is to investigate chemistry of complex organic molecules in different parts of L1544, below in most cases we present modeled true local fractional abundances of species calculated as volume concentration of a species divided by volume concentration of H2 vs. time and radius. When presented, column densities are calculated following the expressions (1) and (2) in Section 7 in Jiménez-Serra et al. (2016).
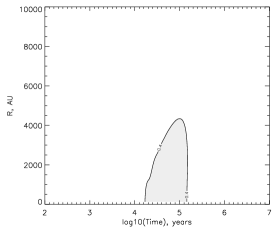
Since abundances of species evolve with time in each point of L1544, it is important to determine the time which gives best agreement with observations. Our model does not include any treatment of dynamical evolution of L1544, neither treatment of collapse nor mixing between gas parcels. Also, the “chemical age” of an astrophysical object does not necessarily correspond to its physical age. Therefore, we have chosen the depletion factor of CO towards the center of L1544 as an estimation of the time for which the comparison of modeled chemistry with observations should be performed. The depletion factor of CO, defined as the ratio between the reference and observed CO column densities, was measured by Caselli et al. (1999) as 10 toward the dust peak position, the center of our spherically symmetric core model. This depletion factor of CO can be easily calculated as a function of time in our model. Figure 3 shows that the CO depletion factor becomes similar to the observed one after a time of 105 years. Therefore, we present modeled radial abundances of species in L1544 for this time, unless otherwise stated.
In Figure 4, the top panel, radial profiles of selected simple species typically observed towards cold dark clouds are shown. By 105 years, all simple molecules except CO exhibit hump-like profiles. Towards the center of L1544, species are significantly depleted due to high density and low temperature. In the outer parts of the cloud, at radial distances R0.03 pc, the visual extinction drops below 3 mag, thus making most molecules vulnerable to photodissociation by interstellar UV field. H2 and CO are the exception, because of the effect of self-shielding and shielding by dust. The gas-phase abundance of CO drops sharply at R0.03 pc, where the gas density is higher than 105 cm-3, in agreement with findings by Caselli et al. (1999). Abundance profiles of two key nitrogen-bearing species in prestellar clouds, NH3 and N2H+, exhibit great similarity, with ammonia being about two orders of magnitude more abundant. This behaviour is typical of low-mass dense cores, including L1544, as found by Tafalla et al. (2002). Radial behavior of HCO+ is similar to the best fit Model 3 in Caselli et al. (2002). N2H+ and HCO+ are the two most abundant positive ions, thus reflecting the ionization degree. In turn, it appears similar to the measurements of Caselli et al. (2002). In the bottom panel of Figure 4, radial profiles of column density ratios of simple species wrt. column density of H2 convolved with a telescope beam size of 26” are shown: N(X)/N(H2). This corresponds to the abundances of species directly inferred from observations by Jiménez-Serra et al. (2016). One can see that column density profiles show flatter profiles than local fractional abundances of species. Indeed, the CO-to-H2 column density ratio decreases by an order of magnitude toward the outer part of the core, instead of six orders of magnitude for local volume abundances. For NH3, the N(NH3)/N(H2) ratio decreases by an order of magnitude instead of two and a half orders for local volume abundances. Such even behavior of column density ratios match observational data on molecular distributions in L1544 better than local volume abundances, especially for NH3, for which observations are consistent with N(NH3)/N(H2) increase towards the center of the core (Tafalla et al., 2004), while the N(N2H+)/N(H2) column density ratio appears to be constant. This “extra” depletion of N-bearing species compared to observations may be due to the fact that dynamics is ignored in our simulations (see Section 4 for further discussion). Such behavior for N-bearing molecules was also present in our previous chemical models. Therefore, updates to our model concerning efficient reactive desorption and new gas-phase chemistry of COMs does not affect noticeably well-established chemistry of simple species in the gas phase, and we do not discuss it further.
Let us now consider the chemistry in icy mantles of interstellar grains. Advanced treatment of icy mantles utilized in this study, allows us to consider the chemical evolution of ice surface and bulk ice separately. Since mobility of species on the surface and inside the bulk is different, and desorption is only possible from the surface, bulk and surface usually have different chemical composition. In Figure 5, composition of ice surface (top panel) and bulk ice (bottom panel) is shown vs radius after 105 years of evolution. Plotted species are the most abundant ones on surface and in the bulk ice respectively, at radial distance of R=0.02 pc.
The “surface” of icy mantles in our model consists of a number of molecules corresponding to four monolayers of ice. We prefer not to distinguish individual monolayers in the ice, because bulk diffusion of species is enabled in the model. Under this assumption, individual monolayers cannot be unambiguously identified. Besides the new treatment of reactive desorption, we did not introduce any new chemical processes in our model. Therefore, the chemical evolution on ice surface is in general similar to that described in previous studies (Garrod & Pauly, 2011; Vasyunin & Herbst, 2013a).
In the entire range of distances from the center of the cloud, the chemical composition of ice surface does not differ significantly. Since in our model we enable quantum tunneling for H and H2 and diffusion/desorption energy ratio Eb/ED=0.55, the major constituents of the ice surface are water, methanol, molecular nitrogen as well as somewhat less abundant carbon monoxide, formaldehyde and ammonia. While CO and N2 are mainly accreted from the gas phase, other major species are formed on surface in hydrogenation reactions. Water is mainly formed in surface reaction between atomic hydrogen and hydroxyl radical, but is also accreted from the gas phase but in less extent. Methanol and formaldehyde are formed during hydrogenation of CO molecule as described in Section 2.2. Quantum tunneling for diffusion and passing through activation barriers of reactions with H and H2 makes CO hydrogenation efficient, thus leading to the abundance of CH3OH on surface higher than abundances of CO and H2CO. Note that, if tunneling for diffusion or passing through reaction activation barriers is neglected, our model cannot produce methanol in the ice in appreciable amounts. Interestingly, at timescales after 105 years, methanol and water on surface become chemically related, because significant fraction of atomic hydrogen and hydroxyl radical on surface at that time is produced by the photodissociation of methanol by cosmic ray-induced photons in the center of the core, or by interstellar UV photons at the edge of the cloud. The fraction of surface covered with “heavy” species (mainly methanol) vary from 0.35 at R0.01 pc to 0.65 at outer radii (Figure 6). This shift of balance between water and heavy species is mostly due to slightly different rates of photodissociation of water and methanol. In our model, the exponential factor for photorates =2.3, while =2.2 (van Dishoeck et al., 2006), which makes water starting to photodissociate at somewhat smaller radii with higher visual extinction, than methanol.
Although the composition of the bulk of ice does not directly affect the abundances of gas-phase COMs in our model, it is important to make sure that adopted parameters of our model do not lead to bulk composition that contradicts the observational data. The composition of the bulk of the ice at 1.6105 years is presented in Figure 5, bottom panel. In bulk ice, solid water is the dominant species. Solid carbon monoxide is the second most abundant bulk ice constituent in the inner and outer regions of L1544 (R0.007 pc, R0.03 pc) with an abundance of 50% that of solid water. In the intermediate part of the cloud (0.007 pc R 0.03 pc) the abundance of CO is reduced, and the second most abundant species in the bulk ice is methanol with maximum fraction of45% with respect to solid water. Averaged over the whole L1544, abundances of CO and CH3OH in the bulk of ice with respect to solid water are 35% and 28%, respectively. Note that bulk abundance of methanol with respect to solid water is reduced in contrast to its surface value because the methanol that buried in the bulk after its formation on surface, is partly dissociated via cosmic rays. While the abundance of solid N2 is not inferred from observations due to low strength of fundamental N—N stretch band of N2 in ices (Sandford et al., 2001), abundances of solid CO and CH3OH have been estimated observationally. Öberg et al. (2010) provided average observational fractions of CO and CH3OH in low-mass clouds to be 29% and 3%, respectively, which somewhat differs from our modeling results. On the other hand, the fraction of methanol in the ice vary by an order of magnitude among different clouds, reaching 25% wrt. solid water in some cases, e.g. Class 0 protostars (Pontoppidan et al., 2004), which are close evolutionary to the prestellar cores such as L1544. As such, we believe that the CH3OH/CO ratio obtained in the ice by our model does not represent a major issue in this study. The abundance of ammonia in the ice is 7% wrt. water, which is similar to observed values. Solid carbon dioxide CO2 is one of the main constituents of the ice according to observations (e.g., Öberg et al., 2010). However, in our simulations it is missing because it is likely formed at the onset of a cold dense cloud formation from a warmer translucent cloud at T20 (Mennella et al., 2006; Garrod & Pauly, 2011; Vasyunin & Herbst, 2013a). Since in our simulations we do not follow the cloud formation with time-dependent physical conditions, we miss this phase. Note however, that protonated carbon dioxide, HOCO+, has recently been observed in L1544 (Vastel et al., 2016), which implies the presence of gas-phase CO2, too. Nevertheless in the model discussed in this study, neither gas-phase nor solid CO2 and its protonated form do not affect the chemistry of COMs. Abundances of major ice constituents in the whole core are summarized in the Table 2.
3.2 Chemistry at the COMs peak
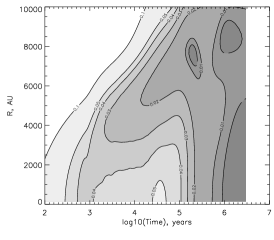
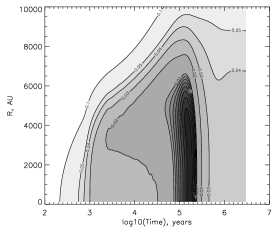
Modeled abundances of complex organic species in L1544 exhibit both significant temporal (Figure 7, bottom panel) and radial (Figure 8, bottom panel) variations, as well as the abundances of chemically-related precursor species (the same figures, upper panels). The peak abundances of COMs are reached within 105—2105 years of chemical evolution, which corresponds to the time when the observed depletion factor of CO is attained in our model (Figure 3). This time is higher than the time estimated by Caselli et al. (1999) (104 years), using CO depletion factor and freeze-out rate. However, taking into account the uncertainty by a factor of 2 in the depletion factor claimed by Caselli et al. (1999), and possibly smaller depletion rate due to non-thermal evaporation of species, which was not considered by Caselli et al. (1999), we believe that our results do not contradict observational constraints.
Maximum abundances of most COMs including HCOOCH3, CH3OCH3 and NH2CHO are reached for distances between 0.01—0.02 pc from the center of L1544, that roughly corresponds to the position of a ring-like emission of methanol observed by Bizzocchi et al. (2014) and of COMs deduced by Vastel et al. (2014). As shown by Jiménez-Serra et al. (2016), COMs are indeed enhanced in an outer shell centered at a distance of 0.02 pc (equivalent to 4000 au) with respect to the center of the core. Peak abundances of methyl formate, dimethyl ether and formamide reach approximately (3—4) 10-10 wrt. total hydrogen nuclei. The comparison between models and observations versus time and radial distance in L1544 is shown in Figure 9. In the left and middle columns, an agreement for illustrative models is shown (see below). In the right column, the agreement for the Main model (MM) under discussion is presented. The agreement was calculated using the following expression:
| (17) |
where Xmod,obs are the modeled and observed column densities of species. Modeled column densities are smoothed over the gaussian beam of 26” size in order to simulate the observed abundances and column densities taken from Jiménez-Serra et al. (2016) toward the position of the “methanol peak”111This position corresponds to the peak of the CH3OH emission reported by Bizzocchi et al. (2014) which is approx. 4000 AU (0.019 pc) away from the dust emission peak (see also Jiménez-Serra et al. 2016 for more details). (r,t) is the location in the phase space (radius, time). The species used to calculate the agreement are HCOOCH3, CH3OCH3, NH2CHO, CH3CHO, CH3O and CH3OH. As such, an agreement map shows at which time(s) and for which radii the modeled column densities fit the observational data at the “methanol peak” in L1544, located at 0.02 pc or 4000 AU from the center of L1544.
In Table 3, the best-fit modeled column density ratios of species wrt. H2 – N(X)/N(H2), corresponding to the abundances inferred from observations for L1544 – are shown, as well as the observed abundances obtained by Jiménez-Serra et al. (2016). Also, for comparison, abundances of COMs in L1689B and B1-b are shown, taken from Bacmann et al. (2012) and Cernicharo et al. (2012). These two sources have gas and dust temperatures similar to those in L1544. Also, column densities of COMs observed toward these cores are of the same order of magnitude as in L1544 (1012 cm-2) suggesting similar extinctions in the regions of COMs formation, thus making reasonable comparison with model predictions originally made for L1544. The minimal value of F(r,t) is reached at 1.6105 years and at the radius of 0.015 pc. This time is similar to that at which the model also reproduces the CO column density (see Figure 3). This indicates that chemistry of COMs clearly belongs to a so-called early chemistry type. Also, the spatial location of the best-fit position is roughly similar to the location of the “methanol peak” in L1544. Since the values in Table 3 have been calculated by averaging the predicted column densities within a beam of 26” (this is the beam size in the observations by Jiménez-Serra et al. (2016)), they are somewhat different from true local fractional abundances of species obtained with the chemical model and discussed below.
Let us now focus on the chemistry of complex organic molecules in our model near the location of best-fit abundances of COMs, namely at radial distance 0.015 pc. In general, the formation of all complex organic species considered in this study follows the scenario proposed in Vasyunin & Herbst (2013b). In that scenario, complex organic molecules in the cold gas are formed mainly via gas-phase reactions from precursor species that are formed on grains (totally, or at least in a significant part) and then ejected into the gas phase via efficient reactive desorption. While in Vasyunin & Herbst (2013b), the majority of gas-phase reactions important for the formation of COMs are ion-molecule reactions, in this study new gas phase neutral-neutral reactions play an important role too.
Dimethyl ether (CH3OCH3) and methyl formate (HCOOCH3) exhibit very similar radial (see Figure 8) and temporal (see Figure 7) behavior. Dimethyl ether is produced via the reaction
| (18) |
proposed by Vasyunin & Herbst (2013b). Following the comment by Balucani et al. (2015) on the rate of this reaction, we updated the value of the rate coefficient to 3.010-10 cm3s-1 (see Table 1). CH3 is formed as a product of dissociative recombination of CH. This formation route in Main model (MM) is assisted by a gas-phase reaction
| (19) |
also introduced in Vasyunin & Herbst (2013b), and leads to the increase of the abundance of CH3 by a factor of three with respect to pure ion-molecule formation. About 55% of the methoxy radical CH3O in the gas phase is produced via the gas-phase reaction
| (20) |
while another 45% of CH3O is ejected to the gas via reactive desorption after the surface production in the reaction
| (21) |
Shannon et al. (2013) found reaction (20) to exhibit strong negative dependence on temperature due to the formation of a hydrogen-bonded complex that lives sufficiently long to undergo quantum mechanical tunneling through the activation barrier of the reaction and to form products. Antinolo et al. (2016) confirmed this result, and measured the temperature-dependent rate of the reaction in the range 22 K—64 K. Extrapolation to 10 K gives the rate of the reaction equal to 1.110-10 cm3s-1, which is three times faster than the rate adopted for this reaction in Vasyunin & Herbst (2013b). Thus in this work, methoxy radical reaches the fractional abundance of 2.510-10 wrt. H (see Figure 8, upper panel), which is higher than in the model by Vasyunin & Herbst (2013b) and about an order of magnitude higher than observed by Bacmann & Faure (2016) for several prestellar cores other than L1544, and by factors of 5–10 in L1544 (Jiménez-Serra et al., 2016). Note however, that the CH3O abundance in our model is mainly controlled by the pair of reactions (18) and (20). Rates of both reactions are poorly known. Thus, in principle, by varying these reaction rates, one can modify the abundance of CH3O widely, almost without changing the abundance of CH3OCH3. More theoretical and/or laboratory work needs to be carried out to put more stringent constraints on chemical models.
Methyl formate (HCOOCH3) has two main production channels. Approximately 2/3 of the total methyl formate production belongs to the reaction
| (22) |
This reaction has been studied by Hoyermann & Nacke (1996) and Song et al. (2005), and introduced into astrochemical models by Balucani et al. (2015). The fractional abundance of atomic oxygen in our model after 105 years is 610-8 wrt. H. The second reactant, CH3OCH2, is mainly produced via the reactions
| (23) |
This reaction has been studied in Shannon et al. (2014), who showed that it is efficient at low temperatures due to a similar mechanism as that for reaction (20). This is in contrast to Balucani et al. (2015), who pointed out the existence of a chemical link between CH3OCH3 and HCOOCH3 via the reaction (22), but claimed the main formation routes of CH3OCH2 to be reactions between dimethyl ether and elemental fluorine (F) and clorine (Cl). In our model, both chemical elements are highly depleted in the gas phase, having fractional abundances of 2.310-17 and 6.310-11 wrt. H, respectively, at the time of 105 years. Therefore, the formation of CH3OCH2 in our model is dominated by reaction (23) instead of by reactions between dimethyl ether and F or Cl.
From this analysis, the hydroxyl radical (OH) appears to be the key chemical species for the chemistry of methyl formate and dimethyl ether in the cold gas. The fractional abundance of OH reaches the value of 710-7 after 105 years of evolution and at radial distance R=0.015 pc. This is somewhat higher than the OH abundance estimated by Harju et al. (2000) who found it to be about 110-7 wrt. H. However, taking into account the intrinsic uncertainties in astrochemical models (Vasyunin et al., 2004; Wakelam et al., 2006; Vasyunin et al., 2008; Wakelam et al., 2010) and observations, one can conclude that this difference is not significant.
Approximately 1/3 of total methyl formate production belongs to the ion-neutral route that includes the formation of protonated methyl formate via the reaction
| (24) |
with subsequent dissociative recombination into HCOOCH3. Reaction (24) has been turned down in Horn et al. (2004) who cited an older study by Freeman et al. (1978). However, in a recent study by Cole et al. (2012), a 5% probability for the formation of a protonated methyl formate (with the rest 95% probability to form an adduct ion) in reaction (24) has been found. A protonated methyl formate is converted in our model into HCOOCH3 in a dissociative recombination reaction with electrons with a probability of 50%. However one should note, that the latter probability is poorly known and could be much smaller (Vigren et al., 2010), resulting in much lower production of methyl formate by the considered ion-molecular route.
Formic acid (HCOOH), second reactant in reaction (24), is another brick of organic chemistry in star-forming regions. It has also been detected by Vastel et al. (2014) towards L1544, with fractional abundance of 10-10 wrt. H. In our model, the gas-phase abundance of formic acid towards the location of the “methanol peak” at the time of best agreement (1.6105 years) is 2.010-10. HCOOH is formed as a product of dissociative recombination of its protonated form HCOOH, which is, in turn, formed in a slow radiative association reaction HCO+ + H2O HCOOH + . The surface formation route of formic acid in the reaction between OH and HCO is inefficient because in our model both reactants do not diffuse in the surface at the low temperatures of pre-stellar cores. Nevertheless, a total abundance of HCOOH of 710-9 wrt. H is accumulated in the ice via gas accretion. Compilation done by Garrod & Herbst (2006) shows that the observed abundances of HCOOH in hot cores vary in the range [8.010-10 — 6.210-8] wrt. H. Thus, assuming that hot core/corino is the next stage in the development of a protostar that inherits the chemical composition from the previous stage, one may deduce that the total production of HCOOH in our model is within reasonable limits.
Nitrogen-bearing complex organic molecules with a peptide bond such as formamide (NH2CHO) exhibit a plateau-like abundance profile between 0.01 pc and 0.05 pc at 105 years, reaching 610-12 wrt. H (see Figure 8, bottom panel). Formamide in our model is solely produced via reaction (12) despite the existence of two surface reactions, leading to NH2CHO. Those are s-N+s-CH2OH s-NH2CHO and s-NH2+s-HCO s-NH2CHO. At low dust temperatures of 10 K, typical for L1544, those reactions are not efficient in our model, because with the adopted diffusion-to-desorption energy ratio Eb/ED=0.55, the grain surface diffusion timescale even for relatively weakly bound nitrogen atoms exceeds 1013 years.
Both reactants in reaction (12), NH2 and H2CO, are produced in the gas phase (20% of NH2, 80% of H2CO) and on surface ice, and then ejected non-thermally to the gas. Amidogen (NH2) on surface is produced in the hydrogenation reaction H + NH NH2, and in the gas as a product of dissociative recombination of NH. Formaldehyde (H2CO) on surface is produced in the hydrogenation reaction H+HCOH2CO, and in the gas phase via the reaction O + CH H2CO + H. The possible reason why NH2CHO is somewhat overproduced in our model with respect to the observed upper limit (see Table 3) is due to too high efficiencies of formation of the reactants of the reaction (12). See Section 4 for details.
Acetaldehyde (CH3CHO) is mainly produced in reaction (13). Due to the high rate of this reaction, both temporal and spatial profiles of acetaldehyde are well correlated with those of methanol, and CH3CHO reaches peak abundances about two orders of magnitude higher than other COMs considered in this study, although at very early time (see Figure 7). By the time of the best agreement with observations, 1.6105 years, the abundance of CH3CHO is within an order of magnitude to those of HCOOCH3 and CH3OCH3 (see Figure 7 and Figure 8), as well as to its observed value (see Table 3).
This mechanism of formation of acetaldehyde is different from that described in Vasyunin & Herbst (2013b), where acetaldehyde was mainly produced in the gas phase via the neutral-neutral reaction O + C2H CH3CHO + H. The reason for this is the updated treatment of reactive desorption in the current study. In Vasyunin & Herbst (2013b), C2H5 is delivered to the gas from the surface via reactive desorption. In Vasyunin & Herbst (2013b), all species formed on surface had single reactive desorption efficiency of 10%, while in the current study, we use expression (7). For the surface reaction s-H+s-C2HC2H5 which is the main source of C2H5 in Vasyunin & Herbst (2013b), expression (7) gives the efficiency of reactive desorption 0.0005%, even for the part of surface consisting of heavy species, i.e., effectively zero. As such, the chemistry of acetaldehyde becomes different in this study in comparison to Vasyunin & Herbst (2013b), and the peak abundance of CH3CHO in the absence of reaction (13) becomes two orders of magnitude lower than in Vasyunin & Herbst (2013b).
Finally, let us consider the chemistry of methanol in the gas phase in our model of L1544. There are no significant contributions from gas-phase reactions to the formation of methanol. The full amount of methanol is ejected to the gas phase from the surfaces of icy mantles of interstellar grains, where CH3OH is formed as a product of hydrogenation of CO molecule (see Section 2.2). The main ejection mechanism is non-thermal reactive desorption from the part of the surface covered with “heavy species” (see Figure 6), with an efficiency of 0.64% that matches previous more conservative estimates of reactive desorption efficiency (Garrod et al., 2007). Other non-thermal desorption mechanisms (photodesorption and cosmic ray–induced desorption) do not contribute significantly to the desorption rate of methanol. The main destruction route of methanol in the gas phase is reaction (20), as well as ion-molecule reactions with major ions such as H and H3O+. It is important to note that the peak local volume abundances of COMs in our model does not coincide with the peak local volume abundance of methanol (see Figure 8, left lower panel), although due to averaging effects in single-dish observations, the peak abundances of COMs and methanol inferred from column densities spatially coincide near the observed “methanol peak” (see Figure 8, lower right panel). As such, a very high abundance of methanol in the gas phase is not needed to reproduce observed abundances of COMs. Moreover, we attribute the highest abundance of methanol reached in its radial profile (710-8 wrt. H at R=0.04 pc) to the fact that dynamics is ignored. In a dynamical model, which starts with lower densities, the CO freeze out will be less efficient and, consequently, less CH3OH is expected to be produced.
3.3 The role of reactive desorption in the chemistry of cold COMs
Although in our model complex organic molecules in the cold environments typical of prestellar cores are formed via gas-phase chemistry, the role of surface chemistry in the formation of precursor species, and of reactive desorption for their delivery to the cold gas, is pivotal. To illustrate this, we ran two models with different efficiencies of reactive desorption. In the first illustrative model (IM0), reactive desorption is switched off (efficiency 0%). In the second illustrative model (IM10), the reactive desorption efficiency for all species is 10%, same as in Vasyunin & Herbst (2013b). Best-fit radial profiles of abundances of COMs and their precursors for the illustrative models are shown in Figure 10 for the model with no reactive desorption and in Figure 11 for the model with 10%-efficiency reactive desorption. In addition, in Table 4, we list the main precursors of COMs in the gas phase, their reactive desorption efficiencies and contribution from surface chemistry to the total rate of formation rates of those species in the gas phase in our main model with advanced treatment of reactive desorption.
Let us first consider the illustrative model with reactive desorption switched off (IM0). As can be seen on the “agreement map” in Figure 9 (left column), in the entire space (time, radius) there is no area where model matches observational data satisfactorily. As an example, the radial profiles of fractional abundances are plotted in Figure 10 at 8104 years of evolution, that corresponds to the minimum value of F(r,t) in Eq. (17). In model IM0, fractional abundances of all COMs considered in this study do not exceed 10-12 wrt. H. Note that there are two other types of non-thermal desorption included in all models considered in this study — photodesorption and cosmic ray–induced desorption. However, it appears that the efficiency of these two other types of non-thermal desorption processes are clearly not high-enough to provide sufficient amounts of precursors of COMs to the cold gas.
The resulting radial profiles of abundances obtained with the second illustrative model (IM10), in which the reactive desorption efficiency for all species is set to a single value of 10%, are shown in Figure 11 for the times of the best agreement with observations, which is 3106 years of cloud evolution. At that time, the modeled CO column density is too low in comparison to the observed value (see Figure 3). As can be seen in Figure 9 (middle column), the illustrative model with 10% efficiency of reactive desorption also does not agree with observations in the entire parameter space considered (time, radius). One can see that the peak abundances of COMs in the illustrative model with reactive desorption efficiency 10% are significantly higher than in our main model, with the exception of methyl formate. The peak abundances of COMs are located near R=0.04 pc, which is somewhat inconsistent with the observed location of the “methanol peak” (see Bizzocchi et al. (2014) and Jiménez-Serra et al. (2016)). The abundance of acetaldehyde (CH3CHO) is equal to 1.010-8 wrt. H, which is higher than the abundance observed towards the hot core in Sgr B2 (Belloche et al., 2013; Occhiogrosso et al., 2014). Abundances of other species are also higher than in our main model by about an order of magnitude, with the exception of methyl formate, whose abundance drops with time faster than that of other species. In summary, for the majority of species, the IM10 model gives the values of column densities of COMs higher than those obtained with our Main model (MM). Averaged column densities are also higher than observed by 1–3 orders of magnitude even at the late evolutionary time of 3106 years. No location is found in the parameter space (time, radius) with satisfactory agreement with observations of COMs in L1544.
4 Discussion
Although a remarkable progress has been made during the last years, our knowledge on the formation and evolution of organic matter in star-forming regions is still far from being comprehensive. In particular, models of formation of saturated complex organic molecules that have been found in cold clouds representing the earliest stages of star formation (Öberg et al., 2010; Bacmann et al., 2012; Cernicharo et al., 2012; Vastel et al., 2014), are under active development. As such, certain controversy exists between the models and adopted physical parameters. The Main model (MM) presented in this work, is a development of the model proposed in Vasyunin & Herbst (2013b), but it differs in treatment of reactive desorption, in the adopted set of gas-phase reactions and in the utilized parameters of surface chemistry. It is important to assess the importance of introduced changes, to compare the proposed model with others available, and to discuss the issues that exist in the model.
In contrast to Vasyunin & Herbst (2013b) where grain surface chemistry were treated in a simplistic way without taking into account the ice thickness, in the current study, we use a multilayer approach to the chemistry on interstellar grains. Under the conditions of prestellar cores, icy mantles can reach thickness up to several hundreds of monolayers, while accumulating over large periods of time. Therefore, it is reasonable to distinguish between surface layers of ice, where the fast diffusive chemistry occurs as well as thermal and non-thermal desorption, and the inner parts of icy mantles, that may have different composition, and conditions for chemistry to occur. Following Fayolle et al. (2011) and Vasyunin & Herbst (2013a), four upper layers of the ice in our model comprise the “surface ice”. As, according to our model, the total ice thickness in the central dark region of L1544 exceeds 200 monolayers, only a few percent of atoms and molecules residing on grains are available to participate in reactions on surface ice and be ejected to the gas via reactive desorption. This is in contrast to Vasyunin & Herbst (2013b), where all species on grains were available for these processes. Effectively, it means that rates of reactions causing reactive desorption in our updated model are generally smaller due to smaller number of available reactants. As such, while in Vasyunin & Herbst (2013b), the best-fit model has only thermal hopping as a source of diffusion of species on surface, in this study, we had to enable quantum tunneling for H and H2 in order to ensure sufficient rates of reactions in surface layers of ice, and thus rates of reactive desorption. Therefore, our updated model with multilayer approach to ice chemistry, and advanced treatment of reactive desorption based on Minissale et al. (2016b), requires efficient quantum tunneling for H and H2 to reproduce the COM observations by Jiménez-Serra et al. (2016) toward L1544. With tunneling for diffusion enabled, at the low temperature of 10 K, the exact value of another poorly known parameter that controls surface chemistry, diffusion-to-desorption energy ratio, becomes unimportant.
Another key assumption in this study, is the high efficiency of reactive desorption from the fraction of surface ice covered by species with molecular masses higher than those of water. The two most abundant heavy species in this study are carbon monoxide (CO) and methanol (CH3OH). They have similar molecular masses about twice higher than the mass of water molecule. Near the location of the “methanol peak” in L1544, these two molecules comprise about 50% of the surface ice composition in Main model (MM). Here, the importance of the multilayer approach to ice chemistry is revealed: while the bulk of ice is dominated by water, the surface layers of ice in a prestellar core are apolar, and covered with CO and methanol, which is in line with ice observations (Öberg et al., 2011). While the high efficiency of reactive desorption in certain chemical reactions on bare olivine surface was confirmed experimentally (Dulieu et al., 2013), as well as that water ice surface severely reduces the efficiency of RD (Congiu et al., 2009; Minissale et al., 2016b), to the best of our knowledge, there are no experimental studies of the efficiency of RD on CO and methanol ices. As such, while our assumption of higher reactive desorption efficiency from surface covered with heavy molecules (in comparison to water molecules) looks reasonable to us, it definitely requires experimental confirmation. Interestingly, in a recent study Wakelam et al. (2017) argues that binding energies of species to water surface are generally higher than it was believed. This may further inhibit the efficiency of reactive desorption of species from water ice. However, conclusions made by Wakelam et al. (2017) clearly do not affect results presented in the current study, since we only assume efficient reactive desorption from non-water fraction of ice surface.
It is also worth noting that the efficiency of reactive desorption in our study is determined by expression (7), which is semi-empirical in nature, and is derived based on a limited set of experiments. Expression (7) gives a wide range of RD efficiencies depending on a particular reaction and on reactants. In this study, expression (7) is also applied to systems not studied experimentally. Also, one should bear in mind that in case of certain species, expression (7) includes poorly known parameters. For example, to the best of our knowledge, the binding energy of NH2 has never been measured. Thus, the adopted value of desorption energy for NH2 of 3960 K may be too low, leading to the too high efficiency of reactive desorption according to (7), which is equal to 25% (see Table 4). This may lead to marginally overestimated abundance of NH2CHO in our model over the upper limit set by the observations of Jiménez-Serra et al. (2016). On the other hand, the fractional abundance of NH2 in our Main model (MM) at 105 years is 1.510-10 wrt. H, which is consistent to the model of Le Gal et al. (2014). Moreover, the NH2:NH3 ratio in our Main model (MM) is close to 1:20, which is also consistent with Le Gal et al. (2014). Therefore, the overproduction of gas-phase H2CO seems to be the most probable reason for the slight overproduction of NH2CHO.
While non-thermal reactive desorption in our model is a key process that delivers precursors of COMs to the cold gas, the COMs themselves are formed via gas-phase chemical reactions. During the last decade, the long-standing paradigm of astrochemistry stating that the most important reactions in the cold ISM are ion-molecule reactions, has been somewhat changed. Since Smith et al. (2004), it is recognized that fast neutral-neutral reactions can affect the abundances of exotic carbon-bearing species in cold clouds. Vasyunin & Herbst (2013b) proposed that reactions of radiative association may be important for the formation of some terrestrial-type organic molecules such as dimethyl ether. However, the majority of gas-phase reactions responsible for the formation of COMs in Vasyunin & Herbst (2013b) are ion-molecule reactions leading to the formation of protonated COMs that must recombine with electrons in order to form neutral species. This scheme is somewhat problematic, because the outcome of neutral COMs in the recombination process is not clear.
In this study, gas-phase chemistry of COMs has more solid basis thanks to theoretical and experimental studies during the last years. The chemical link between CH3OCH3 and HCOOCH3 via the intermediate species CH3OCH2 proposed in Balucani et al. (2015), solves the problem of underproduction of methyl formate via ion-molecule route discussed in Vasyunin & Herbst (2013b). However it is worth noting that in our study, CH3OCH2 is formed via reaction (9), which is proposed in Shannon et al. (2014), but missing in Balucani et al. (2015). Reactions with chlorine and fluorine in our model cannot produce sufficient amount of CH3OCH2 due to strong depletion of Cl and F in the cold gas. As such, it is not entirely clear to us how the model by Balucani et al. (2015) works in the presented form.
As shown in Section 3.2, the mechanism of formation of CH3CHO discussed in Vasyunin & Herbst (2013b) is not working in the updated model due to the new description of reactive desorption. As such, new chemical pathways to acetaldehyde in the cold gas should be considered. In this work, we included reaction (13) as one of the possible efficient routes to form acetaldehyde in the cold gas. It is interesting to note that methylidyne radical (CH) has certain similarity of chemical properties with the hydroxyl radical (OH). The enhanced rates of gas-phase reactions with hydroxyl radical (OH) found by Shannon et al. (2013, 2014) are shown to impact chemistry of complex organic molecules in cold gas. Thus, it may be reasonable to expect that reactions with methylidyne radical could have broader impact on the chemistry of COMs than currently assessed, and worth further detailed studies. Another reaction to form CH3CHO proposed in this work is the radiative association reaction (16). We propose this reaction by analogy with reaction (18), which is currently considered as a major route of the formation of dimethyl ether (Cernicharo et al., 2012; Vasyunin & Herbst, 2013b; Balucani et al., 2015). However, one should point out that to the best of our knowledge, reaction (16) has not been studied under the conditions relevant to cold molecular clouds.
It is worth noting a surprisingly good agreement between the results produced by our complex and uncertain multiparameter chemical model, and the observational data presented in Jiménez-Serra et al. (2016). Also, at the time of best agreement with observations (105 years), our model reproduces reasonably well the abundance ratios for COMs-related species (with the exception of formaldehyde) observed by Bacmann & Faure (2016) in other prestellar cores. Namely, they found the ratios for HCO:H2CO:CH3O:CH3OH 10:100:1:100. As can be seen in Table 3, our modeled ratios are 5:480:1:270. Since the sample of prestellar cores by Bacmann & Faure (2016) does not include L1544, it is not clear if the reason for the disagreement belongs to deficiency of our model, or to the different physical structure.
Possible problems in our chemical model include overproduction of gas-phase formaldehyde and methanol. As noted above, this may be caused by possibly overestimated efficiency of reactive desorption of H2CO and CH3OH with the expression (7) that is semiempirical in nature and includes poorly known values. However, as can be seen in Table 4, reactive desorption efficiencies for these species are not extremely high (0.64% for CH3OH and 5.4% for H2CO), which is consistent with conservative estimates of RD efficiencies (e.g., Garrod et al., 2007). Another possible reason for the too high abundances of methanol and formaldehyde in the gas phase in our model is their overproduction on grains that is translated into gas via reactive desorption, which also leads to the somewhat increased fractions of CH3OH and H2CO in the ice bulk (see lower panel of Figure 5, Table 2) as compared to observed values (Öberg et al., 2011). One possible remedy for this is to take into account an evolutionary model for L1544, where dust temperature changes during collapse from typical values for diffuse clouds (of 20 K) to 10 K (see Vasyunin & Herbst, 2013a). This will ensure formation of another major ice constituent, CO2, which is currently missing in our static model of L1544. Formation of CO2 will lock 10–20% of the total carbon budget, thus reducing, among others, the abundances of H2CO and CH3OH. The formation efficiency of H2CO and CH3OH may also be reduced by considering the new scenario that includes backward hydrogen abstraction reactions (Minissale et al., 2016c).
Although in this study we use a time-dependent chemical model, the adopted physical model of L1544 is static. Since time scales of chemical and dynamical evolution of prestellar cores are comparable, a more realistic approach should include a dynamical model of the physical structure of L1544. In fact, the inclusion of dynamical evolution could imply a longer time scale spent by the core at lower volume densities, thus with longer freeze out time scales (as the freeze out time scale is inversely proportional to the volume density). The inclusion of dynamics will be the subject of our next paper. The possible longer freeze-out times in a dynamical model may affect chemistry in the center of the core, where with the current model, an extreme freeze-out of virtually all species is observed, including nitrogen–bearing (see Figure 4), which is somewhat inconsistent with observations. However, another possible explanation for the “extra” depletion of N-bearing molecules could be that the multi-layer treatment overestimates the amount of N2 freeze-out (see also Sipilä et al., 2016), so that further laboratory studies will be needed to put more stringent constraints on the mobility of species in the bulk and surfaces of icy mantles.
5 Summary
In this study, we performed chemical modeling of the formation and evolution of complex organic molecules (COMs) in the prestellar core L1544. We found that saturated COMs can be formed efficiently in L1544 up to the fractional abundances of (3—4)10-10 wrt. total number of hydrogen nuclei via the scenario proposed in Vasyunin & Herbst (2013b), and further developed in this study. The development includes more detailed treatment of the reactive desorption based on experiments by Dulieu et al. (2013) and Minissale et al. (2016b), and an extended set of gas-phase reactions, important for the formation of complex organic molecules in the cold gas. Chemistry on interstellar grains is treated via a multilayer approach, which allows to discriminate between surface and bulk ice. Abundances of many COMs such as CH3OCH3, HCOOCH3 and NH2CHO peak at similar radial distance of 2000—4000 AU from the core center, which is in line with recent observations of L1544 performed by Jiménez-Serra et al. (2016), Bizzocchi et al. (2014) and Vastel et al. (2014). Gas-phase abundances of COMs depend on the efficiency of reactive desorption, which in turn depends on the composition of the outer monolayers of icy mantles. In prestellar cores, outer monolayers of icy mantles likely include large fraction of CO and products of CO hydrogenation with atomic weights higher than that of water, which may allow the increase of the efficiency of reactive desorption in comparison to that on water ice. As such, combination of non-thermal desorption and extended gas-phase chemistry based on recent experimental and laboratory works, provides reasonable explanation for the observed abundances of complex organic molecules in L1544, and, probably, in other similar objects.
We believe that a three-phase approach (gas–ice surface–ice bulk) to gas-grain chemistry in star-forming regions should be preferred in modeling over the two-phase approach (gas–ice) even considering all the uncertainties that currently exist in our understanding of the processes on the ice surface and within the ice. The three-phase approach reflects the fundamental fact that dynamics of chemical processes on a solid surface and within the solid body are different, and allows us to explore the astrochemical importance of this fact. While currently three-phase models include more poorly known parameters than two-phase ones, this will change with time with the advent of new experimental and theoretical studies.
The chemical model employed in this study, has revealed the key role of the hydroxyl radical (OH) in the chemistry of several important complex organic molecules – methoxy radical, dimethyl ether and methyl formate. To date, the potential importance of this species for the chemistry of COMs is not fully recognized in the literature. To the best of our knowledge, the only systematic study of OH in prestellar cores has been performed by Harju et al. (2000). Given the importance of hydroxyl radical for the chemistry of COMs, as well as the possible high efficiency of the entire class of neutral-neutral reactions with OH at low temperatures (Shannon et al., 2013, 2014), we believe that OH radical is an important target for future observational studies.
Finally, it is important to point out that in this study, we used several important parameters that require more accurate experimental or theoretical measurements. The key assumption of this study – the efficient reactive desorption from surface made of CO and its hydrogenation products – is to be checked in the lab. The binding energy of NH2, a key parameter that influences the abundance of gas-phase formamide in our model, also requires an experimental measurement. Another possible follow-up study is to determine the spectroscopy of CH3OCH2, which is an intermediate product in the formation of methyl formate. If this intermediate product will be found observationally, it would confirm that this is the main formation route of methyl formate in the gas phase. Experimental or/and theoretical studies of the processes mentioned above, will be an important step in improving our knowledge of the chemistry of complex organic molecules in prestellar cores.
References
- Antinolo et al. (2016) Antinolo, M., Agundez, M., Jimenez, E., et al. 2016, ArXiv e-prints, arXiv:1603.04244
- Bacmann & Faure (2016) Bacmann, A., & Faure, A. 2016, A&A, 587, A130
- Bacmann et al. (2016) Bacmann, A., García-García, E., & Faure, A. 2016, A&A, 588, L8
- Bacmann et al. (2012) Bacmann, A., Taquet, V., Faure, A., Kahane, C., & Ceccarelli, C. 2012, A&A, 541, L12
- Balucani et al. (2015) Balucani, N., Ceccarelli, C., & Taquet, V. 2015, MNRAS, 449, L16
- Barone et al. (2015) Barone, V., Latouche, C., Skouteris, D., et al. 2015, MNRAS, 453, L31
- Belloche et al. (2013) Belloche, A., Müller, H. S. P., Menten, K. M., Schilke, P., & Comito, C. 2013, A&A, 559, A47
- Bertin et al. (2016) Bertin, M., Romanzin, C., Doronin, M., et al. 2016, ApJ, 817, L12
- Bizzocchi et al. (2014) Bizzocchi, L., Caselli, P., Spezzano, S., & Leonardo, E. 2014, A&A, 569, A27
- Blake et al. (1987) Blake, G. A., Sutton, E. C., Masson, C. R., & Phillips, T. G. 1987, ApJ, 315, 621
- Bottinelli et al. (2004a) Bottinelli, S., Ceccarelli, C., Lefloch, B., et al. 2004a, ApJ, 615, 354
- Bottinelli et al. (2004b) Bottinelli, S., Ceccarelli, C., Neri, R., et al. 2004b, ApJ, 617, L69
- Callear & Cooper (1990) Callear, A. B., & Cooper, I. A. 1990, J. Chem. Soc., Faraday Trans., 86, 1763
- Caselli et al. (1999) Caselli, P., Walmsley, C. M., Tafalla, M., Dore, L., & Myers, P. C. 1999, ApJ, 523, L165
- Caselli et al. (2002) Caselli, P., Walmsley, C. M., Zucconi, A., et al. 2002, ApJ, 565, 344
- Cazaux et al. (2003) Cazaux, S., Tielens, A. G. G. M., Ceccarelli, C., et al. 2003, ApJ, 593, L51
- Cernicharo et al. (2012) Cernicharo, J., Marcelino, N., Roueff, E., et al. 2012, ApJ, 759, L43
- Chang & Herbst (2016) Chang, Q., & Herbst, E. 2016, ApJ, 819, 145
- Cole et al. (2012) Cole, C. A., Wehres, N., Yang, Z., et al. 2012, ApJ, 754, L5
- Congiu et al. (2009) Congiu, E., Matar, E., Kristensen, L. E., Dulieu, F., & Lemaire, J. L. 2009, MNRAS, 397, L96
- Cruz-Diaz et al. (2016) Cruz-Diaz, G. A., Martín-Doménech, R., Muñoz Caro, G. M., & Chen, Y.-J. 2016, A&A, 592, A68
- Dartois et al. (2015) Dartois, E., Augé, B., Boduch, P., et al. 2015, A&A, 576, A125
- de Graauw et al. (1996) de Graauw, T., Whittet, D. C. B., Gerakines, P. A., et al. 1996, A&A, 315, L345
- Dulieu et al. (2013) Dulieu, F., Congiu, E., Noble, J., et al. 2013, Scientific Reports, 3, 1338
- Fayolle et al. (2011) Fayolle, E. C., Bertin, M., Romanzin, C., et al. 2011, ApJ, 739, L36
- Freeman et al. (1978) Freeman, C. G., Harland, P. W., & McEwan, M. J. 1978, International Journal of Mass Spectrometry and Ion Processes, 28, 377
- Fuchs et al. (2009) Fuchs, G. W., Cuppen, H. M., Ioppolo, S., et al. 2009, A&A, 505, 629
- Garrod et al. (2006) Garrod, R., Park, I. H., Caselli, P., & Herbst, E. 2006, Faraday Discussions, 133, 51
- Garrod (2008) Garrod, R. T. 2008, A&A, 491, 239
- Garrod (2013) —. 2013, ApJ, 765, 60
- Garrod & Herbst (2006) Garrod, R. T., & Herbst, E. 2006, A&A, 457, 927
- Garrod & Pauly (2011) Garrod, R. T., & Pauly, T. 2011, ApJ, 735, 15
- Garrod et al. (2009) Garrod, R. T., Vasyunin, A. I., Semenov, D. A., Wiebe, D. S., & Henning, T. 2009, ApJ, 700, L43
- Garrod et al. (2007) Garrod, R. T., Wakelam, V., & Herbst, E. 2007, A&A, 467, 1103
- Garrod et al. (2008) Garrod, R. T., Weaver, S. L. W., & Herbst, E. 2008, ApJ, 682, 283
- Gibb et al. (2004) Gibb, E. L., Whittet, D. C. B., Boogert, A. C. A., & Tielens, A. G. G. M. 2004, ApJS, 151, 35
- Gillett & Forrest (1973) Gillett, F. C., & Forrest, W. J. 1973, ApJ, 179, 483
- Grim et al. (1991) Grim, R. J. A., Baas, F., Greenberg, J. M., Geballe, T. R., & Schutte, W. 1991, A&A, 243, 473
- Hama & Watanabe (2013) Hama, T., & Watanabe, N. 2013, Chemical Reviews, 113, 8783
- Harju et al. (2000) Harju, J., Winnberg, A., & Wouterloot, J. G. A. 2000, A&A, 353, 1065
- Hasegawa & Herbst (1993) Hasegawa, T. I., & Herbst, E. 1993, MNRAS, 261, 83
- Hasegawa et al. (1992) Hasegawa, T. I., Herbst, E., & Leung, C. M. 1992, ApJS, 82, 167
- Hayes et al. (2012) Hayes, W. W., Oh, J., Kondo, T., et al. 2012, Journal of Physics Condensed Matter, 24, 104010
- He et al. (2014) He, J., Jing, D., & Vidali, G. 2014, Physical Chemistry Chemical Physics (Incorporating Faraday Transactions), 16, 3493
- Herbst & van Dishoeck (2009) Herbst, E., & van Dishoeck, E. F. 2009, ARA&A, 47, 427
- Horn et al. (2004) Horn, A., Møllendal, H., Sekiguchi, O., et al. 2004, ApJ, 611, 605
- Hoyermann & Nacke (1996) Hoyermann, K., & Nacke, F. 1996, Symposium (International) on Combustion, 26, 505
- Husain & Ioannou (1999) Husain, D., & Ioannou, A. X. 1999, Journal of Photochemistry and Photobiology A: Chemistry, 129, 1
- Ivlev et al. (2015) Ivlev, A. V., Röcker, T. B., Vasyunin, A., & Caselli, P. 2015, ApJ, 805, 59
- Jiménez-Serra et al. (2016) Jiménez-Serra, I., Vasyunin, A. I., Caselli, P., et al. 2016, ArXiv e-prints, arXiv:1609.05045
- Johnson et al. (2000) Johnson, D. G., Blitz, M. A., & Seakins, P. W. 2000, Physical Chemistry Chemical Physics (Incorporating Faraday Transactions), 2, 2549
- Keto & Caselli (2010) Keto, E., & Caselli, P. 2010, MNRAS, 402, 1625
- Lacy et al. (1984) Lacy, J. H., Baas, F., Allamandola, L. J., et al. 1984, ApJ, 276, 533
- Lacy et al. (1991) Lacy, J. H., Carr, J. S., Evans, II, N. J., et al. 1991, ApJ, 376, 556
- Le Gal et al. (2014) Le Gal, R., Hily-Blant, P., Faure, A., et al. 2014, A&A, 562, A83
- Marcelino et al. (2005) Marcelino, N., Cernicharo, J., Roueff, E., Gerin, M., & Mauersberger, R. 2005, ApJ, 620, 308
- McElroy et al. (2013) McElroy, D., Walsh, C., Markwick, A. J., et al. 2013, A&A, 550, A36
- Mennella et al. (2006) Mennella, V., Baratta, G. A., Palumbo, M. E., & Bergin, E. A. 2006, ApJ, 643, 923
- Minissale et al. (2016a) Minissale, M., Congiu, E., & Dulieu, F. 2016a, A&A, 585, A146
- Minissale & Dulieu (2014) Minissale, M., & Dulieu, F. 2014, J. Chem. Phys., 141, 014304
- Minissale et al. (2016b) Minissale, M., Dulieu, F., Cazaux, S., & Hocuk, S. 2016b, A&A, 585, A24
- Minissale et al. (2016c) Minissale, M., Moudens, A., Baouche, S., Chaabouni, H., & Dulieu, F. 2016c, MNRAS, 458, 2953
- Minissale et al. (2013) Minissale, M., Congiu, E., Baouche, S., et al. 2013, Physical Review Letters, 111, 053201
- Muñoz Caro et al. (2014) Muñoz Caro, G. M., Dartois, E., Boduch, P., et al. 2014, A&A, 566, A93
- Öberg et al. (2011) Öberg, K. I., Boogert, A. C. A., Pontoppidan, K. M., et al. 2011, ApJ, 740, 109
- Öberg et al. (2010) Öberg, K. I., Bottinelli, S., Jørgensen, J. K., & van Dishoeck, E. F. 2010, ApJ, 716, 825
- Öberg et al. (2009) Öberg, K. I., van Dishoeck, E. F., & Linnartz, H. 2009, A&A, 496, 281
- Occhiogrosso et al. (2014) Occhiogrosso, A., Vasyunin, A., Herbst, E., et al. 2014, A&A, 564, A123
- Pontoppidan et al. (2004) Pontoppidan, K. M., van Dishoeck, E. F., & Dartois, E. 2004, A&A, 426, 925
- Prasad & Tarafdar (1983) Prasad, S. S., & Tarafdar, S. P. 1983, ApJ, 267, 603
- Reboussin et al. (2014) Reboussin, L., Wakelam, V., Guilloteau, S., & Hersant, F. 2014, MNRAS, 440, 3557
- Ruaud et al. (2015) Ruaud, M., Loison, J. C., Hickson, K. M., et al. 2015, MNRAS, 447, 4004
- Ruaud et al. (2016) Ruaud, M., Wakelam, V., & Hersant, F. 2016, MNRAS, 459, 3756
- Ruffle & Herbst (2001) Ruffle, D. P., & Herbst, E. 2001, MNRAS, 322, 770
- Sandford et al. (2001) Sandford, S. A., Bernstein, M. P., Allamandola, L. J., Goorvitch, D., & Teixeira, T. C. V. S. 2001, ApJ, 548, 836
- Shannon et al. (2013) Shannon, R. J., Blitz, M. A., Goddard, A., & Heard, D. E. 2013, Nature Chemistry, 5, 745
- Shannon et al. (2014) Shannon, R. J., Caravan, R. L., Blitz, M. A., & Heard, D. E. 2014, Physical Chemistry Chemical Physics (Incorporating Faraday Transactions), 16, 3466
- Sipilä et al. (2016) Sipilä, O., Caselli, P., & Taquet, V. 2016, A&A, 591, A9
- Skouteris et al. (2017) Skouteris, D., Vazart, F., Ceccarelli, C., et al. 2017, ArXiv e-prints, arXiv:1701.06138
- Smith et al. (2004) Smith, I. W. M., Herbst, E., & Chang, Q. 2004, MNRAS, 350, 323
- Song et al. (2005) Song, X., Hou, H., & Wang, B. 2005, Phys. Chem. Chem. Phys., 7, 3980
- Tafalla et al. (2004) Tafalla, M., Myers, P. C., Caselli, P., & Walmsley, C. M. 2004, A&A, 416, 191
- Tafalla et al. (2002) Tafalla, M., Myers, P. C., Caselli, P., Walmsley, C. M., & Comito, C. 2002, ApJ, 569, 815
- Taquet et al. (2012) Taquet, V., Ceccarelli, C., & Kahane, C. 2012, A&A, 538, A42
- Taquet et al. (2013) Taquet, V., Peters, P. S., Kahane, C., et al. 2013, A&A, 550, A127
- Tielens et al. (1991) Tielens, A. G. G. M., Tokunaga, A. T., Geballe, T. R., & Baas, F. 1991, ApJ, 381, 181
- van Dishoeck (2004) van Dishoeck, E. F. 2004, ARA&A, 42, 119
- van Dishoeck et al. (2006) van Dishoeck, E. F., Jonkheid, B., & van Hemert, M. C. 2006, Faraday Discussions, 133, 231
- Vastel et al. (2014) Vastel, C., Ceccarelli, C., Lefloch, B., & Bachiller, R. 2014, ApJ, 795, L2
- Vastel et al. (2016) —. 2016, A&A, 591, L2
- Vasyunin & Herbst (2013a) Vasyunin, A. I., & Herbst, E. 2013a, ApJ, 762, 86
- Vasyunin & Herbst (2013b) —. 2013b, ApJ, 769, 34
- Vasyunin et al. (2008) Vasyunin, A. I., Semenov, D., Henning, T., et al. 2008, ApJ, 672, 629
- Vasyunin et al. (2004) Vasyunin, A. I., Sobolev, A. M., Wiebe, D. S., & Semenov, D. A. 2004, Astronomy Letters, 30, 566
- Vigren et al. (2010) Vigren, E., Hamberg, M., Zhaunerchyk, V., et al. 2010, ApJ, 709, 1429
- Wakelam & Herbst (2008) Wakelam, V., & Herbst, E. 2008, ApJ, 680, 371
- Wakelam et al. (2010) Wakelam, V., Herbst, E., Le Bourlot, J., et al. 2010, A&A, 517, A21
- Wakelam et al. (2006) Wakelam, V., Herbst, E., & Selsis, F. 2006, A&A, 451, 551
- Wakelam et al. (2017) Wakelam, V., Loison, J.-C., Mereau, R., & Ruaud, M. 2017, ArXiv e-prints, arXiv:1701.06492
- Wakelam et al. (2015) Wakelam, V., Loison, J.-C., Herbst, E., et al. 2015, ApJS, 217, 20
- Wallington et al. (1988) Wallington, T. J., Skewes, L. M., Siegl, W. O., Wu, C.-H., & Japar, S. M. 1988, International Journal of Chemical Kinetics, 20, 867
| Reaction | Rate at 10 K, | Reference |
|---|---|---|
| cms-1 | ||
| OH + CH3OH CH3O + H2O | 1.1(-10) | S13, A16 |
| OH + CH3OCH3 CH3OCH2 + H2O | 1.7(-11) | S14 |
| F + CH3OCH3 CH3OCH2 + HF | 2.0(-10) | HN96 |
| Cl + CH3OCH3 CH3OCH2 + HCl | 2.0(-10) | W88 |
| CH3OCH2 + O HCOOCH3 + H | 2.0(-10) | HN96, S05 |
| CH3O + CH3 CH3OCH3 + h | 3.0(-10) | VH13, B15a |
| CH + CH3OH CH3CHO + H | 1.8(-8) | J00 |
| CH + CH3OH CH3 + H2CO | 1.6(-7) | J00 |
| C + CH3CHO C2H4 + CO | 5.4(-10) | HI99 |
| C + H2CO CO + CH2 | 6.2(-10) | HI99 |
| CH3 + HCO CH3CHO + h | 5.0(-11) | NIST |
| NH2 + H2CO NH2CHO + H | 2.9(-11) | S17 |
Notes: a(-b) stands for . , and are the coefficients in the modified Arrhenius expression for the reaction rate coefficient: . S13 refers to Shannon et al. (2013), A16 refers to Antinolo et al. (2016), S14 refers to Shannon et al. (2014), HN96 refers to Hoyermann & Nacke (1996), W88 refers to Wallington et al. (1988), S05 refers to Song et al. (2005), VH13 refers to Vasyunin & Herbst (2013b), B15a refers to Balucani et al. (2015), S17 refers to Skouteris et al. (2017), J00 refers to Johnson et al. (2000), HI99 refers to Husain & Ioannou (1999). URL for NIST Chemical Kinetics Database: http://kinetics.nist.gov/kinetics/index.jsp
. Species Abundance wrt. solid water, % H2O 100 CO 35 CH3OH 28 N2 26 H2CO 19 NH3 7 CH4 6 H2O2 4
| Species | Main model (MM) | Observations | ||
|---|---|---|---|---|
| L1544 | L1689b | B1-b | ||
| HCOOCH3 | 6.0(-11) | 1.5(-10) J | 7.4(-10) B | 2.0(-11) C |
| CH3OCH3 | 4.0(-11) | 5.1(-11) J | 1.3(-10) B | 2.0(-11) C |
| NH2CHO | 3.8(-12) | 8.7(-13) J | — | — |
| CH3CHO | 5.8(-10) | 2.1(-10) J | 1.7(-10) B | 1.0(-11) C |
| CH3O | 1.0(-10) | 2.7(-11) J | 3.3(-11) BF | 4.7(-12) C |
| HCO | 4.6(-10) | — | 3.6(-10) BF | — |
| H2CO | 4.8(-08) | — | 1.3(-09) B | 4.0(-10) M |
| CH3OH | 2.7(-08) | 6.0(-9) V | — | 3.1(-09) O |
Notes: a(-b) stands for . B refers to Bacmann et al. (2012), BF refers to Bacmann & Faure (2016) (the fractional abundances derived as fraction of column densities provided in Table 6 and Table 7 of BF divided by the H2 column density value of 3.61022 cm-2 taken from Bacmann et al. 2016), C refers to Cernicharo et al. (2012), J refers to the abundances of COMs measured toward the position of the “methanol peak” defined by Jiménez-Serra et al. (2016), M refers to Marcelino et al. (2005), O refers to Öberg et al. (2010), and V refers to Vastel et al. (2014). Values for Main model (MM) are smoothed for a telescope beam size of 26” to allow comparison with observed values by Jiménez-Serra et al. (2016).
. Species Surface RD efficiency contribution, % CH3O 45 3.4(-5) OH 10 4.5(-2) HCO 20 2.1(-3) CH3 3 6.2(-1) C2H4 98 6.0(-2) NH2 5 2.5(-1) H2CO 75 5.4(-2) CH3OH 99 6.4(-3)

.