Doping driven structural distortion in the bilayer iridate (Sr1-xLax)3Ir2O7
Abstract
Neutron single crystal diffraction and rotational anisotropy optical second harmonic generation data are presented resolving the nature of the structural distortion realized in electron-doped (Sr1-xLax)3Ir2O7 with and . Once electrons are introduced into the bilayer spin-orbit assisted Mott insulator Sr3Ir2O7, previous studies have identified the appearance of a low temperature structural distortion and have suggested the presence of a competing electronic instability in the phase diagram of this material. Our measurements resolve a lowering of the structural symmetry from monoclinic to monoclinic and the creation of two unique Ir sites within the chemical unit cell as the lattice distorts below a critical temperature . Details regarding the modifications to oxygen octahedral rotations and tilting through the transition are discussed as well as the evolution of the low temperature distorted lattice as a function of carrier substitution.
pacs:
61.05.F-, 75.50.Ee, 75.70.Tj, 61.50.-fpacs:
I Introduction
Sr3Ir2O7 is the bilayer member of the Ruddlesden-Popper series of strontium iridates, and it is comprised of square lattice sheets of corner sharing IrO6 octahedra stacked within bilayers between rock-salt SrO charge reservoir layers.Subramanian et al. (1994) This material is a unique example of a spin-orbit Mott insulator Kim et al. (2008) on the verge of a dimensionality-driven metal to insulator transition.Moon et al. (2008) As a result, Sr3Ir2O7 manifests a Mott state in the weak limit—one where the combination of strong spin-orbit coupling, strong crystal field, and moderate on-site Coulomb interaction energy scales stabilizes a small gap (E meV) Okada et al. (2013) antiferromagnetic insulating state where .
A number of studies have explored the carrier induced response of the spin-orbit assisted Mott (SOM) phase in both Sr2IrO4 Chen et al. (2015); Clancy et al. (2014); Calder et al. (2015); Kim et al. (2016); Qi et al. (2012); De La Torre et al. (2015) and Sr3Ir2O7 Hogan et al. (2015); Dhital et al. (2014); Li et al. (2013); He et al. (2015) Ruddlesden-Popper iridates in an effort to realize unconventional metallic states such as high temperature superconductivity.Wang and Senthil (2011) Due to its charge gap being inherently smaller than Sr2IrO4, electron-doping into Sr3Ir2O7 via La-substitution provides an important example of where the SOM state can be completely quenched and a global metallic state (i.e. no nanoscale phase separation) can be realized before the solubility limit of La onto the Sr-sites is reached.Hogan et al. (2015) Specifically, (Sr1-xLax)3Ir2O7 generates a first-order transition into a metallic ground state at a doping level of electrons/Ir () which is accompanied by the disappearance of long-range antiferromagnetism.Hogan et al. (2015) The metallic state realized beyond this transition is unconventional with signatures of strong correlation effects, Ahn et al. (2016) dimer formation, Hogan et al. (2016a); Sala et al. (2015) negative electronic compressibility, He et al. (2015) and other electronic anomalies.Ding et al. (2016); Lu et al. (2017)
One of the anomalous properties inherent to (Sr1-xLax)3Ir2O7 is the appearance of a structural distortion below a characteristic temperature .Hogan et al. (2015) This lattice distortion seemingly competes with antiferromagnetism and is suggestive of a secondary signature of an otherwise hidden electronic instability. Optical studies have recently suggested the stabilization of a charge density wave-like instability that appears below ;Chu et al. (2017) however little remains known regarding the nature of the structural distortion intertwined with this density wave formation.
One impediment to determining the details of this lattice transition has been the presence of weak Bragg violations of the nominally orthorhombic parent structure of Sr3Ir2O7 reported in earlier neutron diffraction measurements.Dhital et al. (2012) This ambiguity obscured the parent lattice symmetry of this system and complicated the visualization of the parent structure’s evolution across . Lifting this impediment, a recent combined single crystal neutron diffraction, rotational anisotropy optical second harmonic generation (RA-SHG), and density functional theory study has now identified the inherent distortion away from in Sr3Ir2O7 as a subtle octahedral tilt out of the basal plane within a lower symmetry monoclinic cell (space group ).Hogan et al. (2016b) Knowing the parent symmetry of the undoped system can now be leveraged to more definitively resolve the nature of the doping driven lattice distortion below .
In this paper, we present a single crystal neutron diffraction and RA-SHG study of the lattice distortion realized in (Sr1-xLax)3Ir2O7 as the system enters the low temperature structural phase below . Concentrations on both the insulating (, K) and metallic (, K) sides of the metal-insulator transition are explored and their lattice structures are determined both at K () and at K (). The high temperature lattice structures for both concentrations are consistent with the recently reported parent space group of Sr3Ir2O7; however below both concentrations reveal an enhanced out-of-plane tilt of IrO6 octahedra and a lowering of the unit cell symmetry into a primitive centered space group. The result is a low temperature lattice with two distinct Ir-sites capable of supporting a charge-ordered state—a structure consistent with the recent suggestion of a charge density wave in this system.Chu et al. (2017)
II Experimental Details
The methods for growing the (Sr1-xLax)3Ir2O7 single crystals used in this study are reported elsewhere.Hogan et al. (2015); Sup Neutron scattering datasets were collected at K and K for single crystals with La concentrations of (mass 4.9 mg, dimensions 1.5 mm 1.44 mm 0.48 mm) and (mass 1.3 mg, dimensions 1.34 mm 1.10 mm 0.24 mm) using the time-of-flight Laue diffractometer TOPAZ at Oak Ridge National Laboratory. Optimizing sample orientations to maximize reciprocal space coverage was accomplished using the CRYSTALPLAN software.Zikovsky et al. (2011) Raw diffraction data were integrated using a 3D ellipsoidal routine Schultz et al. (2014) then reduced to account for Lorentz corrections and the time-of-flight spectrum. Numeric absorption corrections were applied using polyhedral models of the individual crystals, and detector efficiencies were accounted for using the ANVRED3 program.Schultz et al. (1984) The final reduced dataset was refined to models using SHELXL.Sheldrick (2008) Unless otherwise indicated, reciprocal space vectors are indexed using the monoclinic space group where is parallel to the long-axis of the unit cell and is parallel to the unique axis.
Charge balance was enforced in all structural solutions, and the site occupancies of O and Ir atoms were fixed to unity in the final structural refinements. The site occupancy for O atoms refined to be fully occupied within error for the x=0.035 sample, but varied for the x=0.071 sample if not constrained. Ir atoms refined to have an occupancy close to unity; however free refinement yielded a several percent (typically ) deviation from full occupation, which may arise as an artifact from the high-absorption of Ir in the neutron structure. This high absorption introduces an added sensitivity to slight deviations of the real crystal shape from the polyhedral absorption models.
RA-SHG data were acquired using a rotating scattering plane technique Harter et al. (2015) from the (100), long axis, cleaved surface of an (Sr1-xLax)3Ir2O7 single crystal. Incident light was provided by a Ti:sapphire regenerative amplifier (100 fs pulse width, 100 kHz repetition rate, 800 nm center wavelength) and focused onto a 50 diameter spot on the sample with a fluence of mJ/cm2.
III RA-SHG Results
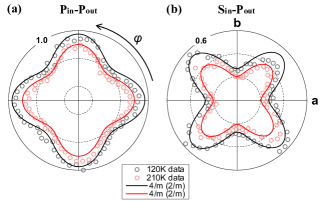
As a first step in resolving the structure of (Sr1-xLax)3Ir2O7 both below and above , RA-SHG measurements were performed to constrain the crystallographic point group symmetry. RA-SHG has been shown to be sensitive to the point group symmetry of a crystal and was applied to help resolve the structure of the parent compound Sr3Ir2O7.Hogan et al. (2016b) Figure 1 shows RA-SHG patterns acquired from the (100) cleaved surface of a (Sr1-xLax)3Ir2O7 single crystal both above and below its structural transition temperature K.
At temperatures above , the RA-SHG data in all input and output polarization geometries (parallel P or perpendicular S to the scattering plane) exhibits nearly four-fold rotational symmetry. By using the same analysis applied to undoped Sr3Ir2O7, Hogan et al. (2016b) that is, assuming the dominant contribution to SHG to be of bulk electric-quadrupole origin from a centrosymmetric or point group, we obtain equally good fits to the data. No changes in symmetry are observed below (Fig. 1), only a continuous change in overall magnitude appears upon cooling, and these data demonstrate that the distorted lattice below shares the same crystallographic point group symmetry as the high temperature structure (). When viewed together with prior diffraction data that excluded space groups with symmetry for the parent lattice structure, these results demonstrate that the point group symmetry remains for (Sr1-xLax)3Ir2O7 at all temperatures.
IV Neutron Diffraction Results
Neutron diffraction data were collected on the and samples at K and K. The 100 K data reside below for both samples where K and K for the and samples respectively. The structures of both and samples at K refined well within the space group using the same pseudomerohedral twinning operation as that observed for the system. This twinning operation involves a two-fold rotation about the basal plane diagonal direction along the unit cell center, and the resulting twin structure (twins and ) is effectively just a fault in the phasing of the relative -plane rotations of IrO6 octahedra between bilayers. Each twin occupies nearly half of the total scattering volume for both crystals with twinning ratios of and refined for and samples respectively.
| (Sr1-xLax)3Ir2O7 | |||
|---|---|---|---|
| ( K) | ( K) | ( K) | |
| a (Å) | 20.935(4) | 20.8877(17) | 20.943(4) |
| b (Å) | 5.5185(13) | 5.5206(5) | 5.5244(16) |
| c (Å) | 5.5099(9) | 5.5287(6) | 5.5138(16) |
| (∘) | 90.045(18) | 90.066(8) | 90.05(2) |
| V (Å3) | 636.6(2) | 637.53(10) | 637.9(3) |
| (Sr1-xLax)3Ir2O7 | |||
| ( K) | ( K) | ( K) | |
| a (Å) | 20.917(3) | 5.5133(5) | 5.5109(8) |
| b (Å) | 5.5080(10) | 5.5116(5) | 5.5110(8) |
| c (Å) | 5.4995(7) | 21.618(2) | 21.611(3) |
| (∘) | 90.069(15) | 104.821(8) | 104.772(13) |
| V (Å3) | 633.60(17) | 635.05(10) | 634.65(16) |
The 295 K lattice parameters and unit cell parameters for the , , and samples are summarized in Table I. Consistent with earlier data, the unit cell volume swells slightly with La-substitution,Hogan et al. (2015) and this expansion is driven primarily by the increase of the basal -plane lattice parameters. Atomic positions and anisotropic thermal displacement parameters for and at 295 K are summarized in Tables II and III respectively. La concentrations for both samples refine within error to the nominal values determined via earlier energy dispersive x-ray spectroscopy measurements.
At 295 K, the local ligand field at the Ir sites remains very nearly cubic with small distortion parameters of for and for , where is the average of the octahedral bond lengths. Basal plane (-plane) rotation angles of the IrO6 octahedra for both La-doped samples are similar to the parent system with canting angles for and for . The angles here represent averages of the two distinct Ir-O-Ir bond angles in the -plane due to the unique O(3) and O(4) sites of the structure. Individually, these values were and for and and for . Out-of-plane tilting angles of octahedra between bilayers remain small with values of for and for where is the Ir-O(1)-Ir interplane bond angle. This verifies that, in the high temperature phase, the structure is largely unperturbed by the substitution of La into the lattice.
| Atom | Site | x | y | z | U11 |
|---|---|---|---|---|---|
| Ir | 8f | 0.59774(4) | 0.7499(3) | 0.74997(13) | 9.7(4) |
| Sr(1) | 4e | 0.5000 | 0.2498(6) | 0.7500 | 11.3(7) |
| La(1) | 4e | 0.5000 | 0.2498(5) | 0.7500 | 11.3(7) |
| Sr(2) | 8f | 0.68706(6) | 0.7497(5) | 0.2497(3) | 10.2(6) |
| La(2) | 8f | 0.68706(6) | 0.7497(5) | 0.2497(3) | 10.2(6) |
| O(1) | 4e | 0.5000 | 0.7506(9) | 0.7500 | 10.0(10) |
| O(2) | 8f | 0.69492(8) | 0.7492(6) | 0.7498(3) | 10.1(6) |
| O(3) | 8f | 0.09607(11) | 0.4470(4) | 0.4474(4) | 23.4(10) |
| O(4) | 8f | 0.09592(11) | 0.9473(4) | 0.5525(4) | 22.2(9) |
| Atom | U22 | U33 | U23 | U13 | U12 |
| Ir | 8.5(18) | 2.9(15) | 0.0(3) | -0.6(3) | -0.2(3) |
| Sr(1) | 5(4) | 13(4) | 0.00 | -0.7(6) | 0.00 |
| La(1) | 5(4) | 13(4) | 0.00 | -0.7(6) | 0.00 |
| Sr(2) | 10(3) | 11(2) | -0.6(6) | -0.5(4) | -0.1(6) |
| La(2) | 10(3) | 11(2) | -0.6(6) | -0.5(4) | -0.1(6) |
| O(1) | 17(5) | 41(5) | 0.00 | -1.6(11) | 0.00 |
| O(2) | 18(2) | 9.7(16) | -0.5(7) | -0.4(5) | -0.7(8) |
| O(3) | 7.1(9) | 8.8(8) | 2.6(8) | 0.3(8) | 0.3(9) |
| O(4) | 6.8(8) | 9.1(8) | -3.1(8) | -1.4(8) | -0.1(9) |
| Atom | Site | x | y | z | U11 |
|---|---|---|---|---|---|
| Ir | 8f | 0.59773(4) | 0.7504(8) | 0.74983(16) | 8.6(4) |
| Sr(1) | 4e | 0.5000 | 0.2507(2) | 0.7500 | 10.1(7) |
| La(1) | 4e | 0.5000 | 0.2507(2) | 0.7500 | 10.1(7) |
| Sr(2) | 8f | 0.68692(6) | 0.7488(15) | 0.2502(3) | 9.5(5) |
| La(2) | 8f | 0.68695(7) | 0.7510(19) | 0.2502(3) | 9.5(5) |
| O(1) | 4e | 0.5000 | 0.749(2) | 0.7500 | 7.6(8) |
| O(2) | 8f | 0.69475(7) | 0.7499(12) | 0.7501(3) | 8.7(6) |
| O(3) | 8f | 0.09600(13) | 0.4481(6) | 0.4479(6) | 21.4(10) |
| O(4) | 8f | 0.09595(13) | 0.9479(6) | 0.5526(6) | 22.8(10) |
| Atom | U22 | U33 | U23 | U13 | U12 |
| Ir | 9.5(18) | 0.0026(14) | 0.4(5) | -1.4(3) | 0.4(9) |
| Sr(1) | 6(4) | 12(4) | 0.00 | -2.2(6) | 0.00 |
| La(1) | 6(4) | 12(4) | 0.00 | 2.2(6) | 0.00 |
| Sr(2) | 19(2) | 2.8(18) | -1.4(10) | 1.0(4) | 1.3(19) |
| La(2) | 19(2) | 2.8(18) | -1.4(10) | 1.0(4) | 1.3(19) |
| O(1) | 23(7) | 33(8) | 0.00 | 0.0(10) | 0.00 |
| O(2) | 9(4) | 18(5) | 0.2(15) | -1.7(6) | 3(2) |
| O(3) | 9.6(15) | 8.0(13) | 2.8(13) | -1.7(16) | 1.6(19) |
| O(4) | 7.1(15) | 5.8(12) | -1.0(13) | -0.5(16) | 0.3(19) |
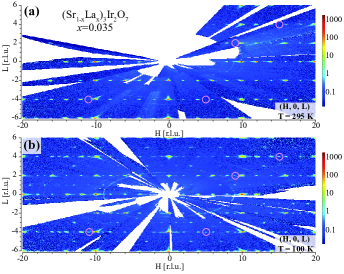
Upon cooling to 100 K, a number of new Bragg peaks appear in the single crystal diffraction patterns of both the and crystals. These new peaks appear at positions that violate the general reflection conditions of space group that for : and for : . Bragg peaks collected in the plane for the sample are plotted in Fig. 2 at both K and K. For illustration, four peaks are highlighted at the (-11, 0, -4), (5, 0, -4), (9, 0, 2), and (15, 0, 4) positions—all of which appear only in the 100 K pattern. Even after accounting for twin domains by transposing the indices via the twin operator (1 0 0, 0 0 -1, 0 1 0) where the triplets indicate matrix rows, these reflections violate the space group conditions. This demonstrates a further lowering of the lattice symmetry through rather than a simple enhancement of the existing, subtle distortion inherent to the parent Sr3Ir2O7’s structure.
In determining the likely space groups for the structure below , the fact that the transition is second order reported from earlier neutron order parameter measurements Hogan et al. (2015) mandates that the lower symmetry group should be a subgroup of the parent phase (No. 15). In looking to lower symmetry however, Bragg peaks appearing below violate the general reflection conditions of even the lowest-symmetry -centered space group (No. 5), which requires for : . This demonstrates that the lattice is no longer base-centered at low temperature. Space groups which preserve the point group symmetry () but instead have primitive cells are Nos. 14, 13, 11, and 10. Within this list, Nos. 10 and 11 have no group-subgroup relationship with No. 15, leaving Nos. 14 and 13 as likely candidates for describing the lattice of the distorted low temperature phase. Both space group Nos. 14 and 13 were attempted, and superior fits were obtained within the higher symmetry group . The loss of a two-fold rotation axis allows for an oxygen octahedral distortion that creates three additional unique oxygen sites as well as an additional chemically distinct Ir position within the IrO6 planes.
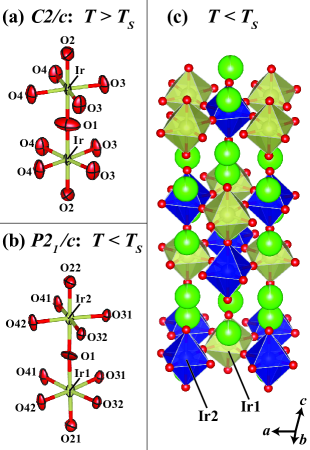
It is worth briefly describing this new cell setting, illustrated in Fig. 3. In , the long axis of the cell is the -axis; however with a cell which corresponds to shifting over one basal plane lattice constant as the unit cell is traversed along the long-axis in a setting. The indices of the cell are related to the new primitive cell by the transform (0 0 -1, 0 1 0, 1 0 -1). For refinements within this cell, the program ROTAX Cooper et al. (2002) was used to identify the most likely twin operator as a four-fold rotation about the direction of the primitive cell. This direct-space lattice direction corresponds precisely to the long-axis of the base-centered unit-cell in and the four-fold rotation about such an axis in the tetragonal metric is a symmetry operator of the point group, classifying this also as twinning by pseudomerohedry.
The new primitive monoclinic unit cell combined with the twinning operation (0 1 0, -1 0 0, 1 -1 1) accounts for all of the disallowed reflections observed below , where there are now no restrictions on reflection conditions. The refined weights of the contributions of individual twin-domains are each very near the expected value of 0.25 for a four-fold symmetric twin operator with , , , for the sample and , , , for the sample. A summary of the 100 K unit cell parameters for both samples is provided in Table I.
A good structural refinement with anisotropic displacement parameters was obtained at 100 K using the twinned cell for the sample. Atomic positions and the resulting displacement parameters are listed in Table IV. In the lower symmetry cell, the majority of atomic sites split into two distinct positions, and a stable refinement with anisotropic thermal parameters required the constraint that the displacement parameters of sites split through the transition from to be fixed identical to one another. We again note here that this lower symmetry cell has two distinct Ir-sites, labeled Ir(1) and Ir(2) (illustrated in Fig. 3). The local oxygen octahedral environment of each Ir-site becomes slightly more distorted relative to the high temperature 295 K structure with distortion parameters and for the Ir(1) and Ir(2) sites respectively. Nearest neighbor Ir-Ir distances within the basal plane and interbilayer Ir-Ir distances remain unchanged within error.
The average basal plane Ir-O-Ir bond angle decreases slightly to at 100 K in the sample, resulting in an average increase in the octahedral canting angle to . There is however greater variance in the basal plane Ir-O-Ir bond angles, where , , , and . Above , the bond angles Ir-O(3)-Ir and Ir-O(4)-Ir are identical to one another.
| Atom | Site | x | y | z | U11 |
|---|---|---|---|---|---|
| Ir(1) | 4e | 0.8433(4) | 0.2468(4) | 0.59748(13) | 5.1(7) |
| Ir(2) | 4e | 0.6571(4) | 0.2534(4) | 0.40207(13) | 5.1(7) |
| Sr(1) | 4e | 0.2542(5) | 0.2459(13) | 0.5004(3) | 4.0(12) |
| Sr(21) | 4e | 0.9399(6) | 0.7390(8) | 0.6863(2) | 7.7(12) |
| Sr(22) | 4e | 0.5593(6) | 0.7670(8) | 0.3122(2) | 7.4(11) |
| La(1) | 4e | 0.2542(5) | 0.2459(13) | 0.5004(3) | 4.0(12) |
| La(21) | 4e | 0.9399(6) | 0.7390(8) | 0.6863(2) | 7.7(12) |
| La(22) | 4e | 0.5593(6) | 0.7670(8) | 0.3122(2) | 7.4(11) |
| O(1) | 4e | 0.7248(9) | 0.2498(17) | 0.4994(3) | 15.6(15) |
| O(21) | 4e | 0.9555(7) | 0.2449(12) | 0.6947(3) | 9.0(9) |
| O(22) | 4e | 0.5671(7) | 0.2555(12) | 0.3050(2) | 9.0(9) |
| O(31) | 4e | 0.1416(6) | 0.0482(7) | 0.59123(17) | 5.9(6) |
| O(32) | 4e | 0.3459(6) | 0.0593(7) | 0.4021(2) | 5.9(6) |
| O(41) | 4e | 0.0382(7) | 0.5516(7) | 0.5942(2) | 5.3(6) |
| O(42) | 4e | 0.4510(6) | 0.5550(7) | 0.39938(19) | 5.3(6) |
| Atom | U22 | U33 | U23 | U13 | U12 |
| Ir(1) | 1.9(5) | 7.61(14) | -0.13(10) | 1.0(5) | -0.7(3) |
| Ir(2) | 1.9(5) | 7.61(14) | -0.13(10) | 1.0(5) | -0.7(3) |
| Sr(1) | 4.0(12) | 8.6(3) | 0.7(3) | 1.2(10) | -0.6(11) |
| Sr(21) | 4.1(11) | 9.6(12) | 0.6(9) | 5.4(8) | -1.5(7) |
| Sr(22) | 6.3(12) | 6.3(10) | -0.3(9) | 4.5(7) | -1.7(7) |
| La(1) | 4.0(12) | 8.6(3) | 0.7(3) | 1.2(10) | -0.6(11) |
| La(21) | 4.1(11) | 9.6(12) | 0.6(9) | 5.4(8) | -1.5(7) |
| La(22) | 6.3(12) | 6.3(10) | -0.3(9) | 4.5(7) | -1.7(7) |
| O(1) | 17.2(13) | 9.4(5) | -0.1(5) | 7.7(15) | 2(2) |
| O(21) | 9.0(8) | 8.2(2) | 0.2(2) | 1.8(8) | 1.3(11) |
| O(22) | 9.0(8) | 8.2(2) | 0.2(2) | 1.8(8) | 1.3(11) |
| O(31) | 4.3(8) | 11.6(8) | 1.5(8) | 1.8(6) | 0.4(5) |
| O(32) | 4.3(8) | 11.6(8) | 1.5(8) | 1.8(6) | 0.4(5) |
| O(41) | 6.6(8) | 16.0(10) | -1.5(9) | 4.8(6) | 0.7(6) |
| O(42) | 6.6(8) | 16.0(10) | -1.5(9) | 4.8(6) | 0.7(6) |
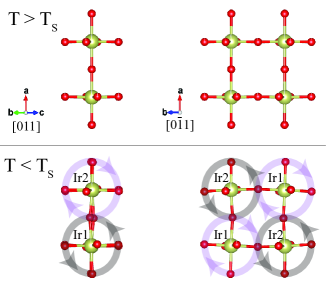
The most prominent distortion to the lattice structure below is the activation of interlayer apical tilting. The Ir(1)-O(1)-Ir(2) bond angle is appreciably distorted relative to the high temperature structure and reduces to , resulting in a octahedral tilting angle. This activated tilting of the oxygen octahedra about both the basal plane and vectors in the cell represents the primary distinction between the structures below and above . The relative senses of tilts of the oxygen octahedra along this apical bond are illustrated in Fig. 4.
For the sample at 100 K, a similar approach to refining the low temperature unit cell in was attempted;Sup however anisotropic displacement parameters for a number of sites failed to converge to positive definite values. The crystal was found to possess a small second grain closely aligned with the primary domain which likely triggered this failure. Nevertheless when both domains were integrated, a refinement employing isotropic displacement parameters was successful in with atomic site positions and thermal factors tabulated in Table V. The distorted structure for this metallic sample is qualitatively similar to that observed in the sample. The Ir(1)-O(1)-Ir(2) out of plane bond angle was refined to be ( tilting angle), a value slightly larger than that determined via the anisotropic refinement of the sample. This apparent enhancement of the octahedral tilt relative to the sample is likely due to the isotropic refinement of the lattice, and an isotropic refinement of the 100 K data yields a similarly enhanced tilting angle of .
| Atom | Site | x | y | z | |
|---|---|---|---|---|---|
| Ir(1) | 4e | 0.8452(11) | 0.2467(16) | 0.59526(14) | 8.3(2) |
| Ir(2) | 4e | 0.6499(11) | 0.2547(17) | 0.39994(14) | 8.3(2) |
| Sr(1) | 4e | 0.2561(14) | 0.244(3) | 0.5028(3) | 8.2(6) |
| Sr(21) | 4e | 0.9343(11) | 0.7333(17) | 0.6845(2) | 5.8(9) |
| Sr(22) | 4e | 0.5620(13) | 0.764(2) | 0.3099(3) | 9.7(11) |
| La(1) | 4e | 0.2561(14) | 0.244(3) | 0.5028(3) | 8.2(6) |
| La(21) | 4e | 0.9343(11) | 0.7333(17) | 0.6845(2) | 5.8(9) |
| La(22) | 4e | 0.5620(13) | 0.764(2) | 0.3099(3) | 9.7(11) |
| O(1) | 4e | 0.7178(16) | 0.241(3) | 0.4992(5) | 11.7(8) |
| O(21) | 4e | 0.9707(15) | 0.2445(16) | 0.6971(3) | 9.5(5) |
| O(22) | 4e | 0.5484(15) | 0.2545(16) | 0.3069(3) | 9.5(5) |
| O(31) | 4e | 0.1516(19) | 0.0507(18) | 0.5968(3) | 8.5(3) |
| O(32) | 4e | 0.3476(17) | 0.0587(16) | 0.4049(3) | 8.5(3) |
| O(41) | 4e | 0.0364(16) | 0.5501(17) | 0.5883(3) | 8.5(3) |
| O(42) | 4e | 0.4481(15) | 0.5554(16) | 0.3963(3) | 8.5(3) |
The average oxygen octahedral distortion parameters about Ir-sites increase below for this crystal with for the octahedra about the Ir(1) sites and for octahedra about the Ir(2) sites. A similar increase in below is not observed in either an anisotropic or isotropic refinement of the 100 K data, suggesting that this effect is not purely a consequence of the isotropic treatment of the data. Similar to the sample, the average basal plane IrO6 octahedral rotation angle increases slightly relative to the high temperature 295 K value (from to ).
V Discussion
The manifestation of a global lattice distortion under very light La-doping levels combined with its competition with the antiferromagnetic insulating state within the phase diagram of (Sr1-xLax)3Ir2O7 Hogan et al. (2015) is suggestive of its being a secondary consequence of a primary electronic order parameter. Within this scenario, the distortion observed below in La-substituted Sr3Ir2O7 is consistent with the recent suggestion of charge density wave-like order near the same temperature.Chu et al. (2017) For such a scenario to occur, the structure should accommodate any additional symmetry breaking driven via charge order on the Ir-sites via the creation of chemically distinct Ir-sites compatible with hosting charge texture within the lattice.
The distortion from to observed below allows for potential charge disproportionation on the Ir sites through the creation of distinct Ir(1) and Ir(2) sites arranged in a checkerboard pattern within the IrO2 planes of a given bilayer. This is reminiscent of previous observations of structural accommodation of charge order within perovskite nickelates Hwang et al. (2013) and supports a picture of a competing charge instability in this electron-doped SOM insulator. We note here that the formation of two Ir-sites in electron-doped Sr3Ir2O7 is distinct from the two Ir-sites inherent to the Sr2IrO4 lattice.Torchinsky et al. (2015) In single layer Sr2IrO4, the two unique Ir sites are an intrinsic property of the parent crystal structure,Ye et al. (2013); Dhital et al. (2013); Torchinsky et al. (2015) and there is no structural distortion evident upon electron doping.Chen et al. (2015)
The appreciable tilting of the IrO6 octahedra out of the basal plane is the primary signature of the lattice distortion below and, within the uncertainty of our current refinement, the magnitudes of these activated tilts are equivalent for the and samples. While this comparison is somewhat constrained by the inability to perform a refinement with anisotropic displacement parameters for the sample, the observation is consistent with previous data demonstrating that the magnitude of the competing lattice distortion saturates at the insulator to metal transition near in the phase diagram of (Sr1-xLax)3Ir2O7.Hogan et al. (2015)
The enhanced distortion of the local oxygen octahedra about the Ir sites in the crystal relative to the crystal marks one distinction between the two low temperature structures. An isotropic refinement of the sample shows an alternating enhancement/contraction of the unshared apical Ir-O(2) bond lengths as the system is cooled through . In the low temperature phase, the Ir(1)-O(21) bond length expands by while the Ir(2)-O(22) bond length contracts by . While this is naively consistent with a partial charge disproportionation on the Ir(1) and Ir(2) sites that builds with continued electron doping, future measurements of a highly doped (Sr1-xLax)3Ir2O7 crystal (without the complication of a small second grain) that allow for a full refinement of anisotropic displacement parameters are required to more carefully explore this possibility.
VI Conclusions
In summary, we have performed single crystal neutron diffraction measurements resolving the nature of the lattice distortion that manifests across the structural transition in the electron-doped SOM insulator (Sr1-xLax)3Ir2O7. The high temperature () cell retains its symmetry through the solubility limit of La () into the lattice. The low temperature () unit cells for both the concentration near the metal to insulator phase boundary and for the concentration deep in the metallic regime adopt a lower symmetry space group where an appreciable out-of-plane IrO6 octahedral tilt is activated. Two unique Ir sites appear in this lower symmetry cell, consistent with a lattice symmetry required for the onset of charge density ordering below . Our observations support the notion of the lattice distortion manifesting as a secondary consequence of a primary electronic instability in the phase diagram of (Sr1-xLax)3Ir2O7.
Acknowledgements.
This work was supported by NSF Award No. DMR-1505549 (S.D.W., T.H.), as well as by the Institute for Quantum Information and Matter, an NSF Physics Frontiers Center (PHY-1125565) with support of the Gordon and Betty Moore Foundation through Grant GBMF1250 (D.H., H.C.). Work performed at the ORNL Spallation Neutron Source TOPAZ single-crystal diffractometer was supported by the Scientific User Facilities Division, Office of Basic Energy Sciences, US Department of Energy, under Contract No. DE-AC05-00OR22725 with UT-Battelle, LLC. VESTA software was used for crystal structure visualization.Momma and Izumi (2011)References
- Subramanian et al. (1994) M. Subramanian, M. Crawford, and R. Harlow, Materials research bulletin 29, 645 (1994).
- Kim et al. (2008) B. Kim, H. Jin, S. Moon, J.-Y. Kim, B.-G. Park, C. Leem, J. Yu, T. Noh, C. Kim, S.-J. Oh, et al., Physical review letters 101, 076402 (2008).
- Moon et al. (2008) S. Moon, H. Jin, K. W. Kim, W. Choi, Y. Lee, J. Yu, G. Cao, A. Sumi, H. Funakubo, C. Bernhard, et al., Physical review letters 101, 226402 (2008).
- Okada et al. (2013) Y. Okada, D. Walkup, H. Lin, C. Dhital, T.-R. Chang, S. Khadka, W. Zhou, H.-T. Jeng, M. Paranjape, A. Bansil, et al., Nature materials 12, 707 (2013).
- Chen et al. (2015) X. Chen, T. Hogan, D. Walkup, W. Zhou, M. Pokharel, M. Yao, W. Tian, T. Z. Ward, Y. Zhao, D. Parshall, et al., Physical Review B 92, 075125 (2015).
- Clancy et al. (2014) J. Clancy, A. Lupascu, H. Gretarsson, Z. Islam, Y. Hu, D. Casa, C. Nelson, S. LaMarra, G. Cao, and Y.-J. Kim, Physical Review B 89, 054409 (2014).
- Calder et al. (2015) S. Calder, J.-W. Kim, G.-X. Cao, C. Cantoni, A. F. May, H. B. Cao, A. A. Aczel, M. Matsuda, Y. Choi, D. Haskel, et al., Physical Review B 92, 165128 (2015).
- Kim et al. (2016) Y. Kim, N. Sung, J. Denlinger, and B. Kim, Nature Physics 12, 37 (2016).
- Qi et al. (2012) T. Qi, O. Korneta, L. Li, K. Butrouna, V. Cao, X. Wan, P. Schlottmann, R. Kaul, and G. Cao, Physical Review B 86, 125105 (2012).
- De La Torre et al. (2015) A. De La Torre, S. M. Walker, F. Y. Bruno, S. Riccó, Z. Wang, I. G. Lezama, G. Scheerer, G. Giriat, D. Jaccard, C. Berthod, et al., Physical review letters 115, 176402 (2015).
- Hogan et al. (2015) T. Hogan, Z. Yamani, D. Walkup, X. Chen, R. Dally, T. Z. Ward, M. Dean, J. Hill, Z. Islam, V. Madhavan, et al., Physical review letters 114, 257203 (2015).
- Dhital et al. (2014) C. Dhital, T. Hogan, W. Zhou, X. Chen, Z. Ren, M. Pokharel, Y. Okada, M. Heine, W. Tian, Z. Yamani, et al., Nature communications 5 (2014).
- Li et al. (2013) L. Li, P. Kong, T. Qi, C. Jin, S. Yuan, L. DeLong, P. Schlottmann, and G. Cao, Physical Review B 87, 235127 (2013).
- He et al. (2015) J. He, T. Hogan, T. R. Mion, H. Hafiz, Y. He, J. Denlinger, S. Mo, C. Dhital, X. Chen, Q. Lin, et al., Nature materials 14, 577 (2015).
- Wang and Senthil (2011) F. Wang and T. Senthil, Physical Review Letters 106, 136402 (2011).
- Ahn et al. (2016) G. Ahn, S. Song, T. Hogan, S. Wilson, and S. Moon, Scientific Reports 6, 32632 (2016).
- Hogan et al. (2016a) T. Hogan, R. Dally, M. Upton, J. Clancy, K. Finkelstein, Y.-J. Kim, M. J. Graf, and S. D. Wilson, Physical Review B 94, 100401 (2016a).
- Sala et al. (2015) M. M. Sala, V. Schnells, S. Boseggia, L. Simonelli, A. Al-Zein, J. Vale, L. Paolasini, E. Hunter, R. Perry, D. Prabhakaran, et al., Physical Review B 92, 024405 (2015).
- Ding et al. (2016) Y. Ding, L. Yang, C.-C. Chen, H.-S. Kim, M. J. Han, W. Luo, Z. Feng, M. Upton, D. Casa, J. Kim, et al., Physical review letters 116, 216402 (2016).
- Lu et al. (2017) X. Lu, D. McNally, M. M. Sala, J. Terzic, M. Upton, D. Casa, G. Ingold, G. Cao, and T. Schmitt, Physical Review Letters 118, 027202 (2017).
- Chu et al. (2017) H. Chu, L. Zhao, A. de la Torre, T. Hogan, S. D. Wilson, and D. Hsieh, Nat Mater 16, 200 (2017).
- Dhital et al. (2012) C. Dhital, S. Khadka, Z. Yamani, C. de la Cruz, T. Hogan, S. Disseler, M. Pokharel, K. Lukas, W. Tian, C. Opeil, et al., Physical Review B 86, 100401 (2012).
- Hogan et al. (2016b) T. Hogan, L. Bjaalie, L. Zhao, C. Belvin, X. Wang, C. G. Van de Walle, D. Hsieh, and S. D. Wilson, Physical Review B 93, 134110 (2016b).
- (24) See Supplemental Materials for additional details.
- Zikovsky et al. (2011) J. Zikovsky, P. F. Peterson, X. P. Wang, M. Frost, and C. Hoffmann, Journal of Applied Crystallography 44, 418 (2011).
- Schultz et al. (2014) A. J. Schultz, M. R. V. Jørgensen, X. Wang, R. L. Mikkelson, D. J. Mikkelson, V. E. Lynch, P. F. Peterson, M. L. Green, and C. M. Hoffmann, Journal of Applied Crystallography 47, 915 (2014).
- Schultz et al. (1984) A. J. Schultz, K. Srinivasan, R. G. Teller, J. M. Williams, and C. M. Lukehart, Journal of the American Chemical Society 106, 999 (1984).
- Sheldrick (2008) G. M. Sheldrick, Acta Crystallographica Section A 64, 112 (2008).
- Harter et al. (2015) J. Harter, L. Niu, A. Woss, and D. Hsieh, Optics letters 40, 4671 (2015).
- Cooper et al. (2002) R. I. Cooper, R. O. Gould, S. Parsons, and D. J. Watkin, Journal of applied crystallography 35, 168 (2002).
- Hwang et al. (2013) J. Hwang, J. Son, J. Y. Zhang, A. Janotti, C. G. Van de Walle, and S. Stemmer, Physical Review B 87, 060101 (2013).
- Torchinsky et al. (2015) D. Torchinsky, H. Chu, L. Zhao, N. Perkins, Y. Sizyuk, T. Qi, G. Cao, and D. Hsieh, Physical review letters 114, 096404 (2015).
- Ye et al. (2013) F. Ye, S. Chi, B. C. Chakoumakos, J. A. Fernandez-Baca, T. Qi, and G. Cao, Physical Review B 87, 140406 (2013).
- Dhital et al. (2013) C. Dhital, T. Hogan, Z. Yamani, C. de la Cruz, X. Chen, S. Khadka, Z. Ren, and S. D. Wilson, Physical Review B 87, 144405 (2013).
- Momma and Izumi (2011) K. Momma and F. Izumi, Journal of Applied Crystallography 44, 1272 (2011).