No “Maunder minimum” candidates in M67: mitigating interstellar contamination of chromospheric emission lines
Abstract
The solar analogs of M67 let us glimpse the probable behavior of the Sun on time scales surpassing the duration of human civilization. M67 can serve as a solar proxy because its stars share a similar age and composition with the Sun. Previous surveys of M67 observed that 15% of its Sun-like stars exhibited chromospheric activity levels below solar minimum, which suggest that these stars might be in activity-minimum states analogous to the Maunder Minimum. The activity diagnostic used, the HK index (relative intensities of the Ca ii H & K lines integrated over 1 Å bandpasses), was measured from low-resolution spectra (), as is traditional and suitable for nearby, bright stars. However, for stars beyond the Local Bubble, the interstellar medium (ISM) imprints absorption lines in spectra at Ca ii H & K, which negatively bias activity measurements when these lines fall within the HK index bandpass. I model the ISM clouds in the M67 foreground with high-resolution spectra of blue stragglers and solar analogs. I demonstrate that ISM absorption varies across the cluster and must be accounted for on a star-by-star basis. I then apply the ISM model to a solar spectrum and broaden it to the lower spectral resolution employed by prior surveys. Comparing HK indices measured from ISM-free and ISM-contaminated spectra, I find that all stars observed below solar minimum can be explained by this ISM bias. I conclude that there is no compelling evidence for Maunder minimum candidates in M67 at this time.
1 Introduction
The Sun obviously influences Earth’s climate and habitability, and yet our ability to explore and fully comprehend this Sun–Earth connection is inhibited by the Sun’s dynamic nature over a wide range of time scales. Solar physicists have only been able to study the UV and X-ray emission originating from the Sun’s magnetically heated outer atmosphere over the last 50 years since the advent of space-based observatories. The sunspot record dates back over 400 years to Galileo and has revealed rare events like the Maunder Minimum—the 70 year period (1645–1715) when sunspots rarely formed (for a forceful argument for the reality and importance of the Maunder Minimum, see Eddy, 1976). Measurements of cosmogenic radionuclides from ice core (10Be) and tree ring (14C) samples trace the history of solar activity based on how the heliosphere modulates cosmic rays. These data, corrected for the influence of Earth’s magnetosphere, take our view of the solar dynamo back over 10,000 years (for a review, see Usoskin, 2013), and yet this baseline barely encompasses the birth of human civilization, whereas anatomically modern humans evolved some 195,000 years ago (Fleagle et al., 2005).
To understand how the activity of the contemporary Sun has influenced biological evolution and habitability over the last 500 Myr since the Cambrian explosion, and to properly constrain the frequency and appreciate the potential impact of grand activity maxima and minima, we must look to the stars.
The behaviors of stars that are similar in mass and composition to the Sun (i.e., solar analogs and twins) allow us to use modern astronomical observatories to study the Sun’s likely activity and variability on much longer timescales along with its evolution over cosmic time, and investigate the frequency of aperiodic events like the aforementioned Maunder Minimum. Bright, nearby stars have been surveyed for photospheric and chromospheric variability for decades, for example, by the Mount Wilson Observatory HK Project (Wilson, 1968; Vaughan et al., 1978; Baliunas et al., 1998). The upper chromospheres and transition regions of these bright stars are easily accessible with FUV spectroscopy with HST, while Chandra provides a view of their soft X-ray emitting coronae (e.g., the Sun in Time project, Guinan et al., 2009). However, our ability to relate the rotation, XUV emission, and optical diagnostics of magnetic activity (e.g., Ca ii H & K, H, the Ca IR triplet) to a particular era relevant to Earth’s early biological evolution or the modern day is limited by the large age uncertainties common for individual field stars.
Not only are ages for individual Sun-like stars notoriously difficult to infer (Soderblom, 2010), without reliable parallaxes and metallicities it can even be difficult to establish their evolutionary states (i.e., dwarf vs. subgiant). This challenge plagued the early analyses of the Mount Wilson Observatory HK Project sample, where Baliunas & Jastrow (1990) concluded that approximately one-third of Sun-like stars are in grand minima states analogous to the Maunder Minimum (i.e., “Maunder minima” stars, denoted MM, and where minimum is in lowercase to distinguish these analogous states from the actual solar Maunder Minimum period). Using accurate parallaxes from Hipparcos, Wright (2004) demonstrated that most or all of these MM candidates are in fact old and have evolved off the main sequence, and are therefore not analogous to the Sun.
Benchmark star clusters provide large samples of stars with accurate and precise ages (though limited by the ultimate accuracy of stellar evolution models) and therefore complement the sparse sample of individual nearby stars with well-established ages (e.g., from asteroseismology or differential spectroscopy). Clusters are superb laboratories for exploring the evolution of angular momentum and magnetic activity in cool stars. Their advantage lies in providing a population of stars of the same age and metallicity spanning a wide range of mass, thus allowing some control over the variables involved, while providing opportunities complementary to the studies of individual, nearby stars and solar twins.
-
1.
Typical activity levels can be instantaneously mapped as a function of mass by averaging over the random cycle phases for individual stars in a given mass bin.
-
2.
Estimates for cycle ranges can be derived from the scatter about these averages.
-
3.
The impact of tidally interacting binaries (with stellar or sub-stellar companions) on rotation–activity evolution can be assessed as a function of orbital period.
-
4.
Establishing cluster activity sequences facilitates the identification of outliers potentially existing in grand maxima and minima states. Completing a thorough survey of benchmark clusters with a range of ages would help constrain the frequency of these events over cosmic time.
1.1 M67 As a Solar Benchmark
For cluster-based studies of the modern Sun, M67 stands without rival. M67 is the prototypical old open cluster (Johnson & Sandage, 1955). Its age and composition are nearly indistinguishable from the Sun (Önehag et al., 2011), which led some to question whether M67 was the Sun’s natal cluster. However, Pichardo et al. (2012) concluded that this scenario was unlikely based on a dynamical analysis of the Sun and M67’s motion through a realistic Milky Way gravitational potential. Crucially, the membership and multiplicity of M67 have been carefully determined from over 40 years of radial velocity monitoring (Geller et al., 2015; Latham, 2007).
M67 is thus an excellent target for understanding the magnetic activity of the Sun and Sun-like stars at 4 Gyr. It was surveyed for 75 consecutive days in 2015 with NASA’s re-purposed Kepler mission, K2, during Campaign 5, and rotation periods have already been measured for a few dozen FGK dwarfs (Barnes et al., 2016; Gonzalez, 2016). Regarding chromospheric activity, Baliunas et al. (1995) and Giampapa et al. (2006) utilized the Hydra multiobject spectrograph (Barden & Armandroff, 1995) to measure Ca ii H & K activity indices for 77 solar-type stars on multiple occasions over a six year period. At a distance of 880 pc, the solar analogs of M67 are relatively faint (), which makes obtaining high-resolution optical spectra at high signal-to-noise ratios () for these stars costly. This difficulty is compounded when one attempts to measure the weak chromospheric emission in the deep Ca ii H & K line cores. Giampapa et al. opted for a low-resolution setup for Hydra () so that the chromospheric Ca ii H & K emission could be measured at high enough precision to discern variability over the multi-year survey.
Giampapa et al. (2006) found that 17% of M67’s solar analogs showed average activity levels in deficit of solar minimum. Furthermore, about 7–12% exhibited activity in excess of solar maximum. These observational results empirically suggest that the Sun can likewise enter high- and low-activity states at similar frequencies. In fact, according to the sunspot number over the last 11,000 years that was reconstructed from the radionuclide record, the Sun has operated in grand minima for 17% and in grand maxima for 10% of the modern era (Usoskin, 2013).111Of the 27 grand minima identified in the previous 11,000 years, the duration ranges between 20 and 160 years with a median duration of 60 years. These numbers appear in remarkable agreement with the results from M67. This conclusion has profound implications for understanding the Sun’s past and potential impact on Earth’s climate and habitability.
However, as I discuss in this work, the low-resolution Hydra spectroscopy suffers from two important astrophysical systematic biases. First, at a distance of 880 pc, there is a high likelihood for intervening interstellar gas to form absorption lines near the stellar Ca ii H & K line cores, which would contaminate the chromospheric activity measurements. This problem was recognized by Pace & Pasquini (2004) (see also; Pace et al., 2009), and I develop this further by illustrating the presence of a spatially varying interstellar medium (ISM) and demonstrating how this ISM bias explains the appearance of M67 stars with activity levels below Solar minimum.222Fossati et al. (2017) explore this same ISM bias as an explanation for the appearance of low-activity levels in particular hot Jupiter hosts (e.g., WASP-13). Second, much progress has been made in identifying binaries in the years since Giampapa et al. (2006). Utilizing Geller et al.’s 2015 new membership and binarity catalog, I find that all but one of the stars with activity levels in excess of solar maximum are binaries, which suggests that their angular momentum evolution has been influenced by tidal interaction with a companion, that the line core emission has been enhanced by blending from two sources, or that the primary’s motion relative to the ISM has swept varying amounts of the ISM lines into the HK bandpass over time.
2 The ISM toward M67
Interstellar gas is observable from atomic absorption by Ca ii (H & K at 3968.469 and 3933.663 Å), Na i (D2 at 5889.951 Å, D1 at 5895.924 Å), and K i (7698.964 Å). The equivalent widths of these prominent absorption lines generally correlate with the amount of foreground dust and reddening, as measured from OB stellar (Munari & Zwitter, 1997) and quasar spectra (Poznanski et al., 2012).333While the strength of interstellar absorption lines have been found to generally correlate with visual extinction and reddening, it is not known whether and to what degree these line strengths are sensitive to small differences in and , which trace the line-of-sight dust content, which is different than the gas that produces the ISM lines. Evidence for differential reddening has been presented for NGC 6819 (the 2.5 Gyr Kepler cluster, Platais et al., 2013; Anthony-Twarog et al., 2014). The WIYN Open Cluster Study (WOCS) obtained spectra for these clusters that were used to measure barium abundances to test the AGB mass transfer formation scenario for that cluster’s blue straggler population. The Ba spectral order encompasses Na i D, which means those spectra can be analyzed to search for variable ISM absorption and check for spatial correlation with the differential reddening map suggested by Platais et al. (2013) and Anthony-Twarog et al. (2014).
I use high-resolution optical spectroscopy to identify interstellar clouds in the M67 foreground from Na i D absorption. While this paper is principally concerned with the interstellar contamination of Ca ii H & K activity indices, the stellar Na i D lines are more easily modeled than Ca ii H & K, which facilitates the identification of individual interstellar clouds. After identifying these clouds, I model their Ca ii H & K absorption lines using blue straggler stars (BSS) that effectively backlight the ISM. BSS spectra often have fewer, broadened features compared to Sun-like stars due to their generally hotter effective temperatures and rapid rotation. Therefore, narrow lines due to interstellar clouds and telluric absorption can be isolated, then corrected for in the more complex spectra of Sun-like stars.
2.1 Solar activity spectra and indices
This study requires high-resolution optical spectra of the Sun and a sample of M67 members. For the Sun, I used the Wallace et al. (2011) disk-averaged Solar Flux atlas, and the telluric spectrum derived from disk-center observations taken at different airmasses.444Described at http://diglib.nso.edu/flux and accessible at ftp://vso.nso.edu/pub/Wallace_2011_solar_flux_atlas
The Sun has also been observed regularly at a spectral resolution of since 2006 December (JD 2454072) by the National Solar Observatory’s Synoptic Optical Long-term Investigations of the Sun (SOLIS) facility with the Integrated Sunlight Spectrometer (ISS) on Kitt Peak (Keller et al., 2003). This survey observes important spectral regions, including Ca ii H & K, and the spectra are downloadable from the SOLIS website.555http://solis.nso.edu/iss I apply my ISM model for M67 to these ISS spectra in order to derive a correction to the HK indices from Giampapa et al. (2006).
The SOLIS website also provides tabulated chromospheric H & K indices with 0.001%. measurement errors (procedure described by Bertello et al., 2011), including the 1 Å indices used by Giampapa et al. (2006). However, these measurements are not on the same system as the M67 data. Egeland et al. (2017) describe the various available solar activity data sets and provide equations to transform between the different systems. Giampapa et al. (2006) calibrated their M67 data following Hall & Lockwood (1995) in order to place their HK indices on the same system as the solar activity data from the NSO McMath–Pierce Solar Telescope on Kitt Peak (KP; Livingston et al., 2007)666ftp://vso.nso.edu/cycle_spectra/reduced_data/fd.log2 when scaled by 4.7% to account for differences in spectral resolution. Egeland et al. (2017) derived , and Bertello et al. (2017) give to transform between the NSO Sacramento Peak (SP; Keil & Worden, 1984; Keil et al., 1998) and ISS records.
Ca ii K filtergrams of the Sun dating back to 1907 are available from the Kodaikanal Solar Observatory in India (KKL). Using this record, Bertello et al. (2016) and Bertello et al. (2017) produce a composite solar K index history for the past 110 years. In order to compare the range in solar activity with the M67 distribution, I use the monthly averaged ISS/SP/KKL Ca ii K 1 Å emission index time series,777http://solis.nso.edu/0/iss/composite.dat which is calibrated to the system, then I transform the series to by combining the equations relating to and to , then convert to by applying a linear relationship between and that I derived using the NSO Kitt Peak data set: .888For this linear regression, I used the KP data set from 1976 to 1993, where there is an apparent discontinuity in the ratio between the H and K indices. Finally, I scale this series by 1.047 to account for the difference in spectral resolution, as noted and applied by Giampapa et al. (2006). This procedure yields the monthly average HK value for the Sun from 1907 to the present day that is directly comparable to the HK indices for M67 published by Giampapa et al. (2006). On this system, I find that the Sun ranged from 182 to 219 mÅ, with a median and standard deviation of 193 and 8 mÅ. Using the full ISS/SP record from 1976 to present extends the range from 179 to 226 mÅ.999http://solis.nso.edu/0/iss/sp_iss.dat Giampapa et al. (2006) adopted 225 mÅ as solar maximum using the Kitt Peak series; I will classify M67 members as overactive or underactive as those departing from the solar range of 179 to 226 mÅ, which corresponds to = 0.1586 to 0.1916 and to dex.101010For and , I followed the above equations to convert to , the Egeland et al. (2017) relation to convert to (), and the Noyes et al. (1984) procedure to convert to , adopting for the solar color; (see also the top panel of Figure 4 from Egeland et al., 2017).
2.2 High-resolution optical spectroscopy for M67
For the M67 sample, I use the spectra acquired and analyzed by Pace & Pasquini (2004), including the blue straggler Sanders 1082 (S1082, F131, observed on 2002 March 19 at at Ca ii H & K, and at Na i D), and the solar analogs S746, S1048, and S1255. Each of these solar analogs was observed twice at . While these per-pixel values might seem low, integrating over the 1 Å bandpasses for the H & K indices averaged out the noise to yield measurements of sufficient accuracy for the Pace & Pasquini (2004) analysis. However, modeling the ISM lines in the deep Ca ii H & K line cores requires a higher quality spectrum. I generated this by co-adding the six spectra for the three solar analogs.111111There are actually observations of seven solar-type stars with similar quality spectra from the same program; however, for the purpose of visual comparison to the Solar atlas, I chose to focus on those most similar to the Sun (i.e., K).
I downloaded from the ESO Science Archive121212http://archive.eso.org/wdb/wdb/adp/phase3_main/form the Pace & Pasquini (2004) data (66.D-0457(A), PI Pasquini), which were obtained with the UVES spectrograph at the VLT Kueyen telescope, and which Pace & Pasquini reduced with the UVES pipeline (Ballester et al., 2000). The resolution of the Ca ii H & K spectra are . The reader may refer to Pace & Pasquini (2004) for additional details.
I supplemented the Pace & Pasquini (2004) Ca ii H & K spectra with 91 additional UVES spectra encompassing Na i D for 30 unique M67 members, which were observed in order to measure beryllium abundances needed to study mixing in the stellar interiors of main-sequence FG stars (PI Randich, 69.D-0454(A), 68.D-0491(A), 65.L-0427(A)) and red giants (PI Duncan, 70.D-0421(A)). This sample includes the solar analog S969, , which was observed at on 16 April 2000 as part of 65.L-0427(A).
I also use a spectrum of the M67 blue straggler known as Fagerholm 280 (F280, Sanders 1434, S1434; = 9000 K, = 150 ; Milone et al., 1991), which was acquired with the Tillinghast Reflector Echelle Spectrograph (TRES, 3860–9100 Å; Szentgyorgyi & Furész, 2007) at the Fred Lawrence Whipple Observatory on Mount Hopkins, AZ, and kindly provided by Dave Latham (Harvard–Smithsonian Center for Astrophysics). Gábor Fűrész’s Ph.D. dissertation (2008)131313http://doktori.bibl.u-szeged.hu/1135/ describes TRES, and the reduction procedure is discussed in Lars Buchhave’s Ph.D. dissertation (2010).141414Entitled, “Detecting and Characterizing Transiting Extrasolar Planets” and available as a PDF online at the Niels Bohr Institute.
2.3 Finding the clouds with interstellar sodium
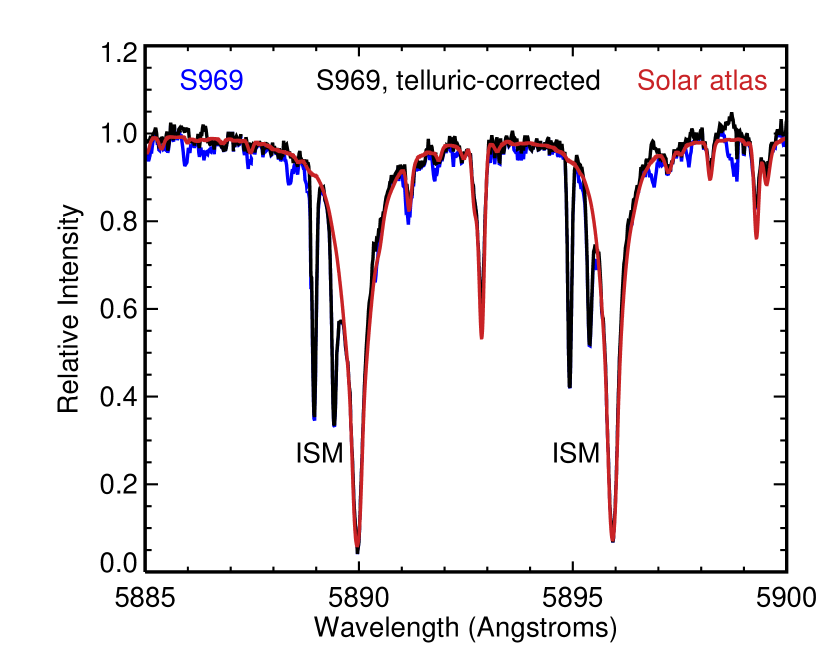
At least three interstellar clouds occupy the foreground space between Earth and M67. This is illustrated in Figure 1, which shows the Na i D spectral region for the solar analog S969 with the Sun’s spectrum overlaid. The solar atlas is a useful comparison because its stellar absorption features approximately match those seen in the S969 spectrum. This comparison highlights the interstellar lines and demonstrates the lack of prominent stellar features overlapping these ISM lines, aside from the wings of Na i D, of course. Note the lack of telluric sodium emission, which demonstrates that the sky subtraction procedure has effectively removed these strong lines.
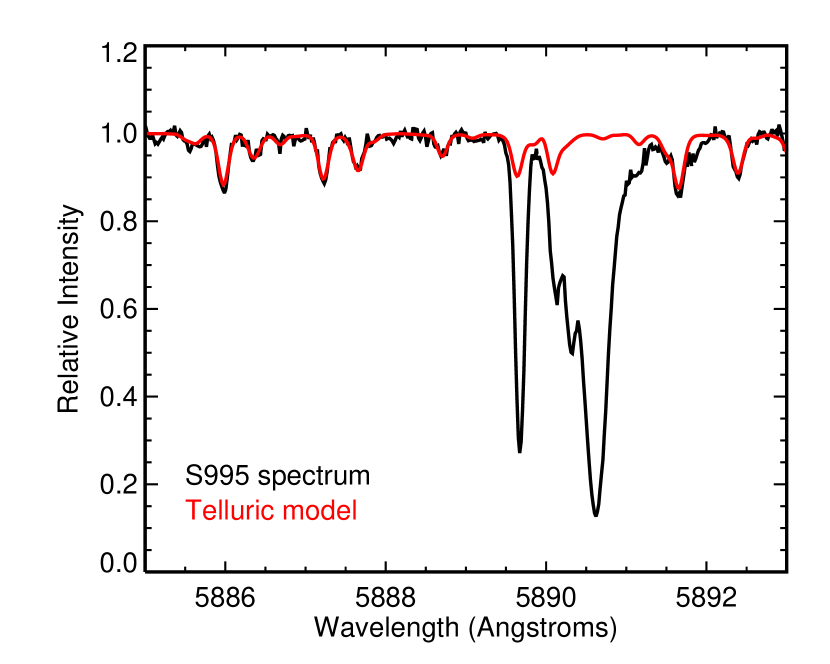
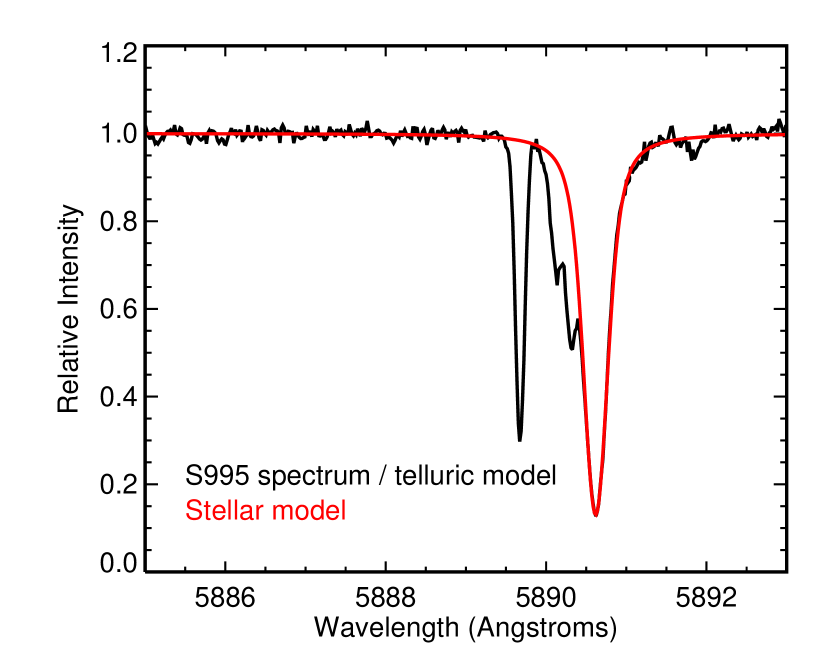
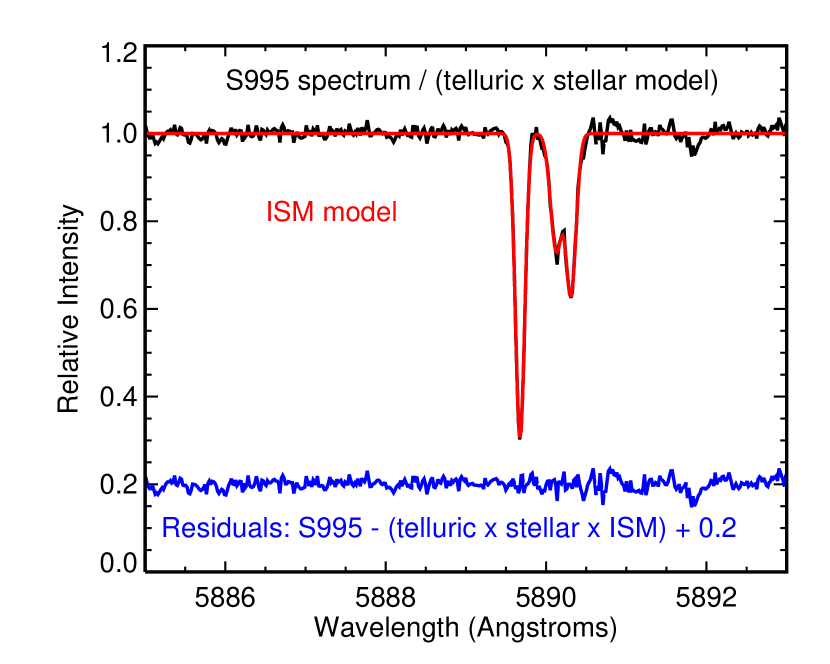
The Na i D spectral region contains numerous telluric absorption lines and proper care must be taken when modeling these features, along with the stellar spectra, in order to isolate the ISM lines. One can approach these issues in a stepwise manner; however, I found it is easier to simultaneously fit the telluric, stellar, and interstellar features, along with a linear normalization. Figure 2 demonstrates the stepwise procedure in order to highlight the relative importance and structure of each component. The top panel plots the observed spectrum of S995 (a single member near the top of the main-sequence turnoff), which has been normalized using the linear correction derived in the simultaneous fit; the red spectrum shows the Wallace et al. (2011) telluric spectrum, which has been scaled by a constant multiplicative factor and smoothed with a Gaussian profile to match the observed telluric line depths and profiles. The middle panel plots the observed spectrum divided by the telluric model, along with a Voigt profile in red that fits the stellar Na i D line. The bottom panel plots the observed spectrum divided by the telluric and stellar models; the interstellar clouds are accurately described by a 3-component Gaussian model shown in red, with the residuals shown in blue and shifted upward by 0.2 in relative intensity for ease of visualization. This spectral region can therefore be described by 17 parameters: the linear normalization (2: slope and intercept), a telluric model (2: broadening and line depth scaling applied to the Wallace et al. 2011 telluric spectrum), a stellar Na i D profile (four-parameter Voigt function, normalization to unity assumed), and a three-component Gaussian for the ISM (nine parameters for the centroid, width, depth for each, where normalization to unity is again assumed). Fitting these 17 parameters simultaneously is straightforward because they are generally independent, where changing one parameter has little effect on other parameters (e.g., the telluric parameters are determined from spectral regions distinct from the stellar and ISM lines; the stellar and interstellar velocities are distinct).
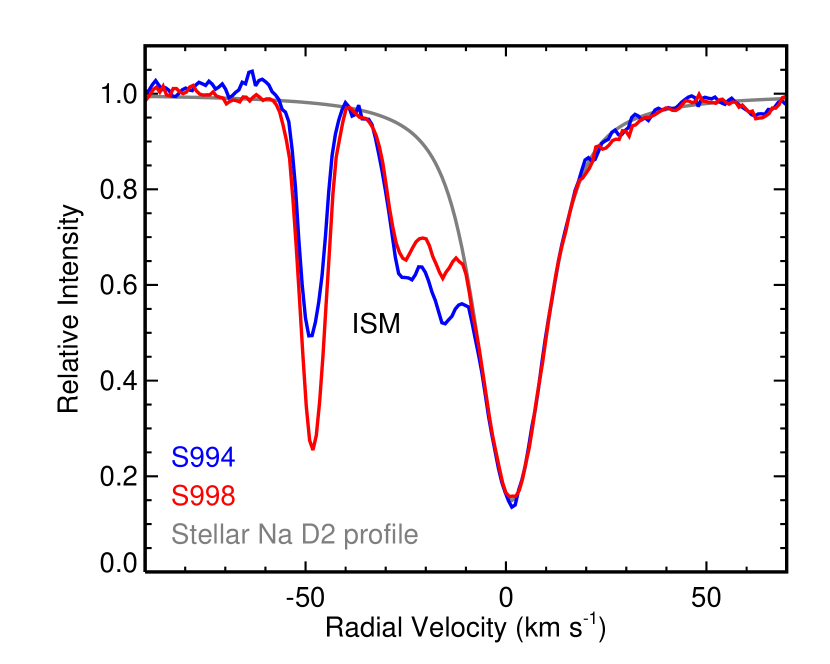
I applied the simultaneous fitting procedure to all 91 UVES Na i D spectra of the 30 unique stars across the cluster, and I see clear evidence for differential ISM absorption. This is readily demonstrated by plotting the spectra for pairs of analogous members (i.e., similar spectral types in different parts of the cluster that were selected according to similar optical colors and magnitudes), for which I provide an example of in Figure 3. Three features are clearly seen toward every star I tested, each of which might be comprised of a single cloud or multiple clouds unresolved at this spectral resolution. The interstellar absorption lines appear to vary in strength from star to star.
2.4 Modeling the clouds with blue stragglers
Although the interstellar Na i D lines can be modeled with the straightforward procedure outlined above, the Ca ii H & K lines are more difficult for most stars. First, it is challenging to obtain high-resolution spectroscopy at sufficiently high for the main-sequence GK dwarfs in M67 or the Kepler clusters (i.e., 1 Gyr NGC 6811 and 2.5 Gyr NGC 6819) due to their large distance moduli. Again, this difficulty is compounded when observing Ca ii H & K, because the chromospheric emission and the contaminating ISM lines are found in the deep line cores.
It can be additionally difficult to model the ISM lines toward GK dwarfs when the relative velocities of the clouds and stellar line core emission are coincident because we cannot know the stellar emission profile a priori in order to model the ISM line. This is why we care to observe these stars, after all! Cluster blue stragglers are useful alternatives because they tend to be hotter and rotate more rapidly than the old, cool GK dwarfs of interest. Rotational broadening in particular can dramatically simplify the Ca ii H & K region, leaving interstellar lines standing in sharp contrast to the few remaining smooth and broad stellar lines.
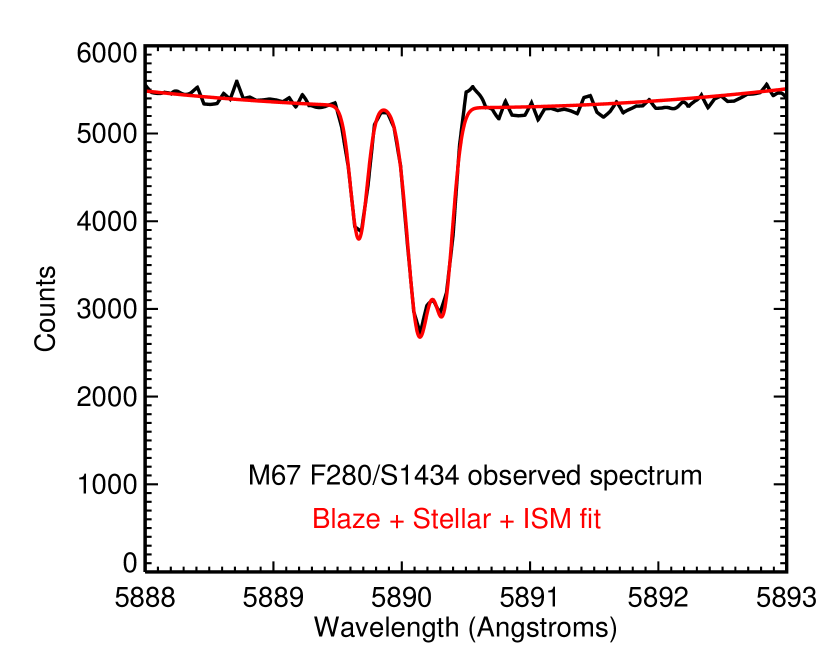
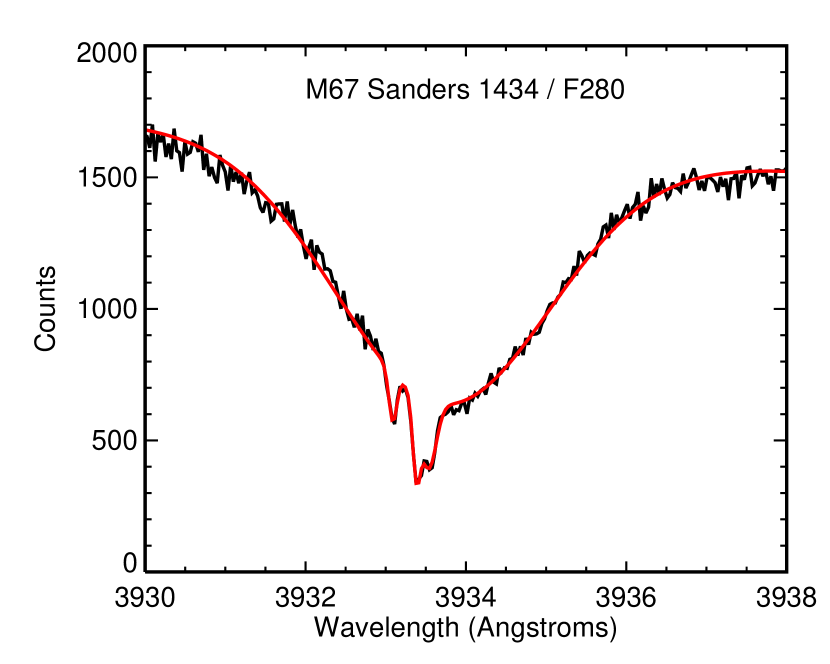
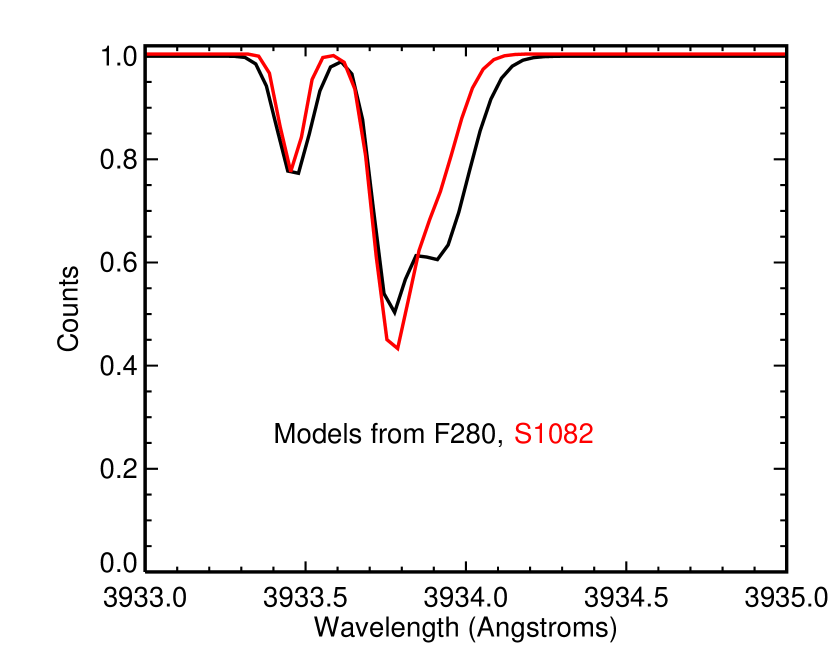
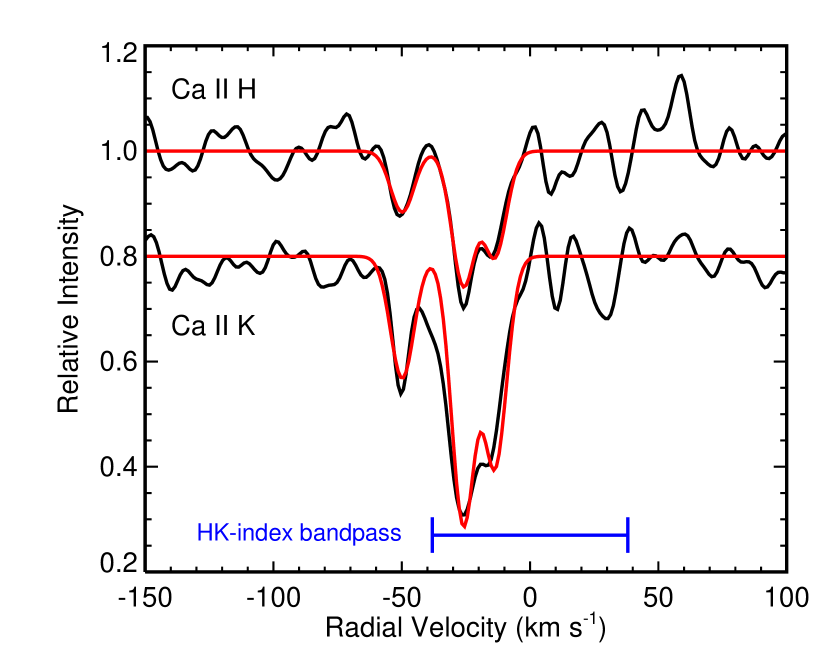
The top panels of Figure 4 show Na i D2 and Ca ii K regions for the M67 blue straggler F280/S1434. For the blue stragglers F280/S1434 and S1082, I fit the Ca ii H & K regions simultaneously with a three-component Gaussian to account for the ISM, with RVs and line depths for each component modeled by the same parameter between H & K; the line depths for Ca ii K are multiplied by two relative to the H lines to account for the difference in strengths between the two lines.151515This is due to the degeneracy of the Ca ii K line transition, which originates from the state, where , while the Ca ii H line is from the state with (page 93 of Tennyson, 2005). The broad stellar H & K lines and blaze functions were fit independently with Gaussians to approximately match the stellar profiles and quadratic polynomials to match the local blaze functions.
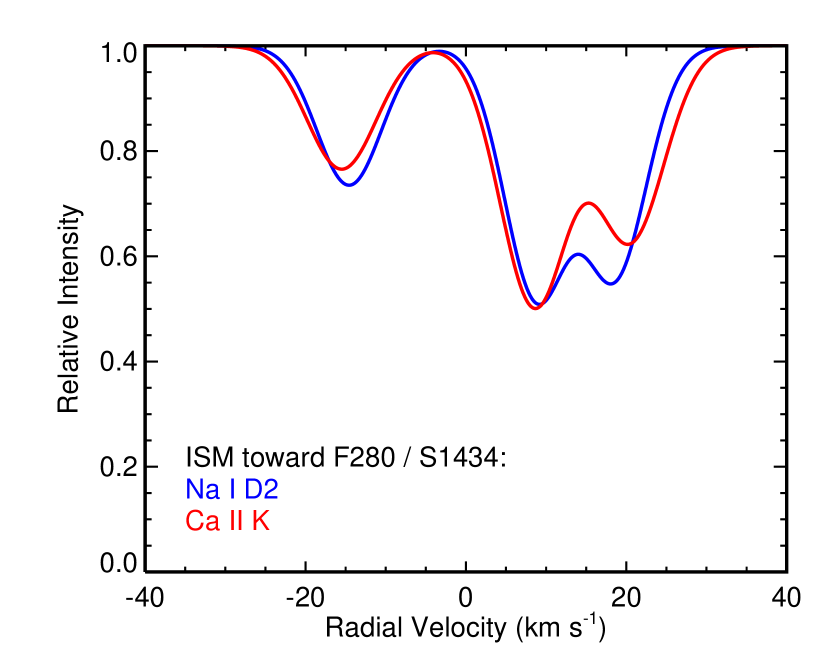
The bottom-left panel overlays the ISM models derived from the Na D and Ca ii H & K spectra. The ISM features at approximately and appear strikingly similar, while the velocities for the cloud are discrepant by 3 . In the future, I will incorporate multiple observations of this star to increase the and improve the quality of the ISM model, hopefully bringing the Ca ii H & K and Na i D ISM models into better agreement.
The bottom-right panel overlays the ISM models for F280/S1434 and S1082. Again, we see non-negligible differences in interstellar absorption between cluster members. Table 1 provides the results of the Gaussian fits for the interstellar features for the blue straggler F280/S1434.
| Sanders ID | Component | RV | Depth |
|---|---|---|---|
| () | |||
| 1434 | 1 | 0.397 | |
| … | 2 | 0.508 | |
| … | 3 | 0.232 |
Note. — (1) Sanders ID (star resolvable with SIMBAD as “Cl* NGC 2682 SAND 1434”), (2) component number, starting with the nearest to Ca ii K at 3933.66 Å, (3) radial velocity of ISM component. To apply the model to Ca ii H, apply these RVs to its rest wavelength at 3968.47 Å (4) line depths for Gaussian models normalized to unity. To compute equivalent widths or generate models, the standard deviation of the Gaussians should be 0.06 Å. The Gaussian widths should be adjusted for different spectral resolutions, and the line depth adjusted accordingly to preserve equivalent width. For Ca ii H, divide the line depths by two.
2.5 Validating the model with M67’s solar analogs
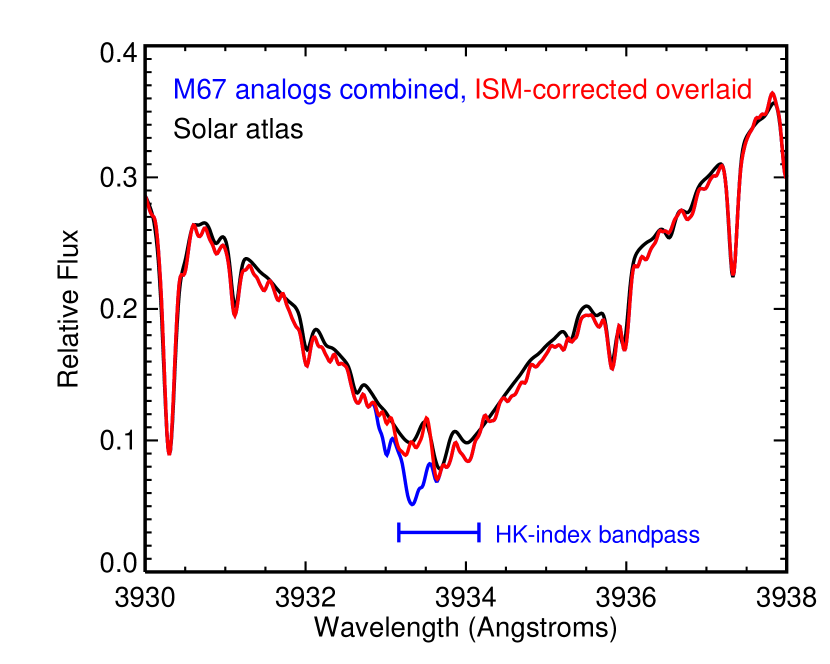
While the of the VLT/UVES Ca ii H & K spectra for each individual solar analog is insufficient for modeling the ISM line (), co-adding six spectra for three single solar analog members (Sanders 746, 1048, 1255) with barycentric motions removed yielded a spectrum of decent quality that (1) revealed the ISM features and (2) averaged the Ca ii H & K line core emissions, effectively averaging over cycle and short-term variability, to produce a Ca ii H & K spectrum of a typical M67 solar analog. It was necessary to select single (i.e., non-binary) stars to preserve the relative RVs of the ISM clouds and stars; this also rejected the overactive binary S1012. The top panel of Figure 5 shows the co-added M67 solar analog spectrum in blue, with the same spectrum divided by the ISM model overlaid in red—the only portion of the original spectrum still remaining is from the ISM, which was apparently well-modeled from the BSS. I also overlaid the solar atlas, which nicely traces each stellar line, and happens to closely match the Ca ii H & K core emission as well. Introducing the ISM correction restores symmetry to the Ca ii K line core profile. Given the close match between the Solar atlas and the M67 co-added spectrum, dividing the two inverts the problem and yields an additional empirical model for the ISM features, which is shown in the bottom panel of Figure 5. The ISM model derived from the blue straggler accurately matches the averaged ISM toward these three solar analogs.
3 Mitigating ISM-contamination for HK
With an accurate ISM model in-hand, I will now calculate the magnitude of the negative bias. When applying this model to individual stars, it is important to account for the barycentric motion for the particular observation, and crucial to adjust the ISM RVs for any additional relative motion between the star and the cluster’s bulk motion; for example, if the system is a spectroscopic binary.
Giampapa et al. (2006) measured chromospheric activity with the HK index, which integrates the emission in 1 Å windows centered on the Ca ii H & K line cores. I refer the reader to that work and references therein for a discussion of spectrum normalization and index calibration (particularly Hall & Lockwood, 1995).
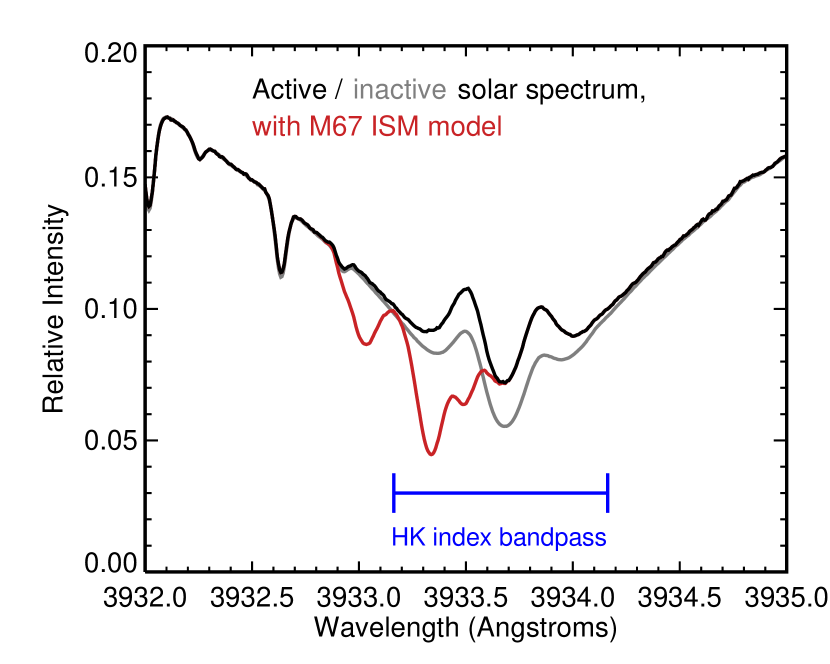
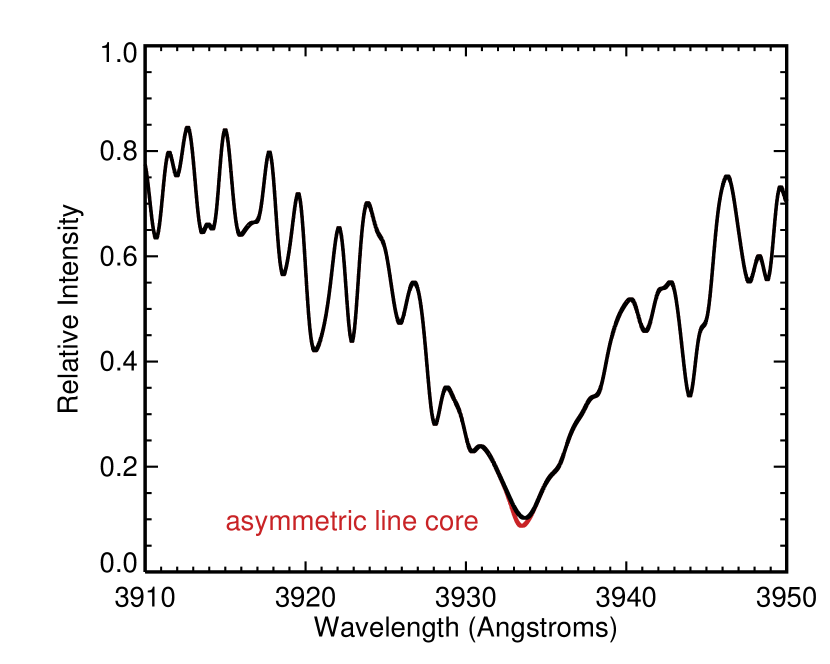
I used the SOLIS/ISS Ca ii H & K spectral library and applied the ISM model derived from the blue straggler F280/S1434 to simulate M67 solar analogs with activity levels spanning the contemporary Sun’s as captured by SOLIS between 2006 December and present. This is illustrated in the top panel of Figure 6. I computed the HK index for both the ISM-contaminated and ISM-free spectra at high resolution. Next, I broadened these spectra with a Gaussian kernel of FWHM = 0.8 Å to approximately match the spectral resolution of the Hydra observations and re-calculated the indices. In units of mÅ and quoting the low-resolution results in parentheses, I find that the ISM model negatively biases the K index by 12.3 (9.7) and the H index by 6.7 (5.3), giving a total correction of 19.1 (14.9).
The bottom panel of Figure 6 shows the Wallace et al. (2011) atlas broadened with the same Gaussian kernel to mimic the Hydra observations. Note the asymmetric line core of the simulated M67 spectrum. This shape is similar, and this figure is analogous, to Figure 2 from Giampapa et al. (2006), which compared the solar spectrum with Sanders 1246, a solar analog. There, it simply appeared that S1246 was less active than the solar epoch (HK = 187 mÅ, compared to the Sun’s 68% range of 188 to 198 mÅ); however, that plot was actually showing an asymmetric line core profile caused by the unresolved presence of interstellar Ca ii.
To derive accurate and precise indices, the ISM model should be applied directly to the Hydra spectra because the correction value is somewhat dependent on spectral type (the Giampapa et al. 2006 sample includes stars with , activity level, and of course, stellar radial velocity.
4 No Maunder minimum candidates in M67
Early efforts to identify MM candidates in the solar neighborhood were informed by the observation of very inactive stars with flat records (e.g., dex; Baliunas & Jastrow, 1990; Henry et al., 1996).161616Converting dex to HK is mÅ on the Giampapa et al. (2006) scale. Since those stars turned out to be subgiants (Wright, 2004), it is important to return to the defining characteristics of Maunder-like grand minima. During the Maunder Minimum, the Sun must certainly have exhibited reduced chromospheric heating and emission relative to the contemporary Sun due to the direct correlation between sunspot number and Ca ii H & K emission observed in the modern era (White & Livingston, 1981). Whether this reduced activity level was on par with the modern solar minimum or if it was in deficit to the minimum is not known (e.g., approaching or equal to the basal photospheric emission that has been measured from solar center-disk observations, described as representing “immaculate photospheres” by Livingston et al., 2007). The 10Be radionuclide record modulated at the 11 year solar cycle period throughout the Maunder Minimum, so apparently the solar magnetic dynamo had not shut down completely (Beer et al., 1998). As Beer et al. (1998) explained, there must have been coronal heating in order to drive the wind that carried the solar fields that would have deflected the Galactic cosmic rays that produced 10Be in Earth’s atmosphere to varying degrees throughout the weakened solar cycle. Whatever magnetic activity persisted probably produced weak HK emission in excess to the center-disk level. Livingston et al. (2007) quote a center-disk HK index of mÅ, or 157 mÅ on the Giampapa et al. (2006) scale.
Identifying MM candidates solely according to their Ca ii emission is challenging because, in addition to not knowing how active the Sun really was during the Maunder Minimum, our activity indices (e.g., ) are not calibrated to account for metallicity (e.g., line blanketing in the pseudo-continuum) and surface gravity. As Hall & Lockwood (2004) and Saar (2006) state, we cannot simply adopt a threshold activity for MM candidates in the field (see also Hall et al., 2009). Instead, Saar & Testa (2012) fitted the lower envelope of activity in the joint Wright et al. (2004)–Valenti & Fischer (2005) dwarf sample as a function of metallicity and identified candidates that fell below this line and exhibited small dispersions (i.e., approximately flat activity).
Judge & Saar (2007) and Saar & Testa (2012) examined the X-ray luminosities and UV emission line fluxes of MM candidates (e.g., Ceti, also known as HD 10700) and found levels similar to the cycle-minimum Sun. If those stars are truly analogous to the Sun during the Maunder Minimum, then this would suggest that the solar chromosphere, transition region, and corona were still magnetically heated even while sunspot production in the photosphere was significantly reduced.
Surveying M67 (and solar twins in the field) addresses the metallicity/HK-calibration issue by focusing on stars with bulk properties (e.g., mass, , , ) very similar to the Sun, since differentially comparing activity indices between the Sun and solar twins will be unaffected by differences in surface gravity and metallicity.171717I believe this strategy of focusing on solar twins in the field and nearby clusters should be pursued in parallel to, not in lieu of, observations of bright, non-solar metallicity FGK dwarfs that were targeted by the Mount Wilson survey or are being monitored with the Solar–Stellar Spectrograph at Lowell Observatory in Flagstaff, Arizona (Hall & Lockwood, 1995, 2004). It is possible that the difference in HK emission during regular cycle minima and the Maunder Minimum might be so subtle as to be indistinguishable, which would make HK a poor or ineffective indicator of “Maunder-hood.” Furthermore, given that the Sun apparently maintained a reduced dynamo cycle throughout the Maunder Minimum (Beer et al., 1998), this places even greater importance on checking the HK histories, albeit limited to a handful of epochs over a period of six years, for evidence of variability typical of a normal solar cycle to rule out “Maunder-hood” for stars with average HK levels near or below solar minimum. Therefore, the two key criteria I adopt for evaluating a star’s “Maunder-hood” in this study are a relatively flat activity record lasting longer than a typical cycle minimum (or perhaps one that transitions into or out of an extended flat state) and chromospheric/coronal emission near or perhaps below the modern solar minimum level.
Again, I will classify M67 members as overactive or underactive as those departing from the solar range of 179 to 226 mÅ. In light of Judge & Saar (2007), I will also consider stars near solar minimum. According to the monthly averaged series, the Sun spent 95% of the past 110 years between 183 and 209 mÅ. Therefore, I will also review the activity time series plots (Figure 9 by Giampapa et al., 2006) for stars within 5 mÅ of solar minimum (i.e., mÅ) to check for variability or a flat record.
4.1 The M67 HK distribution
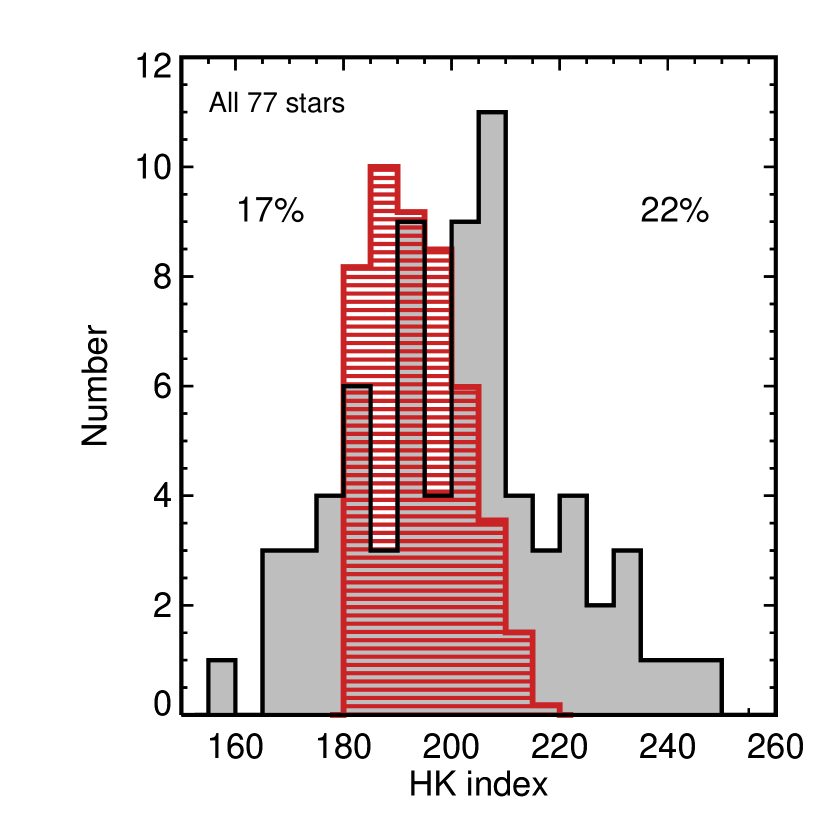
The distribution of HK activity measurements for 77 Sun-like stars from Giampapa et al. (2006), which are plotted in the top-left panel of Figure 7, spans a greater range than experienced by the modern solar cycle. Approximately 17% of the stars showed mean activity levels below solar minimum, and 22% of the stars were in excess of solar maximum. While Giampapa et al. (2006) did investigate the role of binarity using R. D. Mathieu’s membership catalog that was provided via private communication, additional binaries were identified in the intervening 10 years.
Of the 77 stars in the Giampapa et al. (2006) sample, Geller et al. (2015) classifies 50 as single members, 3 as a single non-members, 1 as a binary non-member, 19 as binary members, and 4 as binary likely members. I argue that the four non-members are likely members and will treat them as such for this investigation (here I use RV and binary orbital solution information provided to me by D. Latham):
S753 was classified as a single non-member despite its RV being constant and consistent with membership over 26 years due to a lack of proper motion information. Geller et al. (2015) used proper motions from four sources and required that the majority indicated membership (i.e., ). In this case, three sources provided values—one gave 43%, another 93%, and a final 0%. Geller et al. (2015) happened to place the greatest weight on the source that quoted the 93% probability in cases of a tie; however, there was no tie here. Still, the first source did quote a non-zero probability and the other two sources suggest either definitely or definitely not a member. Perhaps in this case, proper motion should not be used to settle membership. Given the long history of RV consistency, I conclude that S753 is a single member.
S1107 was also classified as a single non-member. D. Latham observed this star 20 times over 6.19 years and measures a mean RV equal to the cluster velocity with rms of 2.2 . The RVs appear to trace a sinusoid, suggesting that this is an SB1 with an approximately 6 year period. I re-classify it as a binary member.
S1203 was classified as a binary non-member. Latham finds that it is an SB1 with a 22.4 day period and a semi-amplitude of 13.9 . Although it satisfies the proper motion criteria (probabilities from three sources are 92%, 97%, and 97%), the center-of-mass RV is 4.5 discrepant, whereas the cluster velocity dispersion is only 0.6 . This could be simply explained by the presence of a long period tertiary. In fact, the RVs only span 3.3 years, which is likely not long enough to detect the acceleration from a third star. I re-classify this as a binary likely member under the assumption that there is (at least) a third star that is responsible for the modest RV offset.
S1246 was classified as a single non-member. Latham’s RVs show a 5 “trend” over 23 years, where the majority of epochs are clustered over a few years and only three points are found at the beginning of the series. While the simple average RV is about 1 too large, this is due to the unequal distribution of observations, whereas a time-weighted average would support cluster membership. I re-classify this star as a binary likely member.
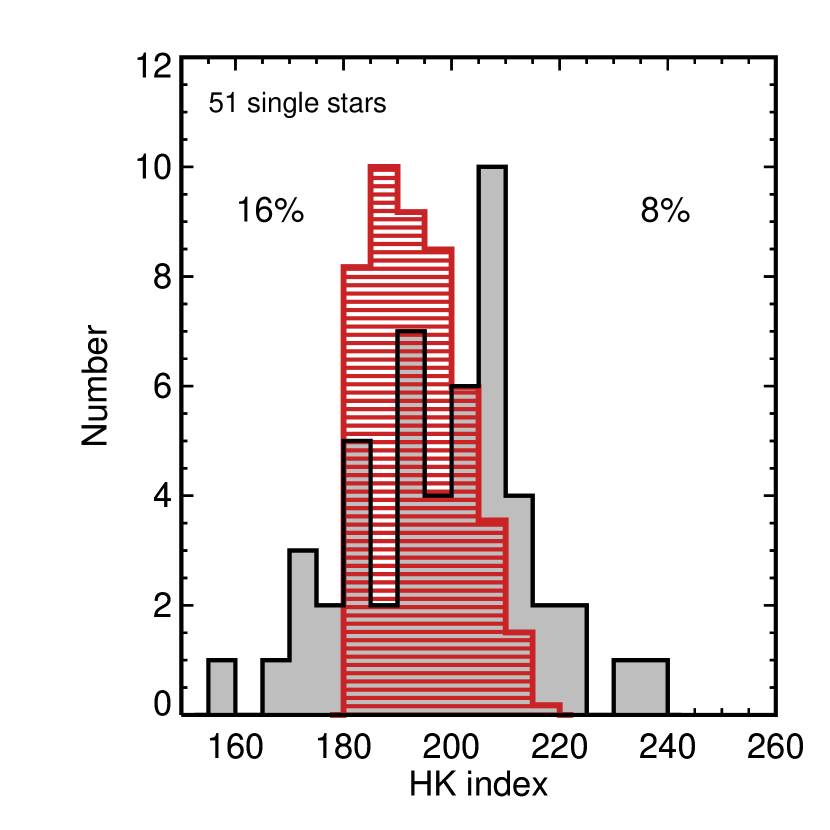
As I have demonstrated, all four non-members in the Giampapa et al. (2006) sample could easily be members, and so I will leave them all in the sample.181818While there is good reason for Geller et al. (2015) to employ their more conservative criteria in order to produce the cleanest membership list unlikely polluted with interlopers, for this work, it is important to check every star we can for signs of excess or deficient activity. Incorporating these stars into this analysis does not alter the conclusions one would reach if they were rejected. Adopting my liberal membership and binarity classifications, I re-plot the HK index distribution for single members in the top-right panel of Figure 7 and find that most of the active stars have been removed from the sample. This decreases the high-activity frequency from 22% to 8% , while dropping the sample size from 77 to 51 stars.
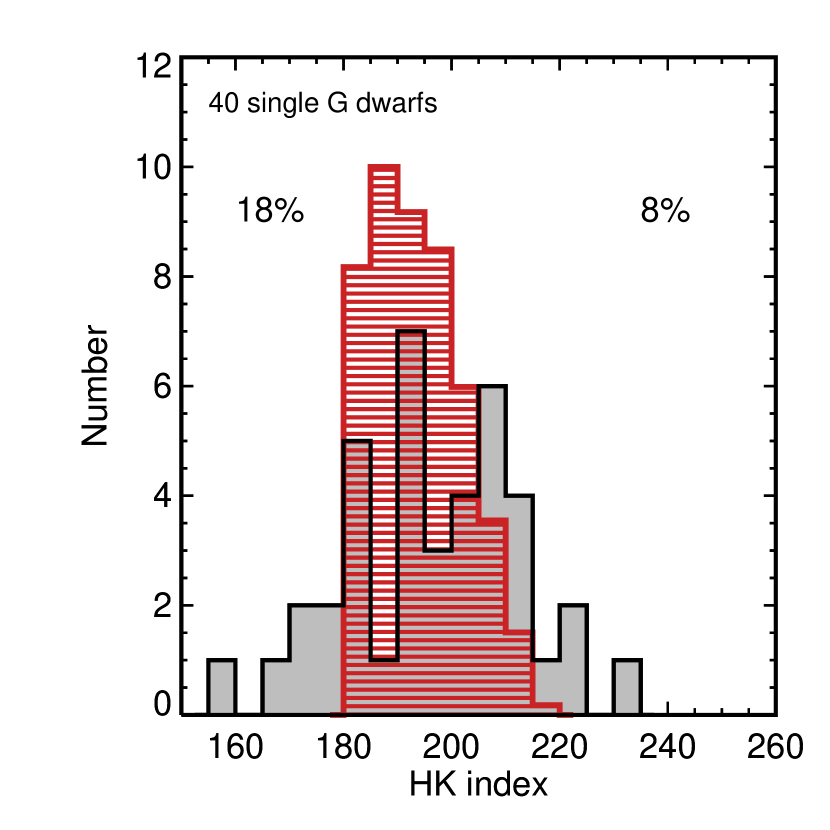
Next, I apply the solar color criteria from Giampapa et al. (2006) in the bottom-left panel to isolate the single solar analogs: . The sample shrank to 40 stars, but the frequencies basically remained unchanged at 18% inactive and 8% active.
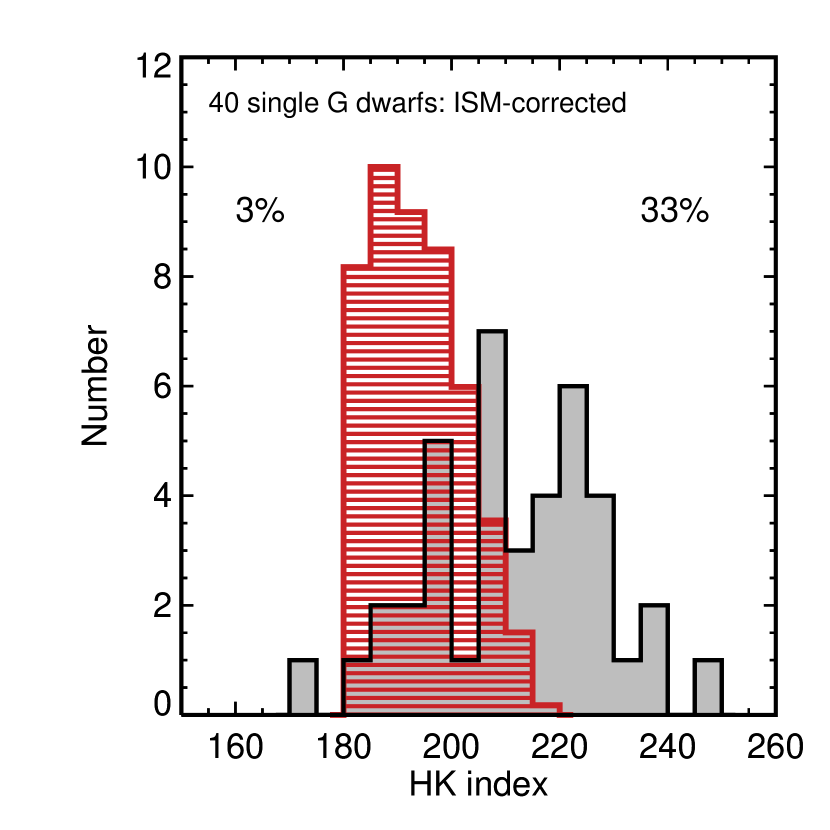
Finally, I apply the 15 mÅ ISM correction to the Giampapa et al. (2006) HK indices for single G dwarfs and re-plot the distribution in the bottom-right panel of Figure 7. Only one star is now found below solar minimum and I will discuss it in Section 4.2. Introducing the correction shifts the lower envelope of the distribution up to solar minimum and raises the sample mean above the solar mean: 204 compared to 194 mÅ. If M67 is in fact 500 Myr younger than the Sun, and if magnetic activity continuously and monotonically decays according to Mamajek & Hillenbrand (2008), then the solar analogs of M67 should be slightly more active on average and, according to this analysis, they are.191919Unfortunately, we do not yet have an activity–age relation that has been adequately calibrated for middle-aged stars: (1) the Sun is the fundamental data point at old age and the calibration of the solar data is still being debated and worked out (whereas Mamajek & Hillenbrand 2008 adopted , Egeland et al. 2017 recently re-calibrated the solar data and derived 0.1694 for the average over Cycles 15 to 24); (2) the M67 data point was measured from ISM-contaminated spectra; (3) there are not yet any other accurate measurements with precise ages older than the Hyades, meaning the activity–age relation is essentially an interpolation across 4 Gyr of stellar, angular momentum, and dynamo evolution. Still, if we employ the Mamajek & Hillenbrand (2008) relationship under the assumption that the Skumanich (1972) relation appears to operate until at least the age of the Sun (Meibom et al., 2015; Barnes et al., 2016; van Saders et al., 2016), then we expect the Sun’s activity at 3.5, 4.0, and 4.5 Gyr to be , and dex, respectively. These differences are small, but discernible. More work is needed to accurately measure the activity of M67’s solar analogs and place them in the context of somewhat younger clusters (e.g., NGC 752 and Ruprecht 147) and older field stars.
With a standard deviation of 15.2 mÅ, the HK distribution of M67’s single solar analogs still appears wide relative to the Sun, but the M67 distribution contains observational errors ranging from 5.6 to 19.7 mÅ, with a mean and standard deviation of 9.5 and 2.9 mÅ. The standard deviation of the solar HK distribution is 8.7 mÅ. Adding the observational error from M67 to the intrinsic width of the solar distribution in quadrature yields 12.9 mÅ, which is still tighter than the M67 distribution. Explanations include but are not limited to (1) perhaps the M67 record better reflects the range of activity the Sun exhibits over longer timescales; (2) perhaps M67’s slightly younger solar analogs exhibit a wider range of activity due to their relative youth; (3) the rotation axes of M67’s stars are randomly distributed relative to our viewpoint on Earth. Knaack et al. (2001) calculated that the active Sun’s S index would appear diminished by 4% if viewed pole-on (or 208 instead of 219 mÅ in HK; see also Figure 6b in Shapiro et al., 2014) The effect is small for an individual star, but does contribute to broadening the distribution. Finally, (4) differential ISM absorption contributes an unknown amount of scatter to the distribution because we are not yet able to correct the bias on a star-by-star basis.
Considering the 21 stars with solar color (), 13 are single and 8 are binaries including two SB2s. Of the binaries, two show RV rms with no orbital solutions and one has a period of 2808 days and a semi-amplitude velocity of 4.5 . I consider these three systems to be well-separated and likely immune to tidal effects that would otherwise influence the activity and rotation of tighter binaries (the remainder have orbital periods of less than 90 days). These include S951 (206 mÅ), S1246 (203 mÅ), and S1462 (209 mÅ), where the values in parentheses are ISM-corrected HK indices, all of which are consistent with the Sun’s range. Adopting these stars into the single-star sample gives 16 stars that are directly comparable to the Sun. All but one exhibit HK values ranging between 184 and 226 mÅ, which nearly encompasses the full solar range (once again, 179 to 226 mÅ).
S785 has solar color with , and is apparently single (RV rms and is on the single-star CMD sequence). However, it has an ISM-corrected HK index of 237 mÅ, with values ranging from 216 to 256 mÅ over three years and four measurements. Why does S785 appear so active relative to the Sun and M67’s solar analogs? Clearly, we need to revisit S785 and acquire new activity data.
4.2 S1473 Is Not a Maunder minimum Candidate
Sanders 1473, , is the sole star with a corrected HK index below solar minimum: HK = 158 mÅ, HKcorr = 173 mÅ. According to Mamajek & Hillenbrand (2008), for this star (conveyed to those authors by M. Giampapa). While Giampapa et al. did not list activity measurements for each epoch, the reader can see from their Figure 9 that S1473 was observed twice (page 457 of Giampapa et al., 2006). From that activity versus time of observation plot for S1473, I estimate by eye HK = 153 mÅ in 1997, and 188 mÅ in 2002. Introducing the ISM correction adjusts these values up to 168 and 203 mÅ. While S1473 appears to have dipped well below the modern solar minimum, it did not remain in an extended minimum, and reached a value typical of the Sun just five years later. S1473 is not an MM candidate because it did not remain in a flat, inactive state.
In addition to S1473, there are four single solar-color stars with relatively low HK emission: S801 (182: 200, 165), S991 (179: 180, 150, 193, 190, 185), S1106 (168: 205, 130, 170), and S1477 (181: 200, 180, 182, 155, 185), where the values in parentheses are uncorrected HK indices and followed by individual epoch measurements estimated by eye from Figure 9 in Giampapa et al. (2006). Even though their average ISM-corrected values are above solar minimum, it is worth looking at the time series to check for flat activity records. In each case, there is at least one medium/high-activity epoch (i.e., mÅ), which challenges their classification as MM candidates. Still, S1106 is intriguing and will be important to revisit with new Ca ii H & K observations. Aside from one high epoch in 1996 (205 mÅ), followed by a very low epoch in 1998 (130 mÅ, which is the lowest single HK measurement of any star observed by Giampapa et al., 2006), it appeared flat for the final four years at mÅ. Adding the 15 mÅ ISM correction brings this to 186 mÅ, only 4 mÅ higher than solar minimum and consistent within measurement error. Given that the median lifetime for solar grand minima inferred from the radionuclide record is 60 years (Usoskin, 2013), we might still be able to catch it in an extended minimum if that is the case, since it would have only begun in 1998, some 18 years ago. Despite this intriguing possibility, it cannot yet be classified as an MM candidate given its high HK epoch in 1996—if not for that first epoch, S1106 would have been an excellent target for follow-up as an MM candidate.
Upon investigating each low-activity star, I conclude that there is no compelling evidence at this time for Maunder minimum candidates in M67.
4.3 Active stars and multiplicity
I already demonstrated that the majority of overactive stars turned out to be binaries according to Geller et al. (2015). A close stellar companion can tidally interact with the primary star and alter its angular momentum evolution (e.g., Meibom & Mathieu, 2005; Meibom et al., 2006). Such stars can remain rapidly rotating and stay active despite their old age. This effect certainly accounts for some of the apparently overactive stars.
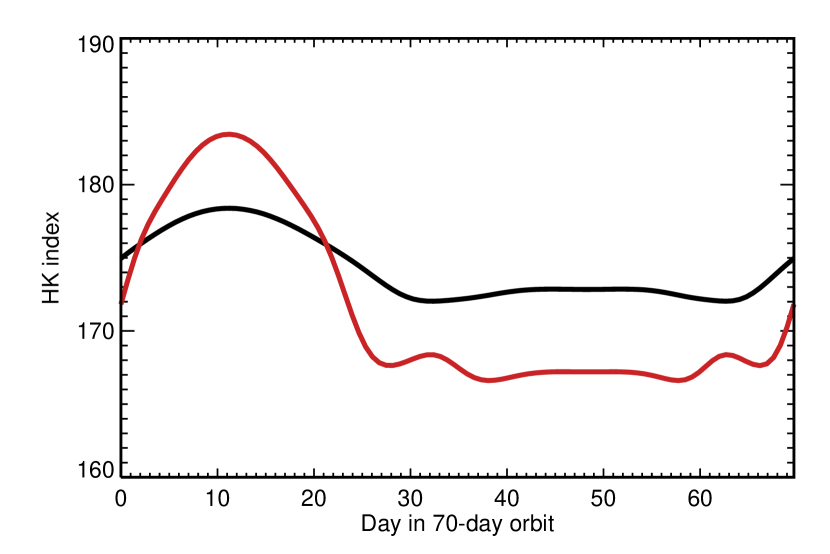
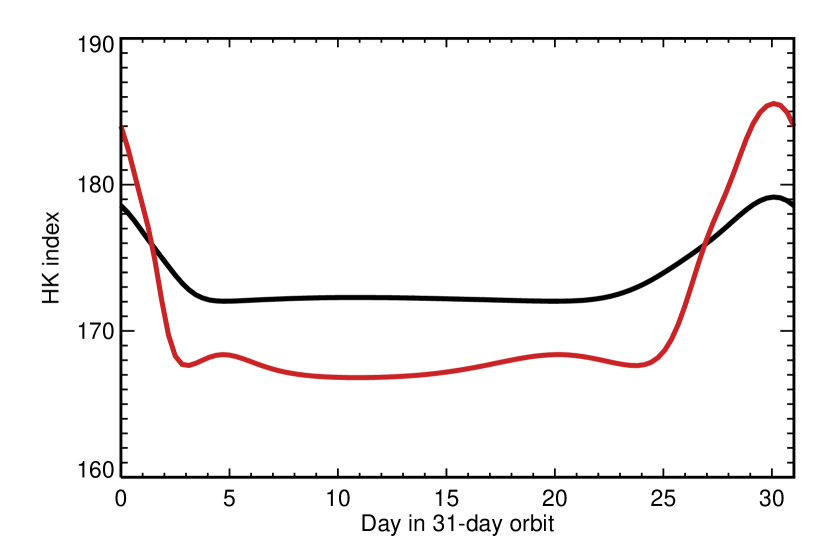
The location of the foreground ISM features near the edge of the HK index bandpass raises a second observational bias issue for binaries. As the primary completes its orbit, the changing relative velocity between the star and the ISM will periodically bring the ISM absorption lines further into and back out of the HK bandpass, artificially diminishing and raising the activity level. This should cause the activity levels of binaries to appear more variable than single stars of similar spectral type. This could explain why certain binaries appeared to be inactive while others appeared to be more active, even though most of these systems do not have short periods where tides are more effective at preventing stellar spin-down.
This issue, which I call the ISM–SB1 effect, is illustrated in Figure 8, which plots model RVs of SB1 members S1247 and S943 generated with RVLIN (Wright & Howard, 2009) from their orbital solutions over the course of their respective orbits,202020Orbital solution information provided by D. Latham. and shows the corresponding HK indices derived from high-resolution and low-resolution solar spectra from SOLIS/ISS with the M67 ISM applied to simulate a cluster solar twin. These panels demonstrate how orbital motion can periodically sweep more or less ISM absorption lines into the HK bandpass. Observing at lower spectral resolution tends to mitigate this effect as the spectral resolution (0.8 Å for Hydra) approaches or exceeds the orbital RV motion (which is in these examples, or Å).


Giampapa et al. (2006) noted that the star S1452, with , was apparently single (i.e., no binary detected from RV variation 2 ), and yet showed an emission core reversal indicative of high activity, with dex (this translates to 200 Myr with the Mamajek & Hillenbrand 2008 activity–age relation). Following the survey, Reiners & Giampapa (2009) pursued observations with the goal of understanding the range of activity levels, and measured for S1452. With rotational broadening approximately double that of the Sun, the rotation period for S1452 should be at least half of the Sun, or 13 days. I downloaded the K2 light curve for this star from the K2SFF dataset on MAST (prepared following Vanderburg & Johnson, 2014; Vanderburg et al., 2016).212121Available for download at https://archive.stsci.edu/missions/hlsp/k2sff/html/c05/ep211410278.html It shows shows clear spot modulation with an amplitude of 1.5% and a period of approximately 4.6 days; the discrepancy between and is probably due to inclination of the stellar rotation axis. Reiners & Giampapa (2009) attributed this higher activity and rapid rotation to a reduced braking efficiency for this star. At the time of those studies, the star was assumed to be single. However, Geller et al. (2015) now report that S1425 as a SB1 member. Latham found an orbital period days, with eccentricity , and RV semi-amplitude (private communication). S1452 appears on the single-star sequence of the M67 CMD, so the companion must have a relatively low luminosity (e.g., white dwarf or M dwarf).
S1452 is reminiscent of a particularly overactive solar twin found in the 3 Gyr Ruprecht 147 cluster that was also observed by K2. Its light curve shows strong spot modulation due to rapid rotation as well as transits indicative of a Jupiter-sized object in a short-period orbit. Eventually, my collaborators and I characterized the system and identified a warm brown dwarf in an eccentric 5 day orbit as the culprit, which we argue is spinning up its host star as its orbit circularizes (Curtis et al., 2016).222222See also Nowak et al. (2017) for an independent discovery and characterization of the system.
So far, no transit has been detected for S1452 from the K2 light curve. Additionally, there is no significant RV scatter about the approximately one year orbit indicative of a brown dwarf; however, the RV surveys to date might not have achieved sufficient precision to tease out a hot Jupiter companion, especially if we happen to enjoy an unfavorable viewing angle. The nature and history of S1452 and its unknown stellar companion continue to defy explanation.
5 Summary
The stars of M67 provide a window into the Sun’s behavior on timescales that greatly surpass the sunspot and radionuclide records. If M67’s age is really 500 Myr younger than the Sun’s, perhaps the cluster’s stars actually reveal the Sun’s magnetic activity during the Cambrian explosion, the period of rapid evolution and proliferation of animal life. Given the impact of magnetic activity on biological evolution, habitability, and climate, the work of Giampapa et al. (2006) and similar studies are absolutely crucial for understanding this important relationship. Furthermore, measuring accurate activity levels as a function of stellar mass, both the mean and variation, is useful for empirically age-dating isolated Sun-like stars. This is especially important for studying exoplanets, their habitability, and for predicting their atmospheric biosignatures based on Earth’s own particular evolution.
Pace & Pasquini (2004) recognized the important contaminating effect of the ISM on chromospheric activity indices. I developed their work further by demonstrating the variability of the ISM across M67, and by explaining the implications of the ISM bias on results of the ground-breaking survey of Giampapa et al. (2006). Using the updated membership and multiplicity catalog of Geller et al. (2015), I find that the majority of the high-activity stars of M67 are actually binaries. By applying an ISM model derived from a cluster blue straggler, I calculated an HK index correction, which I added to the M67 measurements. All but one star now show an activity level on par with or in excess of the solar minimum. I explained that the sole star with a two-epoch activity mean below solar minimum is not a Maunder minimum candidate, because its activity level recovered from a low in 1997 to a value approximately equal to the solar average by 2002. Other single stars with average levels near solar minimum also show at least one single-epoch HK value in line with the solar average.
Due to the uncertainty surrounding the Sun’s behavior during the Maunder Minimum, including the value and variability of the total solar irradiance and chromospheric and coronal emission, I cannot issue a definitive statement on the actual frequency of MM stars in M67 at this time. However, Giampapa et al. (2006) originally suggested that that these stars might be in low-activity states analogous to the MM because of the presence of the sub-solar activity tail of M67’s HK distribution. Given that this is likely not true in light of the ISM correction, there is no longer reason to suggest that these stars are in MM states. The fact that the low-activity stars in the M67 distribution also appear variable in the Giampapa et al. (2006) time series also contradict their classification as MM candidates according to the criteria I adopted in this study. Therefore, I concluded that there is no evidence for stars in Maunder minimum states in M67 at this time.
Applying the ISM correction also shifted the cluster’s average activity upward so that one-third of the sample now exceeds solar maximum. This means that the Sun was possibly more active on average during the Cambrian explosion, though this conclusion requires a more accurate and precise age for M67 relative to the Sun. A recent asteroseismic analysis of the cluster’s red giants observed with K2 determined the age of M67 to be Gyr, which is even younger than the canonical 4 Gyr value (Stello et al., 2016).
In the future, it will be important to map the interstellar Ca ii lines across the cluster so that activity levels for individual stars can be more accurately corrected. I intend to pursue this using the full sample of M67 spectra from VLT UVES, along with TRES spectra of the cluster’s 13 blue stragglers (Latham & Milone, 1996). These ISM models should be applied to the Ca ii H & K spectra directly, to properly account for stellar binarity, spectral type, and activity level.
Acquiring high-resolution spectra at high would provide much needed clarity and would demonstrate whether or not M67’s solar analogs truly are more active than the Sun is, on average, because we would be able to directly compare solar and M67 emission profiles without needing to worry about calibration differences or if our extracted indices are on a consistent system. In particular, I recommend observing the following stars showing low activity (S1473, S1106), high activity (S785) and extreme activity (S1452), in addition to the “well-behaved” solar twins. M67 constitutes a fundamental pillar for stellar and solar astrophysics. As a community, we should value activity surveys of this cluster and ensure that new epochs continue to be gathered.
References
- Anthony-Twarog et al. (2014) Anthony-Twarog, B. J., Deliyannis, C. P., & Twarog, B. A. 2014, AJ, 148, 51
- Baliunas & Jastrow (1990) Baliunas, S., & Jastrow, R. 1990, Nature, 348, 520
- Baliunas et al. (1995) Baliunas, S. L., Donahue, R. A., Soon, W., Gilliland, R., & Soderblom, D. R. 1995, in Bulletin of the American Astronomical Society, Vol. 27, American Astronomical Society Meeting Abstracts #186, 839
- Baliunas et al. (1998) Baliunas, S. L., Donahue, R. A., Soon, W., & Henry, G. W. 1998, in Astronomical Society of the Pacific Conference Series, Vol. 154, Cool Stars, Stellar Systems, and the Sun, ed. R. A. Donahue & J. A. Bookbinder, 153
- Ballester et al. (2000) Ballester, P., Modigliani, A., Boitquin, O., et al. 2000, The Messenger, 101, 31
- Barden & Armandroff (1995) Barden, S. C., & Armandroff, T. 1995, Proc. SPIE, Vol. 2476, Fiber Optics in Astronomical Applications, ed. S. C. Barden, 56–67
- Barnes et al. (2016) Barnes, S. A., Weingrill, J., Fritzewski, D., Strassmeier, K. G., & Platais, I. 2016, ApJ, 823, 16
- Beer et al. (1998) Beer, J., Tobias, S., & Weiss, N. 1998, Sol. Phys., 181, 237
- Bertello et al. (2017) Bertello, L., Marble, A. R., & Pevtsov, A. A. 2017, ArXiv e-prints, arXiv:1702.00838
- Bertello et al. (2011) Bertello, L., Pevtsov, A. A., Harvey, J. W., & Toussaint, R. M. 2011, Sol. Phys., 272, 229
- Bertello et al. (2016) Bertello, L., Pevtsov, A. A., Tlatov, A., & Singh, J. 2016, Asian Journal of Physics, 25, 295
- Curtis et al. (2016) Curtis, J., Vanderburg, A., Montet, B., et al. 2016, in 19th Cambridge Workshop on Cool Stars, Stellar Systems, and the Sun (CS19), 95
- Eddy (1976) Eddy, J. A. 1976, Science, 192, 1189
- Egeland et al. (2017) Egeland, R., Soon, W., Baliunas, S., et al. 2017, ApJ, 835, 25
- Fleagle et al. (2005) Fleagle, J. G., McDougall, I., & Brown, F. H. 2005, Nature, 433, 733
- Fossati et al. (2017) Fossati, L., Marcelja, S. E., Staab, D., et al. 2017, A&A, 601, A104
- Geller et al. (2015) Geller, A. M., Latham, D. W., & Mathieu, R. D. 2015, AJ, 150, 97
- Giampapa et al. (2006) Giampapa, M. S., Hall, J. C., Radick, R. R., & Baliunas, S. L. 2006, ApJ, 651, 444
- Gonzalez (2016) Gonzalez, G. 2016, MNRAS, 459, 1060
- Guinan et al. (2009) Guinan, E. F., Engle, S. G., & Dewarf, L. E. 2009, American Institute of Physics Conference Series, 1135, 244
- Hall et al. (2009) Hall, J. C., Henry, G. W., Lockwood, G. W., Skiff, B. A., & Saar, S. H. 2009, AJ, 138, 312
- Hall & Lockwood (1995) Hall, J. C., & Lockwood, G. W. 1995, ApJ, 438, 404
- Hall & Lockwood (2004) —. 2004, ApJ, 614, 942
- Henry et al. (1996) Henry, T. J., Soderblom, D. R., Donahue, R. A., & Baliunas, S. L. 1996, AJ, 111, 439
- Johnson & Sandage (1955) Johnson, H. L., & Sandage, A. R. 1955, ApJ, 121, 616
- Judge & Saar (2007) Judge, P. G., & Saar, S. H. 2007, ApJ, 663, 643
- Keil et al. (1998) Keil, S. L., Henry, T. W., & Fleck, B. 1998, in Astronomical Society of the Pacific Conference Series, Vol. 140, Synoptic Solar Physics, ed. K. S. Balasubramaniam, J. Harvey, & D. Rabin, 301
- Keil & Worden (1984) Keil, S. L., & Worden, S. P. 1984, ApJ, 276, 766
- Keller et al. (2003) Keller, C. U., Harvey, J. W., & Giampapa, M. S. 2003, Proc. SPIE, 4853, 194
- Knaack et al. (2001) Knaack, R., Fligge, M., Solanki, S. K., & Unruh, Y. C. 2001, A&A, 376, 1080
- Latham (2007) Latham, D. W. 2007, Highlights of Astronomy, 14, 444
- Latham & Milone (1996) Latham, D. W., & Milone, A. A. E. 1996, in Astronomical Society of the Pacific Conference Series, Vol. 90, The Origins, Evolution, and Destinies of Binary Stars in Clusters, ed. E. F. Milone & J.-C. Mermilliod, 385
- Livingston et al. (2007) Livingston, W., Wallace, L., White, O. R., & Giampapa, M. S. 2007, ApJ, 657, 1137
- Mamajek & Hillenbrand (2008) Mamajek, E. E., & Hillenbrand, L. A. 2008, ApJ, 687, 1264
- Meibom et al. (2015) Meibom, S., Barnes, S. A., Platais, I., et al. 2015, Nature, 517, 589
- Meibom & Mathieu (2005) Meibom, S., & Mathieu, R. D. 2005, ApJ, 620, 970
- Meibom et al. (2006) Meibom, S., Mathieu, R. D., & Stassun, K. G. 2006, ApJ, 653, 621
- Milone et al. (1991) Milone, A. A. E., Latham, D. W., Kurucz, R. L., & Morse, J. A. 1991, in Astronomical Society of the Pacific Conference Series, Vol. 13, The Formation and Evolution of Star Clusters, ed. K. Janes, 424–426
- Munari & Zwitter (1997) Munari, U., & Zwitter, T. 1997, A&A, 318, 269
- Nowak et al. (2017) Nowak, G., Palle, E., Gandolfi, D., et al. 2017, AJ, 153, 131
- Noyes et al. (1984) Noyes, R. W., Weiss, N. O., & Vaughan, A. H. 1984, ApJ, 287, 769
- Önehag et al. (2011) Önehag, A., Korn, A., Gustafsson, B., Stempels, E., & Vandenberg, D. A. 2011, A&A, 528, A85
- Pace et al. (2009) Pace, G., Melendez, J., Pasquini, L., et al. 2009, A&A, 499, L9
- Pace & Pasquini (2004) Pace, G., & Pasquini, L. 2004, A&A, 426, 1021
- Pichardo et al. (2012) Pichardo, B., Moreno, E., Allen, C., et al. 2012, AJ, 143, 73
- Platais et al. (2013) Platais, I., Gosnell, N. M., Meibom, S., et al. 2013, AJ, 146, 43
- Poznanski et al. (2012) Poznanski, D., Prochaska, J. X., & Bloom, J. S. 2012, MNRAS, 426, 1465
- Reiners & Giampapa (2009) Reiners, A., & Giampapa, M. S. 2009, ApJ, 707, 852
- Saar (2006) Saar, S. H. 2006, in Bulletin of the American Astronomical Society, Vol. 38, AAS/Solar Physics Division Meeting #37, 240
- Saar & Testa (2012) Saar, S. H., & Testa, P. 2012, in Proceedings of the International Astronomical Union, IAU Symposium, Vol. 286, Comparative Magnetic Minima: Characterizing Quiet Times in the Sun and Stars, ed. C. H. Mandrini & D. F. Webb, 335–345
- Shapiro et al. (2014) Shapiro, A. I., Solanki, S. K., Krivova, N. A., et al. 2014, A&A, 569, A38
- Skumanich (1972) Skumanich, A. 1972, ApJ, 171, 565
- Soderblom (2010) Soderblom, D. R. 2010, ARA&A, 48, 581
- Stello et al. (2016) Stello, D., Vanderburg, A., Casagrande, L., et al. 2016, ApJ, 832, 133
- Szentgyorgyi & Furész (2007) Szentgyorgyi, A. H., & Furész, G. 2007, in Revista Mexicana de Astronomia y Astrofisica Conference Series, Vol. 28, Revista Mexicana de Astronomia y Astrofisica Conference Series, ed. S. Kurtz, 129–133
- Tennyson (2005) Tennyson, J. 2005, Astronomical Spectroscopy: An Introduction to the Atomic and Molecular Physics of Astronomical Spectra, Astronomical Spectroscopy: An Introduction to the Atomic and Molecular Physics of Astronomical Spectra (Imperial College Press). https://books.google.com/books?id=A4BBfuJPqOAC
- Usoskin (2013) Usoskin, I. G. 2013, Living Reviews in Solar Physics, 10, 1
- Valenti & Fischer (2005) Valenti, J. A., & Fischer, D. A. 2005, ApJS, 159, 141
- van Saders et al. (2016) van Saders, J. L., Ceillier, T., Metcalfe, T. S., et al. 2016, Nature, 529, 181
- Vanderburg & Johnson (2014) Vanderburg, A., & Johnson, J. A. 2014, PASP, 126, 948
- Vanderburg et al. (2016) Vanderburg, A., Latham, D. W., Buchhave, L. A., et al. 2016, ApJS, 222, 14
- Vaughan et al. (1978) Vaughan, A. H., Preston, G. W., & Wilson, O. C. 1978, PASP, 90, 267
- Wallace et al. (2011) Wallace, L., Hinkle, K. H., Livingston, W. C., & Davis, S. P. 2011, ApJS, 195, 6
- White & Livingston (1981) White, O. R., & Livingston, W. C. 1981, ApJ, 249, 798
- Wilson (1968) Wilson, O. C. 1968, ApJ, 153, 221
- Wright (2004) Wright, J. T. 2004, AJ, 128, 1273
- Wright & Howard (2009) Wright, J. T., & Howard, A. W. 2009, ApJS, 182, 205
- Wright et al. (2004) Wright, J. T., Marcy, G. W., Butler, R. P., & Vogt, S. S. 2004, ApJS, 152, 261