Multiple Disk Gaps and Rings Generated by a Single Super-Earth
Abstract
We investigate the observational signatures of super-Earths (i.e., Earth-to-Neptune mass planets), the most common type of exoplanet discovered to date, in their natal disks of gas and dust. Combining two-fluid global hydrodynamics simulations with a radiative transfer code, we calculate the distributions of gas and of sub-mm-sized dust in a disk perturbed by a super-Earth, synthesizing images in near-infrared scattered light and the mm-wave thermal continuum for direct comparison with observations. In low viscosity gas (), a super-Earth opens two annular gaps to either side of its orbit by the action of Lindblad torques. This double gap and its associated gas pressure gradients cause dust particles to be dragged by gas into three rings: one ring sandwiched between the two gaps, and two rings located at the gap edges farthest from the planet. Depending on system parameters, additional rings may manifest for a single planet. A double gap located at tens of AUs from a host star in Taurus can be detected in the dust continuum by the Atacama Large Millimeter Array (ALMA) at an angular resolution of after two hours of integration. Ring and gap features persist in a variety of background disk profiles, last for thousands of orbits, and change their relative positions and dimensions depending on the speed and direction of planet migration. Candidate double gaps have been observed by ALMA in systems like HL Tau (D5 and D6) and TW Hya (at 37 and 43 AU); we submit that each double gap is carved by one super-Earth in nearly inviscid gas.
Subject headings:
protoplanetary disks — planets and satellites: formation — circumstellar matter — planet-disk interactions — stars: variables: T Tauri, Herbig Ae/Be — planets and satellites: detection1. Introduction
Practically every star in our Galaxy harbors planets (e.g., Fressin et al., 2013; Burke et al., 2015; Dressing & Charbonneau, 2015). The most common planets discovered so far are “super-Earths,” having radii intermediate between those of Earth and Neptune (for reference, Neptune’s and its mass ).111Planets at the upper end of this size range, , are sometimes called “sub-Neptunes” or “mini-Neptunes”; here we use the term “super-Earth.” The Kepler mission showed that more than half of FGKM dwarfs have super-Earth companions out to orbital periods of 100 days (e.g., Fressin et al., 2013; Dressing & Charbonneau, 2015). These planets generally weigh less than , as determined from transit-timing analyses (e.g., Jontof-Hutter et al., 2014; Wu & Lithwick, 2013) and radial velocity measurements (e.g., Weiss & Marcy, 2014; Marcy et al., 2014; Dumusque et al., 2014; Dressing et al., 2015). Their compositions, as inferred from their bulk densities, span a wide range; some are consistent with pure rock while others have 1–10% of their mass in voluminous H/He envelopes (e.g., Lopez & Fortney, 2014; Rogers, 2015; Lee & Chiang, 2016).
Nearly all such planets are detected orbiting Gyr-old host stars. To better understand how super-Earths form, we need to find them in younger systems, while they are still emerging from their parent circumstellar disks. Unfortunately, the two most prolific planet detection methods, the radial velocity and transit techniques, are not suited to detecting super-Earths in disks. Pre-main-sequence stars tend to be too spectroscopically and photometrically noisy because of magnetic activity and ongoing, time-variable accretion. An exception is provided by K2-33b, an planet discovered transiting a 5–10 Myr old star (David et al., 2016). This object may be a super-Earth that will eventually cool and contract to a radius . Radial velocity measurements of its mass are not, however, strongly constraining (, where is the mass of Jupiter). Another example of a young planet, discovered using radial velocities, is V830 Tau b, but it is a comparatively rare gas giant, not a super-Earth (; Donati et al. 2016). As far as direct imaging goes, gas giants a few dozen Myr old have been detected with high-contrast near-infrared (NIR) adaptive optics systems (Gemini/GPI and VLT/SPHERE): see 51 Eri b (Macintosh et al., 2015) and HD 131399Ab (Wagner et al., 2016). The current detection limit of such instruments is 1 for planets a few Myr old (e.g., Bowler, 2016). Directly imaging super-Earths is still out of reach.
On the other hand, these same NIR adaptive optics technologies, in combination with the Atacama Large Millimeter Array (ALMA), have enabled us to detect structures in disks produced by gravitational interactions with embedded planets, and thus to observe, indirectly, planet formation in action. Scattered light images in the NIR and thermal emission maps at millimeter (mm) wavelengths have achieved angular resolutions less than , corresponding to length scales of a few AUs at the locations of nearby star-forming regions such as Taurus. Disk-planet interactions can produce a variety of structures, depending on the planet mass , the disk scale height , and the disk viscosity as parameterized by , the ratio of the viscous stress to the thermal pressure (Shakura & Sunyaev, 1973). So far, three types of possible planet-induced structures have been possibly detected in disks:
- 1.
- 2.
- 3.
In this paper, we expand upon the first of these disk features, showing how a single planet can actually carve out two gaps to either side of itself, separated by a lane of co-orbital material. This is the signature of a low mass planet in a low viscosity or inviscid disk. By “low mass,” we mean a planet whose mass is less than the thermal mass
| (1) |
where is the host stellar mass and is the planet-star separation. In flared disks, increases with , and by extension so does . Thermal mass planets excite density waves at their Lindblad resonances that are already non-linear (characterized by fractional surface density perturbations ) at launch. Sub-thermal masses—a category to which super-Earths belong—generate weaker waves. By “low viscosity,” we mean that the waves damp less by intrinsic disk viscosity and more by steepening and eventually breaking. Goodman & Rafikov (2001) showed that in an inviscid disk having a two-dimensional (2D) adiabatic index , waves launched to either side of the planet’s orbit travel a radial distance
| (2) |
before shocking and dissipating (see also Rafikov, 2002a). For planets with – (i.e., – with ), we have –. Where the waves break, they deposit the angular momentum they carry to disk gas. As a result, material is repelled away from the planet to form two gaps, at radial separations from the planet’s orbit. Numerical simulations confirm this “double gap” feature in inviscid disks (see, e.g., Fig. 2 in Dong et al. 2011a or Fig. 8 in Duffell & MacFadyen 2012; see also Li et al. 2009; Muto et al. 2010; Dong et al. 2011b; Zhu et al. 2013).
The double gaps are expected to be shallow. From the numerical fitting formula of Fung et al. (2014; see also Duffell & MacFadyen 2013; Kanagawa et al. 2015; Duffell 2015), a super-Earth of mass orbiting a star opens a gap having a surface density contrast of
| (3) |
where is the surface density inside the gap and is the unperturbed value. The above formula is known to break down as because hydrodynamic instabilities substitute for viscous diffusion in filling up disk gaps; simulations by Fung & Chiang (2017) show that super-Earths open gaps with when and .
Although gas surface density contrasts generated by super-Earths may be modest, aerodynamic interactions between gas and dust can produce higher contrast features in dust (e.g., Rice et al., 2006; Pinilla et al., 2012b). In particular, the edges of planet-opened gaps are regions of high gas pressure, and dust particles drift toward such regions and collect into overdense rings (e.g., Paardekooper & Mellema, 2004, 2006; Zhu et al., 2012; Pinilla et al., 2012a). Dust rings have been detected (e.g., Zhang et al., 2014; Hashimoto et al., 2015; van der Marel et al., 2015; Dong et al., 2017).
In this paper, by combining global 2D two-fluid (gas+dust) hydrodynamical simulations with a radiative transfer code, we study how super-Earths produce characteristic double-gap patterns in mm-sized dust particles in nearly inviscid () disks. Such structures should be readily detectable in ALMA dust continuum observations of disks 140 pc away with 0 angular resolution. We will introduce our simulations in Section 2, present results in Section 3, and summarize and discuss in Section 4.
2. Simulations
We calculate the dust and gas distributions in a disk perturbed by a planet using global 2D (radial-azimuthal) hydrodynamics simulations with the LA-COMPASS code (Li et al. 2005, 2009; Fu et al. 2014; Section 2.1). Hydro models are post-processed using the Whitney et al. (2013) Monte Carlo radiative transfer (MCRT) code to produce synthetic images at various wavelengths (Section 2.2).
2.1. Hydrodynamics Simulations
The simulation setup is largely adopted from Fu et al. (2014) and Miranda et al. (2016), and is briefly summarized here. Dust is treated as a pressureless fluid (e.g., Takeuchi & Lin, 2002). An -viscosity is added to the gas dynamics, which introduces an additional diffusion term in the dust continuity equation (see Eqn. 28 in Takeuchi & Lin, 2002). We do not model turbulent mixing. An axisymmetric 2D global disk is initialized in cylindrical coordinates () with a gas surface density
| (4) |
where is the global radial power law index ranging from 0 to 1.5, and AU is the orbital radius of the planet. The planet’s orbit is coplanar with the disk, circular, and fixed in time for our default simulations; in Section 3.5, we experiment with prescriptions for radial migration. The planet mass ramps up with time as over . Our default setting is orbits; in Section 3.1.4, we experiment with and 3000 orbits. The size of the simulation domain is 2 in and 0.1–2.1 in (3–64 AU). At the end of the hydro simulations, before MCRT post-processing, the inner disk within twice the inner boundary is manually removed to avoid possible boundary condition artifacts. Most models take , for which the initial gas mass is about within 60 AU. The gas surface density and velocity are fixed at their initial values at both the inner and outer boundaries.
The equation of state of the gas is locally isothermal. The scale height of the gas disk is taken as
| (5) |
the disk is flared. The central star is in mass, and the thermal mass at is (Eqn. 1). The gas has a kinematic viscosity (Shakura & Sunyaev, 1973) with constant and equal to the Keplerian angular velocity. We experiment with between and .
Dust particles with size are treated as a second fluid in the hydro simulation. The Stokes number St (momentum stopping time normalized to the dynamical time) of dust particles in the Epstein regime is
| (6) |
where is the internal density of a dust particle. At and , for g cm-3 and mm (“big dust”; see Section 2.2). The two-fluid hydrodynamic equations describing the coupled evolution of gas and dust are solved in LA-COMPASS including both aerodynamic drag on dust, and dust back-reaction on gas. The big dust particles are initialized with a surface density linearly proportional to the gas, . An outflow inner boundary condition and an inflow outer boundary condition are imposed on the dust.
2.2. Radiative Transfer Simulations and Synthetic Observations
We follow the procedures described in Dong et al. (2015) to translate the hydro disk models to synthetic observations. The main steps are summarized here. Light from the central star is scattered and absorbed by “small dust” particles at the disk surface. The small dust is assumed to resemble sub-m-sized, interstellar medium (ISM) dust in its optical properties (Kim et al. 1994; see Fig. 2 in Dong et al. 2012). Because of their short stopping times, small dust grains are assumed to be always well mixed with gas at a mass fraction of 0.5%. Big dust particles, having sizes mm as in the hydro simulations, are assumed to have settled to the disk midplane (e.g., Dullemond & Dominik, 2004; Birnstiel et al., 2010). Initially in the hydro simulations, the big-to-small-dust mass ratio is 1:1, so that the initial total-dust-to-gas mass ratio is 1:100; at the end of the hydro simulation, the big-dust-to-gas ratio in a given gas parcel has evolved because of drag forces. The optical properties of the big dust are calculated using the Bohren & Huffman (1983) Mie routine,222The B. T. Draine version, https://www.astro.princeton.edu/draine/scattering.html, wrapped into a Python package by T. Robitaille, https://github.com/hyperion-rt/bhmie. assuming an ISM composition. The Whitney MCRT code calculates the equilibrium temperature of all dust particles using iterative methods (Lucy, 1999).
We assume the central source is a luminous blackbody sphere of radius and K, appropriate for a 1 star at 1 Myr (Baraffe et al., 1998). We manually fill the inner disk by using the initial surface density profile (Eqn. 4) to extrapolate surface densities inward from . The hydro simulations are 2D and yield only the surface densities and ; these are made into 3D density fields for use in the MCRT calculations by puffing them up assuming Gaussian profiles in the vertical direction :
| (7) | ||||
| (8) |
where is set equal to the gas scale height (Eqn. 5), and to mimic dust settling, as in Miranda et al. (2016).
We produce both -band polarized intensity scattered light images and ALMA band 7 (870 ; 345 GHz; 7.5 GHz bandwidth) continuum observations, assuming the disk is 140 pc away at Dec=+25∘ (e.g, Taurus). Unless otherwise noted, we assume 4 hours of integration time for simulated ALMA observations. For -band images, we take an inner working angle of (10 AU) and convolve the raw MCRT products with a Gaussian point spread function (PSF) having a full-width-half-maximum of (6 AU) to simulate the performances of VLT/SPHERE and Gemini/GPI. For mm dust continuum observations, we transform the raw MCRT products to simulated ALMA observations using the simobserve and simanalyze tools in Common Astronomy Software Applications (CASA). A full array of 50 12-m antennas is used. We mostly use the array configuration alma.out24.cfg,333https://casaguides.nrao.edu/index.php?title=Antenna_Configurations_Models_in_CASA. achieving a beam size of with the major axis of the beam in the north-south direction (by comparison, the smallest beam achievable for a Taurus target at 345 GHz with the full ALMA array is with configuration alma.out28). Simulated ALMA observations are corrupted by thermal noise assuming the default atmospheric model with 0.9 mm precipitable water vapor ( octile). Four hours of integration reaches a root-mean-squared (RMS) sensitivity of 13 Jy beam-1 using the ALMA sensitivity calculator.444https://almascience.eso.org/proposing/sensitivity-calculator Throughout the paper, we use a gray color scheme for surface density, a blue-hot color scheme in the -band, and a red-hot color scheme for ALMA images. All scattered light images are for face-on disks, while for ALMA images we experiment with non-zero disk inclinations.
3. Results
After presenting a fiducial model that illustrates the basic observable disk features produced by a super-Earth (Section 3.1), we then explore how these features vary with planet mass (Section 3.2), disk viscosity (Section 3.3), background surface density profile (Section 3.4), and orbital migration of the planet (Section 3.5).
3.1. A 10- Super-Earth at 30 AU
We use model 10ME (see Table 1) to showcase the basic disk features produced by a super-Earth in a low viscosity environment.
3.1.1 Surface Density Distributions
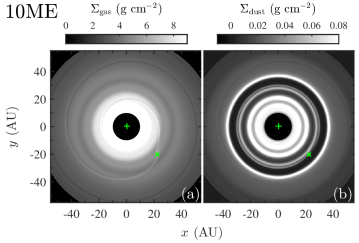
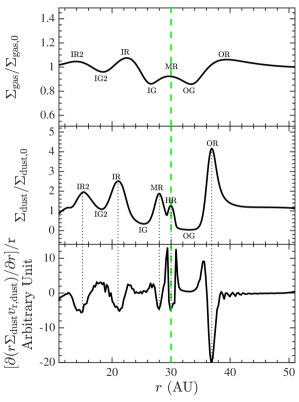
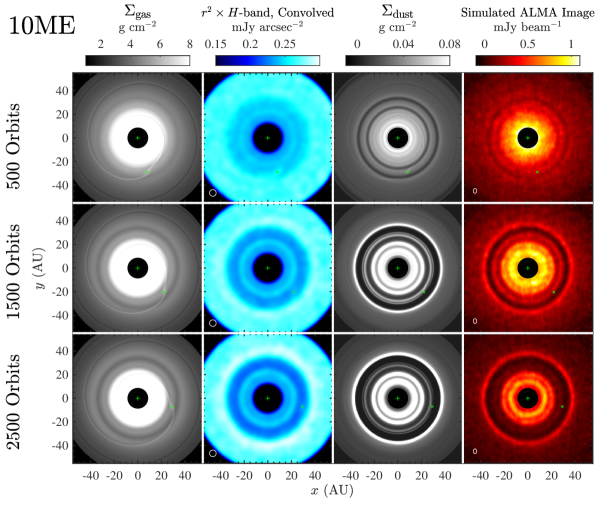
Figure 1 shows the surface density maps of the gas and of the -mm-sized big dust, as well as their azimuthally averaged radial profiles. Henceforth, for convenience, we sometimes omit “big” when referring to “big dust.” In the gas, the 10- super-Earth gradually opens two narrow gaps about away from its orbit, as predicted by Rafikov (2002b) in this nearly inviscid environment. The gas in the coorbital region is less depleted than in the two gaps, and forms an annular ring. We identify six features in the gas radial profile: apart from the IG (inner gap), OG (outer gap), and MR (middle ring), we observe an IR (inner ring), an OR (outer ring), an IR2 (inner ring 2), and an IG2 (inner gap 2). The gas originally in the gap regions is pushed away and piled up at the gap edges to form the IR and OR. Because of the low viscosity, viscous diffusion is unable to smooth away the two rings at the time shown ( orbits). These structures in the gas surface density have been seen in previous hydro simulations of low mass planets in low viscosity disks (see, e.g., Figure 2 of Li et al. 2009, Figure 14 of Muto et al. 2010, and Figure 8 of Duffell & MacFadyen 2012). The IR2 feature (and an accompanying annular gas depletion IG2) has been seen in simulations with inner boundaries smaller than 0.4 (see, e.g., Figure 2 of Li et al. 2009, Figure 9 of Yu et al. 2010, and Figure 1 of Zhu et al. 2013).
Dust drifts relative to gas. In a 2D disk, ignoring azimuthal gradients and a small diffusion term, the continuity equation for the dust reads
| (9) |
where
| (10) |
is the radial drift velocity of dust, is gas pressure, and is the dust stopping time. Dust will pile up at locations where the second term in (9) is most negative. This term is plotted at the bottom of Figure 1. In total, 5 local minima can be identified, each corresponding to a dust concentration. The big-dust-to-gas mass ratio, initially equal to 0.5% everywhere, increases at the locations of dust rings by factors of up to 4. The horseshoe dust ring HR (seen before in, e.g., Figure 4 of Zhu et al. 2014) has no obvious counterpart in and is caused by a different mechanism — 1:1 gravitational resonant interaction with the planet.
The dust rings are not necessarily located at the positions of low-order mean motion resonances relative to each other, although they may appear to be close to resonances by chance. The locations of the rings can change with planet mass, background disk profile, or planet migration, as will be seen later.
The behavior of dust in a disk with a sub-Jupiter mass planet has been investigated by many others (e.g., Paardekooper & Mellema, 2004, 2006; Lyra et al., 2009; Zhu et al., 2014; Rosotti et al., 2016) using two-fluid simulations. Our results generally agree with these works in the low and low limit (see, e.g., the multiple gaps and rings in the 0.05 model in Figure 8 of Paardekooper & Mellema 2006, and the 8 model in Figure 4 of Zhu et al. 2014). Note that our 10 planet is not massive enough to trap dust effectively at its 2:1 resonance at , by contrast to the higher mass planet considered by Paardekooper & Mellema (2004, 2006).
Our planet excites density waves both inside and outside its orbit. The pressure structures in the density waves are not able to concentrate dust particles via dust-gas coupling because the waves corotate with the planet and not with the local disk. Dust particles only spend a small fraction of time inside the pressure overdensities associated with waves. By contrast, density waves excited by gravitational instability do rotate at approximately the local Keplerian velocity and are able to concentrate particles of certain sizes (Rice et al., 2004).
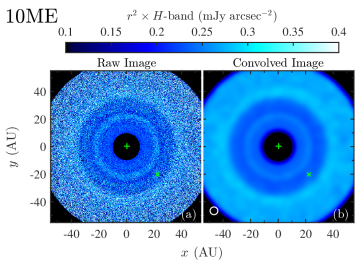
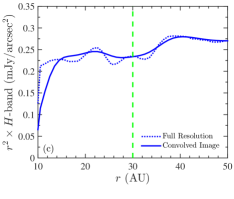
3.1.2 Synthetic Observations and Detectability
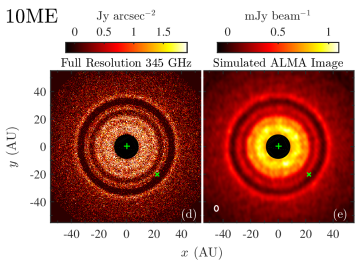
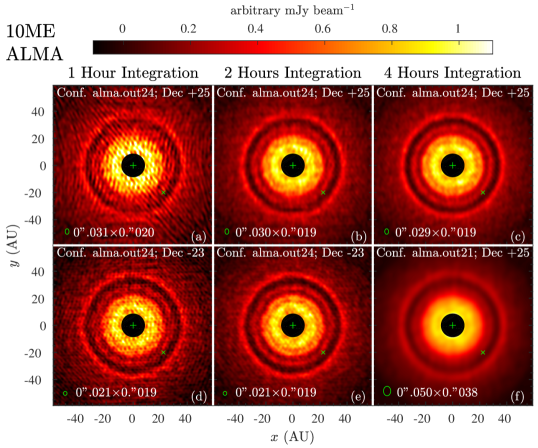
Figure 2 shows simulated -band polarized intensity and ALMA Band 7 images. At -band, the depletion of the gas (and thus of the entrained small dust) in the two gaps results in two shallow gaps in the full resolution image. After PSF convolution, however, the two gaps merge to form an apparent single gap. Depending on the noise level and the absolute brightness of the disk, such a shallow gap may or may not be detectable in a real system. In the full resolution mm dust continuum image, four dust rings can be distinguished: IR2, IR, OR, and a merged MR+HR. The simulated ALMA observation recovers nearly 100% of the total flux, and generally preserves the main features of the radial profile. In particular, in both the image and the radial profile, the signature of a super-Earth in a low viscosity disk — a pair of gaps (a “double gap”) separating three rings — is distinctive.
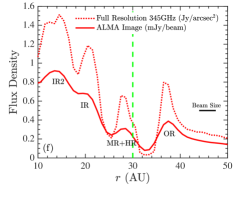
Figure 3 illustrates the detectability of gaps and rings under various observational conditions using ALMA. Assuming the disk is at Taurus (dec. ) and using array configuration alma.out24.cfg (angular resolution ), the distinctive double-gap feature can be clearly resolved in 2 hours of integration time (panel (b); RMS noise level 18 Jy beam-1; S/N22 at the OR), and is marginally detectable with 1 hour of integration time (panel (a)). With 4 hours of integration (panel (c)) all 4 rings can be detected with S/N20 (although the separation of IR2 and IR is marginal). If the object is in the southern sky (dec. , panels (d)–(e)), the double-gap feature is more easily resolved because of better uv coverage. For array configuration alma.out21.cfg which yields a coarser angular resolution of , the double-gap structure becomes difficult to discern (panel (f)).
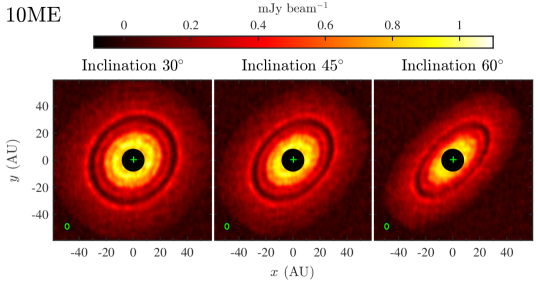
Figure 4 shows the morphology of the rings and gaps in ALMA observations at various disk inclinations. In all cases shown, the disk has a position angle of , in between the directions of the major and minor axes of the beam. At disk inclination, the structures in the disk can still be detected, particularly the double gap; at inclination, structures along the minor axis of the disk threaten to be lost, while rings and gaps can still be seen along the major axis.
Our hydro simulations are 2D and are thus not suitable for simulating the appearance of density waves in scattered light, as these waves have substantive vertical motions (Zhu et al., 2015). However, as judged from the 3D hydro and radiative transfer simulations of Dong & Fung (2017a), the density waves excited by low mass planets seem generally too weak to be detected by current NIR imaging facilities.
3.1.3 Time Dependence
Figure 5 shows the time evolution of the disk (azimuthally averaged radial profiles are shown in the last column of Figure 8). The observational signatures noted above are transient; in particular, the central ring (MR+HR) seen in the mm continuum gradually diffuses, merging the two gaps into one and eventually killing the signature of a double gap. Nevertheless, the double-gap feature can still last long enough to be detectable, about 2000 orbits (0.3 Myr for AU) for the model shown.
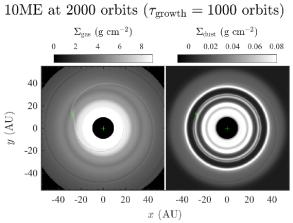
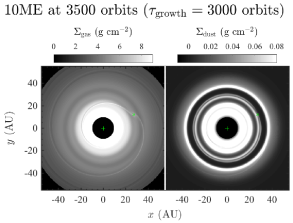
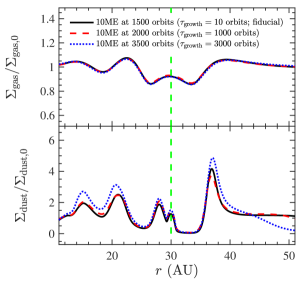
3.1.4 Lengthening the Planet Growth Timescale
In this section, we explore the effect of lengthening the planet growth timescale. Figure 6 compares our fiducial model 10ME (= orbits) at 1500 orbits, with two other models having and 3000 orbits, sampled at 2000 and 3500 orbits, respectively. The three models show similar surface density profiles in both gas and dust. Growing the planet in a few thousand orbits does not materially affect the multiple rings and gaps ultimately produced by the planet.555Hammer et al. (2017) found that more slowly growing planets trigger weaker vortices at gap edges.
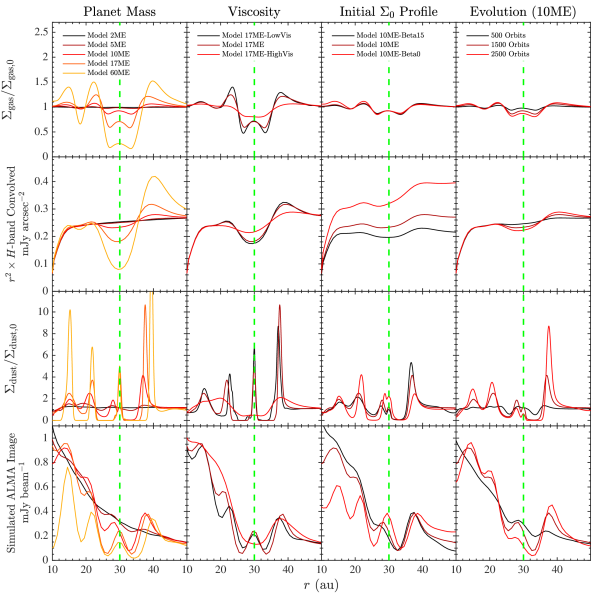
3.2. Dependence on Planet Mass
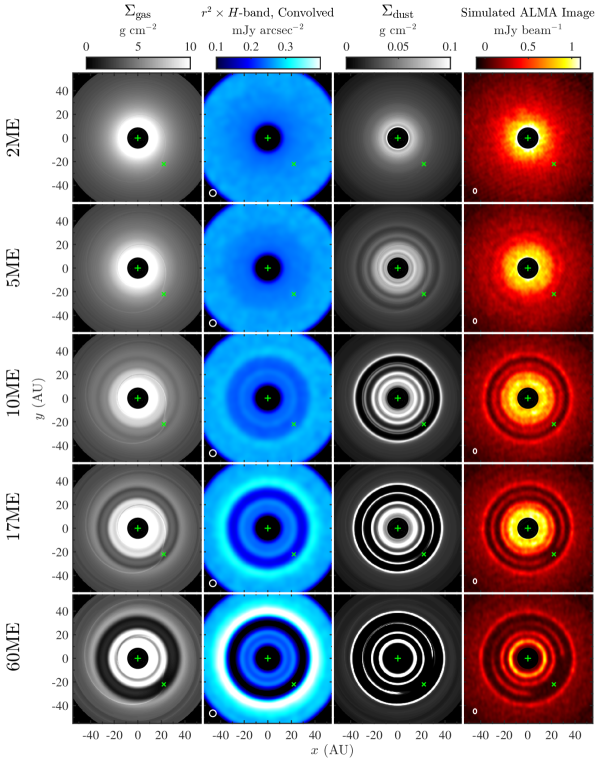
In this section, we explore how the morphologies of the rings and gaps vary with planet mass. Surface density maps and simulated images are shown in Figure 7, radial profiles are shown in Figure 8 (first column), and azimuthal profiles of selected models are shown in Figure 9. We find the following behavior when increasing from to :
-
1.
Gas gaps deepen with increasing . As more gas is pushed to gap edges, in the IR and in the OR increases, leading to an increase in the gap-ring contrast in -band images. In simulated ALMA images, the double-gap feature first appears at and grows more prominent with increasing .
-
2.
Each dust ring varies in its own way with . For the MR, and by extension decrease with increasing . By comparison, in the HR rises. As a result, as increases in the simulated ALMA images, the location of the (practically merged) MR+HR shifts from slightly inward of the planet’s orbit to being more nearly coincident with the planet’s orbit. The IR, IR2, and OR all become more prominent in and as increases. In simulated ALMA images, IR and IR2 are distinguishable only for Neptune mass.
-
3.
The OR is pushed outward.
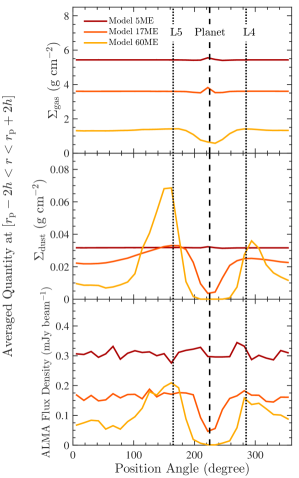
-
4.
As increases, the HR becomes more azimuthally asymmetric. Figure 9 shows azimuthal profiles of , , and ALMA flux density in the coorbital region to . In , a 60 planet starts to evacuate material in its vicinity to produce an azimuthal dip (compare with Figure 9 of Yu et al. 2010). A similar structure can also be found in the dust distribution and starts at a smaller Neptune mass, widening in angle with increasing . In addition, dust starts to accumulate around the triangular Lagrange points L4 and L5 away from the planet, as seen in previous works (see, e.g., the 40 planet case in Zhu et al., 2014, Figure 5). The simulated ALMA image with shows two Trojan arcs (bottom right panel in Figure 7). Eventually, as approaches a Jupiter mass (Lyra et al., 2009), the dust HR retreats into two azimuthally confined spots around L4 and L5, and the double-gap feature vanishes.
In general, dust gaps are more prominent than gas gaps, consistent with Paardekooper & Mellema (2006). We note that the minimum planet mass for the double gap to appear in observations ( in our models) depends on disk parameters; for example, the minimum decreases with decreasing scale height (data not shown).
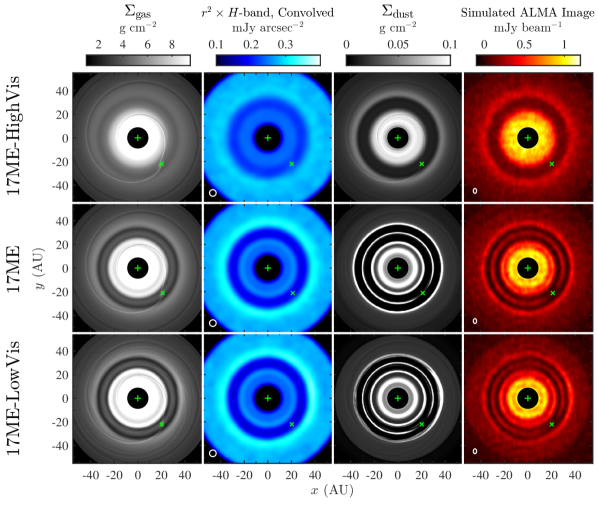
3.3. Dependence on Viscosity
Viscous diffusion tends to smooth out density perturbations in the gas induced by planets. In Figures 8 (second column) and 10, we compare three simulations with a Neptune-mass planet and different values for : 510-4, 510-5 (our fiducial model of Section 3.1), and 510-6.
In the snapshots and the NIR images, as viscosity decreases the gaps deepen, as expected (e.g., Fung et al., 2014; Kanagawa et al., 2015; Duffell, 2015). A second concomitant effect is that the surface densities in the IR and OR, located at the gap edges, increase with decreasing viscosity: when drops, more gas is pushed by Lindblad torques into the gap edges, and low viscosity makes it harder to diffuse away this excess. A third effect is that at the highest viscosity (), the HR+MR in the gas disappears and the two gaps merge. High viscosity enables gas to more easily diffuse away from the co-orbital region, which is a potential maximum. In addition, for planets with , viscous diffusion can prevent waves from shocking and damping and can thereby suppress gap formation (Goodman & Rafikov, 2001; Dong et al., 2011a). All three effects have been seen in previous hydro simulations (e.g., Li et al., 2009; Yu et al., 2010).
In the snapshots and simulated ALMA observations, the two low viscosity runs produce qualitatively similar ring and gap structures. By contrast, in the run, the two gaps merge and only two broad overdensities remain at the gap edges. A wide single gap may not be distinguishable from the gap opened by a more massive planet in a disk with higher viscosity. Thus, low viscosity () is a necessary condition for super-Earths to induce their signature double gaps. The two low viscosity models differ, however, in that for , a vortex is created, as indicated in Figure 11 using a more dramatic color stretch. The development of vortices at edges of planet-opened gaps requires low viscosity (e.g., Zhu & Stone, 2014), and is probably driven by the RWI (e.g., Li et al., 2000, 2001). As with dust trapping by radial pressure structures, pressure peaks in azimuth associated with vortices also trap dust particles of certain sizes (e.g., Lyra & Lin, 2013). The vortex in 17ME-LowVis is quite visible in the simulated ALMA image (Figure 11, right panel).
3.4. Dependence on the Global Background Disk Profile
The dust distribution, a direct observable from ALMA, is determined by gas drag forces, which depend on local gas pressure gradients. These local gradients in turn depend on the global background gradient. Figures 8 (third column) and 12 compare models 10ME-Beta15 (), 10ME (), and 10ME-Beta0 ( constant). The three models share similar radial profiles for , but the locations and contrasts of the dust rings depend on , the power-law slope of the background surface density. As decreases, the IR, HR, MR, and OR in expand outward. Overall, in the simulated ALMA observation, the 4 rings in model 10ME-Beta0 appear to be more distinctive and well separated than in the other two models.
3.5. Effects of Planet Migration
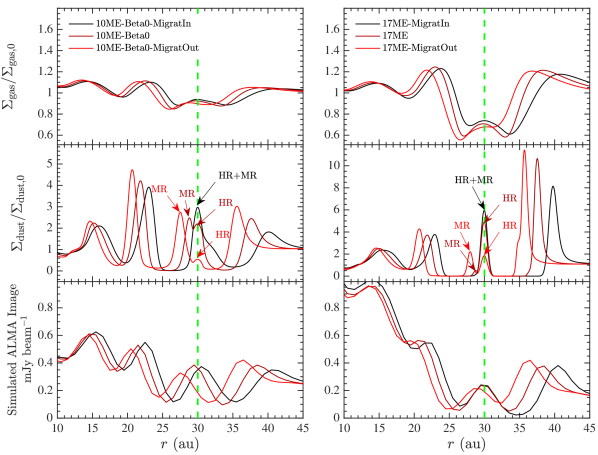
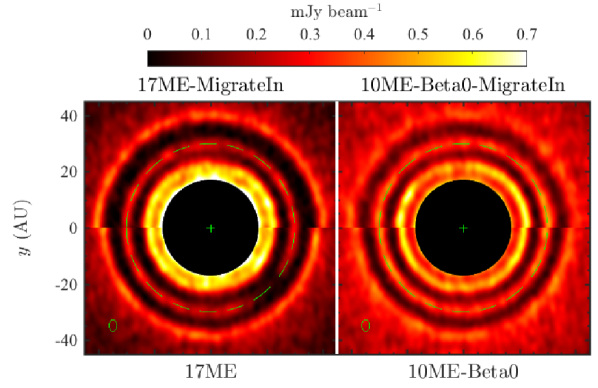
Finally, we experiment with the planet’s radial migration. We manually move the planet in models 10ME-Beta0 and 17ME across the disk at a constant user-controlled migration rate to explore how planet-induced structures depend on migration.
Figures 13 and 14 show the results. In models 10ME-Beta0-MigrateIn and 17ME-MigrateIn, the planet migrates inward at a rate AU orbit-1 (or about AU year-1). In models 10ME-Beta0-MigrateOut and 17ME-MigrateOut, the planet migrates at the same rate but outward. In all four models, the planet crosses AU at the end of the simulation after 1500 orbits. We note that it takes 1500 orbits for the planet to migrate 3 AU (= 2 scale heights), about the distance between the nearest gap and the planet’s orbit. We find that when the planet migrates (either inward or outward), those features radially behind the planet lag further behind, while features radially ahead of the planet are squeezed closer. The one exception is the dust HR, which simply follows the planet. The radial shifts of the IR2, IR, MR, and OR could, in principle, be used to infer if a planet is migrating. For example, if the HR+MR ring in ALMA images is dominated by the HR, the gap ahead of a migrating planet narrows, while the gap behind the migrating planet widens, as shown in the left panel of Figure 14. However, reading the signature of migration would require knowledge of the background disk profile to determine the “intrinsic” locations of these features in the absence of migration.
3.6. Future Improvements
Our investigations of observational signatures of super-Earths can be extended for greater realism.
-
1.
Simulations with a more realistic dust size distribution are a natural extension (e.g. Ruge et al., 2016). In this work we chose 200 as a representative size for the “big” dust particles. But dust of other sizes can have a non-trivial opacity at mm wavelengths.
-
2.
Relatedly, grain growth and evolution can be included. Once dust is concentrated into rings, coagulation can be facilitated (e.g., Youdin & Shu, 2002; Johansen et al., 2007; Pinilla et al., 2016), and instabilities such as the streaming instability (Youdin & Goodman, 2005; Chiang & Youdin, 2010) can be triggered. Our simulations focus on the first stage, the drift of mm-sized dust into gas pressure perturbations. A natural extension would be to follow the subsequent evolution of dust in the resulting concentrations.
-
3.
Our simulations assume a non-zero viscosity. Truly inviscid disks can behave differently (Fung & Chiang, 2017).
-
4.
Our simulations are 2D. For planets with , Fung & Chiang (2016) have shown that gap opening proceeds in 3D much the same way that it does in 2D. It will be interesting to explore 3D effects of sub-thermal-mass planets in low viscosity disks.
4. Summary and Discussion
In this work, we combined two-fluid hydrodynamics and radiative transfer simulations to calculate the distributions of gas and of mm-sized dust in a low viscosity disk perturbed by a super-Earth, and created synthetic observations of such systems in both near-infrared (NIR) scattered light and ALMA mm dust continuum emission. Our main findings are:
-
1.
A 10 planet in a low viscosity disk initially opens two narrow annular gaps, each displaced radially by about a vertical pressure scale height to either side of the planet’s orbit. Perturbations in the gas pressure cause dust particles to drift differentially. Millimeter-sized dust particles concentrate into three distinctive rings: two rings at the far edges of the two gaps, and one ring sandwiched between the two gaps (Figure 1). The 1:1 resonance may produce a fourth dust ring exactly coincident with the planet’s orbit. A fifth dust ring interior to the double-gap region is also possible, depending on parameters. These dust rings are not necessarily located at the positions of low-order mean motion resonances relative to each other, although they may appear to be so by chance. For our assumed disk parameters, a minimum planet mass of 5 is needed to produce detectable rings on 1000 orbits timescale. Planets more massive than Neptune () generate azimuthal dust concentrations at the triangular Lagrange points L4 and L5.
-
2.
The dust rings and gaps produced by a super-Earth at 30 AU in a typical disk with of mm-sized dust at 140 pc distance can be readily detected by ALMA in mm dust continuum observations with an angular resolution of and 2 hours of integration. In NIR scattered light, the gaps and rings are less prominent and may not be detectable with current NIR capabilities.
-
3.
To produce the signature double-(or-multiple)-gap feature in mm continuum observations, the disk’s viscosity parameter has to be lower than 10-4. At higher viscosity, only one gap is opened at the planet’s orbit. If is lower than 10-5, the Rossby wave instability at gap edges can be triggered, forming dust-trapping vortices.
-
4.
The double-gap signature of a single super-Earth manifests in disks with a variety of background profiles and tolerates modest planet migration (10 AU / Myr at 30 AU). Migration changes the locations of the rings in potentially observable ways. Although the double gap can be discerned for thousands of orbits, it weakens as material diffuses away from the co-orbital region.
At tens of AUs, super-Earths can produce a characteristic double-gap feature detectable in high resolution mm continuum observations by ALMA. A low disk viscosity of is critical for observability. Super-Earths, unlike their Jovian siblings, induce only weak perturbations in the gas disk, which must be nearly inviscid for such perturbations to manifest observationally (in particular, to facilitate the development of the Goodman & Rafikov 2001 wave nonlinearity), and for aerodynamic drag on dust to amplify these features. The low viscosity at the disk midplane that is advocated here finds support from both observations and theory. The leading explanation for lopsided disks observed by ALMA (e.g., van der Marel et al., 2013; Casassus et al., 2013; Pérez et al., 2014)—vortices formed at planet-opened gap edges—requires (e.g., Zhu & Stone, 2014). Similarly, if most cavities in transitional disks are opened by multiple planets, needs to be lower than in order to mobilize enough low-mass planets to account for the prevalence of transitional disks (Dong & Dawson, 2016). See also Fung & Chiang (2017) for how multiple super-Earths in inviscid disks can both survive orbital migration and drive disk accretion. Magnetohydrodynamics (MHD) simulations have shown than non-ideal MHD effects, in particular ambipolar diffusion, can significantly suppress the magnetorotational instability in disks at tens of AUs, resulting in practically zero turbulence at disk midplanes (Bai & Stone, 2011; Perez-Becker & Chiang, 2011b, a; Bai, 2013; Turner et al., 2014; Bai, 2015). Not even in disk surface layers has turbulence been detected (Flaherty et al. 2015; Flaherty et al. 2017, in prep.).
A double gap observed in nature could, naively, be explained with two planets in a standard viscous disk, each opening their own gap. But this interpretation is problematic. The two gaps in the double-gap feature that we found are typically 2–4 scale heights apart, or 0.1–0.2 for . In a disk with , the width of a single planet-opened gap is greater than (e.g., Kanagawa et al. 2016, Figure 3; Dong & Fung 2017b, Figure 7). Two closely spaced gaps opened by two planets would merge into one in a standard viscous disk. The two-planet configuration may also be prone to orbital instability, particularly if the planets are not in mean-motion resonance (Tamayo et al., 2015).
We close with a few remarks on real disks. To date, two systems, HL Tau (ALMA Partnership et al., 2015) and TW Hya (Andrews et al., 2016; Tsukagoshi et al., 2016), have been observed by ALMA with sub- resolution. Intriguingly, in each case a candidate double gap can be identified: D5 and D6 at 64 and 74 AU in HL Tau, and the two gaps at 37 and 43 AU in TW Hya. We plan to discuss these two systems and explore the possibility that their ring/gap features are produced by super-Earths in a forthcoming paper. In addition, a Large Program (PI: S. Andrews) was approved in ALMA Cycle 4 to resolve 20 nearby disks at high angular resolution. We look forward to seeing whether this sample also features multiple rings, and ultimately to inferring whether super-Earths commonly form at large distances, as they appear to have done at small ones.
Acknowledgments
We are grateful to an anonymous referee for constructive suggestions that improved our paper. R.D. thanks Bekki Dawson, Jeffrey Fung, Eve Lee, Paola Pinilla, Roman Rafikov, and Zhaohuan Zhu for insightful discussions; Fumi Egusa at the ALMA help desk on using CASA; and Sean Andrews and David Wilner for motivating this work. Part of the numerical calculations were performed on the SAVIO cluster provided by the Berkeley Research Computing program, supported by the UC Berkeley Vice Chancellor for Research and the Berkeley Center for Integrative Planetary Science. H. Li and S. Li gratefully acknowledge the support by LANL’s LDRD program and a CSES project. E.C. acknowledges support from the NSF and NASA.
References
- ALMA Partnership et al. (2015) ALMA Partnership, Brogan, C. L., Pérez, L. M., et al. 2015, ApJ, 808, L3
- Andrews et al. (2016) Andrews, S. M., Wilner, D. J., Zhu, Z., et al. 2016, ApJ, 820, L40
- Bai (2013) Bai, X.-N. 2013, ApJ, 772, 96
- Bai (2015) —. 2015, ApJ, 798, 84
- Bai & Stone (2011) Bai, X.-N., & Stone, J. M. 2011, ApJ, 736, 144
- Baraffe et al. (1998) Baraffe, I., Chabrier, G., Allard, F., & Hauschildt, P. H. 1998, A&A, 337, 403
- Birnstiel et al. (2010) Birnstiel, T., Dullemond, C. P., & Brauer, F. 2010, A&A, 513, A79
- Bohren & Huffman (1983) Bohren, C. F., & Huffman, D. R. 1983, Absorption and scattering of light by small particles (Wiley-VCH)
- Bowler (2016) Bowler, B. P. 2016, PASP, 128, 102001
- Burke et al. (2015) Burke, C. J., Christiansen, J. L., Mullally, F., et al. 2015, ApJ, 809, 8
- Casassus et al. (2013) Casassus, S., van der Plas, G., M, S. P., et al. 2013, Nature, 493, 191
- Chiang & Youdin (2010) Chiang, E., & Youdin, A. N. 2010, Annual Review of Earth and Planetary Sciences, 38, 493
- David et al. (2016) David, T. J., Hillenbrand, L. A., Petigura, E. A., et al. 2016, Nature, 534, 658
- Donati et al. (2016) Donati, J. F., Moutou, C., Malo, L., et al. 2016, Nature, 534, 662
- Dong & Dawson (2016) Dong, R., & Dawson, R. 2016, ApJ, 825, 77
- Dong & Fung (2017a) Dong, R., & Fung, J. 2017a, ApJ, 835, 38
- Dong & Fung (2017b) —. 2017b, ApJ, 835, 146
- Dong et al. (2011a) Dong, R., Rafikov, R. R., & Stone, J. M. 2011a, ApJ, 741, 57
- Dong et al. (2011b) Dong, R., Rafikov, R. R., Stone, J. M., & Petrovich, C. 2011b, ApJ, 741, 56
- Dong et al. (2015) Dong, R., Zhu, Z., & Whitney, B. 2015, ApJ, 809, 93
- Dong et al. (2012) Dong, R., Rafikov, R., Zhu, Z., et al. 2012, ApJ, 750, 161
- Dong et al. (2017) Dong, R., van der Marel, N., Hashimoto, J., et al. 2017, ApJ, 836, 201
- Dressing & Charbonneau (2015) Dressing, C. D., & Charbonneau, D. 2015, ApJ, 807, 45
- Dressing et al. (2015) Dressing, C. D., Charbonneau, D., Dumusque, X., et al. 2015, ApJ, 800, 135
- Duffell (2015) Duffell, P. C. 2015, ApJ, 807, L11
- Duffell & MacFadyen (2012) Duffell, P. C., & MacFadyen, A. I. 2012, ApJ, 755, 7
- Duffell & MacFadyen (2013) —. 2013, ApJ, 769, 41
- Dullemond & Dominik (2004) Dullemond, C. P., & Dominik, C. 2004, A&A, 421, 1075
- Dumusque et al. (2014) Dumusque, X., Bonomo, A. S., Haywood, R. D., et al. 2014, ApJ, 789, 154
- Fedele et al. (2017) Fedele, D., Carney, M., Hogerheijde, M. R., et al. 2017, A&A, 600, A72
- Flaherty et al. (2015) Flaherty, K. M., Hughes, A. M., Rosenfeld, K. A., et al. 2015, ApJ, 813, 99
- Fressin et al. (2013) Fressin, F., Torres, G., Charbonneau, D., et al. 2013, ApJ, 766, 81
- Fu et al. (2014) Fu, W., Li, H., Lubow, S., Li, S., & Liang, E. 2014, ApJ, 795, L39
- Fung & Chiang (2016) Fung, J., & Chiang, E. 2016, ApJ, 832, 105
- Fung & Chiang (2017) —. 2017, ArXiv e-prints, arXiv:1701.08161
- Fung et al. (2014) Fung, J., Shi, J.-M., & Chiang, E. 2014, ApJ, 782, 88
- Goodman & Rafikov (2001) Goodman, J., & Rafikov, R. R. 2001, ApJ, 552, 793
- Hammer et al. (2017) Hammer, M., Kratter, K. M., & Lin, M.-K. 2017, MNRAS, 466, 3533
- Hashimoto et al. (2011) Hashimoto, J., Tamura, M., Muto, T., et al. 2011, ApJ, 729, L17
- Hashimoto et al. (2015) Hashimoto, J., Tsukagoshi, T., Brown, J. M., et al. 2015, ApJ, 799, 43
- Johansen et al. (2007) Johansen, A., Oishi, J. S., Mac Low, M.-M., et al. 2007, Nature, 448, 1022
- Jontof-Hutter et al. (2014) Jontof-Hutter, D., Lissauer, J. J., Rowe, J. F., & Fabrycky, D. C. 2014, ApJ, 785, 15
- Kanagawa et al. (2015) Kanagawa, K. D., Muto, T., Tanaka, H., et al. 2015, ApJ, 806, L15
- Kanagawa et al. (2016) —. 2016, PASJ, 68, 43
- Kim et al. (1994) Kim, S.-H., Martin, P. G., & Hendry, P. D. 1994, ApJ, 422, 164
- Lee & Chiang (2016) Lee, E. J., & Chiang, E. 2016, ApJ, 817, 90
- Li et al. (2001) Li, H., Colgate, S. A., Wendroff, B., & Liska, R. 2001, ApJ, 551, 874
- Li et al. (2000) Li, H., Finn, J. M., Lovelace, R. V. E., & Colgate, S. A. 2000, ApJ, 533, 1023
- Li et al. (2005) Li, H., Li, S., Koller, J., et al. 2005, ApJ, 624, 1003
- Li et al. (2009) Li, H., Lubow, S. H., Li, S., & Lin, D. N. C. 2009, ApJ, 690, L52
- Lopez & Fortney (2014) Lopez, E. D., & Fortney, J. J. 2014, ApJ, 792, 1
- Lovelace et al. (1999) Lovelace, R. V. E., Li, H., Colgate, S. A., & Nelson, A. F. 1999, ApJ, 513, 805
- Lucy (1999) Lucy, L. B. 1999, A&A, 344, 282
- Lyra et al. (2009) Lyra, W., Johansen, A., Klahr, H., & Piskunov, N. 2009, A&A, 493, 1125
- Lyra & Lin (2013) Lyra, W., & Lin, M.-K. 2013, ApJ, 775, 17
- Macintosh et al. (2015) Macintosh, B., Graham, J. R., Barman, T., et al. 2015, Science, 350, 64
- Marcy et al. (2014) Marcy, G. W., Isaacson, H., Howard, A. W., et al. 2014, ApJS, 210, 20
- Miranda et al. (2016) Miranda, R., Li, H., Li, S., & Jin, S. 2016, ArXiv e-prints, arXiv:1610.01977
- Momose et al. (2015) Momose, M., Morita, A., Fukagawa, M., et al. 2015, ArXiv e-prints, arXiv:1505.04937
- Muto et al. (2010) Muto, T., Suzuki, T. K., & Inutsuka, S.-i. 2010, ApJ, 724, 448
- Paardekooper & Mellema (2004) Paardekooper, S.-J., & Mellema, G. 2004, A&A, 425, L9
- Paardekooper & Mellema (2006) —. 2006, A&A, 453, 1129
- Pérez et al. (2014) Pérez, L. M., Isella, A., Carpenter, J. M., & Chandler, C. J. 2014, ApJ, 783, L13
- Perez-Becker & Chiang (2011a) Perez-Becker, D., & Chiang, E. 2011a, ApJ, 735, 8
- Perez-Becker & Chiang (2011b) —. 2011b, ApJ, 727, 2
- Pinilla et al. (2012a) Pinilla, P., Benisty, M., & Birnstiel, T. 2012a, A&A, 545, A81
- Pinilla et al. (2012b) Pinilla, P., Birnstiel, T., Ricci, L., et al. 2012b, A&A, 538, A114
- Pinilla et al. (2016) Pinilla, P., Flock, M., Ovelar, M. d. J., & Birnstiel, T. 2016, A&A, 596, A81
- Quanz et al. (2013) Quanz, S. P., Avenhaus, H., Buenzli, E., et al. 2013, ApJ, 766, L2
- Rafikov (2002a) Rafikov, R. R. 2002a, ApJ, 569, 997
- Rafikov (2002b) —. 2002b, ApJ, 572, 566
- Rice et al. (2006) Rice, W. K. M., Armitage, P. J., Wood, K., & Lodato, G. 2006, MNRAS, 373, 1619
- Rice et al. (2004) Rice, W. K. M., Lodato, G., Pringle, J. E., Armitage, P. J., & Bonnell, I. A. 2004, MNRAS, 355, 543
- Rogers (2015) Rogers, L. A. 2015, ApJ, 801, 41
- Rosotti et al. (2016) Rosotti, G. P., Juhasz, A., Booth, R. A., & Clarke, C. J. 2016, MNRAS, 459, 2790
- Ruge et al. (2016) Ruge, J. P., Flock, M., Wolf, S., et al. 2016, A&A, 590, A17
- Shakura & Sunyaev (1973) Shakura, N. I., & Sunyaev, R. A. 1973, A&A, 24, 337
- Takeuchi & Lin (2002) Takeuchi, T., & Lin, D. N. C. 2002, ApJ, 581, 1344
- Tamayo et al. (2015) Tamayo, D., Triaud, A. H. M. J., Menou, K., & Rein, H. 2015, ApJ, 805, 100
- Tang et al. (2017) Tang, Y.-W., Guilloteau, S., Dutrey, A., et al. 2017, ArXiv e-prints, arXiv:1704.02699
- Tsukagoshi et al. (2016) Tsukagoshi, T., Nomura, H., Muto, T., et al. 2016, ApJ, 829, L35
- Turner et al. (2014) Turner, N. J., Fromang, S., Gammie, C., et al. 2014, Protostars and Planets VI, 411
- van der Marel et al. (2015) van der Marel, N., van Dishoeck, E. F., Bruderer, S., Pérez, L., & Isella, A. 2015, A&A, 579, A106
- van der Marel et al. (2013) van der Marel, N., van Dishoeck, E. F., Bruderer, S., et al. 2013, Science, 340, 1199
- Wagner et al. (2016) Wagner, K., Apai, D., Kasper, M., et al. 2016, Science, 353, 673
- Weiss & Marcy (2014) Weiss, L. M., & Marcy, G. W. 2014, ApJ, 783, L6
- Whitney et al. (2013) Whitney, B. A., Robitaille, T. P., Bjorkman, J. E., et al. 2013, ApJS, 207, 30
- Wu & Lithwick (2013) Wu, Y., & Lithwick, Y. 2013, ApJ, 772, 74
- Youdin & Goodman (2005) Youdin, A. N., & Goodman, J. 2005, ApJ, 620, 459
- Youdin & Shu (2002) Youdin, A. N., & Shu, F. H. 2002, ApJ, 580, 494
- Yu et al. (2010) Yu, C., Li, H., Li, S., Lubow, S. H., & Lin, D. N. C. 2010, ApJ, 712, 198
- Zhang et al. (2014) Zhang, K., Isella, A., Carpenter, J. M., & Blake, G. A. 2014, ApJ, 791, 42
- Zhu et al. (2015) Zhu, Z., Dong, R., Stone, J. M., & Rafikov, R. R. 2015, ApJ, 813, 88
- Zhu et al. (2012) Zhu, Z., Nelson, R. P., Dong, R., Espaillat, C., & Hartmann, L. 2012, ApJ, 755, 6
- Zhu & Stone (2014) Zhu, Z., & Stone, J. M. 2014, ApJ, 795, 53
- Zhu et al. (2013) Zhu, Z., Stone, J. M., & Rafikov, R. R. 2013, ApJ, 768, 143
- Zhu et al. (2014) Zhu, Z., Stone, J. M., Rafikov, R. R., & Bai, X.-n. 2014, ApJ, 785, 122
| Model Name | Initial | Migration | ||
| 2ME | No | |||
| 5ME | No | |||
| 10ME | No | |||
| 17ME | (Neptune) | No | ||
| 60ME | No | |||
| 10ME-Beta0 | Constant | No | ||
| 10ME-Beta15 | No | |||
| 17ME-LowVis | No | |||
| 17ME-HighVis | No | |||
| 10ME-Beta0-MigrateIn | Constant | AU orbit-1 | ||
| 10ME-Beta0-MigrateOut | Constant | AU orbit-1 | ||
| 17ME-MigrateIn | AU orbit-1 | |||
| 17ME-MigrateOut | AU orbit-1 |