Galaxy And Mass Assembly (GAMA): The environments of high- and low- excitation radio galaxies
Abstract
We study the environments of low- and high- excitation radio galaxies (LERGs and HERGs respectively) in the redshift range , using a sample of 399 radio galaxies and environmental measurements from the Galaxy And Mass Assembly (GAMA) survey. In our analysis we use the fifth nearest neighbour density () and the GAMA galaxy groups catalogue (G3Cv6) and construct control samples of galaxies matched in stellar mass and colour to the radio-detected sample.
We find that LERGs and HERGs exist in different environments and that this difference is dependent on radio luminosity. High-luminosity LERGs ( W Hz-1) lie in much denser environments than a matched radio-quiet control sample (about three times as dense, as measured by ), and are more likely to be members of galaxy groups ( percent of LERGs are in GAMA groups, compared to percent of the control sample). In contrast, the environments of the HERGs and lower luminosity LERGs are indistinguishable from that of a matched control sample. Our results imply that high-luminosity LERGs lie in more massive haloes than non-radio galaxies of similar stellar mass and colour, in agreement with earlier studies (Wake et al., 2008; Donoso et al., 2010). When we control for the preference of LERGs to be found in groups, both high- and low- luminosity LERGs are found in higher-mass haloes ( dex; at least 97 percent significant) than the non-radio control sample.
keywords:
surveys – galaxies: groups: general – radio continuum: galaxies1 Introduction
There is an intriguing interplay between the evolution of a galaxy and its environment. Evidence that galaxies are influenced by their surrounding environment includes the observed correlation between star formation rate (SFR) and local galaxy density for galaxies in clusters (e.g. Lewis et al., 2002; Wijesinghe et al., 2012; Burton et al., 2013), along with the well-known morphology-density relation (Dressler, 1980).
Feedback between galaxies and their environment can occur in several ways, but one important process for massive galaxies in the low-redshift () Universe is radio-mode feedback (Croton et al., 2006; Bower et al., 2006). Mechanical energy is deposited into the interstellar medium by radio jets and lobes that are powered by an active nucleus. The lobes rise and expand due to buoyancy. Unlike supernova-driven feedback, radio-mode feedback can provide sufficient energy ( W; Bîrzan et al., 2004) to suppress star formation in massive galaxies without also requiring a starburst to drive the feedback.
The jets of radio galaxies can also influence the wider cluster environment by displacing and heating the gaseous intracluster medium (ICM) (McNamara et al., 2000, 2005). This heating of the ICM by radio galaxies (McNamara & Nulsen, 2007) can solve the long-standing cooling flow problem (Fabian, 1994) where the observed cooling rates of the ICM are lower than the predicted cooling rates (hundreds to thousands of solar masses a year) within these systems. Galaxy formation simulations can successfully reproduce the observed galaxy luminosity function if they include this radio-mode heating of the ICM, whereas an over-abundance of luminous galaxies is produced without feedback (Croton et al., 2006; Bower et al., 2006).
Several properties of radio galaxies are seen to depend on their environment. Fanaroff & Riley (1974) type I (FRI) radio galaxies are dominated by radio emission close to the nucleus, while Fanaroff-Riley type II (FRII) radio galaxies are dominated by emission from the lobes. FRI host galaxies are found in richer clusters than FRIIs (Prestage & Peacock, 1988; Zirbel, 1997), and are often the dominant or central galaxy of a cluster. In contrast, FRII host galaxies are usually found in smaller groups (Zirbel, 1997). Related to this, Hine & Longair (1979) found that radio galaxies in clusters (typically FRIs) tended to show only absorption lines or weak [O II] emission in their optical spectra, whereas most radio galaxies with strong emission lines were not members of clusters. This is not surprising given the known star formation–density (Lewis et al., 2002) and morphology–density (Dressler, 1980) relations.
In our current picture (e.g. Hardcastle, Evans & Croston, 2007; Best & Heckman, 2012), the observed optical spectrum of a radio galaxy reflects the presence (or absence) of a radiatively efficient accretion disk surrounding the central supermassive back hole (SMBH). To form such a disk the AGN requires a sufficiently high accretion efficiency (typically 1–10 percent of the Eddington rate). The UV radiation field from the disk can then ionize surrounding gas leading to the presence of high-excitation emission lines. Objects with such features are termed high-excitation radio galaxies, or HERGs. At lower accretion efficiency (less than percent of Eddington) a radiatively inefficient advection dominated accretion flow (ADAF) can form. The lack of UV continuum in this case leads to a dearth of strong emission lines. Such objects are termed low-excitation radio galaxies, or LERGs.
While the observational characteristics of HERGs and LERGs are primarily driven by the accretion rate onto the black hole, the flow of gas from larger scales is expected to modulate this. Cold gas can be quickly accreted from galaxy scales to the scale of the black hole, particularly in the presence of dynamical disturbance generated by interactions or mergers. This “cold-mode accretion” can be rapid enough to enable the formation of a radiatively efficient accretion disk, which will then photoionize the surrounding gas and produce strong, high-excitation optical emission lines (i.e. HERGs). In contrast, high temperature gas (e.g. gas shock-heated to the virial temperature of the host halo of the galaxy) in massive galaxies will cool only slowly, providing a slow trickle of gas onto the black hole, insufficient for a radiatively efficient disk. As a result such objects would have weak or non-existent emission lines (LERGs).
These two distinct populations of high-excitation and low-excitation radio galaxies may provide feedback in different ways. The LERGs are postulated to lie in high-mass quasi-static hot halos, which supply cooling gas onto the radio galaxy, and the accretion process is self-regulated by mechanical feedback from the radio jets, i.e. “radio-mode” feedback (e.g. Kereš et al., 2005; Croton et al., 2006; Bower et al., 2006; van de Voort & Schaye, 2012). In contrast, HERGs are thought to have radiative and mechanical feedback from both the AGN and supernovae in the host galaxy, which is termed “quasar-mode” feedback (Croton et al., 2006; Bower et al., 2006).
Early studies of radio galaxy environments were focused on the most massive bound systems, i.e. clusters or massive groups. In part this was due to the difficulty of finding lower mass groups in relatively shallow galaxy samples. New surveys, such as the Sloan Digital Sky Survey (SDSS; York et al., 2000), 2-degree Field Galaxy Redshift Survey (2dFGRS; Colless et al., 2001), 6-degree Field Galaxy Survey (6dFGS; Jones et al., 2004) have dramatically increased our ability study galaxy environments. The availability of optical spectra for fainter galaxies has enabled more detailed studies over a wider range in group masses, by enabling individual group members to be robustly identified.
In this paper we use the Large Area Radio Galaxy Evolution Spectroscopic Survey (LARGESS; Ching et al., 2017) to carry out new investigations into the impact of environment on radio galaxies. LARGESS contains a total of 10,856 spectroscopically confirmed radio galaxies. The LARGESS radio galaxies are combined with data from the Galaxy And Mass Assembly survey (GAMA; Driver et al., 2011) and we specifically focus on the differences between the environments of high– and low–excitation radio galaxies, making use of the highly complete GAMA group catalogue Robotham et al. (2011). We describe the GAMA galaxy and radio galaxy samples in §2, and explain our classification scheme for low– and high–excitation radio galaxies and stellar mass estimates in §3. §4 summarises the statistical methods used. In §5 we present results based on the fifth nearest neighbour density of radio galaxies. In §6 we present the group occupation statistics for the sample using the GAMA groups catalogue and then investigate detailed group properties in §7. We provide a detailed discussion of our results in the context of previous work in §8 and summarise our results in §9.
Unless otherwise stated, we assume: = 100 km s-1 Mpc-1, and , which corresponds to the cosmology of the Millennium N-body simulation used to construct the GAMA light cone mocks and GAMA groups catalogue. The original cosmology used in all other GAMA measurements was , and . In our results we will factor out the dependence and assume the difference in and are insignificant at the relatively low redshifts of our sample.
| Targets | Observed | Redshift () | ||||
| Sample | All | Radio limit | All | Radio limit | All | Radio limit |
| Main GAMA target | 1,470 | 599 | 1,470 | 599 | 1,433 | 582 |
| Filler target (all) | 1,624 | 756 | 1,319 | 596 | 993 | 458 |
| Filler target (radio) | (1,442) | (691) | (1,155) | (539) | (850) | (409) |
| Total | 3,094 | 1,355 | 2,789 | 1,195 | 2,426 | 1,040 |
2 Sample and observations
2.1 The GAMA Survey
The GAMA survey (Driver et al., 2011; Hopkins et al., 2013) is a large multi-wavelength study of galaxy formation and evolution using the multi-object 2-degree Field (2dF) robotic fibre positioner, coupled with the AAOmega spectrograph (Sharp et al., 2006) on the Anglo-Australian Telescope (AAT). 2dF has 392 fibres (and 8 guide fibres), each with a diameter of 2 arcsec on the sky (corresponding to kpc at =0.3). The main GAMA I spectroscopic survey targeted galaxies that were photometrically selected from the SDSS sixth data release (Adelman-McCarthy et al., 2008) in three degree equatorial regions at approximately 09h, 12h and 15h in right ascension. The GAMA II sample (Liske et al., 2015) extends the area of the GAMA I regions and increases the depth of the spectroscopy across the whole survey to a limiting magnitude of (extinction corrected). Galaxies which already had spectra from SDSS (or other sources) were in general not re-observed as part of GAMA. In this work we will only consider galaxies within the GAMA I sky coverage but we will use data products from both GAMA I and II, i.e. those to a limiting depth of .
For each GAMA spectrum, a heliocentric redshift was measured using the program runz (Saunders, Cannon & Sutherland, 2004; Drinkwater et al., 2010). runz cross–correlates with template spectra, fits emission lines and allows manual checking and interaction. As part of the manual checking of the redshift, a quality flag (Q; Driver et al., 2011) was assigned. Redshifts for radio galaxy targets were also independently re-derived with a template set that included broad–line AGN (that were not included in the main GAMA redshift pipeline). The broad line AGN template used was an SDSS quasar composite spectrum (Vanden Berk et al., 2001). Approximately 8 percent of redshifts and classifications disagreed between LARGESS and GAMA, with most cases being broad–line AGN at high redshift. As part of the quality control process for GAMA redshifts, several GAMA team members independently checked the redshift and quality values (Liske et al., 2015). Final values were then assigned based on the combined redshifts and qualities (nQ). In this paper we only use radio galaxies where the redshift difference is within 0.01 (i.e. ) and both surveys have considered the redshift to be reliable ().
2.2 The radio galaxy sample
A full description of the LARGESS sample is given by Ching et al. (2017). For completeness, we provide a brief outline here. The LARGESS sample comprises 19,179 radio-optical matches covering over 800 deg2. Radio sources are identified by a cross-match between the SDSS down to an extinction corrected and the Faint Images of the Radio Sky at Twenty-cm (FIRST; Becker, White & Helfand, 1995) to 5 times the local root mean-square noise ( mJy). The cross-matching follows a tiered-algorithm, and is optimised to improve the identification of extended radio sources at the chosen depth. The sample was also matched to the NRAO VLA Sky Survey (NVSS; Condon et al., 1998) to get good estimates of total flux for extended sources. The overall optical-radio matching reliability and completeness of the sample are estimated to be 93.5 percent and 95 percent respectively (see Ching et al., 2017). For objects that did not already have high quality spectra from SDSS we obtained followup spectroscopy as part of the GAMA and WiggleZ (Drinkwater et al., 2010) surveys. LARGESS sources that were not part of the main GAMA or WiggleZ samples were targeted at lower priority. The final catalogue contains spectroscopic observations for 12,329 radio sources, of which 10,856 have reliable redshifts.
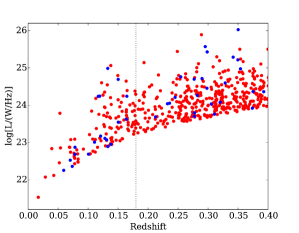
In this paper we limit our radio galaxy sample to those LARGESS objects in the GAMA I regions. Out of the full 19,179 LARGESS target sample, 3,168 lie within the GAMA I spectroscopic survey coverage. Of these, 3,094 fall within the area covered by the GAMA GAMA I spectroscopic tiling catalogue (internal data management unit: InputCatv16). 1,470 of these were in the main GAMA I sample (internal flag: survey_class , see Driver et al., 2011) and the remaining 1,624 were filler targets, which are mostly targets only because of a FIRST detection [ were targeted as fillers for other reasons (see Baldry et al., 2010)]. Spectra were obtained for of our ‘filler’ targets (fainter than ), more than 70% of which have a reliable redshift (see Table 1). Finally, we also limit our sample to LARGESS galaxies with a NVSS detection and FIRST total integrated flux density () above 3.5 mJy. The NVSS measurements provides better surface brightness sensitivity to extended emission. The FIRST limit is applied because the fraction of LARGESS objects with a NVSS match drops rapidly below this limit. The distribution of objects in the radio luminosity vs. redshift plane is shown in Fig. 1. Radio luminosities, here and elsewhere, are calculated using our default cosmology (with ), and a K-correction assuming a power law spectral index of . As expected, given a flux limited sample, the typical luminosity varies across the volume we sample. To counteract this we make comparisons to control samples throughout our analysis. The 5th nearest neighbour analysis is carried out within a volume limited to and we use control galaxies with the same redshift distribution for our group analysis.
3 Measured galaxy properties
3.1 Low– and high–excitation galaxy classification
We classified galaxies into four main categories, star-forming (SF) galaxies, low-excitation radio galaxies (LERGs), high-excitation radio galaxies (HERGs) and broad emission line galaxies (AeB). The full details are provided by Ching et al. (2017) but we give a brief summary below.
Broad emission line objects were classified by visual inspection of GAMA, WiggleZ and some SDSS spectra, and by spectroscopic flags from the surveys (particularly SDSS). Galaxies classified as AeB are not included in our analysis because the non-stellar continuum contribution from the accretion disk biases galaxy parameters such as stellar mass. In the unified model of high–accretion–rate AGN (Urry & Padovani, 1995), we expect AeB objects to have the same intrinsic properties as HERGs. A difference in orientation leads to the observational differences.
The radio luminosity function above W Hz-1 is dominated by AGN (e.g. Mauch & Sadler, 2007; Best & Heckman, 2012), with a space density of Mpc-3 for luminosities between – W Hz-1, compared to just Mpc-3 for star-forming galaxies over the same luminosity range. The decline of SF galaxies above W Hz-1 is because the inferred SFR exceeds yr-1 (Hopkins et al., 2003), and such sources are rare in the low-redshift Universe. Therefore, we considered all galaxies with FIRST radio luminosities () greater than W Hz-1 to have radio emission produced by an AGN. The H line is redshifted off the end of the observed spectral range at for GAMA and at for the SDSS and WiggleZ. Our adopted FIRST flux limit of 3.5 mJy is equivalent to a radio luminosity of W Hz-1 at , so any object in our sample will be above this luminosity at higher redshift. We therefore consider all objects at to have their radio emission dominated by an AGN.
For objects with W Hz-1 and we used two methods to identify galaxies where the radio emission is likely coming from star formation. The first method used the Baldwin, Phillips, & Terlevich (1981, hereafter BPT) emission line diagnostic. In this diagnostic, star-forming galaxies were those with H, H, [NII] and [OIII] detected at 3 significance, and in the “pure” star forming region defined by Kauffmann et al. (2003a). The second method compared the SFR inferred from the FIRST radio flux with the SFR inferred from H emission line flux (Hopkins et al., 2003) for galaxies with H and H detected at . Galaxies within the typical dispersion of the two measurements were classified as having radio emission associated with star forming regions. All remaining galaxies were considered to have radio emission primarily from an AGN (see Ching et al., 2017, for details).
We lastly classified each of the AGN as either a HERG or a LERG. This was done on the basis of their [O III] emission. If an AGN had [O III] emission detected at significance and an [O III] equivalent width of Å it was classified as a HERG, otherwise it was classified as a LERG. For a more detailed discussion of the efficacy of approaches to HERG and LERG classification see Pracy et al. (2016).
3.2 Stellar mass estimates
Taylor et al. (2011) made stellar mass estimates using spectral energy distribution (SED) fits to the GAMA photometry of SDSS images. Using these estimates Taylor et al. (2011) then presented a tight ( dex scatter) empirical relation (equation 8 in their paper) to derive stellar masses using the rest-frame colour, and -band luminosity. We use this relationship (applied to SDSS Petrosian magnitudes) to generate stellar mass estimates for the galaxies in our work. We make our own estimates because the stellar masses estimated using the SED fits are not available for all radio targets.
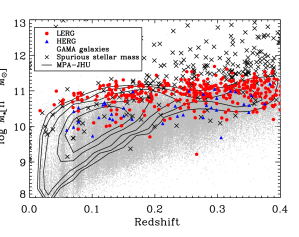
Radio luminosity is known to depend on the stellar () and/or black hole () mass of a galaxy (e.g. Fabbiano, Gioia & Trinchieri, 1989; Taylor et al., 1996; McLure et al., 1999, 2004; Best et al., 2005; Mauch & Sadler, 2007; Janssen et al., 2012). Fig. 2 shows the stellar mass distribution of the full GAMA sample (grey points) and the radio galaxies (coloured) as a function of redshift. We also include contours of SDSS galaxies from the MPA-JHU111http://www.mpa-garching.mpg.de/SDSS/DR7/ stellar mass estimates (Kauffmann et al., 2003b). Since radio-loud AGNs are generally hosted by very massive galaxies, it is important to account for any bias caused by this dependence on stellar mass. Fig. 2 shows that our radio galaxy sample is dominated by galaxies with higher masses than the average GAMA galaxy, particularly for the LERGs (red points). There are a small number of outliers towards low mass. The lowest mass LERG outliers are found to have extended radio lobes (and therefore not dominated by star formation in the radio), with significant H emission, but weak or undetectable H and [O III] emission which leads to a LERG classification. Inclusion of these objects does not influence our results.
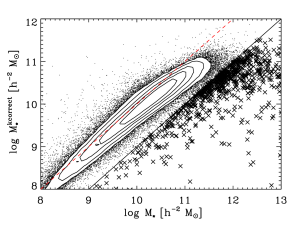
For GAMA main survey galaxies we compare the Taylor et al. (2011) stellar masses to those independently derived using the kcorrect v4_2 code (Blanton & Roweis, 2007) to fit the SDSS model magnitudes. Fig. 3 shows a tight correlation between the two approaches, but also an offset from the one-to-one line. The stellar masses used in this work are larger than those estimated using kcorrect, which is caused by the different types of photometry (Taylor et al., 2011, applied SED fits to GAMA photometry derived using SDSS images and not SDSS derived photometry) and different methods (Taylor et al., 2011, used a Bayesian method to estimate the parameters of the stellar population). We are not especially concerned by this offset, as the primary use of the stellar masses is to generate matched samples, so as long as we use the same estimate for both the radio galaxies and controls, we should not introduce any bias. However, there are galaxies that scatter far from the one-to-one line (crosses in Fig. 3). Visual inspection of galaxies with spurious stellar masses ( 1.0 dex) usually reveals objects or imaging artefacts that affect the photometry. Because the galaxies with spurious stellar masses (which are 1% of the total GAMA sample) are scattered towards higher stellar masses (see Figs. 2 and 3) this can cause large problems for an analysis of the most massive galaxies, which are uncommon and contain a significant fraction of the radio galaxy population. Therefore we remove all galaxies with spurious stellar masses ( 1.0 dex) from our analysis.
4 Statistical analysis
We compare the environments of LERGs and HERGs to non-radio control samples drawn from the main GAMA sample and matched to the host galaxy properties of LERGs and HERGs. We also investigate the relationship between the environmental properties and radio luminosity by assigning the radio luminosity of the radio galaxy to its matched non-radio control subset.
There are two basic types of environmental metrics in this analysis, those with a continuous distribution (e.g. fifth nearest neighbour density, halo mass etc.) and those with discrete values (e.g. numbers of galaxies in a group or not). The two cases require their own statistical test to quantify the significance of any observed differences.
4.1 Continuous quantities
For environmental metrics with a continuous distribution, we apply a two-sample Kolmogorov-Smirnov test (KS-test) to: (i) the full sample, (ii) galaxies with , and (iii) galaxies with . The value is taken to be approximately the median of the radio galaxy subset, so there is approximately equal numbers of radio galaxies in each radio luminosity bin. We also calculate the (partial and Spearman rank) correlation coefficient between the environmental metric and the radio luminosity for radio galaxies and their control sample, and compare the two correlation coefficients. The comparison of the correlation coefficients is made by comparing the Fisher transform of the two (radio galaxies and their control sample) correlation coefficients, expressed as a -test statistic (i.e. significance) (Fisher, 1925).
4.2 Discrete quantities
For environmental metrics that concern discrete quantities (i.e. success rates), we test the significance between the two rates for: (i) the full sample, (ii) galaxies with , and (iii) galaxies with . We use a Bayesian approach to estimate the significance that two rates are different. Lee & Pope (2006) presented the Bayes factor as a measure of significance for comparing success rates. The Bayes factor for success rates is the ratio between the marginal probability for a model assuming the two rates are the same, , and the marginal probability for a model assuming the two rates are different, . and are marginal probabilities and so are not normalised, but given that the two models are the only plausible models, we obtain normalised probabilities by marginalising the models i.e. . In this paper we will show the normalised probability of the “different rate” model (i.e. , where is the Bayes factor calculated using the relation in Lee & Pope (2006)) and prefer the different rate model if the probability is greater than or equal to 95%.
5 The fifth nearest neighbour density of radio galaxies
The fifth nearest neighbour density, , uses the projected distance, , to a galaxy’s 5th nearest neighbour, and then converts this to a surface density such that
| (1) |
is a valuable environmental metric as it is related to dark matter halo density (Sabater, Best & Argudo-Fernández, 2013), that is well correlated with halo mass (Haas, Schaye & Jeeson-Daniel, 2012). We calculated for all the radio galaxies that have redshifts . A maximum radial velocity separation of km s-1 for the fifth nearest neighbour was applied to limit projection effects (e.g. Rowlands et al., 2012; Brough et al., 2013). The density defining population used to find the 5-th nearest neighbour was a volume limited subset of GAMA galaxies with and . The extended range in redshift accounted for the upper velocity range and (Loveday et al., 2012) accounted for the evolution of as a function of redshift. Additionally, we corrected the calculated density for redshift incompleteness in the GAMA sample and we did not use galaxies for which was greater than the projected distance to the nearest edge of the survey area. Only radio galaxies that are also in the main GAMA sample were included in this analysis.
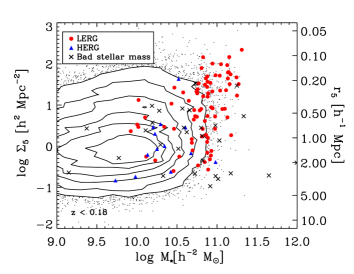
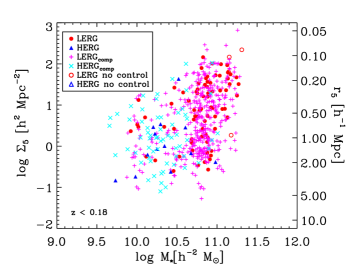
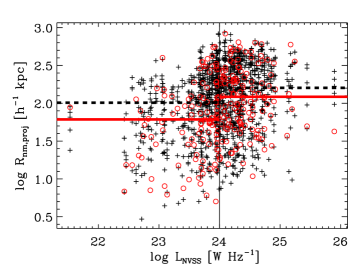
The left panel of Fig. 4 shows against stellar mass for GAMA galaxies with . As in Fig. 2, we can clearly see that LERGs (red points) and HERGs (blue points) cover different ranges in stellar mass, but this figure also shows the relative excess of LERGs in high-density environments. The LERGs and HERGs span a relatively narrow range in stellar mass ( dex), but a much wider range in ( dex). There is also a (weak) correlation of stellar mass and , and it is important to account for this by making comparisons to well-defined control samples.
5.1 The control sample for fifth nearest neighbour analysis
In order to only examine the connection between radio emission and environment, we construct control samples of galaxies without detected radio emission. These are matched to have the same mass and colour as the radio galaxies. We then carry out identical analyses on both the radio galaxies and controls.
We randomly matched each radio galaxy of a particular class to five222Our results did not change when we allowed HERGs and LERGs with a minimum of two controls to remain in the analysis. GAMA non-radio galaxies (i.e. we exclude all radio galaxies from the control sample) with similar values of stellar mass ( dex) and rest-frame colour (). Each control galaxy is assigned the radio luminosity of the radio galaxy that it is matched to. We remove a control galaxy from the selection pool once it has been matched so that it is not repeated. By matching in stellar mass we remove the weak dependence seen between the stellar mass and , while matching in rest-frame colour controls for the known dependence on stellar population with environment (e.g. Balogh et al., 1999). We do not match in redshift, as the density defining population is volume–limited. We removed radio galaxies for which five control GAMA galaxies could not be found, but minimised the number without five matches by allowing those with the fewest possible controls to match first. The matching process was repeated 100 times to create 100 realisations, and the results were recorded for each realisation. In the analysis we will refer to the median values from the 100 realisations, but the figures that we show are for a single random realisation. Table 2 shows the number of HERGs and LERGs in our final analysis. We distinguish between the radio galaxies and the comparison sample by adding the subscript ’comp’ to the class, i.e. Xcomp, where X is HERG or LERG.
5.2 The local density of radio galaxies
The right panel of Fig. 4 shows against stellar mass for the LERGs and HERGs with their control galaxies. Three LERGs were removed because they do not have five non-radio control galaxies (open red circles). Ideally we would like to include these objects, but our aim is to highlight the dependence of environment for radio galaxies beyond the known dependence of stellar mass and stellar population (e.g. Balogh et al., 1999; Kauffmann et al., 2004).
| Median | Median | |||||
|---|---|---|---|---|---|---|
| Class | [W Hz-1] | N | [Mpc-2] | [Mpc-2] | K–S prob | |
| LERG | All | 75 | 0.91 0.11 | 0.66 0.05 | 91.5% | 1.9 |
| LERG | 40 | 0.61 0.15 | 0.56 0.03 | 16.4% | - | |
| LERG | 35 | 1.29 0.12 | 0.79 0.03 | 98.9% | - | |
| HERG | All | 13 | –0.07 0.23 | 0.24 0.11 | 78.9% | 1.1 |
| HERG | 7 | –0.21 0.20 | 0.21 0.07 | 91.4% | - | |
| HERG | 6 | 0.47 0.36 | 0.31 0.07 | 32.5% | - |
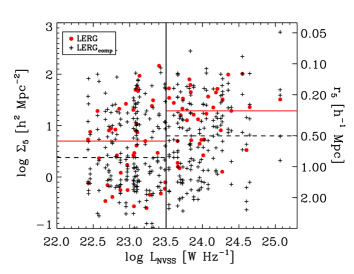
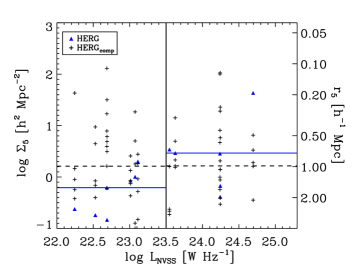
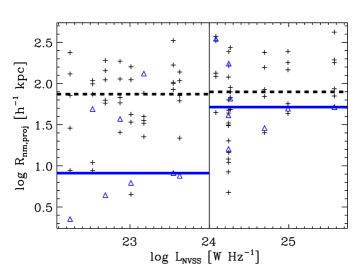
The LERGs lie in higher local densities than their control sample, with the median values for the LERGs and controls being and respectively (see Fig. 5 and Table 2). The medians are different at the level and a KS-test between the LERGs and their controls shows a marginal (91.5 percent significant) difference in .
We then split the sample into two on radio luminosity, at , which is the approximate median luminosity of the sample. The brighter LERGs have a median which is dex higher than their control sample (significant at ). By contrast, fainter LERGs show no significant difference to their controls.
6 Radio galaxies in friends-of-friends groups
We also take a second approach to defining environment, using the GAMA galaxy groups catalogue (Robotham et al., 2011). The group catalogue was built using a Friends-of-Friends (FoF) linking of galaxies within a linear projected separation and radial separation defined by mock catalogues. The original GAMA group catalogue, using just GAMA I data, is described by Robotham et al. (2011). However, in our work we will use a deeper version of the group catalogue using the GAMA II sample that is complete to mag in all three equatorial GAMA fields (GAMA Galaxy Group Catalogue version 6, G3Cv6). The deeper group catalogue allows us to probe lower-mass haloes and increases the multiplicity of existing groups, and hence group properties (e.g. halo mass) are more robust.
6.1 The control sample for group analysis
We construct a control sample by matching each radio galaxy to five non-radio GAMA galaxies that were used in the generation of G3Cv6 and have redshift . The galaxies were again matched in stellar mass ( dex) and rest-frame colour (), but with an additional constraint on the redshift () due to the redshift dependence of the group completeness (Fig. 6). The group luminosity, , is an estimate of the total (rest-frame) -band group luminosity and is calculated for each group by scaling the total observed luminosity with a correction factor to account for undetected faint companions (see Robotham et al., 2011, for further details). As redshift increases, low luminosity/mass groups drop out of the group sample. As before, each control galaxy is assigned the radio luminosity of its matched radio galaxy. Radio galaxies for which we could not find five control galaxies (5 HERGs and 45 LERGs) were not used333Once again, our results did not change when we allowed HERGs and LERGs that had a minimum of two controls to remain in the analysis.. The number of radio galaxies that satisfied our selection criteria and their median stellar mass are shown in Table 3.
6.2 The fraction of radio galaxies in groups
| Median | ||||||
|---|---|---|---|---|---|---|
| Class | [W Hz-1] | N | ||||
| LERG | All | 298 | 10.9 | % | ||
| LERG | 134 | 10.8 | 86.8% | |||
| LERG | 164 | 11.0 | % | |||
| HERG | All | 31 | 10.5 | 19.9% | ||
| HERG | 13 | 10.2 | 32.2% | |||
| HERG | 18 | 10.6 | 25.3% |
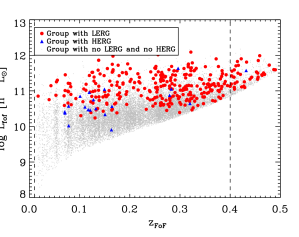
LERGs tend to lie in the most luminous groups, as can be seen in Fig. 6. By contrast, the HERGs are in lower luminosity groups. However, from our analysis above (e.g. see Fig. 4), we know that HERGs also have lower stellar mass. This difference in stellar mass between HERGs and LERGs could be driving the difference in group luminosity.
We find that LERGs are significantly more likely ( percent, , see Table 3) to lie in galaxy groups ( percent are in groups) when compared to a matched radio-quiet control sample ( percent are in groups). We again subdivide the sample into two, based on luminosity. In this case we make the division at , which is the approximate median of the group sample (this is higher than the luminosity of the sample due to the broader redshift range of the groups). We find that only the high-luminosity LERGs (see Table 3) show a significant difference compared to their control sample, with the fraction in a group being and for radio galaxies and controls respectively. This result is qualitatively consistent with the difference in local density seen in §5, again implying that some feature of the group environment acts to enhance the observed radio emission in low-excitation radio galaxies.
The importance of controlling for redshift in our group analysis is highlighted by the fact that the control galaxies for the high luminosity LERGs have a lower group fraction than the controls for the low luminosity LERGs, even though the high luminosity LERGs have higher stellar mass. This is driven by the high luminosity LERGs typically having higher redshift, where only the more massive groups are detected.
We see no difference between the fraction of HERGs and controls in groups, including if we sub-divide by radio luminosity, even though we have a factor of 2 more HERGs than in the sample analysed in §5. However, the small number of HERGs means that this is still not a strong constraint. A difference between the fraction of radio galaxies and controls in groups equal to the result we find for LERGs would only be detectable at the level in the HERGs.
7 The properties of groups hosting radio galaxies
We now investigate the properties of the groups that radio galaxies reside in. We consider the fraction of radio galaxies that are the brightest group member; the fraction of radio galaxies that are the centre galaxy in a group; the linear projected distance between each radio galaxy and the group centre; the dynamical mass of the groups (); and the distance between radio galaxies and their nearest group member.
Now that we are considering the relative difference of radio galaxies to other galaxies in groups, we need to remake our control samples. This time, in addition to the constraints on stellar mass, colour and redshift, we include the further constraint that the control galaxies must also be in a group. All other constraints were the same as in §6.2. The corresponding numbers after the rematching are listed in Table 4.
7.1 The fraction of radio galaxies that are the brightest or central galaxy in a group
The brightest cluster or group galaxy (BCG444Even though many of the GAMA groups have halo masses below the typical halo mass of a cluster (; Eke, Cole & Frenk, 1996; Feretti et al., 2012), we will be consistent with Robotham et al. (2011) and refer to the brightest group/cluster member as the BCG.) is typically the dominant (and possibly central) galaxy of any cluster or group. When we compare the fraction of radio galaxies and controls that are BCGs in a group, we find that there is no significant difference (see Table 4). The most significant difference is between radio–luminous ( W Hz-1 ) LERGs and their controls, but this is only significant at the 90 percent level.
Alternatively to the BCGs, we can examine whether being the galaxy closest to the group centre influences radio properties. The BCG will generally be the most massive galaxy, but it need not be the galaxy in the deepest part of the group potential, although this is more likely when the group is virialized. The central galaxy in each group was determined through an iterative process, where the most distant galaxy from each iteration of the -band centre-of-light calculation, was rejected. The final galaxy that remained in this process became the iterative central galaxy (IterCen) of the group. Robotham et al. (2011) showed that the IterCen provided the best match to the group centres in the mock catalogue, therefore we consider the IterCen as the central galaxy of a group. For low-multiplicity groups however, the group centres may not be well defined (the median membership is about 4 for the radio galaxies and their control samples).
As shown in Table 4, we find that there is no significant difference between the likelihood of a radio galaxy or control galaxy being the central galaxy in a group. This suggests that once mass, colour and redshift are accounted for, there is not a strong preference for radio galaxies to be the most massive or central galaxy in a group.
The fraction of central galaxies estimated here for high mass galaxies (both LERGs and their control sample) is lower than that from halo occupation distribution (HOD) models for galaxies of a similar mass. The typical median stellar mass for our LERGs is M⊙. This is equivalent to an absolute magnitude in the -band of , assuming a mass-to-light ratio of (Kauffmann et al., 2003b). Zehavi et al. (2011) find a satellite fraction of for galaxies brighter than (and for galaxies brighter than ). However, the fitted satellite fraction is a strong function of colour, with Zehavi et al. finding that at the satellite fractions for red–sequence and blue–cloud galaxies are and 0.13 respectively. The LERG population lies almost exclusively on the red sequence so will have a higher satellite fraction than a purely stellar mass limited sample.
The mass threshold for detecting a group also biases the central fraction to be lower, as massive galaxies are more likely to be the central galaxy if they inhabit a lower mass group. However, such biases do not influence our differential tests, as our controls are selected to have the same mass, colour and redshift as the radio-galaxies.
| [W Hz-1] | LERG | LERGcomp | HERG | HERGcomp | ||
|---|---|---|---|---|---|---|
| All | 74.3% | 24.9% | ||||
| 12.7% | 38.2% | |||||
| 90.4% | 35.2% | |||||
| [W Hz-1] | LERG | LERGcomp | HERG | HERGcomp | ||
| All | 40.9% | 26.5% | ||||
| 12.8% | 41.2% | |||||
| 53.7% | 30.8% | |||||
7.2 The fraction of BCGs that are radio galaxies
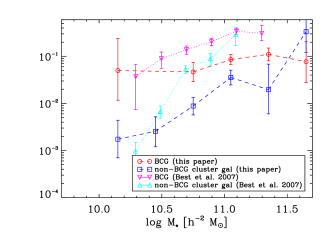
In the previous section we asked the question, what is the fraction of radio galaxies in a group that are the brightest or central galaxy in that group? We can also ask the reverse question; given that a galaxy is a BCG, what is the chance that it is a radio galaxy? Previous studies (e.g. Burns, White & Hough, 1981; Menon & Hickson, 1985) have shown that BCGs in high mass clusters can often host a radio-loud AGN. Best et al. (2007) studied a sample of 625 nearby groups and clusters and showed that BCGs were more likely to host a radio-loud AGN than other galaxies (including those that are non-BCG cluster galaxies). The difference is a factor of ten for galaxies with stellar mass below , but less than a factor of two for stellar masses of . The Best et al. analysis used groups with a median velocity dispersion of km s-1 at (Miller et al., 2005; von der Linden et al., 2007). By comparison the groups in our sample have a median dispersion of km s-1.
We construct a set of volume-limited groups by only using groups with and and calculate the fraction of BCGs and non-BCG group galaxies that host a radio AGN as a function of stellar mass (see Fig. 7). In order to directly compare to the work of Best et al. (2007) in this analysis we combine both HERGs and LERGs into one sample that we simply call radio AGN (although we note that the numbers and trend are dominated by LERGs).
At low stellar masses, our BCGs have a higher probability of hosting a radio AGN than non-BCG cluster galaxies. The probability of the data, given a model where the two fractions are drawn from different distribution, is and for the and stellar mass bins respectively, and drops below 95% for higher stellar mass bins. This is in qualitative agreement with the results of Best et al. (2007), but the fraction of galaxies that are radio AGN in our sample is lower than that found by Best et al. This is not surprising as our sample has a similar radio flux limit to that of Best et al., but a higher median redshift, such that the radio detection rate is on average lower.
7.3 Distance from the group centre
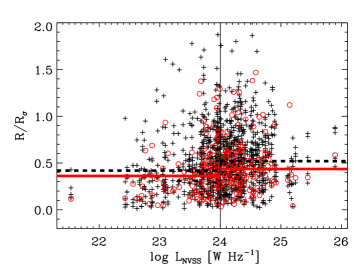
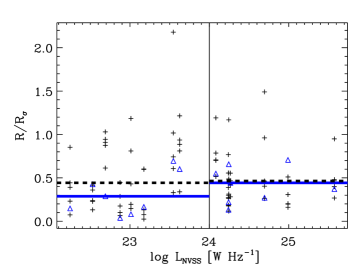
Next we examine the radial position of radio galaxies within the GAMA groups and find that LERGs preferentially lie in the inner regions of the groups compared to their control samples (see Fig. 8). We use the centre-of-light positions (see Robotham et al., 2011) that are not associated with a specific galaxy and measure the projected radial distance of a galaxy, , in units of the radius containing 68 percent of the group members, ). LERGs are preferentially found at smaller radius from the group centre than their controls. A two sample K-S test (Table 5) rejects the null hypothesis that the LERGs and controls are draw from the same sample at the 99.7% level. When we divide the sample in two by luminosity, only the high luminosity ( W Hz-1) LERGs show a significant difference from their controls in radial distribution.
| [W Hz-1] | ||||
|---|---|---|---|---|
| Class | All | ) | ||
| LERG (all group galaxies) | 99.7% (236) | 82.6% (108) | 99.8% (128) | 0.2 |
| HERG (all group galaxies) | 67.3% (16) | 68.5% (8) | 16.0% (8) | 1.3 |
| LERG (non-BCG group galaxies) | 80.2% (53) | 17.5% (29) | 90.4% (24) | 1.0 |
| HERG (non-BCG group galaxies) | 96.9% (6) | - (2) | - (4) | 0.4 |
| LERG (Non-IterCen group galaxies) | 71.3% (63) | 7.6% (30) | 89.2% (33) | 0.4 |
| HERG (Non-IterCen group galaxies) | 98.8% (5) | - (2) | - (3) | 0.3 |
| LERG (BCGs only) | 90.1% (165) | 67.2% (74) | 65.7% (91) | 1.1 |
| LERG (IterCen galaxies only) | 96.3% (156) | 85.0% (73) | 72.1% (84) | 1.0 |
| HERGFIRST (All group galaxies) | 95.6% (53) | 99.2% (25) | 30.6% (28) | 2.4 |
| HERGFIRST (Non-BCG group galaxies) | 92.4% (21) | 94.9% (9) | 41.3% (12) | 0.3 |
| HERGFIRST (Non-IterCen group galaxies) | 90.6% (21) | 94.9% (9) | 32.0% (12) | 0.3 |
The relationship between radio emission and distance from group centre is dominated by the contribution of galaxies that are BCGs. We repeat our radial analysis with the BCG and the IterCen galaxies removed, including also remaking our control samples so that non-radio BCGs and IterCen galaxies are removed. The radial distribution of LERGs no longer shows a significant difference to the control sample once the BCGs and IterCen galaxies are removed. This is not simply caused by the reduced number of LERGs because applying a similar analysis to 25 random LERGs from the full sample (and using their associated control sample) still results in a significant difference for the radial distribution. Thus, the difference in the radial distribution for all LERGs in groups is largely influenced by the subset that are the BCG or the central galaxy of their group.
If we consider only BCGs or central galaxies and test whether there is any preference for those with radio emission to be closer to the group centre, we find a marginally significant difference between the radio galaxies and their controls, at the 96 percent and 90 percent significance level for the IterCen galaxies and BCGs respectively. This suggests a plausible hypothesis that both being the BCG or central galaxy and being close to the centre of the group potential influences radio emission.
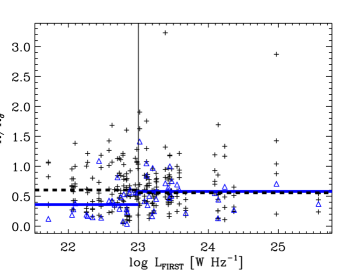
HERGs show no difference in their radial distribution with respect to their control sample, but the sample is small (see Fig. 8, right). To more robustly examine trends in the HERG sample we require a larger sample, as HERGs are intrinsically rarer than LERGs (at least within the redshift range we are probing). To expand the HERG sample we augment them with objects that were detected in FIRST ( mJy limit), but fall below the flux limits applied earlier ( mJy, including the requirement to be detected in NVSS). We denote this revised sample as HERGFIRST. Reapplying our radial distribution analysis to the larger HERGFIRST sample find that HERGs are marginally closer to the centre of their group than their control sample (95 percent significant, see Table 5 and Fig. 9). The difference becomes stronger for the low-luminosity ( W Hz-1) HERGs, at the 99 percent level. Comparison of the Spearman rank correlation coefficients for HERGs and their control sample shows that the dependence of radial distribution on radio luminosity is significant to . Removing the BCGs and IterCen galaxies reduces the significance of the difference for both the full sample and the low-luminosity sub-sample.
7.4 Group mass
Cross-correlation studies of radio galaxies (e.g. Wake et al., 2008; Mandelbaum et al., 2009; Donoso et al., 2010; Lindsay et al., 2014; Lindsay, Jarvis & McAlpine, 2014) have shown that LERGs tend to lie in more massive haloes than radio-quiet galaxies with similar intrinsic properties (e.g. stellar mass, luminosity, redshift).
For a virialized system, the dynamical mass can be estimated as , where and are the radius and velocity dispersion of the group. G3Cv6 group masses were estimated by assuming the group radius to be the radius containing 50% of the group () and adopting the group velocity dispersion () estimated using the Beers, Flynn & Gebhardt (1990) method because it is less sensitive to changes in group membership (). An additional scaling factor was used to calibrate the mass estimates to mock groups from simulations. Thus the dynamical mass estimates have the form .
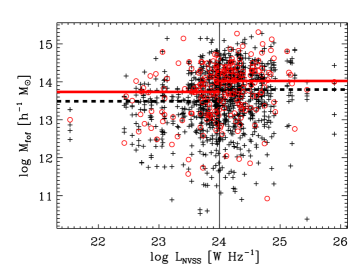
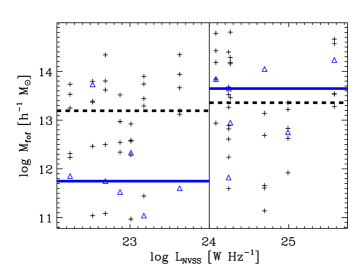
Fig. 10 shows the as a function for radio galaxies and their control samples. The median values of for each class are also listed in Table 6, along with the two-sample KS-test probability of rejecting the null hypothesis that for radio galaxies is drawn from the same distribution as their control samples. Both high- and low- luminosity LERGs are in higher ( dex) halo masses than their control samples, and the difference is significant at for the full sample of LERGs. Similar results are also seen when we compare other proxies for halo mass e.g. and .
The HERG population inhabits lower mass haloes than their control sample, but the difference is not statistically significant unless we subdivide the sample by luminosity. Low-luminosity HERGs tend to lie in lower mass haloes than their control sample (99 percent significant), but note that the sample is small with only 7 HERGs in the low-luminosity bin. When considering the expanded HERGFIRST sample the halo mass of HERGs was no longer statistically different to their controls.
| Class | [W Hz-1] | [] | [] | K–S prob | K–S prob | K–S prob | ||||
|---|---|---|---|---|---|---|---|---|---|---|
| LERG | All | 226 | 13.9 | 13.7 | 99.9% | 0.9 | 91.0% | 1.0 | 99.9% | 0.4 |
| LERG | 106 | 13.7 | 13.6 | 96.9% | - | 96.6% | - | 99.8% | - | |
| LERG | 120 | 14.0 | 13.8 | 98.0% | - | 14.2% | - | 92.9% | - | |
| HERG | All | 14 | 12.7 | 13.3 | 92.2% | 1.3 | 99.4% | 0.8 | 98.9% | 1.3 |
| HERG | 7 | 11.7 | 13.1 | 99.6% | - | 93.3% | - | 99.4% | - | |
| HERG | 7 | 13.6 | 13.4 | 12.3% | - | 93.3% | - | 68.5% | - |
7.5 Distance to nearest member
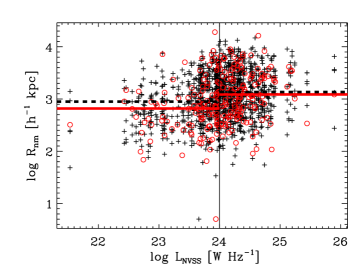
Within each group we find the distance to the nearest group member, to test for evidence that galaxy–galaxy interactions play a role in radio galaxy triggering. For each group galaxy, we find the distance to the nearest group member that it is linked with (see Robotham et al., 2011, for linking definitions). We use both a projected angular distance (converted to comoving distance based on the mean redshift of the pair), , and a three-dimensional distance, , that is the quadrature sum of the projected and radial separations in comoving coordinates. As we are only using galaxies that are already associated with each other via the group catalogue, gross projection effects should be minimised in these nearest neighbour distance estimates. The three-dimensional distance may be influenced by peculiar motions that will be increasingly important in higher mass groups. For 28 percent of GAMA group galaxies the and distances give a different nearest neighbour.
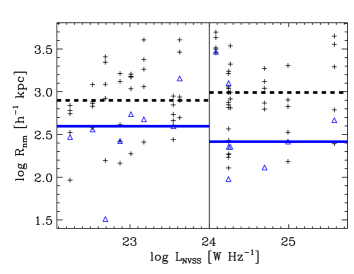
We find that LERGs have significantly closer nearest neighbours than their controls, at the 99 percent significance level (for , this drops to 91 percent for ). The difference in distance is dex (see Fig. 11 and Table 6). The difference is less significant for the three–dimensional distance and this is likely caused by the relatively high peculiar velocities in the high mass groups that host LERGs.
The HERGs have closer nearest neighbours than their control samples, irrespective of the distance estimate used ( percent in both cases). The most significant difference is found for the low luminosity HERGs, although there is no significant correlation between distance and radio luminosity. As HERGs lie in lower mass groups, the influence of peculiar motions on the three–dimensional distance should be less than for the LERGs. These results suggest that both LERG and HERG activity may be enhanced interactions with other galaxies.
8 Discussion
It is increasingly clear that there are fundamental differences in the properties of radio galaxies with and without strong emission lines (i.e. HERGs and LERGs). The differences span a range of properties including stellar mass (e.g. Kauffmann, Heckman & Best, 2008; Best & Heckman, 2012), stellar population (e.g. Herbert et al., 2010) and environment (e.g. Best, 2004; Tasse et al., 2008; Sabater, Best & Argudo-Fernández, 2013), and cannot be simply explained by a unified model.
We have used data from the GAMA survey, with radio galaxies identified in the LARGESS sample, to explore the environments of HERGs and LERGs. The GAMA survey targets fainter galaxies than SDSS (Fig. 2) and has high completeness (98.5 percent Liske et al., 2015), even for galaxies in high density regions. As a result we are able to probe lower halo masses and extend our environmental measures to higher redshifts. Our radio galaxy sample is flux limited in the SDSS -band and does not have any colour selection applied, unlike some previous surveys that used colour cuts to target specific sub-samples e.g. luminous red galaxies (LRGs) (Cannon et al., 2006) or quasars (Croom et al., 2004, 2009). This ensures that we sample a broad range of radio galaxies.
8.1 The role of halo mass
We have shown that the local density () and the fraction in groups are both significantly higher for high-luminosity LERGs than for their control sample. In contrast, the HERGs and low-luminosity LERGs show no significant difference in either the distribution or the fraction in groups when compared to their control samples. This confirms, at higher redshift (and with a larger sample), the results from Sabater, Best & Argudo-Fernández (2013) and Best (2004).
Our results imply that high-luminosity LERGs are preferentially found in more massive haloes than non-radio galaxies of similar stellar mass. The high fraction of high-luminosity LERGs in groups also points towards a higher average halo mass for this population, because there is a minimum mass for the groups used in this analysis. Galaxies hosted by lower mass halos would not be found in the group catalogue. Hence, both environmental measurements are proxies for the halo mass.
HERGs and low-luminosity LERGs, on the other hand, lie in halos that are similar in mass to non-radio galaxies of similar stellar mass. Because we make this comparison to stellar mass matched samples, the difference between HERGs and LERGs is not simply due to them having different stellar masses.
Cross-correlation studies of radio galaxies (e.g. Wake et al., 2008; Mandelbaum et al., 2009; Donoso et al., 2010) have shown that radio-loud LRGs (analogous to LERGs) are in more massive haloes than non-radio galaxies of similar stellar mass, which is in agreement with our results on and group fraction. Also in agreement with our work, Gendre et al. (2013) use a sample of radio galaxies to show that LERGs have denser average environments than HERGs, although there is no direct control for stellar mass in their work. Ineson et al. (2015) use a powerful alternative approach to show that the X-ray luminosity of groups and clusters hosting LERGs is positively correlated with radio luminosity, also supporting the environmental dependence of LERGs.
The preference of high-luminosity LERGs for higher mass haloes is confirmed by a comparison to a matched sample that are also in GAMA groups. Groups hosting high-luminosity LERGs are 0.2 dex higher in mass than the groups hosting control galaxies, and the difference is significant at the 98 percent level. The difference is less (0.1 dex), but still significant (97 percent) for low-luminosity LERGs. The difference in halo mass is a lower limit to the true difference, as in this measurement we only include those galaxies detected in GAMA groups and more control galaxies than LERGs lie in haloes below the GAMA group mass limits.
8.2 The Triggering of LERGs
High-mass haloes have cooling times that can be much longer than a dynamical time, so they are expected to have a smaller fraction of gas in a cold phase. For example, in the simulations of Kereš et al. (2009) haloes of mass of have percent of gas colder than 250,000 K, but this drops to percent for a halo mass of . This is qualitatively consistent with observations: for example massive elliptical galaxies and FRI radio galaxies typically have relatively little Hi gas (Knapp, Kerr & Williams, 1978; Morganti et al., 2001; Serra et al., 2012). The lack of star formation in the LERG population also points to a deficit of cold gas and their stellar mass () is in the regime where cold gas accretion is not expected to be important (e.g. Kereš et al., 2005).
The supply of gas in LERGs could come from gas that is cooling from the virial temperature within the hot halo, and this is sufficient to power LERGs (Hardcastle, Evans & Croston, 2007). We find a marginal tendency (90 to 96 percent significant) for LERGs to be closer to the centre-of-light of a group, even when we control for them being the BCG or central galaxy. Being in the centre of the group would also naturally lead to our discovery that LERGs are typically closer to their nearest neighbours than control galaxies. If confirmed, this could imply that LERGs inhabit more dynamically evolved groups, where the radio-galaxy has had greater time to sink to the bottom of the gravitational potential via dynamical friction. Such a location could lead to a higher accretion rate, or alternatively the higher density hot gas could provide a better working surface for the radio jet. Ineson et al. (2015) argue that the correlation found between environment and luminosity in LERGs is more likely due to fuelling, as the luminosity boosting by providing a better working surface for the jet should be equally present in the HERG population, but is not seen.
LERGs with higher radio luminosities are more strongly influenced by their environment, but environment still appears to play a role in lower luminosity objects. For example, while there is no significant difference between low-luminosity LERGs and controls for or group fraction, there is a small but significant difference in group mass. However, the fact that not all LERGs are in high density environments [the median is , but 12/75 LERGs have ] means that other factors must also play a role. These could include galaxy-galaxy interactions (e.g. Sabater, Best & Argudo-Fernández, 2013) driving small amounts of gas onto the nucleus, or internal stochastic gas accretion events.
The increasing fraction of radio galaxies (dominated by LERGs) at high stellar mass [e.g. Fig. 7, and also see Best et al. (2007)] implies a higher duty cycle. This makes it easier for LERGs to provide the maintenance–mode feedback in galaxy formation models and is consistent with the high fraction of radio galaxies in cool–core clusters (e.g. Dunn & Fabian, 2006).
8.3 The Triggering of HERGs
HERGs are found in similar large-scale over-densities to non-radio galaxies matched in stellar mass and colour. When we compared HERGs and control galaxies that are both in groups, however, we found that the distance to the nearest group member is significantly shorter for HERGs than their control sample. This could be evidence that HERGs are influenced by galaxy-galaxy interaction. If so, it supports the claims (e.g. Hardcastle, Evans & Croston, 2007; Best & Heckman, 2012) that HERGs might be triggered by mergers or interactions, which cause cold gas (from either the host galaxy or the interacting galaxy) to flow into the SMBH. Ramos Almeida et al. (2012) finds the fraction of luminous radio galaxies (of which 76 percent are HERGs in their sample) that show strong tidal features is significantly larger than for quiescent galaxies, supporting the merger/interaction triggering hypothesis. The lower space density of HERGs (e.g. Pracy et al., 2016), combined with their lower typical stellar mass (e.g. Fig. 3), suggests that they have a much lower duty cycle than the LERG population. This points to HERG activity being a transient phenomenon.
One surprising result is that low luminosity HERGs have a much lower (by 1.4 dex) median group mass than their control sample. These low luminosity HERGs also have nearest neighbours that are much closer (see Fig. 11 and Table 6) In contrast, every other sample shows an increase in group mass compared to a control sample. This could be because the low radio luminosity HERGs are contaminated by galaxies that are not true radio-AGN, but galaxies where star formation dominates the radio emission. These contaminating galaxies may still show AGN signatures in the optical, but are dominated by star formation at radio wavelengths. As discussed by Pracy et al. (2016), there is no easy solution to this problem. Approaches such as those taken by Best & Heckman (2012), who use the strength of the D4000 spectral feature to discriminate between star formation and AGN, lead to the rejection of large numbers of HERGs which have bluer (and therefore younger) stellar populations than LERGs (Herbert et al., 2010). We have inspected the radio morphology of the low luminosity HERGs to see if they show evidence of the radio emission being due to a star–forming disk, however all but one of these objects is a point source in FIRST. One galaxy does have extended flux in the radio, but with an orientation that is offset by from the optical major axis of the galaxy. Therefore, from the radio morphology it is inconclusive whether the HERGs are contaminated by star–forming galaxies.
8.4 Dependence on galaxy morphology
If the radio galaxies and controls have a different morphological mix the above results could be due to morphology, rather than radio emission. Worpel et al. (2013) studied the environment (via the two-point cross-correlation and counts-in-cylinders) of a sample of local elliptical radio galaxies (selected using colour and visual morphology) from the Mauch & Sadler (2007) sample. They compare the radio galaxies to a control sample matched in redshift, colour, magnitude and morphology drawn from the 6-degree Field Galaxy Survey (6dFGS; Jones et al., 2004). Worpel et al. find no statistical difference between radio galaxies and controls using the two-point cross-correlation function, in apparent conflict with other studies (e.g. Wake et al., 2008; Donoso et al., 2010). Worpel et al. (2013) argue that this may be driven by contamination from late-type galaxies in other samples. As a result, we should consider whether host morphology can influence our results.
We repeat our fraction-in-group analysis with disk-like galaxies removed from both the LERGs and controls. As a morphology proxy we use the concentration index , where and are the radii containing 90% and 50% of the -band Petrosian flux respectively(Strateva et al., 2001; Shimasaku et al., 2001). Values of and correspond to de Vaucouleurs (early-type) and exponential disk (late-type) profiles respectively. We repeat our measurements using only galaxies with and find that in each case there is a significantly higher fraction () of LERGs in groups than the controls. For the significance is as the sample size is reduced to (or galaxies).
As a second test for the impact of morphology we add as an additional parameter for selecting control galaxies. Again, we still find that a higher fraction of LERGs are in groups than their controls, although the significance drops from to .
We conclude that morphology is not the main factor that produces the observed differences between radio galaxies and their controls. We note that when Worpel et al. takes a deeper look at the environment around their radio galaxies (by using SDSS imaging) they find tentative evidence for larger numbers of satellite galaxies around their radio-galaxies than their controls. This suggests that observations which are deeper than the typical magnitude of the radio galaxy (such as that available in our GAMA sample) are important for clearly discriminating environmental trends.
9 Summary
Using a sample of LARGESS radio galaxies in the GAMA survey, we have conducted a detailed study of environment for high- and low- excitation radio galaxies at redshifts up to 0.4. In addition to the redshift range, other advantages of our sample compared to previous studies is the base GAMA sample and the radio galaxy selection method. The base GAMA galaxy sample provides a large, deep and complete sample of galaxies to measure galaxy environments and provide control samples. As with the radio galaxy sample from Best & Heckman (2012), our radio galaxies are selected without any colour selection (unlike other samples e.g. Sadler et al. 2007; Donoso, Best & Kauffmann 2009) and enables us to have a more complete range of radio galaxies.
9.1 The environments of low-excitation radio galaxies (LERGS)
Our results suggest that the high-luminosity radio galaxies with weak or no emission lines (LERGs) lie in more massive haloes than non-radio galaxies of similar stellar mass and colour, which is consistent with previous studies (e.g. Best, 2004; Wake et al., 2008; Mandelbaum et al., 2009; Donoso et al., 2010). We do not see this difference in halo mass for low-luminosity LERGs, except when we only compare those in groups, in which case, low-luminosity LERGs are also in higher mass haloes than their control sample.
Once we control for stellar mass, colour and group membership, LERGs lie slightly closer to the centre of their group than non-radio galaxies. There is weak evidence that this difference in radial distribution is due to the most central galaxy (which we have defined as the iterative central galaxy or IterCen) and possibly BCGs. LERGs that are the IterCen and BCGs of their groups, lie slightly closer to the group centre than non-radio IterCen galaxies and BCGs, but this difference is only marginally significant. Together these facts support the idea (e.g. Best, 2004) that the environment plays a role in triggering or providing a better working surface for the jets of LERGs.
9.2 The environments of high-excitation radio galaxies (HERGs)
Radio galaxies with strong optical emission lines (HERGs) have similar environments to non-radio galaxies of equal stellar mass and colour. The HERGs are typically in lower mass haloes than LERGs, consistent with them also having lower stellar masses than LERGs. Previous studies (e.g. Best, 2004; Sabater, Best & Argudo-Fernández, 2013), using lower redshift samples, have also shown that LERGs have a preference for high mass haloes, while such a dependence is absent in HERGs. Within galaxy groups, we find that HERGs have a closer nearest neighbours and lower halo masses than their controls, but that this is dominated by HERGs with low radio luminosity. We argue that this result could be influenced by contamination by galaxies where the radio emission is dominated by star formation.
Acknowledgements
JHYC would like to acknowledge the funding provided by the University of Sydney via the Australian Postgraduate Award, the Postgraduate Research Scholarship Scheme and the William & Catherine McIlrath Scholarship. JHYC would also like to acknowledge the support provided by the Astronomical Society of Australia. EMS and SMC acknowledge the financial support of the Australian Research Council under the grants DP1093086 and DP130103198. SMC acknowledges the support of an Australian Research Council Future Fellowship (FT100100457). We thank Philip Best for valuable input into this work.
GAMA is a joint European-Australasian project based around a spectroscopic campaign using the Anglo-Australian Telescope. The GAMA input catalogue is based on data taken from the Sloan Digital Sky Survey and the UKIRT Infrared Deep Sky Survey. Complementary imaging of the GAMA regions is being obtained by a number of independent survey programs including GALEX MIS, VST KIDS, VISTA VIKING, WISE, Herschel-ATLAS, GMRT and ASKAP providing UV to radio coverage. GAMA is funded by the STFC (UK), the ARC (Australia), the AAO, and the participating institutions. The GAMA website is http://www.gama-survey.org/.
Funding for the SDSS and SDSS-II has been provided by the Alfred P. Sloan Foundation, the Participating Institutions, the National Science Foundation, the U.S. Department of Energy, the National Aeronautics and Space Administration, the Japanese Monbukagakusho, the Max Planck Society, and the Higher Education Funding Council for England. The SDSS Web Site is http://www.sdss.org/.
The SDSS is managed by the Astrophysical Research Consortium for the Participating Institutions. The Participating Institutions are the American Museum of Natural History, Astrophysical Institute Potsdam, University of Basel, University of Cambridge, Case Western Reserve University, University of Chicago, Drexel University, Fermilab, the Institute for Advanced Study, the Japan Participation Group, Johns Hopkins University, the Joint Institute for Nuclear Astrophysics, the Kavli Institute for Particle Astrophysics and Cosmology, the Korean Scientist Group, the Chinese Academy of Sciences (LAMOST), Los Alamos National Laboratory, the Max-Planck-Institute for Astronomy (MPIA), the Max- Planck-Institute for Astrophysics (MPA), New Mexico State University, Ohio State University, University of Pittsburgh, University of Portsmouth, Princeton University, the United States Naval Observatory, and the University of Washington.
References
- Adelman-McCarthy et al. (2008) Adelman-McCarthy J. K. et al., 2008, ApJS, 175, 297
- Baldry et al. (2010) Baldry I. K. et al., 2010, MNRAS, 404, 86
- Baldwin, Phillips & Terlevich (1981) Baldwin J. A., Phillips M. M., Terlevich R., 1981, PASP, 93, 5
- Balogh et al. (1999) Balogh M. L., Morris S. L., Yee H. K. C., Carlberg R. G., Ellingson E., 1999, ApJ, 527, 54
- Becker, White & Helfand (1995) Becker R. H., White R. L., Helfand D. J., 1995, ApJ, 450, 559
- Beers, Flynn & Gebhardt (1990) Beers T. C., Flynn K., Gebhardt K., 1990, AJ, 100, 32
- Best (2004) Best P. N., 2004, MNRAS, 351, 70
- Best & Heckman (2012) Best P. N., Heckman T. M., 2012, MNRAS, 421, 1569
- Best et al. (2005) Best P. N., Kauffmann G., Heckman T. M., Brinchmann J., Charlot S., Ivezić Ž., White S. D. M., 2005, MNRAS, 362, 25
- Best et al. (2007) Best P. N., von der Linden A., Kauffmann G., Heckman T. M., Kaiser C. R., 2007, MNRAS, 379, 894
- Bîrzan et al. (2004) Bîrzan L., Rafferty D. A., McNamara B. R., Wise M. W., Nulsen P. E. J., 2004, ApJ, 607, 800
- Blanton & Roweis (2007) Blanton M. R., Roweis S., 2007, AJ, 133, 734
- Bower et al. (2006) Bower R. G., Benson A. J., Malbon R., Helly J. C., Frenk C. S., Baugh C. M., Cole S., Lacey C. G., 2006, MNRAS, 370, 645
- Brough et al. (2013) Brough S. et al., 2013, MNRAS, 435, 2903
- Burns, White & Hough (1981) Burns J. O., White R. A., Hough D. H., 1981, AJ, 86, 1
- Burton et al. (2013) Burton C. S. et al., 2013, MNRAS, 433, 771
- Cannon et al. (2006) Cannon R. et al., 2006, MNRAS, 372, 425
- Ching et al. (2017) Ching J. H. Y. et al., 2017, MNRAS, 464, 1306
- Colless et al. (2001) Colless M. et al., 2001, MNRAS, 328, 1039
- Condon et al. (1998) Condon J. J., Cotton W. D., Greisen E. W., Yin Q. F., Perley R. A., Taylor G. B., Broderick J. J., 1998, AJ, 115, 1693
- Croom et al. (2009) Croom S. M. et al., 2009, MNRAS, 392, 19
- Croom et al. (2004) Croom S. M., Smith R. J., Boyle B. J., Shanks T., Miller L., Outram P. J., Loaring N. S., 2004, MNRAS, 349, 1397
- Croton et al. (2006) Croton D. J. et al., 2006, MNRAS, 365, 11
- Donoso, Best & Kauffmann (2009) Donoso E., Best P. N., Kauffmann G., 2009, MNRAS, 392, 617
- Donoso et al. (2010) Donoso E., Li C., Kauffmann G., Best P. N., Heckman T. M., 2010, MNRAS, 407, 1078
- Dressler (1980) Dressler A., 1980, ApJ, 236, 351
- Drinkwater et al. (2010) Drinkwater M. J. et al., 2010, MNRAS, 401, 1429
- Driver et al. (2011) Driver S. P. et al., 2011, MNRAS, 413, 971
- Dunn & Fabian (2006) Dunn R. J. H., Fabian A. C., 2006, MNRAS, 373, 959
- Eke, Cole & Frenk (1996) Eke V. R., Cole S., Frenk C. S., 1996, MNRAS, 282, 263
- Fabbiano, Gioia & Trinchieri (1989) Fabbiano G., Gioia I. M., Trinchieri G., 1989, ApJ, 347, 127
- Fabian (1994) Fabian A. C., 1994, ARA&A, 32, 277
- Fanaroff & Riley (1974) Fanaroff B. L., Riley J. M., 1974, MNRAS, 167, 31P
- Feretti et al. (2012) Feretti L., Giovannini G., Govoni F., Murgia M., 2012, A&A Rev., 20, 54
- Fisher (1925) Fisher R. A., 1925, Statistical methods for research workers, Biological monographs and manuals. Oliver and Boyd
- Gendre et al. (2013) Gendre M. A., Best P. N., Wall J. V., Ker L. M., 2013, MNRAS, 430, 3086
- Haas, Schaye & Jeeson-Daniel (2012) Haas M. R., Schaye J., Jeeson-Daniel A., 2012, MNRAS, 419, 2133
- Hardcastle, Evans & Croston (2007) Hardcastle M. J., Evans D. A., Croston J. H., 2007, MNRAS, 376, 1849
- Herbert et al. (2010) Herbert P. D., Jarvis M. J., Willott C. J., McLure R. J., Mitchell E., Rawlings S., Hill G. J., Dunlop J. S., 2010, MNRAS, 406, 1841
- Hine & Longair (1979) Hine R. G., Longair M. S., 1979, MNRAS, 188, 111
- Hopkins et al. (2013) Hopkins A. M. et al., 2013, MNRAS, 430, 2047
- Hopkins et al. (2003) —, 2003, ApJ, 599, 971
- Ineson et al. (2015) Ineson J., Croston J. H., Hardcastle M. J., Kraft R. P., Evans D. A., Jarvis M., 2015, MNRAS, 453, 2682
- Janssen et al. (2012) Janssen R. M. J., Röttgering H. J. A., Best P. N., Brinchmann J., 2012, A&A, 541, A62
- Jones et al. (2004) Jones D. H. et al., 2004, MNRAS, 355, 747
- Kauffmann, Heckman & Best (2008) Kauffmann G., Heckman T. M., Best P. N., 2008, MNRAS, 384, 953
- Kauffmann et al. (2003a) Kauffmann G. et al., 2003a, MNRAS, 346, 1055
- Kauffmann et al. (2003b) —, 2003b, MNRAS, 341, 33
- Kauffmann et al. (2004) Kauffmann G., White S. D. M., Heckman T. M., Ménard B., Brinchmann J., Charlot S., Tremonti C., Brinkmann J., 2004, MNRAS, 353, 713
- Kereš et al. (2009) Kereš D., Katz N., Fardal M., Davé R., Weinberg D. H., 2009, MNRAS, 395, 160
- Kereš et al. (2005) Kereš D., Katz N., Weinberg D. H., Davé R., 2005, MNRAS, 363, 2
- Knapp, Kerr & Williams (1978) Knapp G. R., Kerr F. J., Williams B. A., 1978, ApJ, 222, 800
- Lee & Pope (2006) Lee M. D., Pope K. J., 2006, Journal of Mathematical Psychology, 50, 193
- Lewis et al. (2002) Lewis I. et al., 2002, MNRAS, 334, 673
- Lindsay, Jarvis & McAlpine (2014) Lindsay S. N., Jarvis M. J., McAlpine K., 2014, MNRAS, 440, 2322
- Lindsay et al. (2014) Lindsay S. N. et al., 2014, MNRAS, 440, 1527
- Liske et al. (2015) Liske J. et al., 2015, MNRAS, 452, 2087
- Loveday et al. (2012) Loveday J. et al., 2012, MNRAS, 420, 1239
- Mandelbaum et al. (2009) Mandelbaum R., Li C., Kauffmann G., White S. D. M., 2009, MNRAS, 393, 377
- Mauch & Sadler (2007) Mauch T., Sadler E. M., 2007, MNRAS, 375, 931
- McLure et al. (1999) McLure R. J., Kukula M. J., Dunlop J. S., Baum S. A., O’Dea C. P., Hughes D. H., 1999, MNRAS, 308, 377
- McLure et al. (2004) McLure R. J., Willott C. J., Jarvis M. J., Rawlings S., Hill G. J., Mitchell E., Dunlop J. S., Wold M., 2004, MNRAS, 351, 347
- McNamara & Nulsen (2007) McNamara B. R., Nulsen P. E. J., 2007, ARA&A, 45, 117
- McNamara et al. (2005) McNamara B. R., Nulsen P. E. J., Wise M. W., Rafferty D. A., Carilli C., Sarazin C. L., Blanton E. L., 2005, Nature, 433, 45
- McNamara et al. (2000) McNamara B. R. et al., 2000, ApJ, 534, L135
- Menon & Hickson (1985) Menon T. K., Hickson P., 1985, ApJ, 296, 60
- Miller et al. (2005) Miller C. J. et al., 2005, AJ, 130, 968
- Morganti et al. (2001) Morganti R., Oosterloo T. A., Tadhunter C. N., van Moorsel G., Killeen N., Wills K. A., 2001, MNRAS, 323, 331
- Pracy et al. (2016) Pracy M. B. et al., 2016, MNRAS, 460, 2
- Prestage & Peacock (1988) Prestage R. M., Peacock J. A., 1988, MNRAS, 230, 131
- Ramos Almeida et al. (2012) Ramos Almeida C. et al., 2012, MNRAS, 419, 687
- Robotham et al. (2011) Robotham A. S. G. et al., 2011, MNRAS, 416, 2640
- Rowlands et al. (2012) Rowlands K. et al., 2012, MNRAS, 419, 2545
- Sabater, Best & Argudo-Fernández (2013) Sabater J., Best P. N., Argudo-Fernández M., 2013, MNRAS, 430, 638
- Sadler et al. (2007) Sadler E. M. et al., 2007, MNRAS, 381, 211
- Saunders, Cannon & Sutherland (2004) Saunders W., Cannon R., Sutherland W., 2004, Anglo-Australian Observatory Epping Newsletter, 106, 16
- Serra et al. (2012) Serra P. et al., 2012, MNRAS, 422, 1835
- Sharp et al. (2006) Sharp R. et al., 2006, in Proc. SPIE, Vol. 6269, Society of Photo-Optical Instrumentation Engineers (SPIE) Conference Series, p. 62690G
- Shimasaku et al. (2001) Shimasaku K. et al., 2001, AJ, 122, 1238
- Strateva et al. (2001) Strateva I. et al., 2001, AJ, 122, 1861
- Tasse et al. (2008) Tasse C., Best P. N., Röttgering H., Le Borgne D., 2008, A&A, 490, 893
- Taylor et al. (2011) Taylor E. N. et al., 2011, MNRAS, 418, 1587
- Taylor et al. (1996) Taylor G. L., Dunlop J. S., Hughes D. H., Robson E. I., 1996, MNRAS, 283, 930
- Urry & Padovani (1995) Urry C. M., Padovani P., 1995, PASP, 107, 803
- van de Voort & Schaye (2012) van de Voort F., Schaye J., 2012, MNRAS, 423, 2991
- Vanden Berk et al. (2001) Vanden Berk D. E. et al., 2001, AJ, 122, 549
- von der Linden et al. (2007) von der Linden A., Best P. N., Kauffmann G., White S. D. M., 2007, MNRAS, 379, 867
- Wake et al. (2008) Wake D. A., Croom S. M., Sadler E. M., Johnston H. M., 2008, MNRAS, 391, 1674
- Wijesinghe et al. (2012) Wijesinghe D. B. et al., 2012, MNRAS, 423, 3679
- Worpel et al. (2013) Worpel H., Brown M. J. I., Jones D. H., Floyd D. J. E., Beutler F., 2013, ApJ, 772, 64
- York et al. (2000) York D. G. et al., 2000, AJ, 120, 1579
- Zehavi et al. (2011) Zehavi I. et al., 2011, ApJ, 736, 59
- Zirbel (1997) Zirbel E. L., 1997, ApJ, 476, 489