Time Accuracy Analysis of Post-Mediation Packet-Switched Charging Data Records
for Urban Mobility Applications
Abstract
Telecommunication data is being used increasingly in urban mobility applications around the world. Despite its ubiquity and usefulness, technical difficulties arise when using Packet-Switched Charging Data Records (CDR), since its main purpose was not intended for this kind of applications. Due to its particular nature, a trade-off must be considered between accessibility and time accuracy when using this data. On the one hand, to obtain highly accurate timestamps, huge amounts of network-level CDR must be extracted and stored. This task is very difficult and expensive since highly critical network node applications can be compromised in the data extraction and storage. On the other hand, post-mediation CDR can be easily accessed since no network node application is involved in its analysis. The pay-off is in the lower accurate timestamps recorded, since several aggregations and filtering is performed in previous steps of the charging pipelines. In this work, a detailed description of the timestamp error problem using post-mediation CDR is presented, together with a methodology to analyze error time series collected in each network cell.
I Introduction
In the context of mobile telecommunications, Charging Data Records (CDR) are one of the most essential datasets generated and processed by a service provider. Circuit and packet switched events (Voice, SMS, IP, VoIP and similar) are registered by many components of the core network, generating a wide range of CDR types for different purposes. In terms of volume, the amount of CDR generated by packet switched events (related with Internet traffic and services) is several orders of magnitude larger than the circuit switched counterparts (Voice, SMS). According to [1], a simplified diagram of the core network components and connections involved in the packet switched traffic is depicted in Fig. 1.
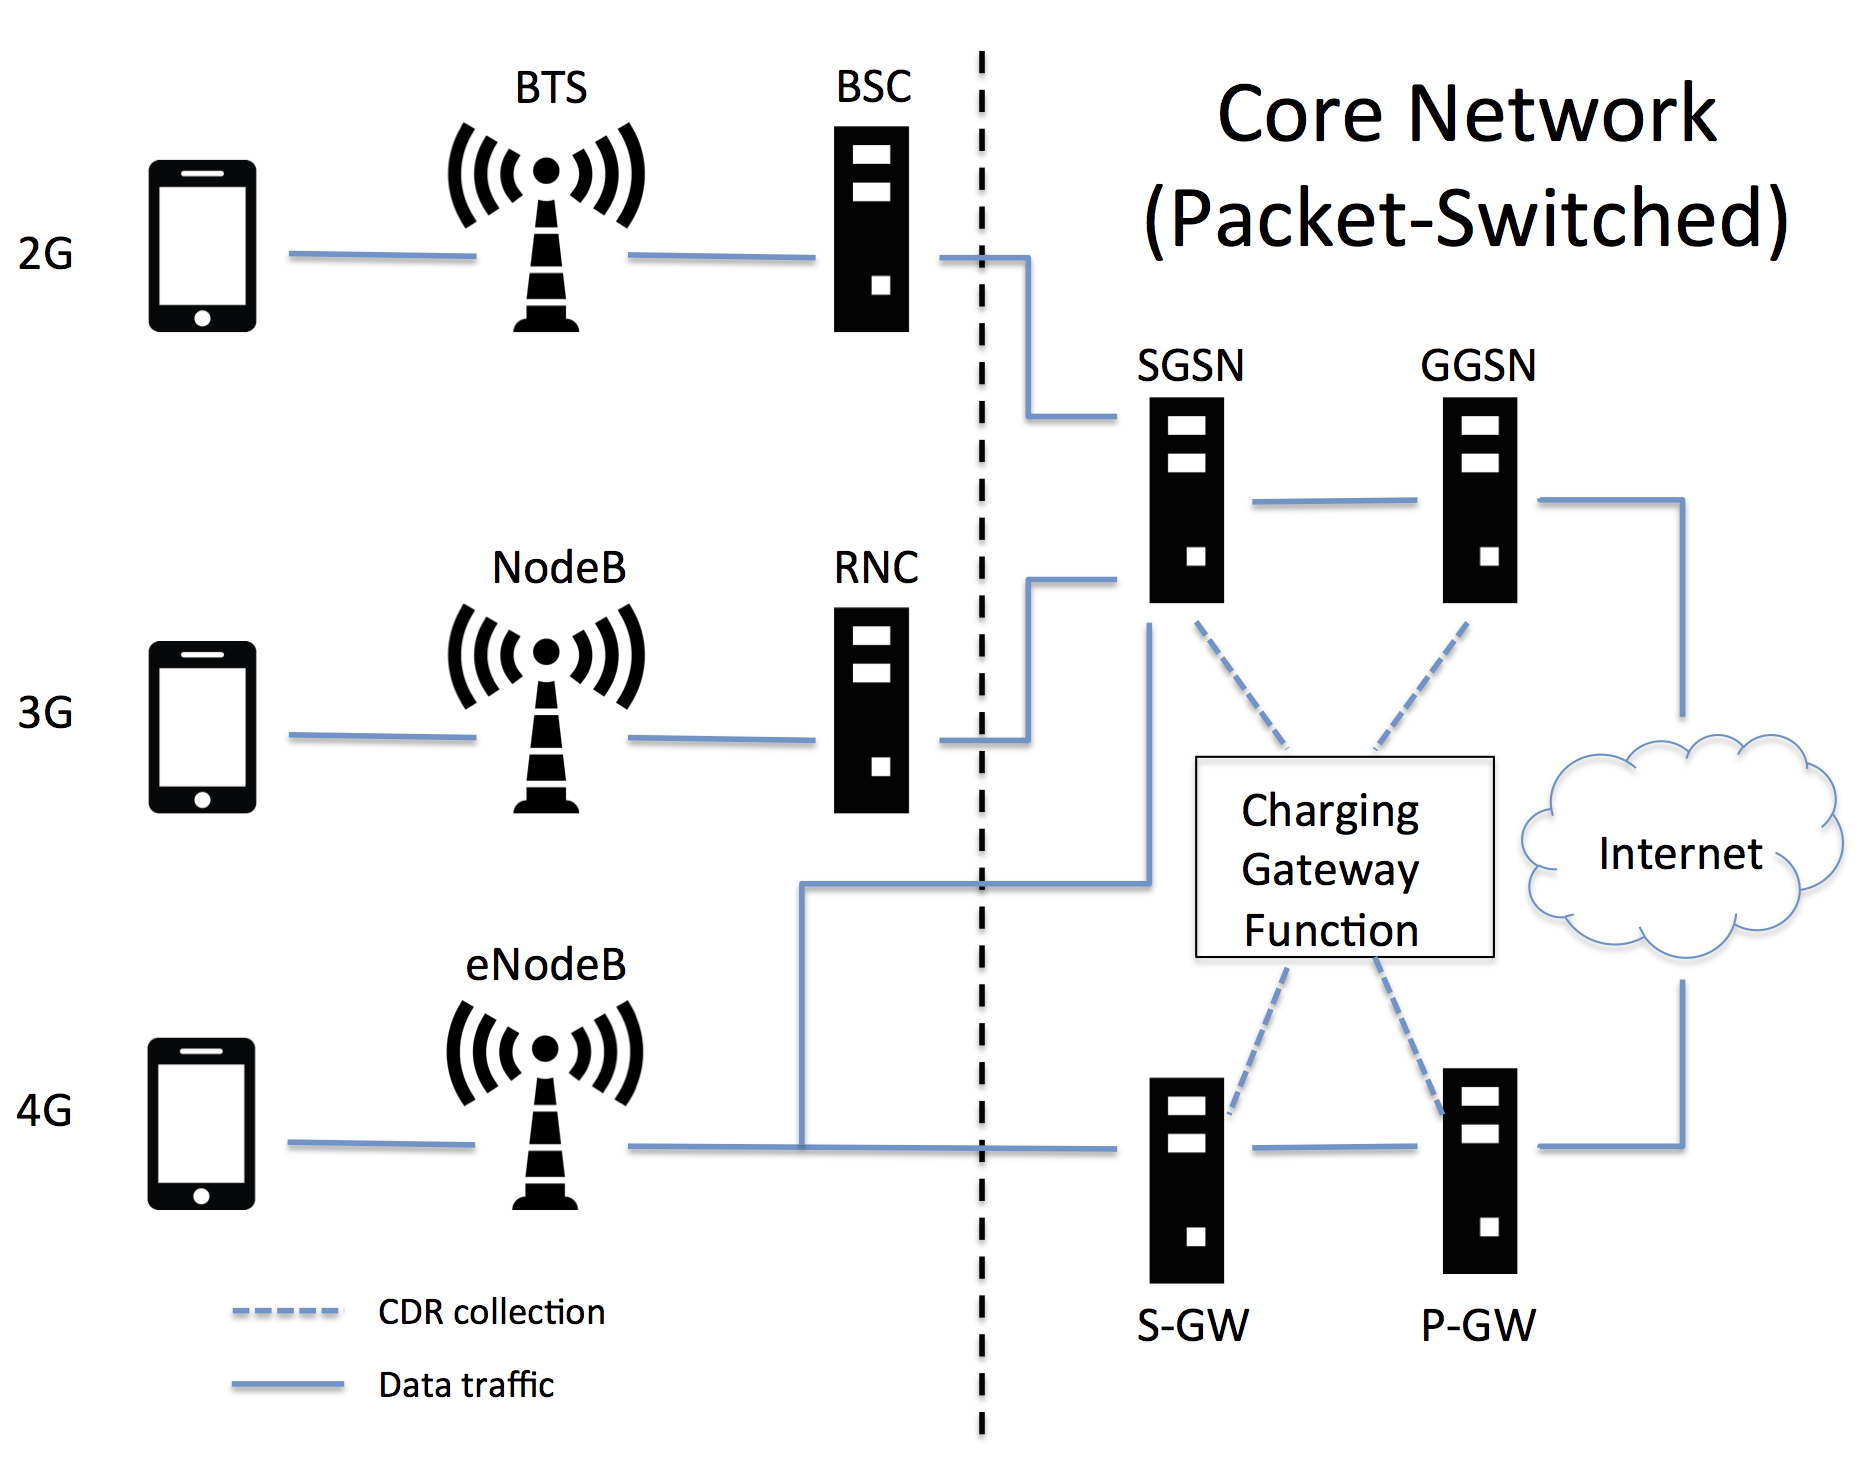
Internal gateway nodes (SGSN, GGSN, S-GW and P-GW) handle internet traffic between each subscriber device and applications server, and also generate charging data handled by special network functions (Charging Gateway Function). As the generated events can be geo-located using the latitude/longitude of the corresponding network cell (BTS, NodeB and eNodeB), packet switched events can be potentially used in the context of urban mobility applications.
Two main difficulties arise in order to use these events in urban mobility project. The first one is related with the technical complexity involved in the data generation, which requires a considerable amount of know-how of the daily operation, business processes and network behaviour. Unlike circuit switched events, the internet traffic charging processes apply filters and aggregations in several CDR at different nodes of the network ([2] Sect. 10.2 and [3] Sect 13.5). The main problem with this behaviour is the addition of potential inaccuracies in the event timestamps, which is a critical feature in urban mobility. The second one is related with the technical complexity involved in the data storage and access, since the amount of daily data is too large. Big Data persistent storages must be used to keep all CDR for posterior analysis in this case. Additionally, it could happen that the network/operations departments of the mobile operator can refuse to deploy automatic Extraction-Transformation-Load (ETL) processes in the core network nodes. The reason of this rejection is the possibility that the quality of the service to be deteriorated as consequence of the ETL processes resource consumption.
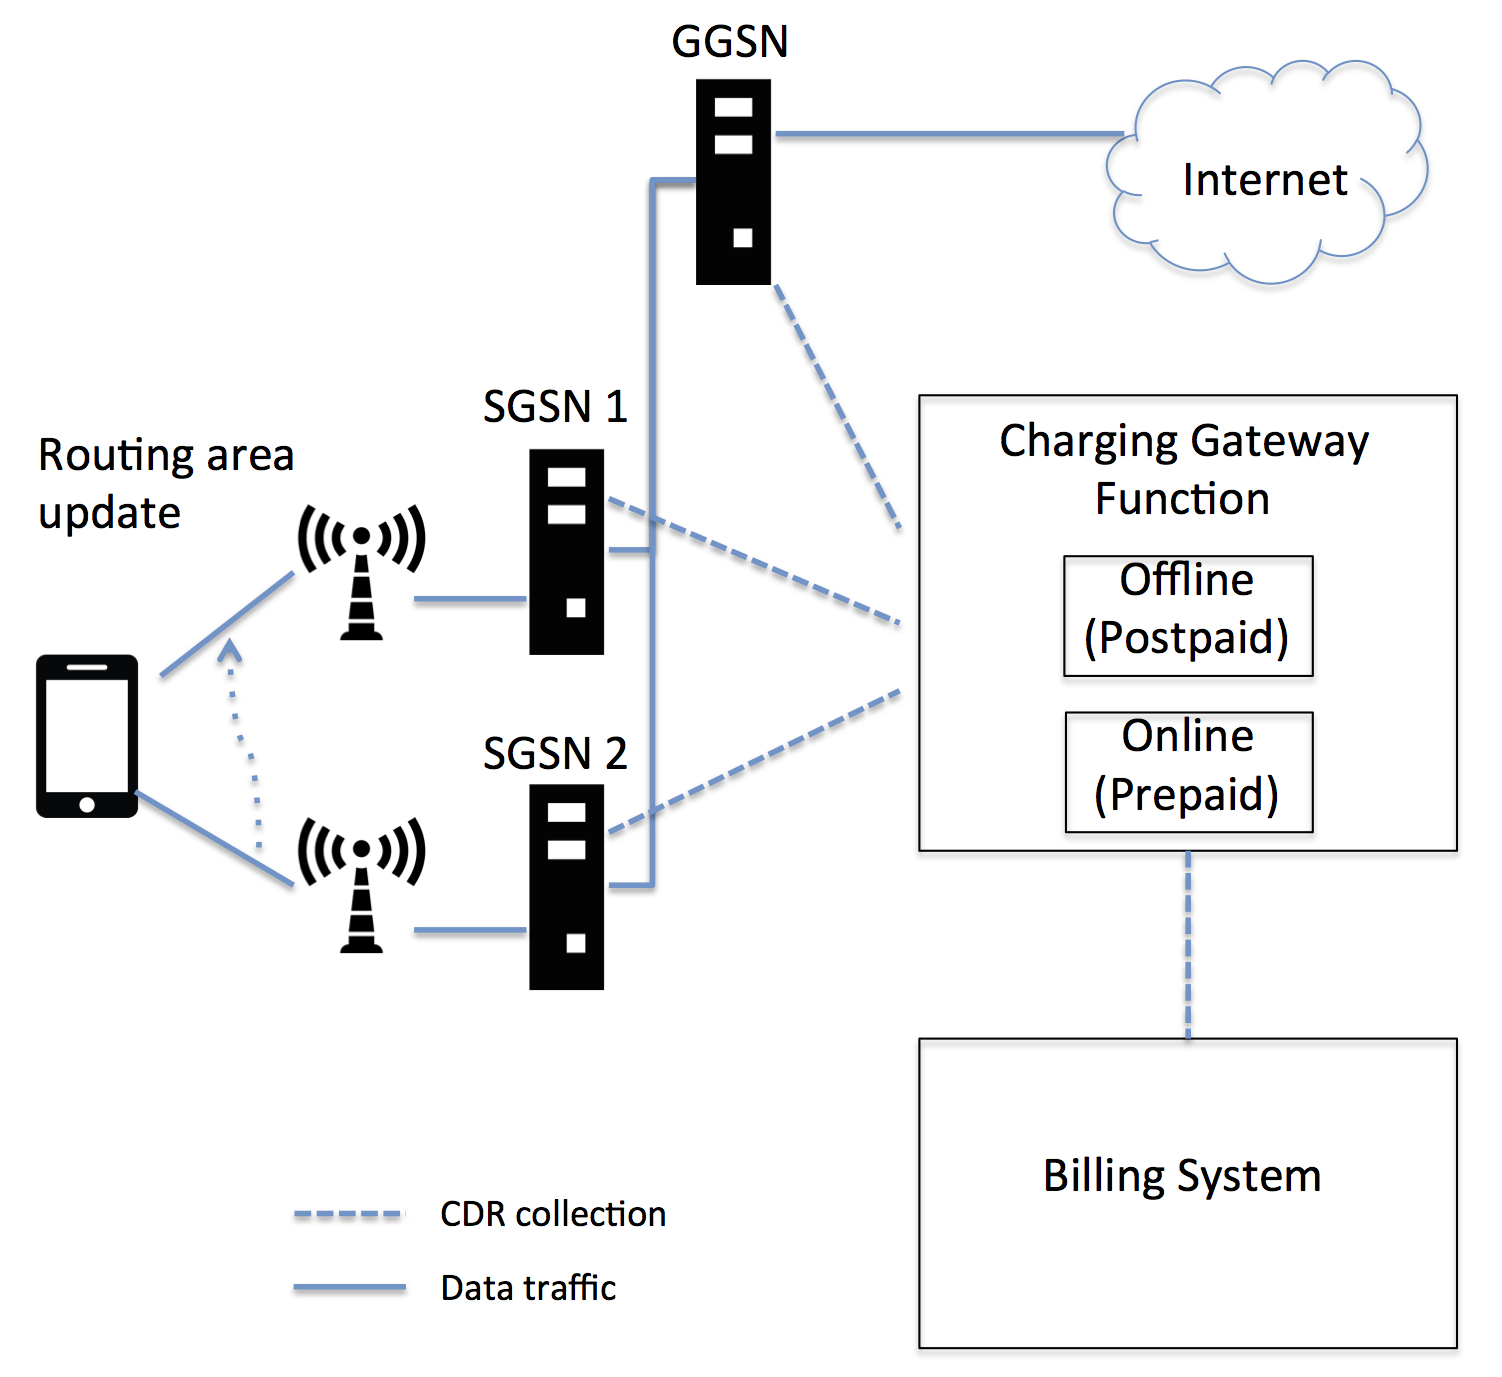
To avoid part of the previous difficulties, post-mediation internet traffic CDR are a cost-effective alternative to use in urban mobility applications (see [4] and [5]). These kinds of registers are generated by the Billing System, as depicted in Fig. 2. An internal core network functionality, called Charging Gateway function, transfers charging information from the core network gateway nodes to the Billing System, which is an external core network component. This system is in charge of calculating the cost of the services used by each subscriber, based on current tariffs. It is provided by special vendors, often different from well known telecommunication-infrastructure vendors. Since this kind of CDR is usually stored in a mid-term persistent storage far from the network and operation nodes (typically a data warehouse used by business processes), ETLs can be applied to the dataset without further critical monitoring. The remaining problem that must be solved is the time accuracy of the events.
A methodology to obtain insights on the distribution of the time accuracy of post-mediation CDR is proposed. We use network traffic events as ground-truth in order to obtain timely error measurements for the CDR. Using these error measurements, time-series analysis techniques are applied to infer similarities in the error behaviour for each BTS, Node and eNode in the service provider’s network.
II Case study
Our case study is based on anonymized data collected from prepaid and postpaid post-mediation CDR. The data is provided by Movistar - Telefónica Chile, with approximately 33% of the market share [6], with more than 7 million subscribers and 40,000 network cells [7].
II-A Error measurement
As ground-truth we use data provided by Huawei Smartcare SEQ Analyst [8], a network event measurement tool which collects various signaling/protocol data from the core network. Particularly, each internet traffic session is measured with its corresponding initial/final timestamps, byte consumption and cell ID of origin, among other information. Originally intended to help in quality of service measurement and operations efficiency, in our case we compare this data against post-mediation CDR. We identify the last network event registered in a particular network cell which is closest in time to each CDR event. The comparison is performed backwards in time, since for each CDR event there is at least one network event which happened in the near past in the same cell. In Table I a sample event trace for an anonymous subscriber is depicted. For each CDR event, a backward search is performed until a network event is registered in the same cell. For instance, at time 72198 (20:03:18) the CDR event has an associated network event at time 69406 (19:16:46 at cell A2). We measure the error for all anonymous subscribers during 5 working days of May 2016, aggregating the errors by cell, technology (2G, 3G and 4G) and charging type, using anonymized Cell IDs.
| Time (s) | CellID/Tech | Type | Charging | Error (s) |
|---|---|---|---|---|
| 69405 | A1/2G | Network | - | - |
| 69406 | A2/4G | Network | - | - |
| 69499 | A1/2G | CDR | Prepaid | 94 |
| 72198 | A2/4G | CDR | Postpaid | 2792 |
II-B Error analysis


Various analysis can be performed to quantify and understand the behavior of the CDR-Network time errors. In this section, we only focus on the daily variability and the cell to cell similarities. This allow us to investigate both the temporal and spatial behaviors.
II-B1 Daily variability
To assess the variability of the CDR-Network time errors along the day, we split the daily error distributions into time-bins. We then compute the mean value of time errors for each bin. These two steps are repeated for the set of antenna cells in the La Serena-Coquimbo region (500,000 inhabitants - data from May 10; see Fig. 3). Both 3G and 4G technologies distributions vary along the day with error larger at night (bin [0h - 7h[). The error then progressively diminishes along the day. These distributions are best represented by an exponentially modified normal law. We note that the 3G technology induces smaller errors that the 4G one (see table II). However, the scarce 2G data does not allow us to draw conclusions at this moment. The same behavior are found for both prepaid (not shown) and postpaid.
2G 3G 4G time bins mean (s) std (s) mean (s) std (s) mean (s) std (s) [0h - 7h[ 479.17 273.26 399.81 330.84 419.83 95.46 [7h - 9h[ 706.36 1377.55 412.66 560.52 420.76 154.17 [9h - 12h[ 523.53 791.01 330.09 247.35 364.24 108.46 Prepaid [12h - 14h[ 501.32 655.23 291.51 215.58 321.89 94.69 [14h - 17h[ 382.50 307.71 309.88 199.30 366.76 146.57 [17h - 19h[ 446.99 447.46 320.68 288.98 362.92 154.60 [19h - 24h[ 551.35 764.46 320.39 196.56 341.96 93.65 [0h - 7h[ 477.34 652.55 343.86 866.33 389.69 205.59 [7h - 9h[ 638.48 2161.95 474.68 751.63 475.75 480.66 [9h - 12h[ 477.67 649.28 377.38 345.09 450.79 709.37 Postpaid [12h - 14h[ 423.49 571.16 364.22 339.66 397.20 380.28 [14h - 17h[ 691.26 3523.42 394.98 386.74 382.21 237.71 [17h - 19h[ 726.62 1962.85 412.13 540.58 419.53 387.26 [19h - 24h[ 510.77 615.65 376.42 417.74 543.97 1229.22
II-B2 Cell to cell similarities
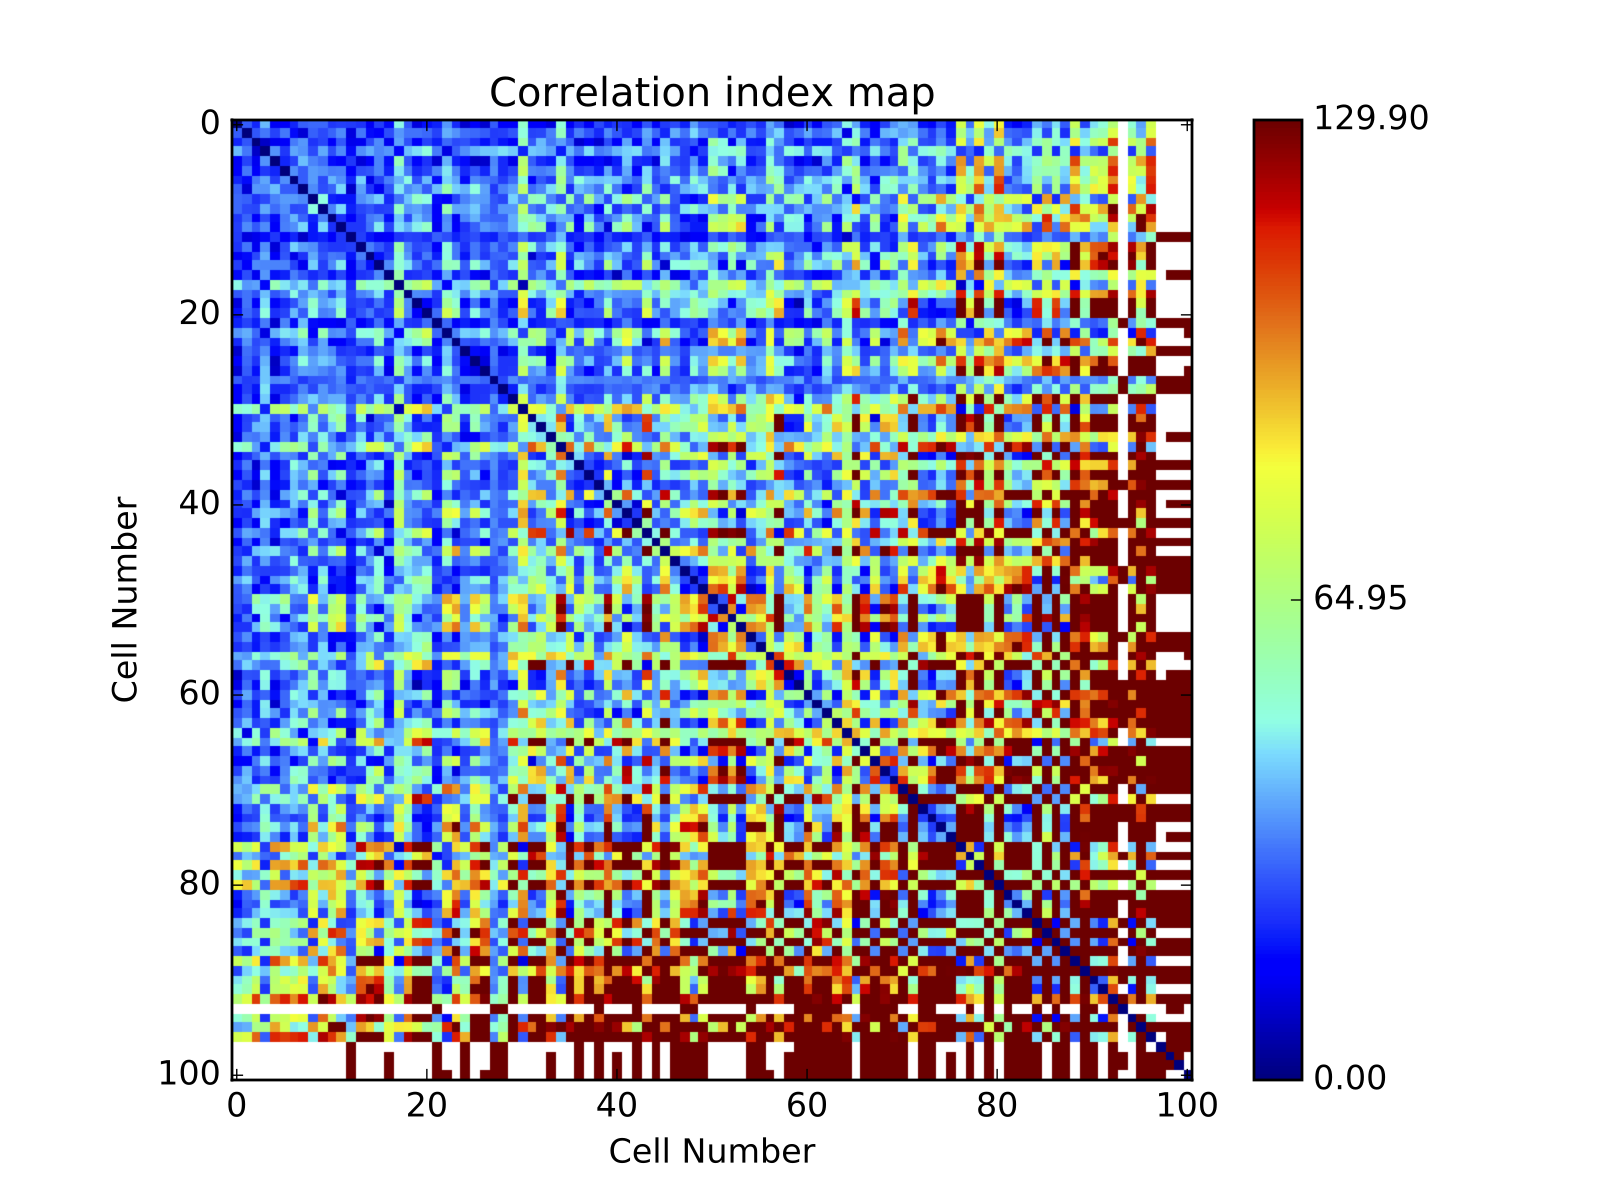
We used the same time-of-the-day bin splitting to compare the cells. For each of these bins, we set up the histograms of error. We then compare the time-bin histograms between cells thanks to a Kolmogorov-Smirnov test and combine the -values of the tests using Fisher’s method. This results in a correlation index that quantifies the behavior similarities between two cells. We end up creating the full matrix of correlation indices as depicted in Fig. 4. For clarity, in this figure, we only present a random selection of 100 antenna cells. The matrix is ordered according to the sum of all of the cell-to-cell correlation indices. Cells having a close behavior are segregated in the top left of the matrix. This matrix can help to distinguish generic cell behaviors. For instance, when ordered, we clearly observe a blue region (same behavior between cells) and a red region (different behavior between cells). A first generic group combines cell from the blue region. Moreover, the presence of blue points in the red region indicates that these exotic cells may form a second group. We finally note the presence of white points that refer to cells without a large enough number of events.
III Conclusion
A methodology to analyze time accuracy in post-mediation CDR is presented. Exploratory analysis shows that different behaviours arise when studying disaggregated data. Particularly between postpaid 3G and postpaid 4G, by analyzing a sample data from a mid-size city. Further analysis is needed, but the overall objective of the methodology can lead to accurate error models for this kind of datasets.
Acknowledgment
The authors would like to thank Movistar - Telefónica Chile and Chilean government initiative CORFO 13CEE2-21592 (2013-21592-1-INNOVA_PRODUCCION2013-21592-1).
References
- [1] U. Boquist, “The Ericsson SGSN-MME: Over a decade of Erlang success,” http://www.erlang-factory.com/upload/presentations/597/sgsn.pdf (last visited 2017-01-15), 2012, Erlang User Conference 2012.
- [2] J. Korhonen, Introduction to 3G Mobile Communications, ser. Artech House mobile communications series. Artech House, 2003.
- [3] C. Cox, An Introduction to LTE: LTE, LTE-Advanced, SAE, VoLTE and 4G Mobile Communications. Wiley, 2014. [Online]. Available: https://books.google.cl/books?id=NnGgAwAAQBAJ
- [4] F. Calabrese, L. Ferrari, and V. D. Blondel, “Urban sensing using mobile phone network data: A survey of research,” ACM Comput. Surv., vol. 47, no. 2, pp. 25:1–25:20, 2014.
- [5] V. D. Blondel, A. Decuyper, and G. Krings, “A survey of results on mobile phone datasets analysis,” EPJ Data Science, vol. 4, no. 1, p. 10, 2015.
- [6] SUBTEL, “Mobile Subscribers Market Share in Chile,” Technical Report, 2017, Chilean Telecommunications Regulator.
- [7] ——, “Active Antennas by Mobile Operator in Chile,” Technical Report, 2017, Chilean Telecommunications Regulator.
- [8] Huawei, “Huawei Smartcare SEQ Analyst,” http://www.huawei.com/us/products/core-network/smartcare/seq-analyst/ (last visited 2017-01-15), 2017.