Survival of the obscuring torus in the most powerful active galactic nuclei
Abstract
Dedicated searches generally find a decreasing fraction of obscured Active Galactic Nuclei (AGN) with increasing AGN luminosity. This has often been interpreted as evidence for a decrease of the covering factor of the AGN torus with increasing luminosity, the so-called receding torus models. Using a complete flux-limited X-ray selected sample of 199 AGN, from the Bright Ultra-hard XMM-Newton Survey, we determine the intrinsic fraction of optical type-2 AGN at 0.051 as a function of rest-frame 2-10 keV X-ray luminosity from to . We use the distributions of covering factors of AGN tori derived from CLUMPY torus models. Since these distributions combined over the total AGN population need to match the intrinsic type-2 AGN fraction, we reveal a population of X-ray undetected objects with high-covering factor tori, which are increasingly numerous at higher AGN luminosities. When these ”missing” objects are included, we find that Compton-thick AGN account at most for 37% of the total population. The intrinsic type-2 AGN fraction is 584% and has a weak, non-significant (less than 2) luminosity dependence. This contradicts the results generally reported by AGN surveys, and the expectations from receding torus models. Our findings imply that the majority of luminous rapidly-accreting supermassive black holes at 1 reside in highly-obscured nuclear environments but most of them are so deeply embedded that they have so far escaped detection in X-rays in 10 keV wide-area surveys.
Subject headings:
galaxies: nuclei — galaxies: Seyfert — infrared: galaxies1. Introduction
Dedicated searches for Active Galactic Nuclei (AGN) generally find that the fraction of AGN classified either as optical type-2 (obscured) or X-ray absorbed, decreases substantially with increasing luminosity (Lawrence & Elvis, 1982; Hasinger et al., 2005; Simpson, 2005; Della Ceca et al., 2008; Burlon et al., 2011; Merloni et al., 2014; Ueda et al., 2014; Buchner et al., 2015).
To explain these findings, receding torus models have often been adopted (Lawrence et al., 1991; Simpson, 2005; Hönig et al., 2007). They postulate that the geometry of the material obscuring the AGN nuclear region, the dusty torus (Antonucci, 1993; García-Burillo et al., 2016), changes with AGN luminosity. The torus geometrical covering factor (henceforth ) defines the fraction of the sky around the AGN central engine that is obscured. If decreases with increasing AGN luminosity, then this considerably reduces the probability of finding luminous type-2 AGN (Elitzur, 2012).
The observed decrease of the ratio of the torus infrared luminosity and the AGN bolometric luminosity () with has often been interpreted as direct evidence of a receding torus (Maiolino et al. 2007; Treister, Krolik & Dullemond 2008; Lusso et al. 2013; but see Netzer et al. 2016). These results should be treated with caution since a one-to-one correspondence is not expected between and (Stalevski et al., 2016).
We can determine using radiative transfer models that self-consistently reproduce the emission from dust in the torus heated by the AGN (e.g. Fritz et al., 2006; Nenkova et al., 2008; Schartmann et al., 2008; Hönig & Kishimoto, 2010; Stalevski et al., 2016). Using torus models with a clumpy distribution of dust from Nenkova et al. (2008, henceforth N08), we determined, for the first time, the probability density distributions of for individual objects (Mateos et al., 2016, henceforth M16) for a large, uniformly selected, and complete flux-limited sample of X-ray selected AGN drawn from the Bright Ultra-hard XMM-Newton Survey (BUXS; Mateos et al., 2012, 2013).
Using the distributions of for the AGN in BUXS, we derive here the intrinsic fraction of optical type-2 AGN at redshifts 0.051 as a function of intrinsic (absorption-corrected) rest-frame 2-10 keV luminosity from to (henceforth ). We also investigate whether the decrease of with , which we observe in the BUXS sample, is a property of the AGN population. Throughout, errors are 1 (the 16th and 84th percentiles when referring to distributions) unless otherwise stated. We adopt the concordance cosmology, =0.3, =0.7 and =70.
2. AGN sample
Our AGN sample is drawn from the BUXS survey. BUXS includes 255 X-ray bright () AGN detected with XMM-Newton in the 4.5-10 keV band over 44.43 deg2. Out of these, 252 have robust redshift and optical spectroscopic classifications. Objects with detected rest-frame UV/optical broad emission lines (full width at half maximum 1500 km s-1) are classified as type-1 and those with narrower emission lines as type-2.
Here, we only consider AGN with , to minimize host galaxy contamination, by increasing the AGN to galaxy contrast ratio, and with 1, to avoid strong evolutionary effects. This restricts our sample to 199 objects, with and 0.051.
BUXS is a unique survey to conduct this study. It is the only AGN sample for which we know for almost all (99%) objects. It is sufficiently large to constrain accurately the intrinsic type-2 AGN fraction. For all sources we have good quality X-ray spectroscopy (few hundred counts) which guarantees robust estimates of . Assuming the worst case, that all three unidentified sources are in the , interval under study, they represent at most 1.5% of our sample. Clearly, our results are not affected by identification incompleteness effects, that would bias against obscured AGN.
To compute the luminosity dependence of the type-2 AGN fraction we further divided our sample into three luminosity bins of equal logarithmic width: -, - and - (see Table 1).
3. The covering factor of AGN tori
In Mateos et al. (2015) we built the rest-frame UV-to-infrared spectral energy distributions (SED) of our objects using data from the Sloan Digital Sky Survey (Abazajian et al., 2009), the Two Micron All Sky Survey (Cutri et al., 2003), the UKIRT Infrared Deep Sky Survey (Lawrence et al., 2007), and the Wide Field Infrared Survey Explorer (WISE, Wright et al., 2010). With an SED decomposition analysis we isolated the emission associated with dust in the torus heated by the AGN at rest-frame wavelengths from 1m to 22m.
In M16 we fitted the torus SEDs with the N08 models using the Bayesian inference tool BayesCLUMPY that provides posterior distributions for all the free parameters of the models (Asensio Ramos & Ramos Almeida, 2009). We used truncated uniform prior distributions for all the torus model parameters (six in total) in the ranges listed in Table 1 from M16.
In the N08 models the dust is distributed in optically thick clouds (1 at 5500 Å). The torus inner radius is set by the sublimation temperature of the dust grains (1500 K). The radial distribution of clouds declines as a power-law. The vertical angular distribution of clouds has no sharp boundary and it is parameterized with a Gaussian. The geometrical covering factor of the torus is defined as
| (1) |
where is the probability that light from the AGN will escape without being absorbed at an angle from the torus equatorial plane:
| (2) |
depends on the angular width of the torus () and the mean number of clouds along the equatorial direction (). Using the posterior distributions of and we calculated the probability density distribution of for each source.
4. Observed type-2 AGN fraction vs.
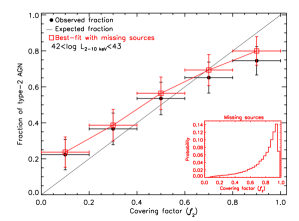
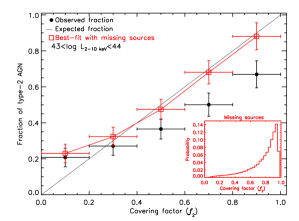
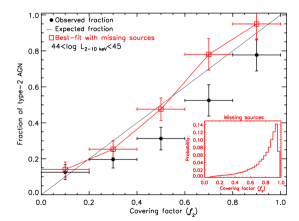
Since represents a geometrical covering factor, in any AGN subpopulation having a given dust covering factor , the fraction of type-2 objects should intrinsically be (Elitzur, 2012).
We started by computing the observed type-2 AGN fraction in BUXS as a function of , fully taking into account the uncertainties in . We divided the range of into five bins of width =0.2, the 1 average error in our estimates from the individual distributions. For each source, we obtained the fraction of in each bin by integrating its probability distribution. The observed type-2 AGN fraction in bin , , is defined as,
| (3) |
where and are the number of type-1 and type-2 AGN, respectively (see Table 1) and and are the fractions of the probability distributions of in bin .
To compute the uncertainties in , fully taking into account both source Poisson counting noise and the uncertainties in for each source (the full distributions), we used a bootstrap error estimate. We generated mock samples by randomly selecting type-1 and type-2 objects, with their corresponding distributions, from the original samples with replacement. Each mock sample contained a number of type-1 and type-2 AGN that was calculated from binomial distributions keeping constant the observed number of sources, i.e., (+), and assuming that the true type-2 AGN fraction is the observed one, /(+). We computed for each simulated dataset and then determined the median and percentiles.
Since we will use a chi-squared () fit to derive the intrinsic type-2 AGN fraction in the next section, we have corrected for the small asymmetry in the errors. For each set of values (, , ) we computed the Gaussian function that has mean and dispersion such that its integral from - to + is 68.3%. We used these as errors in our fits.
Our results are illustrated in Fig. 1. The y-axis represents the observed fraction of AGN classified as optical type-2 in BUXS. The x-axis represents the covering factor of the torus inferred from SED-fitting with N08 models. If BUXS did not miss any highly-covered AGN (1) our points should follow the 1:1 relation between the type-2 AGN fraction and . Clearly, this is not the case, especially at . There are not enough luminous type-2 AGN with high , therefore some must have escaped X-ray detection.
5. Intrinsic fraction of type-2 AGN
We have derived the global intrinsic type-2 AGN fraction by requiring that the type-2 AGN fraction and follow a 1:1 relation, i.e., for each the intrinsic fraction of type-2 AGN must be equal to . To do so we made the following assumptions:
(i) The AGN missed are all type-2. BUXS is not biased against type-1 AGN111Based on the Portable, Interactive, Multi-Mission Simulator (PIMMS) v4.8d assuming a power-law spectrum with photon index =1.9, at the redshifts under study the decrease in the 4.5-10 keV count-rate from =0 to X-ray absorbing column densities of = and = is 1% and 3%, respectively.. Moreover, the AGN missed cannot be ”X-ray weak” AGN, not only because these are a rare population (e.g. Brandt, Laor & Wills, 2000; Risaliti et al., 2003), but also because there is no physical reason why such objects should have tori with the highest among all AGN. Flux-limited surveys below 10 keV are incomplete for low- AGN whose line of sight X-ray absorption approaches the Compton-thick limit (=). Thus, the type-2 AGN missed are either Compton-thick or heavily-absorbed ().
(ii) The stacked probability distribution of for all the type-2 AGN in BUXS with (insets in Fig. 1) represents well in the objects missed. This is well-justified since heavily-absorbed type-2 AGN have 1 Ramos Almeida et al. 2011; M16 and their distributions of are all very similar, regardless of Alonso-Herrero et al. 2011; Ichikawa et al. 2015; M16. If we assume instead a distribution of peaking at smaller values, our main results remain unchanged, although only poorer fits are possible.
| log() | Observed | Intrinsic | Type-2 fraction | Compton-thick | |||||||
|---|---|---|---|---|---|---|---|---|---|---|---|
| type-2 fraction | type-2 fraction | missed | fraction | ||||||||
| (1) | (2) | (3) | (4) | (5) | (6) | (7) | (8) | (9) | (10) | (11) | (12) |
| 42-43 | 16 | 21 | 42.75 | 0.10 | 42.80 | 0.11 | 56.8 | 5 | 64.4 | 25.3 | 14.5 |
| 43-44 | 53 | 33 | 43.59 | 0.29 | 43.48 | 0.25 | 38.4 | 38 | 58.7 | 56.9 | 32.6 |
| 44-45 | 55 | 21 | 44.50 | 0.76 | 44.41 | 0.62 | 27.6 | 40 | 54.6 | 69.7 | 37.0 |
Notes.—Column 1: X-ray luminosity range in in logarithmic units; columns 2 and 3: number of type-1 and type-2 AGN in the bin, respectively; columns 4 to 7: median X-ray luminosity and redshift of type-1 and type-2 AGN, respectively; column 8: observed type-2 AGN fraction; column 9: number of type-2 AGN missed; column 10: intrinsic type-2 AGN fraction; column 11: fraction of type-2 AGN that have escaped X-ray detection; column 12: fraction of type-2 AGN that have escaped X-ray detection over the total population. Fractions are given in percentage units.
To compute the number of type-2 AGN missed, , we increased until we found the best fit to the 1:1 relations in Fig. 1. The best-fit type-2 AGN fractions, (open squares), are
| (4) |
where is the fraction of the distribution used to represent the missing AGN in the bin . We obtained the uncertainties on from our fits as . Next, we computed the intrinsic type-2 AGN fraction, =(+)/(++), with uncertainties using a Bayesian approach (Wall & Jenkins, 2003). We have assumed a binomial distribution similar to that in Section 4 weighted with . Since are only defined for 0, our estimates of are higher than what would be directly obtained from the numbers listed in columns 2, 3 and 9 of Table 1. We have followed this same Bayesian approach to compute the fractions listed in columns 8, 11 and 12 in Table 1.
Since the errors of are not independent we tested the robustness of our fitting with Monte Carlo simulations. We used our simulated values of (see Sec. 4) to determine with a least squares fitting, and found that the results were indistinguishable from those obtained with the fitting.
We now discuss some issues that could affect our results.
In our computations of , objects with 0.5 contribute to both the upper and lower neighboring bins while objects with extreme values contribute only towards the central bins. This effect could flatten our estimates in Fig. 1 with respect to the 1:1 relation removing the need of adding any missing sources. To address this issue, we have used Monte Carlo simulations of source samples of the same size as ours but following the 1:1 relation. The simulated objects are assigned probability distributions drawn from the real type-1/type-2 objects, proportionally to their weight at the needed value. This results only in a difference of a few percent in our estimates, not changing our conclusions.
For two type-1 AGN with we could not determine because they were not detected by WISE. We included both sources in our analysis by assigning them distributions drawn at random with replacement from the type-1 AGN sample in the corresponding luminosity bin. Since all type-1 AGN have similar distributions of (M16) our approach is well justified. Therefore, our results are free from systematic uncertainties associated with the lack of detection of X-ray sources at infrared wavelengths.
Type-2 AGN typically have optical extinctions associated with dust in their hosts of 5 mag (e.g. Alonso-Herrero et al., 2003, 2011). These are too small to have any noticeable effect on our torus SEDs and thus on our estimates. Host galaxy dilution may cause a type-1 AGN to be misclassified as type-2, especially at low luminosities (Caccianiga et al., 2007). If there are cases such as these in BUXS, the number is too small to affect our results (M16).
By restricting our analysis to AGN with , where BUXS is complete, we found that the uncertainties were larger, but the results remained unchanged. Finally, we have verified that if we force type-1 and type-2 AGN to have the same distributions on each bin (with a bootstrap re-sampling), the results remain the same. Thus, if type-1 and type-2 AGN evolve differently at the under study (e.g. Reyes et al., 2008), this has no noticeable impact on our analysis.
 |
6. Compton-thick AGN fraction
A non-negligible fraction of luminous type-2 AGN with high have escaped X-ray detection. The fraction of AGN missed over the total population (last column in Table 1) gives us a strict upper limit to the Compton-thick fraction, since none of the AGN in BUXS are Compton-thick. At Compton-thick AGN cannot contribute more than % to the total AGN population, in agreement with recent estimates (Buchner et al., 2015; Ricci et al., 2015). At (0.1) our results are also consistent, within the uncertainties, with Compton-thick fractions reported for low- AGN samples (Bassani et al., 2006; Burlon et al., 2011; Ricci et al., 2015; Akylas et al., 2016).
7. Luminosity dependence of the type-2 AGN fraction
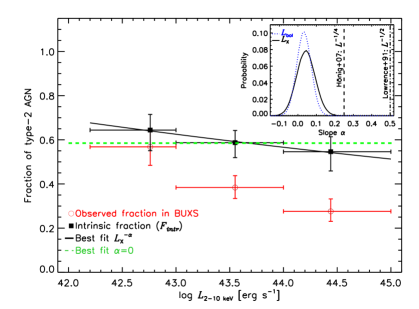
Fig. 2 shows the luminosity dependence of . For comparison, we also show the observed type-2 AGN fraction in BUXS which, as typically found in flux-limited X-ray surveys, decreases substantially with . We have parameterized the luminosity dependence of with a power-law of the form . A simple fit to a straight line in log-log space using the values and errors of in Table 1 yields the relation,
| (5) |
The inset in Fig. 2 shows the probability density distribution of which we find to be relatively narrow around a peak close to zero (3 upper limit 0.19). When the missing objects are included, the dependence of on is no longer significant (just 80.1% of our simulations gave 0). A fit with constant yields instead =% (see Fig. 2).
Since most of the radiation absorbed by the dust in the torus is emitted by the accretion disk at UV/optical wavelengths, to test the validity of receding torus models we should investigate whether varies with AGN bolometric power, . If we assume a constant X-ray bolometric correction, our results remain unchanged. If we adopt instead that the conversion from to increases with luminosity (Marconi et al., 2004; Hopkins et al., 2007), using one such bolometric correction (Marconi et al., 2004), our AGN span almost four orders of magnitude in (from to 7) yielding an even tighter limit on the slope, = (3 upper limit 0.14). We find evidence that does not decrease with increasing luminosity, clearly contradicting the expectations of receding torus models.
In our analysis we have not considered that the uncertainties in might move AGN between luminosity bins. Because the bins are 1 dex wide and the uncertainties in small (medians of 5% and 35% for type-1 and type-2 AGN, respectively), the effect should be negligible. A simple calculation of the scatter of sources in the bins by counting sources weighted by the distributions of revealed that, at our results do not change. At increases to nine which translates into a of 67%. This has a negligible impact on our estimate of (0.01).
By filling the gap between studies in the local Universe and at cosmic epochs when supermassive black hole (SMBH) mass growth peaked, 1-2 (Martinez-Sansigre et al., 2005; Ueda et al., 2014; Aird et al., 2015; Assef et al., 2015; Buchner et al., 2015; Del Moro et al., 2016), we show here that luminous highly-obscured AGN dominate the population of fast growing SMBH up to 2. Surveys with the Nuclear Spectroscopic Telescope Array (NuSTAR) have started to reveal this elusive AGN population. At the of our sample and luminosities the observed type-2 AGN fraction is consistent with our findings (% assuming /1; Lansbury et al., 2016).
8. Summary and conclusions
We have determined the intrinsic type-2 AGN fraction at 0.051 and at . To do so we used a complete flux-limited sample of 199 X-ray selected AGN drawn from the Bright Ultra-hard XMM-Newton Survey (BUXS). For this sample we have robust estimates of the geometrical covering factor of the torus in the framework of N08 clumpy torus models.
Since the distribution of covering factors needs to match the fraction of optical type-2 AGN, we reveal the existence of a substantial population of X-ray undetected objects with high-covering factor tori, which are increasingly numerous at higher AGN luminosities. When these ”missing” objects are included, Compton-thick AGN account at most for 37.0% of the total AGN population, in agreement with previous estimates. We find that the intrinsic type-2 AGN fraction is % and has a weak and non-significant (less than 2) luminosity dependence. This is in clear contradiction with the results generally reported by AGN surveys and the expectations from receding torus models.
Our findings imply that the majority of luminous, rapidly-accreting SMBH, reside in highly-obscured nuclear environments, many so deeply buried that they remain undetected in X-rays at the depths of 10 keV wide-area surveys.
We thank the anonymous referee for the complete and deep revision of our manuscript, that helped us to substantially improve our work. SM acknowledges financial support through grant AYA2016-76730-P. (MINECO/FEDER). FJC, XB and A.A.- H. acknowledge financial support through grant AYA2015-64346-C2-1-P (MINECO/FEDER). AH-C acknowledges financial support through grants AYA2015-70815-ERC and AYA2012-31277. CRA acknowledges financial support through grant AYA2016-76682-C3-2-P and the Ramón y Cajal Program through project RYC-2014-15779 (MINECO). TM is supported by CONACyT Grants 179662, 252531 and UNAM-DGAPA PAPIIT IN104216. Based on observations collected at the European Organization for Astronomical Research in the Southern hemisphere, Chile. Based on observations made with the William Herschel Telescope-operated by the Isaac Newton Group, the Telescopio Nazionale Galileo-operated by the Centro Galileo Galilei and the Gran Telescopio de Canarias installed in the Spanish Observatorio del Roque de los Muchachos of the Instituto de Astrofísica de Canarias.
References
- Abazajian et al. (2009) Abazajian, K. N., Adelman-McCarthy, J. K., Agüeros, M. A. et al. 2009, ApJS, 182, 543
- Aird et al. (2015) Aird, J., Alexander, D. M., Ballantyne, D. R., Civano, F. et al. 2015, ApJ, 815, 66
- Akylas et al. (2016) Akylas, A., Georgantopoulos, I., Ranalli, P. et al. 2016, A&A, 594, 73
- Alonso-Herrero et al. (2003) Alonso-Herrero, A., Quillen, A. C., Rieke, G. H., Ivanov, V. D., Efstathiou, A. 2003, AJ, 126, 81
- Alonso-Herrero et al. (2011) Alonso-Herrero, A., Ramos Almeida, C., Mason, R., Asensio Ramos, A. et al. 2011, ApJ, 736, 82
- Antonucci (1993) Antonucci, R. 1993, ARA&A, 31, 473
- Asensio Ramos & Ramos Almeida (2009) Asensio Ramos, A., & Ramos Almeida, C. 2009, ApJ, 696, 2075
- Assef et al. (2015) Assef, R. J., Eisenhardt, P. R. M., Stern, D. et al. 2015, ApJ, 804, 27A
- Bassani et al. (2006) Bassani, L., Molina, M., Malizia, A. et al. 2006, ApJ, 636, L65-L68
- Brandt, Laor & Wills (2000) Brandt, W. N., Laor, A., Wills, B.J. 2000, ApJ, 528, 637
- Buchner et al. (2015) Buchner, J., Georgakakis, A., Nandra, K. et al. 2015, ApJ, 802, 89
- Burlon et al. (2011) Burlon, D., Ajello, M., Greiner, J., Comastri, A., Merloni, A., Gehrels, N. 2011, ApJ, 728, 58
- Caccianiga et al. (2007) Caccianiga, A., Severgnini, P., Della Ceca, R., Maccacaro, T. et al. 2007, A&A, 470, 557
- Cutri et al. (2003) Cutri, R. M., Skrutskie, M. F., van Dyk, S. et al. 2003, The IRSA 2MASS All-Sky Point Source Catalog, NASA/IPAC Infrared Science Archive, http://irsa.ipac.caltech.edu/applications/Gator/
- Della Ceca et al. (2008) Della Ceca, R., Caccianiga, A., Severgnini, P. et al. 2008, A&A, 487, 119
- Del Moro et al. (2016) Del Moro, A., Alexander, D. M., Bauer, F. E. et al. 2016, MNRAS, 456, 2105
- Elitzur (2012) Elitzur, M. 2012, ApJ, 747, 33
- Fritz et al. (2006) Fritz, J., Franceschini A., Hatziminaoglou E. 2006, MNRAS, 366, 767
- García-Burillo et al. (2016) García-Burillo, S., Combes, F., Ramos Almeida, C. et al. 2016, ApJ, 823, L12
- Hasinger et al. (2005) Hasinger, G., Miyaji, T. & Schmidt, M. 2005, A&A, 441, 417
- Hönig et al. (2007) Hönig, S. F. & Beckert, T. 2007, MNRAS, 380, 1172
- Hönig & Kishimoto (2010) Hönig, S. F. & Kishimoto, M. 2007, A&A, 523, 27
- Hopkins et al. (2007) Hopkins, P. F.,Richards, G. T., Hernquist, L. 2007, ApJ, 654, 731
- Ichikawa et al. (2015) Ichikawa, K., Packham, C., Ramos Almeida, C., Asensio Ramos, A. et al. 2015, ApJ, 803, 571
- Lansbury et al. (2016) Lansbury, G. B., Stern, D., Aird, J., Alexander, D. M. et al. 2017, ApJ, 836, 99
- Lawrence & Elvis (1982) Lawrence, A. & Elvis, M. 1982, ApJ, 256, 410
- Lawrence et al. (1991) Lawrence, A. 1991, MNRAS, 252, 586
- Lawrence et al. (2007) Lawrence, A., Warren, S. J., Almaini, O. et al. 2007, MNRAS, 379, 1599
- Lusso et al. (2013) Lusso, E. & Hennawi, J. F. & Comastri, A. et al. 2013, ApJ, 777, 86
- Maiolino et al. (2007) Maiolino, R., Shemmer, O., Imanishi, M. et al. 2007, A&A, 468, 979
- Marconi et al. (2004) Marconi, A., Risaliti, G., Gilli, R. et al. 2004, MNRAS, 351, 169
- Martinez-Sansigre et al. (2005) Martinez-Sansigre, A., Rawlings, S., Lacy, M. et al. 2005, Nature, 436, 666
- Mateos et al. (2012) Mateos, S., Alonso-Herrero, A., Carrera, F. J. et al. 2012, MNRAS, 426, 327
- Mateos et al. (2013) Mateos, S., Alonso-Herrero, A., Carrera, F. J. et al. 2013, MNRAS, 434, 941
- Mateos et al. (2015) Mateos, S., Carrera, F. J., Alonso-Herrero, A. et al. 2015, MNRAS, 449, 1422
- Mateos et al. (2016) Mateos, S. , Carrera, F. J., Alonso-Herrero, A. et al. 2016, ApJ, 819, 166
- Merloni et al. (2014) Merloni, A., Bongiorno, A., Brusa, M. et al. 2014, MNRAS, 437, 3550
- Nenkova et al. (2008) Nenkova, M., Sirocky, M. M., Nikutta, R., Ivezić, Z., & Elitzur, M. 2008, ApJ, 685, 160
- Netzer et al. (2016) Netzer, H., Lani, C., Nordon, R. et al. 2016, ApJ, 819, 123
- Ramos Almeida et al. (2011) Ramos Almeida, C., Levenson, N. A., Alonso-Herrero, A. et al. 2011, ApJ, 731, 92
- Reyes et al. (2008) Reyes, R., Zakamska, N. L., Strauss, M. A., Green, J. et al. 2008, AJ, 136, 2373
- Ricci et al. (2015) Ricci, C., Ueda, Y., Koss, M. J., Trakhtenbrot, B. et al. 2015, ApJ, 815, 13
- Risaliti et al. (2003) Risaliti, G., Elvis, M., Gilli, R., Salvati, M. 2003, ApJ, 587, L9-13
- Schartmann et al. (2008) Schartmann, M., Meisenheimer, K., Camenzind, M., Wolf, S. et el. 2008, A&A, 482, 67
- Simpson (2005) Simpson, C. MNRAS, 360, 565
- Stalevski et al. (2016) Stalevski, M., Ricci, C., Ueda, Y. et al. 2016, MNRAS, 458, 2288
- Treister, Krolik & Dullemond (2008) Treister, E., Krolik, J. H. & Dullemond, C. 2008, ApJ, 679, 140
- Ueda et al. (2014) Ueda, Y., Akiyama, M., Hasinger, G., Miyaji, T. & Watson, M. G. 2014, ApJ, 786, 104
- Wall & Jenkins (2003) Wall, J. V. & Jenkins, C. R. 2003, Practical Statistics for Astronomers, Cambridge, Cambridge Univ. Press
- Wright et al. (2010) Wright, E. L., Eisenhardt, P. R. M., Mainzer, A. K. et al. 2010, AJ, 140, 1868