Investigation of giant dipole resonance in heavy deformed nuclei with the EQMD model
Abstract
The deformation evolution of giant dipole resonance (GDR), in the chains of Sm and Nd isotopes, are investigated in the framework of an extended quantum molecular dynamics (EQMD) model. The mass number dependence of resonance peak position in the major and minor axis directions of deformed nuclei as well as the difference between them are described in detail. The correlation between the splitting () of the GDR spectra and the deformation() is further studied. The results confirm that is proportional to . By comparing the calculation with the experimental data on photon absorption cross section , it shows that the EQMD model can quite well reproduce the shape of GDR spectra from spherical to prolate shape. The GDR shapes in 134Sm, 136Sm, 138Sm, 130Nd, 132Nd and 134Nd are also predicted. In addition, the symmetry energy coefficient dependence of GDR spectra of 150Nd is also discussed. It is found that the calculated GDR spectrum in the EQMD model is perfectly consistent with the experimental results when equals to 32 MeV.
pacs:
24.10.-i, 24.30.Cz, 25.20.-x, 29.85.-cI Introduction
Giant dipole resonance (GDR) is the most prominent characteristic in the excitation spectrum for all nuclei (except for deuterons) in the nuclide chart, which has been regarded as a specific probe for measuring the shape of a nucleus. Due to this fact, there is increasing interest in applications to the dynamics of exotic nuclei. The relationship of the geometrical and dynamical symmetries of -clustering configuration with the number and centroid energies of peaks in the GDR spectra has been discussed in Ref. wbhe2014 ; wbhe2016 . The evolution of GDR with neutron excess for the neutron-rich oxygen isotopes has been systematically measured in Ref. alta2001 . Additionally, since deformation effects in GDR spectrum were firstly seen more than fifty years ago in terms of a double humped photon cross section peak egf1962 , it has been well established that the GDR peak is split into two components due to the different frequencies of dipole oscillation along the major axis and minor axis in heavy deformed nuclei bsi2011 ; blhe1975 ; jmew1995 ; abbr1998 .
Deformed nucleus provides an interesting testing ground since there is a strong interplay between the structure of the GDR and the ground-state deformation mdan1958 . Many works have been done both theoretically msss2016 ; sgmm2011 ; kytn2013 ; kytn2011 ; jampg2005 ; bsiv2007 ; sfeb2012 ; yew and experimentally bsi2011 ; vmml2006 ; blhe1975 ; PCA1974 ; PCA1971 ; dpbd2013 to investigate the effects of deformation in GDRs in heavy deformed nuclei. Most of the studies of the GDRs in deformed nuclei have been focused on the dependence of the width at half maximum, peak position and strength of dipole resonance on deformation.
Various microscopic methods have been employed to investigate the GDRs of deformed nuclei such as random-phase approximation approach msss2016 ; sgmm2011 ; kytn2013 ; kytn2011 ; wkvo2008 ; jllg2007 , time-dependent Skyrme-Hartree-Fock method jampg2005 ; sfeb2012 , time-dependent density functional theory isab2011 and phonon damping model nddk1999 . The excitation of the GDRs in the experiment is induced by inelastic scattering tpug2016 ; dhyj1976 ; mihs2002 , photoabsorption vmml2006 ; PCA1974 ; PCA1971 ; vapr2011 , -decay jhka1990 and so on. However, few researches have been conducted about the GDRs in heavy deformed nuclei using a dynamical method.
In this article, the EQMD model tmaru1996 has been applied to study the GDRs in Sm and Nd isotopes. The initial ground-state deformed nuclei are boosted by imposing a dipole excitation to obtain the GDR spectra. Both the brief introduction of EQMD model and the methods of calculating GDR spectrum are shown in Sec. II. To check the reliability of our calculation, the evolution of dipole moments in coordinator space and in momentum space versus time are exhibited in Sec. III. The discussions, including the mass number dependence of resonance width along the major and minor axis, the comparison of the calculations with the experimental measurement as well as the effect of symmetry energy coefficient on GDR, are also carried out in this section. Finally, Sec. IV gives the summary.
II MODEL AND FORMALISM
II.1 Introduction of the EQMD model
The extended quantum molecular dynamics (EQMD) model was developed from the quantum molecular dynamics (QMD) model qmd ; qmd2 ; qmd3 ; qmd4 by adding the so-called Pauli potential to the effective interaction and treating the width of Gaussian wave packets for each nucleon as a dynamical variable. The initial ground-state nuclei are obtained at their minimum energy states which are sufficiently stable so that they can be considered as at the real ground states tmaru1996 ; sswc2015 ; heNT . Thanks to the advantage, EQMD model has been successfully applied to study the giant dipole resonance (GDR) of the alpha-clustering nuclei wbhe2014 ; wbhe2016 . In this article, we use the EQMD model to investigate the GDRs in heavy deformed nuclei. A brief introduction of the EQMD model is presented as follows.
In the model, the total wave function of the system is treated as a direct product of Gaussian wave packets of all nucleons tmaru1996
| (1) |
| (2) |
where and are the centers of position and momentum of the th wave packet, respectively. The Gaussian width is introduced using a complex as
| (3) |
where and denote the real and the imaginary parts. They are dynamical variables in the process of initialization.
The effective interaction contains Skyrme, Coulomb, Symmetry potential as well as the Pauli potential.
| (4) |
The simplest form is used for the Skyrme interaction
| (5) |
with =-124.3MeV, =70.5MeV, and =2. They are obtained by fitting the ground-state properties of the finite nuclei.
For the Pauli potential, a very simple form is applied by introducing a phenomenological repulsive potential which inhibits nucleons of the same spin and isospin to come close to each other in the phase space
| (6) |
where denotes the strength of the Pauli potential, which equals to 15MeV. For the other two parameters, we take = 1.0 and =1.3. is the overlap of a nucleon with the same spin and isospin as follows
| (7) |
and is the unit step function.
The symmetry potential is written as
| (8) |
where is the symmetry energy coefficient.
The stability of nuclei in the model description is very important to study the structure effects of nuclei, for example deformation structure. In the EQMD model, the energy-minimum state is considered as the ground state of initial nuclei. At the beginning, a random configuration is given to a nucleus. Then the initial ground-state nucleus are obtained by solving the damped equations of motion as
| (9) |
where , , , and are damping coefficients. With negative values of these coefficients, the system goes to its (local) energy minimum point.
| (10) |
II.2 Giant Dipole Resonance in deformed nuclei
To study the GDRs of the deformed nuclei that have an ellipsoidal shape in the framework of EQMD model, we firstly need to obtain the phase space information of the ground state deformed nuclei, which have been proven and measured in the experiments. Nevertheless the fact is that not all of the phase space distributions of the initial nuclei obtained from initialization with the EQMD model are ellipsoidal, it is indispensable to select the deformed nuclei from all initial nuclei, whose deformations are consistent with the experimental measurements. Here, the initial deformed nuclei are selected by comparing the calculated deformation parameter with the experimental data. is a parameter linked through the symmetry-axis radius and the radius of the spherical nucleus with the same mass in accordance with the following relationship
| (11) |
Note that in the EQMD model, is taken as the root-mean-squared radius.
According to the macroscopic description of GDR given by the Goldhaber-Teller model mgo1948 , the GDR is considered as a coherent dipole oscillation of the bulk of protons and neutrons along opposite direction in an excited nucleus. In this work, the initial nucleus is triggered by means of giving a displacement between protons and nucleons at = 0 fm/c and then a dipole excitation is triggered and evolved with time. The dipole moments of the system in coordinator space and in momentum space are defined, respectively, as follows wbhe2014 ; wbhe2016 ; whl2010 ; ctyg2013 ; vbmc2001 :
| (12) |
| (13) |
Where and are the of the protons and neutrons in coordinate (momentum) space, respectively.
The strength of the dipole resonance of the system at energy can be derived from the dipole moments , i.e.,
| (14) |
where can be interpreted as the emission probability. is from the the Fourier transform of the second derivative of with respect to time, i.e.,
| (15) |
It needs to be noted that the evolution time can’t be infinite long in the realistic calculation and the Fourier transform in the infinite time-range is not reasonable due to the GDR spectrum having the natural width. Moreover, the different final states only affect the width of GDR spectra, which determine the effective width of the Fourier transform in Eq.( 15). However, they don’t affect the peak position () of the resonance maximum. So we take = 300fm/c as the final state in this work.
The peak of the GDRs in deformed nuclei splits two parts, while there is only one single peak for the spherical nuclei. In EQMD model, we calculate the GDRs along and axis, respectively. Analogy to the superposition of two non-interfering Lorentz lines for statically deformed nuclei (the lower-energy line corresponds to oscillations along the major axis and the higher-energy line along the minor) for fitting the experimental data blhe1975 , we take the method of the superposition of two GDR spectra to gain the total resonance strength in a deformed nucleus. The formula is given as
| (16) |
where is the resonance strength maximum; is the peak position of the resonance maximum; is the resonance width at half-maximum; and correspond to the and axis resonance components of the deformed nucleus. Noting that the above three parameters are all obtained by fitting the single GDR spectrum along two axes directions with the Gaussian function, and axis corresponds to the major axis and axis is the minor axis of the nucleus in our calculation.
III Results and discussion
Nuclei in the region of mass number Z60 (Nd) and Z62 (Sm) display a transition from spherical, at the neutron number N close to 82, to prolate ellipsoidal shape. Considering this, the chains of Nd and Sm isotopes are used to study the deformation dependence of GDR spectra in the framework of EQMD model. The experimental data of photon absorption cross sections in the GDR range are extracted from Ref. PCA1974 for Sm isotopes and from Ref. PCA1971 for Nd isotopes.
| nuclei | ||
|---|---|---|
| exp. SRA2001 | calcu. | |
| 130Nd | 0.370.09 | 0.35860.0109 |
| 132Nd | 0.3490.03 | 0.34850.0139 |
| 134Nd | 0.2490.025 | 0.25580.007 |
| 142Nd | 0.09170.001 | 0.09410.0136 |
| 144Nd | 0.12370.0006 | 0.10190.0047 |
| 146Nd | 0.15240.0025 | 0.14970.0182 |
| 148Nd | 0.20130.0037 | 0.21330.0035 |
| 150Nd | 0.28530.0021 | 0.27330.0173 |
| 134Sm | 0.3660.026 | 0.35760.0053 |
| 136Sm | 0.2930.015 | 0.28460.0116 |
| 138Sm | 0.2080.017 | 0.20910.0169 |
| 144Sm | 0.08740.001 | 0.08690.0087 |
| 148Sm | 0.14230.003 | 0.15470.0113 |
| 150Sm | 0.19310.0021 | 0.18610.0097 |
| 152Sm | 0.30640.0027 | 0.3150.0157 |
| 154Sm | 0.3410.002 | 0.34430.0072 |
The deformation parameter as one main parameter of describing the deformed nuclei is treated as a probe to select the ground deformed nuclei from all initial nuclei in this article. In TABLE. 1, the in the chains of Nd and Sm isotopes are shown, including the experimental data from Ref. SRA2001 and the calculation based on Eq.(11). The statistical errors are also attached for each nucleus in the table. From the table, we can find the of our calculations are very close to the experimental values.
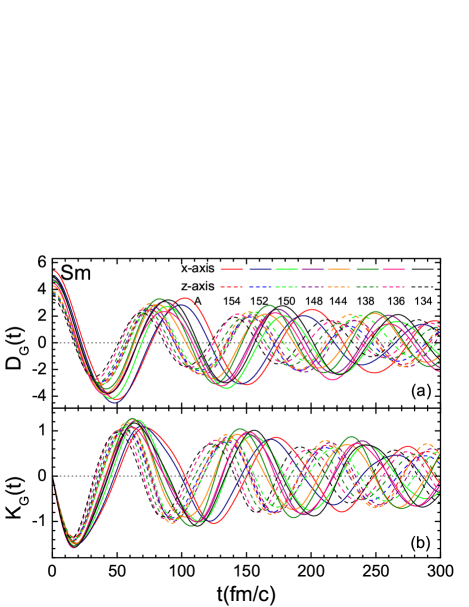
In this work, the collective motion are divided into two directions along and axis. The initial state wave function of the system is boosted by means of imposing a dipole excitation at fm/c. The time evolution of the dipole moments of Sm isotopes in coordinator space () and in momentum space () are shown in Fig.1 and , respectively. It is found that all the dipole oscillations are symmetrical around except for that close to the initial time. The resonance frequencies along the axis direction are lower than that in axis direction. That is why a deformed nucleus has two splitting peaks in its GDR spectrum. The same situation occurs in the Nd isotopes.
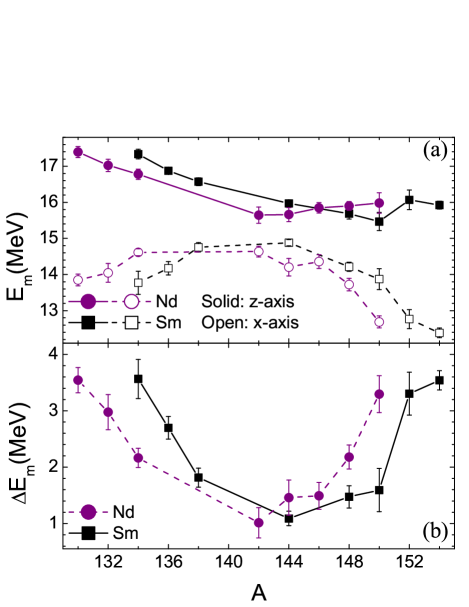
The total GDR spectra are obtained from the superposition of two GDR spectra along and axis by Eq.(16). The peak position () of the resonance maximum and the resonance width () are two indispensable parameters to get the total resonance strength. That is one reason to show the mass evolution of of GDRs in the chains of Sm and Nd isotopes in Fig.2. The open symbols denote the along axis, which corresponds to the major axis of a deformed nucleus. And the solid symbols represent the in axis direction, corresponding to the minor axis of the deformed nucleus. It can be seen that with the increasing of , the resonance in the axis direction firstly decreases, and then trends to increase. On the contrary, the resonance along axis direction gradually increases with the increasing of until the mass number equals to 142 in the chain of Nd isotopes and equals to 144 in the chain of Sm isotopes, and then gradually decreases. It is necessary to note that 142Nd and 144Sm are magic nuclei. From Fig.2 , it can be easily seen that the distance between the resonance along two axis firstly decrease with the increasing of and then increase, which can also be described as the less the deformation of a nucleus is, the closer the two resonance is. It confirms that the splitting peak in the deformed nuclei results from the deformation structure of the nuclei.
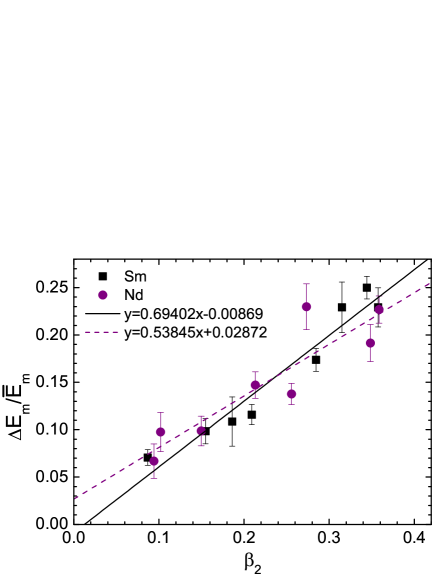
Furthermore, the correlation between and deformation parameter is shown in Fig.3. Note that is the mean resonance energy. Black squares denote the data of Sm isotopes and purple circles denote that of Nd isotopes. is computed based on Eq.(11). Both solid and dash lines are the linear fitting results. The fitting parameters also are listed in the figure. For the chain of Sm isotopes, the relationship between and deformation parameter is ; And for the chain of Nd isotopes, the relationship is . It also confirms that the splitting between the and axis modes of the deformed nuclei is proportional to the deformation, which has been described in detail in Ref. abbr1998 .
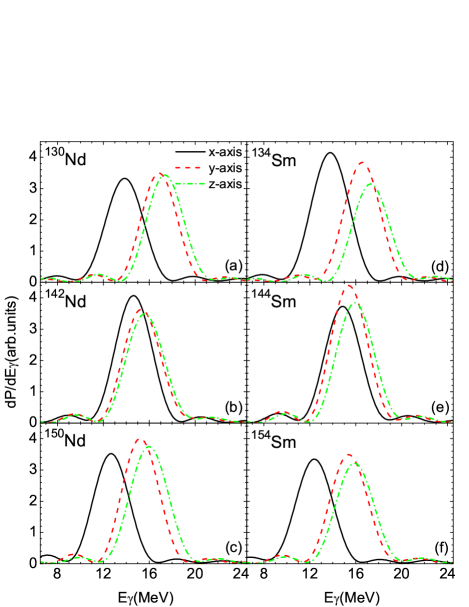
In Fig. 4, dipole strengths based on Eq. (14) for the separate modes in the framework of EQMD model are plotted with different lines. It can be seen that the oscillations along the axis which denote the major axis of symmetry correspond to the lower-energy state, and that along the axis and axis which denote the minor axis of symmetry correspond to the higher-energy state. For 142Nd and 144Sm which are magic nuclei, their resonance peaks along the three axes are so close that the total GDR spectrum have single-hump. However, for 130Nd, 150Nd, 134Sm and 154Sm, the resonance peaks along the major axis are much smaller than that along the minor axis and the resonance spectra along axis and axis nearly overlap. Consequently, in an ellipsoid-deformed nucleus, the total GDR spectrum has two-hump. For the resonance spectra along axis direction, it is not perfectly identical to the one along the z axis, which mostly results from the shape fluctuation of the initial deformed nucleus in EQMD model.
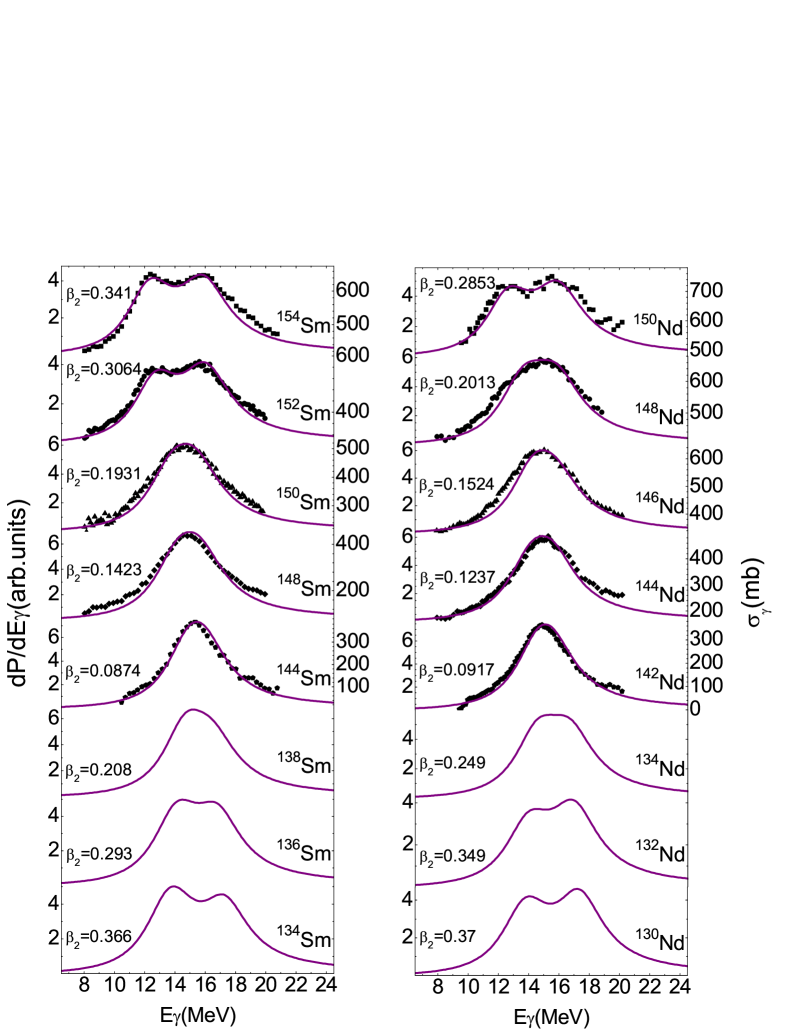
The deformation evolution of the total GDR spectra along and axis directions in Sm and Nd isotopes are plotted in Fig.5 where the deformation parameter from Ref. SRA2001 are inserted in each panel. The lines denote our calculation by Eq.(16) in the framework of EQMD model, scaled by the left axis and the dots denote the experimental data, scaled by the right axis. It needs to be pointed out that the photon absorption cross sections in the GDR range for 134Sm, 136Sm, 138Sm, 130Nd, 132Nd and 134Nd are unknown in the experiment so far. From Fig.5, one can see that the calculated GDRs can perfectly reproduce the shape of GDR spectra. For example, the GDR spectra have two distinctly splitting peaks in the region of strongly deformed nuclei, such as in 154Sm, 152Sm, 136Sm, 134Sm, 150Nd, 132Nd and 130Nd, while there is only one maximum value when the deformation of a nucleus is very small, especially for the magic nuclei 144Sm and 142Nd. What’s more, with the decreasing of the deformation of nuclei, the GDR width also decreases which occurs both in Sm and Nd isotopes. All of these characteristics above have been observed in the experiment. Additionally, it can also be seen that all of the peak position, for the isotopic chain of Sm () and Nd () isotopes, is well consistent with the measured data. Therefore, the results not only confirm the reliability of the methods and the model to study the GDR in deformed nuclei, but also predict the shapes of GDR spectra in Sm () and Nd () isotopes, which is possible to be verified by experiments.
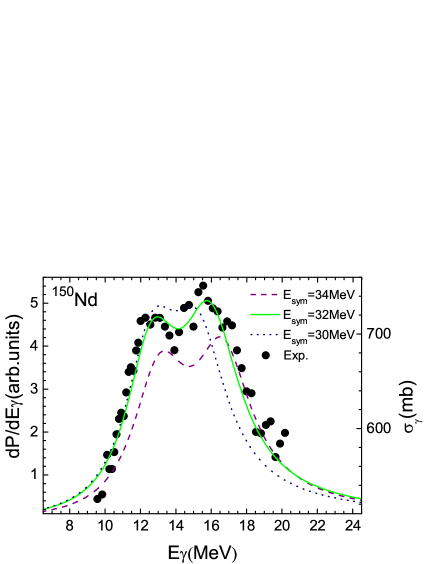
The dependence of the GDRs on symmetry energy coefficient () is also discussed for the heavy deformed nucleus of 150Nd in the EQMD model. The results are shown in Fig. 6. The dots represent the measured data from the experiment, which are the photon absorption cross sections in the GDR range, scaled by the right axis. The calculations are plotted as the different lines corresponding to different , scaled by the left axis. From the figure, it is cleanly seen that with the increasing of from 30 MeV to 34 MeV, the GDR spectra of the system have the obvious trend of moving to the right, i.e. the energy position of GDR is governed by the symmetry energy. Meanwhile, one can find that the calculation is well consistent with the experimental at = 32 MeV, which demonstrates that the 32 MeV is the best choice for the symmetry energy coefficient to investigate the GDRs in heavy deformed nuclei in the framework of EQMD model.
IV Summary and outlook
In summary, the deformation evolution of giant dipole resonance, in the isotopic chains of Sm and Nd, has been systematically studied under the framework of an extended quantum molecular dynamics model. The discussions are conducted about the mass dependence of resonance peak position in the major and minor axis directions as well as the difference between them, respectively. The between the two resonance firstly decreases with the increasing of and then trends to increase. It confirms that is extremely sensitive to the deformation of a nucleus. Moreover, the correlation between and the deformation parameter () is considered. For the isotopic chain of Sm, , and for the isotopic chain of Nd, . It further confirms that the splitting of the GDR spectra along major axis and minor axis is proportional to the deformation of a nucleus. Additionally, by comparing the calculation with the experimental data of photon absorption cross section , the results show that EQMD model can perfectly reproduce the shape of GDR spectra. The GDR spectra in 134Sm, 136Sm, 138Sm, 130Nd, 132Nd and 134Nd are also predicted in detail. Finally, the dependence of GDR spectra of 150Nd on symmetry energy coefficient are considered. The results demonstrate that the calculation is well consistent with the experimental results at = 32 MeV. It suggests that the EQMD model can be used to study the configuration structure of deformed nuclei.
In light of the success for describing the deformed GDR by the EQMD model, it is expected that it could also be applied to treat the pygmy dipole resonance (PDR) which can be considered as the oscillation between the weakly bound neutron skin and the isospin neutral proton-neutron core for neutron-rich nuclei. Previously on, a traditional QMD model has shown its capability to investigate PDR and GDR in Ni isotopes by Coulomb excitation ctyg2013 , it is naturally expected that the EQMD can do an even good job for the PDR study since more reasonable ground state nuclei could be obtained in the EQMD initialization in contrast to the traditional QMD initialization.
Acknowledgements.
This work is supported by the National Natural Science Foundation of China under Contracts Nos.11421505, 11305239 and 11220101005, the Major State Basic Research Development Program in China under Contracts No. 2014CB845401, the Strategic Priority Research Program of the Chinese Academy of Sciences under Grant No. XDB16, the Youth Innovation Promotion Association of CAS No.2017309, the Program for Science and Technology Innovation Talents in Universities of Henan Province under Grant No. 13HASTIT046, Natural Science Foundation in Henan Province under Grant No. 162300410179.References
- (1) W. B. He, Y. G. Ma, X. G. Cao et al., Phys. Rev. Lett. 113, 032506 (2014).’
- (2) W. B. He, Y. G. Ma, X. G. Cao et al., Phys. Rev. C 94, 014301 (2016).
- (3) A. Leistenschneider, T. Aumann, K. Boretzky et al., Phys. Rev. Lett. 86, 5442 (2001).
- (4) E. G. Fuller and E. Hayward, Nucl. Phys. 30, 613 (1962).
- (5) B. S. Ishkhanov and S. Yu. Troshchiev, Moscow University Physics Bulletin 66, 325 (2011).
- (6) B. L. Herman and S. C. Fultz, Rev. Mod. Phys. 47, 713 (1975).
- (7) W. Greiner and J. A. Maruhn, Nuclear Models, Springer, Berlin, Germany (1996).
- (8) A. Bohr and B. Mottelson, Nuclear Structure 2, 1 (1998).
- (9) M. Danos, Nucl. Phys. 5, 23 (1958).
- (10) M. Martini, S. Pru, S. Hilaire et al., Phys. Rev. C 94, 014304 (2016).
- (11) S. Pru, G. Gosselin, M. Martini et al., Phys. Rev. C 83, 014314 (2011).
- (12) K. Yoshida and and T. Nakatsukasa, Phys. Rev. C 88, 034309 (2013).
- (13) K. Yoshida et al., Phys. Rev. C 83, 021304(R) (2011).
- (14) J. A. Maruhn, P. G. Reinhard, P. D. Stevenson et al., Phys. Rev. C 71, 064328 (2005).
- (15) B. S. Ishkhanov et al., Phys. Part. Nucl. 38, 232 (2007).
- (16) S. Fracasso, E. B. Suckling, and P. D. Stevenson, Phys. Rev. C 86, 044303 (2012).
- (17) J. Tian and W. Ye, Nucl. Sci. Tech. 27, 145 (2016).
- (18) V. M. Masur and and L. M. Mel’nikova, Phys. Part. Nucl. 37, 923 (2006).
- (19) P. Carlos, H. Beil, R. Bergere et al., Nucl. Phys. A 225, 171 (1974).
- (20) P. Carlos, H. Beil, R. Bergere et al., Nucl. Phys. A 172, 437 (1971).
- (21) D. Pandit, B. Dey, D. Mondal et al., Phys. Rev. C 87, 044325 (2013).
- (22) W. Kleinig, V. O. Nesterenko, J. Kvasil et al., Phys. Rev. C 78, 044313 (2008).
- (23) J. Liang, L. G. Cao, and Z. Y. Ma et al., Phys. Rev. C 75, 054320 (2007).
- (24) I. Stetcu, A. Bulgac, P. Magierski et al., Phys. Rev. C 84, 051309(R) (2011).
- (25) N. D. Dang, K. Tanabe, and A. Arima, Nucl. Phys. A 645, 536 (1999).
- (26) T. Peach, U. Garg, Y. K. Gupta et al., Phys. Rev. C 93, 064325 (2016).
- (27) D. H. Youngblood, J. M. Moss, C. M. Rozsa et al., Phys. Rev. C 13, 994 (1976).
- (28) M. Itoh, H. Sakaguchi, M. Uchida et al., Phys. Lett. B 549, 58 (2002).
- (29) V.A. Plujko, R. Capote, and O.M. Gorbachenko, At. Data Nucl. Data Tables 97, 567 (2011).
- (30) J. H. Gundlach, K. A. Snover, J. A. Behr et al., Phys. Rev. Lett. 65, 2523 (1990).
- (31) T. Maruyama, K. Niita, and A. Iwamoto, Phys. Rev. C 53, 297 (1996).
- (32) J. Aichelin and H. Stcker, Phys. Lett. B 176, 14 (1986).
- (33) C. Hartnack, R. K. Puri, J. Aichelin et al., Eur. Phys. J. A 1, 151 (1998).
- (34) Z. Feng, Nucl. Sci. Tech. 26, S20512 (2015).
- (35) J. Chen, Z. Q. Feng, J. S. Wang et al., Nucl. Sci. Tech. 27, 73 (2016).
- (36) S. S. Wang, X. G. Cao, T. L. Zhang et al., Nucl. Phys. Rev. (in Chinese) 32, 24 (2015).
- (37) W. B. He, X. G. Cao, Y. G. Ma et al., Nucl. Tech. (in Chinese) 37, 100511 (2014).
- (38) M. Goldhaber and E. Teller, Phys. Rev. 74, 1046 (1948).
- (39) H. L. Wu, W. D. Tian, Y. G. Ma et al., Phys. Rev. C 81, 047602 (2010).
- (40) C. Tao, Y. G. Ma, G. Q. Zhang et al., Phys. Rev. C 87, 014621 (2013).
- (41) V. Baran, M. Cabibbo, M. Colonna et al., Nucl. Phys. A 679, 373 (2001).
- (42) S. Raman, C. W. NESTOR JR., and P. Tikkanen, At. Data Nucl. Data Tables 78, 1 (2001).