Optically levitated nanoparticle as a model system for stochastic bistable dynamics
Nano-mechanical resonators have gained an increasing importance in nanotechnology owing to their contributions to both fundamental and applied science. Yet, their small dimensions and mass raises some challenges as their dynamics gets dominated by nonlinearities that degrade their performance, for instance in sensing applications. Here, we report on the precise control of the nonlinear and stochastic bistable dynamics of a levitated nanoparticle in high vacuum. We demonstrate how it can lead to efficient signal amplification schemes, including stochastic resonance. This work paves the way for the use of levitated nanoparticles as a model system for stochastic bistable dynamics, with applications to a wide variety of fields.
Introduction
Nano-mechanical resonators need to meet criteria of light mass and high-Q factor in order to maximize their performances when operated as linear force transducers. However, these features lead to intrinsically nonlinear behaviour Gieseler2013Thermal , with consequent vanishing dynamical range. To overcome this limitation, modern nanotechnology requires new sensing schemes that take nonlinearities into account and even benefit from them Villanueva2013Surpassing . Many of the proposed solutions operate inside an instability region Aldana2014Detection ; Papariello2016Ultrasensitive or close to a bifurcation point Karabalin2011Signal ; Siddiqi2004RF-Driven , where the system ideally becomes infinitely sensitive. Others exploit fluctuations of noisy environments to trigger stochastic resonances Gammaitoni1998Stochastic that amplify weak harmonic signals Venstra2013Stochastic ; Badzey2005Coherent ; Almog2007Signal . For all these sensing applications, a single nanopartticle optimally decoupled from the environment represents a particularly interesting system in the family of high-Q resonators. In fact, since its very first realization Gieseler2012Subkelvin , optical levitation of a nano-scale object in vacuum has enabled several ground-breaking experiments, including demonstration of zeptonewton force sensitivity Gieseler2013Thermal ; Ranjit2016Zeptonewton , tests of fluctuation theorems and stochastic thermodynamics Gieseler2014Dynamic ; Millen2014Nanosacale , as well as the observation of photon recoil heating Jain2016Direct .
In this work, we demonstrate full control on the linear, non-linear and bistable dynamics of a levitated nanoparticle in high vacuum and under the effect of external noise. The potential of our platform is validated by the implementation of two nonlinear amplification schemes, including stochastic resonance Gammaitoni1998Stochastic . Remarkably, we demonstrate, in excellent agreement with theory, up to amplification of non-resonant harmonic force at the atto-newton scale. In addition, the unprecedented level of control achieved will enable the use of levitated nanoparticles as a model system for stochastic bistable dynamics with applications to a wide range of fields including biophysics Hayashi2012Single ; Angeli2004Detection , chemistry Simakov2013Noise ; Hanggi1990Reaction-rate and nanotechnology Myers2015Information .
Results
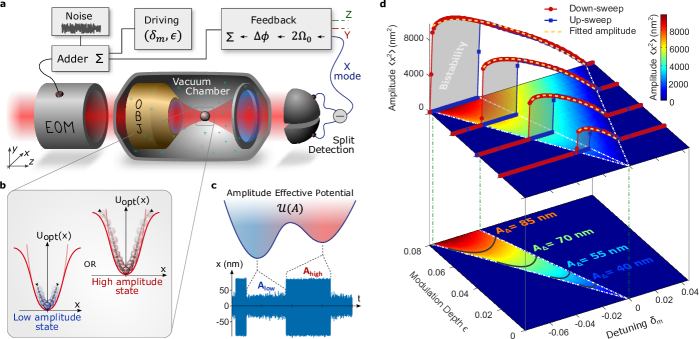
Our experiment is sketched in Fig. 1a. A single silica nanoparticle ( in diameter) is optically trapped in vacuum by a tightly focused laser beam, and its 3D trajectory monitored with a balanced split detection scheme. The detector signal controls an electro-optic modulator (EOM) that feedback-cools all three translational degrees of freedom by modulating the laser intensity. In high-vacuum conditions () the mechanical Q-factor, given by the gas damping , is measured to be . Under feedback, the nanoparticle oscillates at non-degenerate angular frequencies with very small amplitudes, corresponding to sub-Kelvin effective temperatures Gieseler2012Subkelvin . By optimizing the feedback settings (Supplementary Note 2) and carefully screening important sources of noise such as mechanical vibrations and air turbulences, we obtain a highly stable resonator with frequency fluctuations improved by one to two orders of magnitude compared to previous works Gieseler2013Thermal ; Gieseler2014Nonlinear (See Supplementary Note 3). When one of the spatial modes is parametrically driven at resonance Gieseler2014Nonlinear , the particle explores the anharmonic part of the optical potential, which can be modelled as a Duffing nonlinearity Gieseler2013Thermal . As a result, the equation of motion for the driven coordinate, which we choose to be , reads
| (1) |
where is the non-linear feedback-induced damping coefficient, is the Duffing term prefactor, and are, respectively, the modulation depth and modulation frequency of the driving signal. Finally, the fluctuating force has two contributions. The first one, , represents the stochastic force arising from random collisions with residual air molecules in the chamber, while the second, , represents artificial parametric noise that we add through the EOM. See Supplementary Note 1 for further experimental set-up details.
The nonlinear response of the resonator is fully characterized by measuring the oscillation amplitude in the driving parameters phase space , where is the normalized detuning Gieseler2014Nonlinear . When the modulation frequency is decreased (down-sweep) across the resonant condition , the amplitude response spans a triangular region corresponding to the first instability tongue Lifshitz2008Nonlinear . This is shown in the top 2D false color map of Fig. 1d. In the opposite case of a frequency up-sweep, however, the system displays hysteresis, and the tongue results in a narrower width. The red and blue cross cuts in Fig. 1d clearly show this behaviour, identifying a region where two stable oscillation states coexist (see Fig. 1b,c). The bistability region, shown at the bottom of Fig. 1d, is obtained by subtracting up- from down-sweeps maps. By fitting our experimental data with the analytical solution (See Supplementary Equation 1 and Ref. Gieseler2014Nonlinear ) we retrieve the nonlinear coefficients and . Such precision measurements are made possible by the highly stable oscillation frequencies that lead to minimal drifts of the detuning parameter (, over the over the entire measurement time), therefore allowing to predict with excellent agreement the boundaries of the instability tongues (white lines in Fig. 1d). Further details on spectral features of the nonlinear response are provided in Supplementary Note 4.
Inside the bistable region, natural thermal noise can activate spontaneous transitions between low and high amplitude states. However, in high vacuum these events are extremely rare, which makes our system a promising candidate for nonlinear sensing. In order to observe stochastic activation within a reasonable time we therefore add to the EOM a Gaussian noise of amplitude , that in turns produces a position dependent parametric stochastic force of the form . Noise calibration can be performed by looking at the particle’s oscillation amplitude in the absence of parametric driving Mestres2014Realization . For low noise levels, the particle’s dynamics remains unaffected, being still dominated by the thermomechanical noise of the environment. However, for sufficiently high noise, the particle’s amplitude starts to increase. Assuming an effective temperature , the noise amplitudes are calibrated into meaningful temperature units (See Supplementary Note 5). Interestingly, the measured trend differs from what reported in other systems Venstra2013Stochastic , where a quadratic dependence between and was found. This is to be ascribed to the parametric (i.e. multiplicative) nature of the noise injected in the present case, and prompts the interest of future studies.
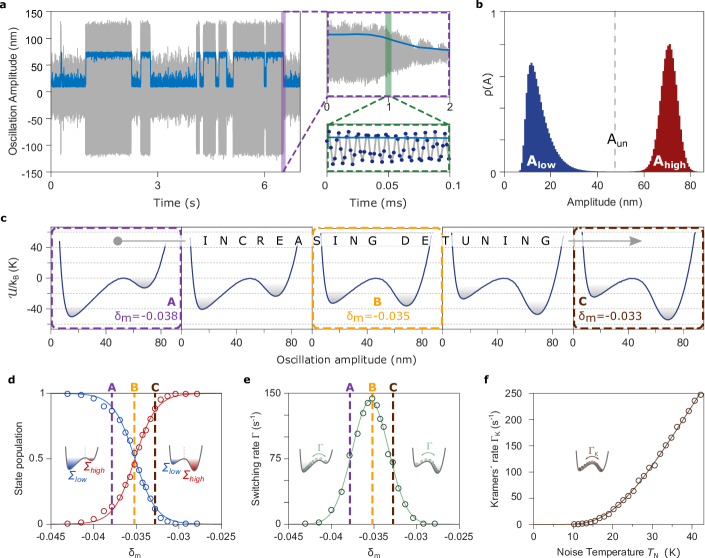
The stochastic switching dynamics of the levitated nanoparticle is investigated via the injection of noise. Figure 2a illustrates position and amplitude time traces corresponding to few switching events and emphasizes the remarkable ability of our tracking scheme to resolve considerably different time scales.
The amplitude probability distribution , obtained by analysing the particle trajectory over approximately one minute, is shown in Fig. 2b.
Even though the particle is in a non-thermal state due to the applied parametric control Gieseler2014Dynamic , we introduce a simplified model that describes the dynamics of its amplitude as the motion of a thermal fictitious particle in a double well potential. This justifies the use of the Boltzmann-Gibbs distribution to extract the amplitude effective potential that models the bistable dynamics. Note that this approximation does not induce any inconsistency in the subsequent analysis, which relies in the experimental determination of the symmetric condition for .
The high frequency stability of the system allows us to finely modify the probability distribution , and hence to engineer almost at will the shape of following any path inside the bistable regime. An interesting case consists of the so called iso-amplitude lines: paths along which the amplitude , and consequently the amplitude gap , is kept constant. These particular subsets of the phase space are nonlinear features generally hidden by the frequency noise that blurs the measured instability tongue Almog2007Signal ; Gieseler2014Nonlinear . Thanks to the reduced frequency fluctuations, they are clearly visible in our system. Few examples of iso-amplitude lines are shown in the lower panel of Fig. 1d (solid lines), and satisfy the following relation (See Supplementary Note 4 for derivation):
| (2) |
being . By following an iso-amplitude line with a fixed , we obtain a very smooth evolution of the effective potential (see Fig. 2c). Starting from an asymmetrically tilted configuration, it progressively undergoes inversion of its shape, passing through a quasi-symmetric condition where the potential barrier determines equal depth of the two wells. It is important to stress that, upon this ad-hoc dynamical sweep of and , the two minima of the potential corresponding to the amplitudes and , maintain their position fixed. Clearly, this would not be the case when following any other path, for example moving along lines (see cross-cuts in Fig. 1d). The populations of the two states and , defined as the normalized integrals of the amplitude distribution respectively above and below a threshold , are shown in Fig. 2d, and display an inversion consistent with the potential dynamics observed in Fig. 2c. The switching rate also depends significantly on the detuning (see Fig. 2e), with a maximum corresponding to the symmetric potential configuration. Under this symmetry condition the switching rate, as a function of noise temperature , is expected to follow Kramers’ law . However, the injection of noise and its interplay with nonlinearities leads to a drift of the oscillation frequency, equivalent to a change in the detuning , thereby distorting the symmetric potential (see Supplementary Note 6). If this change were not taken into account, a decay of the switching rate would be observed Venstra2013Stochastic . Conversely, if an adjusted detuning is applied (See Supplementary Fig. 8), the symmetric potential is preserved and the prediction of Kramers’ law is perfectly met, as we show in Fig. 2f.
The achieved control over the bistable dynamics makes of our system a very flexible platform for studying two different signal amplification schemes. The first relies on a common phenomenon in bistable systems called stochastic resonance (SR) Gammaitoni1998Stochastic . A weak periodic perturbation induces a modulation of the potential barrier separating the two states, and leads to an overall synchronized (i.e. quasi-coherent) switching dynamics when the interwell transition rate matches twice the frequency of the perturbation. Given that this rate depends monotonically on the amount of noise in the system, SR leads to a noise-induced rise (and then fall) of the signal-to-noise ratio (SNR), and can therefore be exploited to amplify a narrow-band signal in a nonlinear system under appropriate conditions.
To this aim, we prepare the bistable system driving the particle with suitably chosen parameters . Once more, the noise-dependent detuning avoids the escape from the bistable region as a consequence of hysteresis quenching Aldridge2005Noise ; Venstra2013Stochastic , which in turn would prevent the observation of the full SR curve when noise is increased. The periodic () perturbation is then introduced modulating the depth of the parametric driving signal, namely , where the modulation strength corresponds to optical forces of ten to a hundred atto-Newtons for the parameters used in our experiment. Amplitudes are measured with long acquisition times () and repeated for increasing noise temperatures.
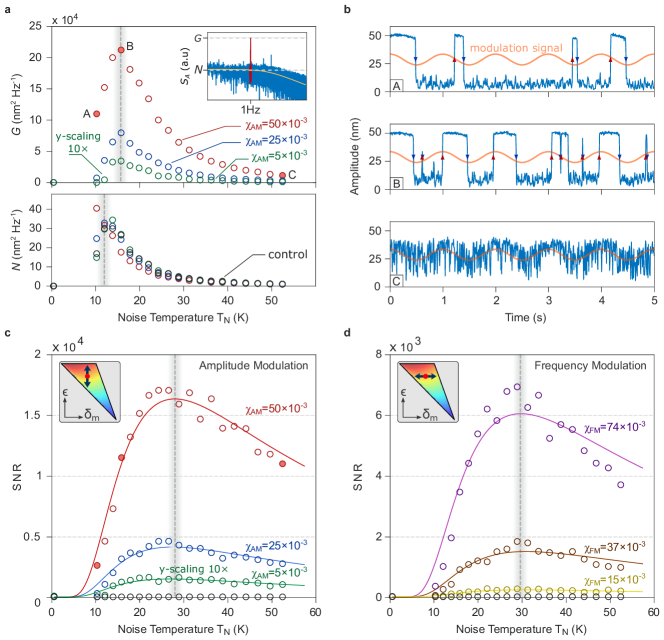
At (point marked A) switching events are only partially correlated with the modulation signal (see Fig. 3b). Instead, when noise is increased to (point B) the system clearly exhibits an overall synchronization. A spectral analysis of the corresponding amplitude trace shows that features an extremely sharp peak precisely at (see inset in Fig. 3a), for which spectral amplification and noise floor can be defined. When noise is further increased, the switching dynamics loses correlation with the modulation signal. Interestingly, a similar and counterintuitive behaviour is observed in the noise floor , which presents a similar non-monotonic trend caused by a redistribution of noise intensity towards higher frequencies. Linear perturbation theory of stochastic resonance Gammaitoni1998Stochastic (See Supplementary Note 7) predicts a of the form:
| (3) |
where is the modulation of the potential, proportional to .
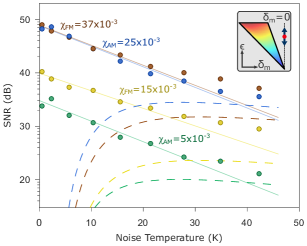
Figure 3c shows the experimental SNR curves for different values of , together with a fitting of eq. (3) that displays very good agreement. Similarly, the ratios of the fitted modulation depths are also in good agreement with the expected ratios .
A second SR experiment was carried out for frequency modulation of the driving signal, , which according to our study (see Fig. 2c), induces a potential modulation consistent with SR requirements. The corresponding results are shown in Fig. 3d. We emphasize the fact that previous experiments have only explored amplitude modulation, and that this is the first experimental demonstration of SR with frequency modulated signals. Again the fitted modulation strengths give ratios , in good agreement with the expected ones . Interestingly, the resonance appears at a noise temperature equivalent to the one observed in the amplitude modulation case. This is consistent with the fixed value of along the two experiments that requires an equal in order to fulfil the time-scale matching of the resonant condition.
Our platform enables us to directly compare the SR experiment with another amplification scheme that is implemented by changing the driving parameters to zero detuning. For , the particle is driven outside of the bistable regime, but still inside the instability tongue (see inset in Fig. 4). In this configuration, the effective potential is monostable, and the AM and FM modulations applied (having same as in the SR case) result in a modulation of the oscillation amplitude for which a spectral analysis still leads to the observation of a peak at . The corresponding SNR as a function of noise temperature are shown in Fig. 4, together with fitted exponential decays that properly follow the experimental data for , and the fits of Fig. 3c,d in order to ease a direct comparison of the two amplification schemes. Independently of the noise level, direct amplification always features a higher SNR than the corresponding SR, and the two methods give similar outcomes at high . This result is an experimental verification of the central dogma of signal detection theory Tougaard2002Signal , namely that stochastic resonance can decrease the SNR degradation of a noisy signal but it does not provide a mechanism by which the undetectable becomes detectable Petracchi2000What ; Dykman1998What . The couterinuitive nature of SR, in fact, mainly relies on suboptimal parameter ranges McDonnell2009What , here exemplified by the fact that the same modulation becomes remarkably detectable when the detuning is set to zero, without the need of adding noise. Nonetheless, the fact of SR being observed in a wide variety of settings poses the question of why this phenomenon is omnipresent and favoured by nature. We surmise that suboptimal balanced configurations are generally preferable when dealing with very complex systems, for which optimal conditions would be difficult to achieve. Thus, exploiting ambient noise and stochastic resonance appears to be a successful strategy to ensure a robust amplification method that, at least above certain thresholds, is less sensitive to noise changes than other detection schemes (check Fig. 4).
Discussion
In conclusion, we presented an extensive study of the stochastic bistable dynamics of a levitated nanoparticle in high vacuum. The high stability achieved - in particular close to the bifurcation point - enabled the application of our system as a test platform for different amplification schemes, leading (to our knowledge) to the first qualitative and quantitative agreement between the stochastic resonance of a nanomechanical resonator and the corresponding analytical models. The present state of the experiment allowed to up to amplification of a parametric force at the attonewton scale that was mimicked by modulating the trap stiffness. A similar perturbation could arise from a time varying nonlinear potential. However, to evaluate the performance of our system to detect a conventional linear force, a direct actuation is required. This could be implemented by electrically coupling a charged particle Alda2016Trapping to an external field Ranjit2016Zeptonewton or via scattering force from a weakly focused beam and is the subject of future work. The unprecedented performances demonstrated could enable the realization of novel ultra-sensitive threshold sensors, capable of detecting tiny perturbations via a state change in the system, or other detection schemes based on nonlinear nanomechanical resonators Aldana2014Detection ; Papariello2016Ultrasensitive . Likewise, a high-Q parametrically driven Duffing resonator could boost the state-of-the-art in nanomechanical memory elements Mahboob2014Two-mode ; Bagheri2011Dynamic introducing additional bits by simultaneous manipulation of the orthogonal oscillation modes Frimmer2016Cooling . In the parametrically driven regime our system could also enable fundamental search for classical to quantum transitions Katz2007Signatures , and prompt the realization of quantum-enhanced sensing techniques. Finally, we foresee in optically levitated nanoparticles a suitable platform for mimicking very complex stochastic nonlinear dynamics, able to shine a light on natural phenomena such as bio-molecule folding Hayashi2012Single ; Angeli2004Detection , hearing Eguiluz2000Essential ; Martignoli2013Pitch and neural signalling McDonnell2011TheBenefits .
Methods
Sampling. The amplitude is tracked by sampling position at and integrating over successive positions measurements. The value of depends on the temporal resolution needed in the particular measurement to be carried out. We set for the data shown in Fig. 1, for the amplitude time traces (blue data) of Fig. 2a and to for the SR experiment of Fig. 3. In this latter data sets, the acquisition time of a single amplitude trace at constant noise temperature (see Fig. 3b) was . However, in order to display a meaningful dynamics, we show only time traces.
Data availability
The data that support the findings of this study are available from the corresponding author on reasonable request.
Authors’ Present address
R.A.R.: Departamento de Física Atómica, Molecular y Nuclear, Universidad de Granada, 18071, Granada.
M.S.: Center for Solid State Physics and New Materials, Institute of Physics in Belgrade, 11080 Belgrade, Serbia.
L.R.: Laboratoire Aimé Cotton, CNRS, Université Paris-Sud, ENS Cachan,
Université Paris-Saclay, 91405 Orsay Cedex, France
Corresponding authors
F.R.: francesco.ricci@icfo.eu
R.Q.: romain.quidant@icfo.eu
References
- (1) Gieseler, J., Novotny, L. & Quidant, R. Thermal nonlinearities in a nanomechanical oscillator. Nat. Phys. 9, 806–810 (2013).
- (2) Villanueva, L. G. et al. Surpassing fundamental limits of oscillators using nonlinear resonators. Phys. Rev. Lett. 110, 1–5 (2013).
- (3) Aldana, S., Bruder, C. & Nunnenkamp, A. Detection of weak forces based on noise-activated switching in bistable optomechanical systems. Phys. Rev. A 90, 1–8 (2014).
- (4) Papariello, L., Zilberberg, O., Eichler, A. & Chitra, R. Ultrasensitive hysteretic force sensing with parametric nonlinear oscillators. Phys. Rev. E 94, 022201 (2016).
- (5) Karabalin, R. B. et al. Signal amplification by sensitive control of bifurcation topology. Phys. Rev. Lett. 106, 1–4 (2011).
- (6) Siddiqi, I. et al. RF-Driven Josephson Bifurcation Amplifier for Quantum Measurement. Phys. Rev. Lett. 93, 207002 (2004).
- (7) Gammaitoni, L., Hänggi, P. & Jung, P. Stochastic resonance. Rev. Mod. Phys. 70, 223–287 (1998).
- (8) Venstra, W. J., Westra, H. J. R. & van der Zant, H. S. J. Stochastic switching of cantilever motion. Nat. Commun. 4, 2624 (2013).
- (9) Badzey, R. L. & Mohanty, P. Coherent signal amplification in bistable nanomechanical oscillators by stochastic resonance. Nature 437, 995–998 (2005).
- (10) Almog, R., Zaitsev, S., Shtempluck, O. & Buks, E. Signal amplification in a nanomechanical Duffing resonator via stochastic resonance. Appl. Phys. Lett. 90, 1–4 (2007).
- (11) Gieseler, J., Deutsch, B., Quidant, R. & Novotny, L. Subkelvin parametric feedback cooling of a laser-trapped nanoparticle. Phys. Rev. Lett. 109, 1–5 (2012).
- (12) Ranjit, G., Cunningham, M., Casey, K. & Geraci, A. A. Zeptonewton force sensing with nanospheres in an optical lattice. Phys. Rev. A 93, 053801 (2016).
- (13) Gieseler, J., Quidant, R., Dellago, C. & Novotny, L. Dynamic relaxation of a levitated nanoparticle from a non-equilibrium steady state. Nat. Nanotech. 9, 358–64 (2014).
- (14) Millen, J., Deesuwan, T., Barker, P. & Anders, J. Nanoscale temperature measurements using non-equilibrium Brownian dynamics of a levitated nanosphere. Nat. Nanotech. 9, 425–9 (2014).
- (15) Jain, V. et al. Direct measurement of photon recoil from a levitated nanoparticle. Phys. Rev. Lett. 116, 243601 (2016).
- (16) Hayashi, K., de Lorenzo, S., Manosas, M., Huguet, J. M. & Ritort, F. Single-molecule stochastic resonance. Phys. Rev. X 2, 031012 (2012).
- (17) Angeli, D., Ferrell, J. E. & Sontag, E. D. Detection of multistability, bifurcations, and hysteresis in a large class of biological positive-feedback systems. Proc. Natl Acad. Sci. USA 101, 1822–1827 (2004).
- (18) Simakov, D. S. A. & Pérez-Mercader, J. Noise induced oscillations and coherence resonance in a generic model of the nonisothermal chemical oscillator. Sci. Rep. 3, 2404 EP – (2013). Article.
- (19) Hänggi, P., Talkner, P. & Borkovec, M. Reaction-rate theory: Fifty years after Kramers. Rev. Mod. Phys. 62, 251–341 (1990).
- (20) Myers, C. J., Celebrano, M. & Krishnan, M. Information storage and retrieval in a single levitating colloidal particle. Nat. Nanotech. 10, 886–891 (2015).
- (21) Gieseler, J., Spasenović, M., Novotny, L. & Quidant, R. Nonlinear mode coupling and synchronization of a vacuum-trapped nanoparticle. Phys. Rev. Lett. 112, 1–5 (2014).
- (22) Lifshitz, R. & Cross, M. C. Nonlinear Dynamics of Nanomechanical and Micromechanical Resonators, 1–52 (Wiley-VCH, 2009).
- (23) Mestres, P., Martinez, I. A., Ortiz-Ambriz, A., Rica, R. A. & Roldan, E. Realization of nonequilibrium thermodynamic processes using external colored noise. Phys. Rev. E 90, 032116 (2014).
- (24) Aldridge, J. S. & Cleland, A. N. Noise-enabled precision measurements of a duffing nanomechanical resonator. Phys. Rev. Lett. 94, 5–8 (2005).
- (25) Tougaard, J. Signal detection theory, detectability and stochastic resonance effects. Biological Cybernetics 87, 79–90 (2002).
- (26) Petracchi, D. What is the role of stochastic resonance? Chaos, Solitons and Fractals 11, 1827–1834 (2000).
- (27) Dykman, M. I. & McClintock, P. V. E. What can stochastic resonance do? Nature 391, 344 (1998).
- (28) McDonnell, M. D. & Abbott, D. What is stochastic resonance? Definitions, misconceptions, debates, and its relevance to biology. PLoS Computational Biology 5 (2009).
- (29) Alda, I., Berthelot, J., Rica, R. A. & Quidant, R. Trapping and manipulation of individual nanoparticles in a planar paul trap. Appl. Phys. Lett. 109, 163105 (2016).
- (30) Mahboob, I., Okamoto, H. & Yamaguchi, H. Two-mode thermal-noise squeezing in an electromechanical resonator. Phys. Rev. Lett. 113, 1–5 (2014).
- (31) Bagheri, M., Poot, M., Li, M., Pernice, W. P. H. & Tang, H. X. Dynamic manipulation of nanomechanical resonators in the high-amplitude regime and non-volatile mechanical memory operation. Nat. Nanotech. 6, 726–732 (2011).
- (32) Frimmer, M., Gieseler, J. & Novotny, L. Cooling mechanical oscillators by coherent control. Phys. Rev. Lett. 117, 163601 (2016).
- (33) Katz, I., Retzker, A., Straub, R. & Lifshitz, R. Signatures for a classical to quantum transition of a driven nonlinear nanomechanical resonator. Phys. Rev. Lett. 99, 040404 (2007).
- (34) Eguíluz, V. M., Ospeck, M., Choe, Y., Hudspeth, a. J. & Magnasco, M. O. Essential nonlinearities in hearing. Phys. Rev. Lett. 84, 5232–5235 (2000).
- (35) Martignoli, S., Gomez, F. & Stoop, R. Pitch sensation involves stochastic resonance. Sci. Rep. 3, 2676 EP – (2013). Article.
- (36) McDonnell, M. D. & Ward, L. M. The benefits of noise in neural systems: bridging theory and experiment. Nat. Rev. Neurosci. 12, 415–426 (2011).
Acknowledgments
The authors acknowledge financial support from the ERC- QnanoMECA (Grant No. 64790), the Spanish Ministry of Economy and Competitiveness, under grant FIS2016-80293-R and through the “Severo Ochoa” Programme for Centres of Excellence in R&D (SEV-2015-0522), Fundació Privada CELLEX and from the CERCA Programme/Generalitat de Catalunya. J. G. has been supported by H2020-MSCA-IF-2014 under REA grant Agreement No. 655369. L.R acknowledges support from an ETH Marie Curie Cofund Fellowship.
Author contributions
F.R., M.S., R.A.R. and R.Q. conceived the experiment. J.G. and F.R. designed and implemented the experimental set-up and wrote all data acquisition software. F.R. performed the experiment. F.R. and R.A.R. analysed the data with input from M.S., J.G., L.R. and L.N. All authors contributed to manuscript writing. R.Q. and L.N. supervised the work.