Astrophysical interpretation of Pierre Auger Observatory measurements of the UHECR energy spectrum and mass composition
Abstract
We present a combined fit of a simple astrophysical model of UHECR sources to both the energy spectrum and mass composition data measured by the Pierre Auger Observatory. The fit has been performed for energies above 5 EeV, i.e. the region of the all-particle spectrum above the so-called “ankle”’ feature. The astrophysical model we adopted consists of identical sources uniformly distributed in a comoving volume, where nuclei are accelerated with a rigidity-dependent mechanism. The fit results suggest sources characterized by relatively low maximum injection energies and hard spectral indices. The impact of various systematic uncertainties on the above result is discussed.
1 Introduction
Ultra-high-energy cosmic rays (UHECRs) are particles reaching the Earth from outer space with energies above . More than half a century after their discovery, their origin is still unknown, but there is a wide consensus that most of the highest-energy cosmic rays originate outside of our galaxy. If this is the case, their energy spectrum and mass composition is non-trivially affected by interactions with photon backgrounds during their propagation through intergalactic space, making it harder to infer properties of their sources from Earth-based observations. Also, whereas the energy of UHECRs can now be measured with resolution and systematic uncertainty less than , determinations of their mass are still strongly model-dependent and only possible on a statistical basis.
The Pierre Auger Observatory bib:Auger in western Argentina is the largest UHECR observatory in the world. It is operated by a collaboration of about 500 members from 86 institutions in 18 countries. The baseline array for the study of the highest-energy cosmic rays consists of 1 660 water-Cherenkov stations on a triangular grid with 1 500 m spacing covering a 3 000 km2 area (the surface detector array, SD), overlooked by 24 telescopes in four locations at the periphery of the array (the fluorescence detector, FD). The Observatory also includes extra SD stations with closer spacing and three extra FD telescopes with higher elevation for the study of lower-energy cosmic rays, and various other facilities for atmospheric monitoring, R&D, and interdisciplinary studies.
The FD can only operate during clear moonless night (duty cycle ), but it provides us with near-calorimetric measurements of shower energies. These are used to calibrate the energy scale of the SD, which has duty cycle . The FD also provides us with measurements of the shower maximum depth , the most important observable sensitive to the mass composition of UHECRs.
We present the result of a simple phenomenological model of UHECR sources to Pierre Auger Observatory measurements of the energy spectrum and distributions for energies above eV, as a demonstration of the constraining power of Auger data. The source model is not necessarily intended to be astrophysically plausible. The data above eV consist of 15 bins for the energy spectrum bib:spectrum and 110 non-empty bins for the distributions bib:Xmax . Most of these results were already presented in refs. bib:ICRC ; bib:CRIS . An updated version of this work will be published in ref. bib:FAL .
2 The models we used
2.1 The astrophysical sources
In this work, we assume that all UHECR sources are identical, with constant comoving density, and they emit hydrogen-1, helium-4, nitrogen-14 and iron-56 with a broken exponential rigidity cutoff, for and for . The free parameters of the fit are the normalization constant , the spectral parameters and , and three of the mass fractions (the fourth being bound by ). The choice of cutoff shape is motivated by numerical convenience rather than astrophysical plausibility, but we will also show the effects of using a different cutoff shape.
2.2 The propagation through intergalactic space
We simulate the propagation of UHECRs using two publicly available Monte Carlo codes (SimProp v2r3 and CRPropa 3), along with two models for the extragalactic background light (EBL) spectrum and evolution (Gilmore et al. 2012 and Domínguez et al. 2011) and three models of photodisintegration cross sections (PSB, TALYS and Geant4), in the combinations listed in table 1. An overview of the differences between the two simulation codes and the effects of different EBL and photodisintegration models can be found in ref. bib:SAL .
| model | MC code | photodisint. | EBL | |||
|---|---|---|---|---|---|---|
| SPG | SimProp | PSB | Gilmore | |||
| SPD | SimProp | PSB | Domínguez | |||
| STG | SimProp | TALYS | Gilmore | |||
| CTG | CRPropa | TALYS | Gilmore | |||
| CTD | CRPropa | TALYS | Domínguez | |||
| CGD | CRPropa | Geant4 | Domínguez |
2.3 Interactions in the atmosphere
We model the distribution for each primary energy and mass number as a Gumbel distribution bib:Gumbel with parameter values found by fitting it to the results of CONEX simulations of air showers assuming epos LHC bib:EPOS , sibyll 2.1 bib:Sibyll or QGSJET II-04 bib:QGSJet as the hadronic interaction model. We then multiply these distributions by the detector acceptance and convolve them by the detector resolution bib:Xmax .
3 Our results
3.1 The reference fit
Using the SPG model of UHECR propagation, the epos LHC model of air interactions, and neglecting the systematic uncertainties in the measurements, the best fit to the measured energy spectrum and distributions is found with a relatively hard source spectral index , low cutoff rigidity EV (see table 1), and heavy composition ( helium, nitrogen, and iron). Similar results have already been found by other authors, e.g. bib:ABB ; bib:TAH . The deviance (generalized ) per degree of freedom of our fit is , corresponding to a -value of . The best-fit region extends to very low , because, in the energy range of interest, changes in either spectral parameter can be nearly compensated by changes in the other spectral parameter and the mass composition.
In this scenario, the high-energy cut-off in the all-particle spectrum at Earth is mostly given by the photodisintegration of medium-heavy elements, whereas the injection cut-off does limit the flux of secondary protons with EeV. Since the cutoff rigidity corresponds to an energy per nucleon way below the threshold for pion production on the CMB, the resulting flux of cosmogenic neutrinos at EeV energies is negligible. Also, particles with magnetic rigidity EV can be deflected by intergalactic and galactic magnetic fields by several tens of degrees even when originating from relatively nearby sources bib:deflections , making it very hard to infer source positions.
There also is a second local minimum at , EV, but due to the absence of a low rigidity cutoff this model predicts a higher admixture of protons at high energies than indicated by the narrowness of the observed distributions.
3.2 Effects of systematic uncertainties
Most of the physical quantities relevant to the propagation of UHECRs in intergalactic space are well known, but some are still very uncertain. For example, recent models of the EBL still differ by a factor of 2 in the far infrared, and photodisintegration branching ratios have only been measured for a few channels bib:SAL . To assess the sensitivity of our fit to these uncertainties, we repeated it using various combinations of simulation codes and EBL and photodisintegration models. The results are shown in table 1. The best-fit parameter values in the various models differ by much more than their statistical uncertainties, but they are all aligned in a hyperbola-shaped region of the plane where the injection spectra in the energy range we are interested in are similar.
Details of hadronic interactions in kinematic regions relevant to air shower development are not accessible to accelerator-based measurements and extrapolations are necessary. In our reference fit we used the epos LHC model; using sibyll 2.1 or QGSJET II-04 instead, which predict shallower values, would result in unacceptable fits even at very low . Note that the differences between these models may understate the actual uncertainties in hadronic interactions bib:uncertainties .
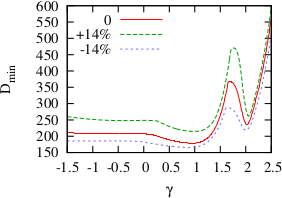
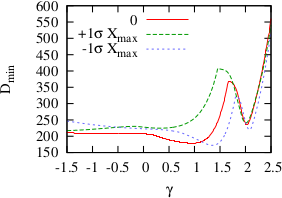
We also repeated the fit shifting all energy or measurements within their measurement systematic uncertainty. The resulting best-fit deviance (as a function of , all other parameters being re-fitted to minimize the deviance) is shown in fig 1, left panels.
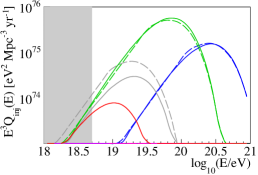
Finally, using a different shape (simple exponential) for the injection cutoff function results in different numerical values for the parameters (, ) but they correspond to very similar injection spectra (see fig 1, right panel) with little difference in the fit deviance ().
4 Discussion and conclusions
We found that our fit results are very strongly sensitive to systematic uncertainties in predictions and measurements: shallower predictions or deeper measurements require a lower injection spectral index and cutoff rigidity and result in a worse fit. The planned upgrade AugerPrime will also measure another independent mass-sensitive observable, the muon number, hopefully helping us alleviate the uncertainties in primary mass determinations. To a lesser extent, our fit is sensitive to the interaction rates in UHECR propagation, which depend on the EBL intensity and photodisintegration cross sections: lower interaction rates tend to require higher and and result in better fits. The systematic uncertainty on the energy scale and the shape of the injection cutoff have comparatively minor impacts on the fit.
In a forthcoming work bib:FAL , we will publish an update of this fit, in which we will use the latest SD data, correctly take into account the SD energy resolution and Poisson statistics, include silicon-28 among the possible injected elements, study the effects of possible redshift evolutions of source emissivity (e.g. ), and qualitatively discuss the effects of possible extra sub-ankle components.
References
- (1) A. Aab et al. (Pierre Auger), Nucl. Instrum. Meth. A798, 172 (2015), 1502.01323
- (2) A. Schulz (Pierre Auger), proc. 33rd ICRC p. 0769 (2013), 1307.5059
- (3) A. Aab et al. (Pierre Auger), Phys. Rev. D90, 122005 (2014), 1409.4809
- (4) A. di Matteo (Pierre Auger), PoS ICRC2015, 249 (2016), 1509.03732
- (5) D. Boncioli et al. (Pierre Auger), Nucl. Part. Phys. Proc. 279-281, 139 (2016), 1512.02314
- (6) A. Aab et al. (Pierre Auger), JCAP 1704, 038 (2017), 1612.07155
- (7) R. Alves Batista et al., JCAP 1510, 063 (2015), 1508.01824
- (8) M. De Domenico, M. Settimo, S. Riggi, E. Bertin, JCAP 1307, 050 (2013), 1305.2331
- (9) T. Pierog et al., Phys. Rev. C92, 034906 (2015), 1306.0121
- (10) E.J. Ahn et al., Phys. Rev. D80, 094003 (2009), 0906.4113
- (11) S. Ostapchenko, Phys. Rev. D83, 014018 (2011), 1010.1869
- (12) R. Aloisio, V. Berezinsky, P. Blasi, JCAP 1410, 020 (2014), 1312.7459
- (13) A.M. Taylor, M. Ahlers, D. Hooper, Phys. Rev. D92, 063011 (2015), 1505.06090
- (14) R. Å mÃda, R. Engel, PoS ICRC2015, 470 (2016), 1509.09033
- (15) R.U. Abbasi, G.B. Thomson (2016), 1605.05241