Overdensities of SMGs around WISE-selected, ultra-luminous, high-redshift AGN
Abstract
We investigate extremely luminous dusty galaxies in the environments around WISE-selected hot dust obscured galaxies (Hot DOGs) and WISE/radio-selected active galactic nuclei (AGNs) at average redshifts of and , respectively. Previous observations have detected overdensities of companion submillimetre-selected sources around 10 Hot DOGs and 30 WISE/radio AGNs, with overdensities of and , respectively. We find that the space densities in both samples to be overdense compared to normal star-forming galaxies and submillimetre galaxies (SMGs) in the SCUBA-2 Cosmology Legacy Survey (S2CLS). Both samples of companion sources have consistent mid-IR colours and mid-IR to submm ratios as SMGs. The brighter population around WISE/radio AGNs could be responsible for the higher overdensity reported. We also find the star formation rate density (SFRDs) are higher than the field, but consistent with clusters of dusty galaxies. WISE-selected AGNs appear to be good signposts for protoclusters at high redshift on arcmin scales. The results reported here provide an upper limit to the strength of angular clustering using the two-point correlation function. Monte Carlo simulations show no angular correlation, which could indicate protoclusters on scales larger than the SCUBA-2 1.5 arcmin scale maps.
keywords:
galaxies: active – galaxies: clusters: general – galaxies: high-redshift – galaxies: quasars: general – infrared: galaxies – submillimetre: galaxies1 Introduction
Advances in infrared (IR) telescope technology like the NASA’s Wide-Field Infrared Survey Explorer (WISE; Wright et al. 2010) have enabled observations of luminous AGN that have been difficult to find with previous IR missions. WISE is able to find luminous, dusty, high-redshift, active galaxies because the hot dust heated by AGN and/or starburst activity can be traced using the WISE 12 m (W3) and 22 m (W4) bands. Eisenhardt et al. (2012), Bridge et al. (2013) and Lonsdale et al. (2015) have shown that WISE can find different classes of interesting, luminous, high-redshift, dust-obscured AGN.
Eisenhardt et al. (2012) and Wu et al. (2012) observed galaxies with faint or undetectable flux densities in the 3.4 m (W1) and 4.6 m (W2) bands, and well detected fluxes in the W3 and/or W4 bands, with a radio blind selection, giving a “W1W2-dropout” selection yielding hot, dust obscured galaxies (Hot DOGs).
Another population of luminous, dusty, WISE-selected AGNs were found by Lonsdale et al. (2015), by combining WISE and National Radio Astronomy Observatory (NRAO) Very Large Array (VLA) Sky Survey (NVSS) (Condon et al., 1998) and/or Faint Images of the Radio Sky at Twenty-cm (FIRST) (Becker et al., 1995). They were selected in a similar method in the mid-IR, and are a similarly high luminosity, dust-obscured population and in this paper are known as WISE/radio AGNs. The strong compact radio emission could be from AGN jets (Lonsdale et al., 2015).
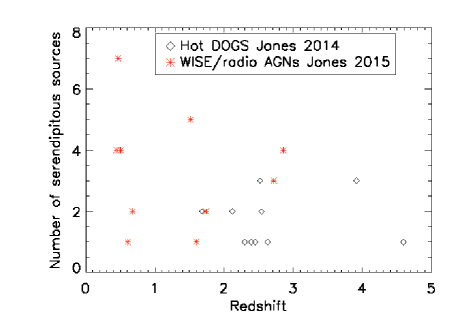
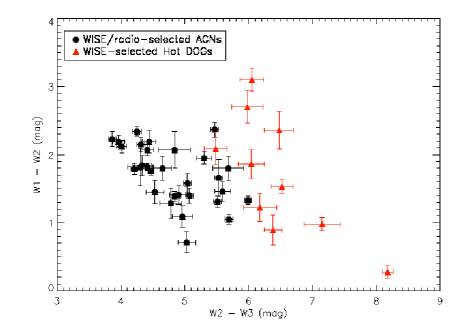
A sample of 10 Hot DOGs and 30 WISE/radio AGNs were observed with James Clerk Maxwell Telescope (JCMT) Submillimetre Common-User Bolometer Array 2 (SCUBA-2), and the fields around them were found to have an overdensity of submillimetre galaxies (SMGs)111Submm galaxies (SMGs) were historically defined by having a submm flux density of mJy. SMGs are massive gas-rich, high-redshift galaxies with high IR luminosities, LIR 1012 L⊙, believed to be from starburst activity, with star formation rates (SFRs) of several 100-1000 M⊙ yr-1 (Smail et al., 1997; Ivison et al., 1998; Eales et al., 1999; Smail et al., 2000; Blain et al., 2002; Pope et al., 2006; Casey et al., 2014; Swinbank et al., 2014). SMGs are enshrouded by dust and hence are faint in optical and near-IR wavelengths. by a factor of 2.4 and 5.6, respectively, when compared with blank-field submm surveys in Jones et al. (2014, 2015). The Hot DOGs appeared to have redder mid-IR colours and less submm emission than WISE/radio AGNs, which could be due to selection effects (Jones et al., 2014, 2015). They have very similar SEDs and are both redder than standard AGN templates (see Figure 5 in both Jones et al. 2014 and 2015). The typical redshift of the 10 observed Hot DOGs is (Jones et al., 2014), higher than the typical redshift of WISE/radio AGNs, (Jones et al., 2015). Although only 10 out of the 30 WISE/radio AGN redshifts are spectroscopically known from the SCUBA-2 subset, from Lonsdale et al. (2015) redshifts for 45 out of 49 WISE/radio AGNs are known, and the typical value was .
Follow-up Spitzer Infrared Array Camera (IRAC) imaging of a subset of Hot DOGs found an overdensity of galaxies within 1 arcmin above the number observed in random pointings (Assef et al., 2015). They also found that Hot DOG environments are as dense as the clusters found by the Clusters Around Radio-loud AGN (CARLA) surveys (Wylezalek et al., 2013, 2014).
Studying the environments of Hot DOGs and WISE/radio AGNs will help to understand the evolution of galaxies and the link with their host galaxy. This paper will explore the clustering and surface number density of the fields to study the environments surrounding the WISE-selected AGN. Also the properties of the companion sources around Hot DOGs and WISE/radio AGNs will be investigated to determine their nature.
In Section 2 the surface number density and space density of SMG sources in the fields around Hot DOGs and WISE/radio AGNs are compared. In Section 3 the angular two-point correlation function is used to characterise the clustering of the companion SMGs around the WISE/radio AGNs. In Section 4 the properties of the companion sources in the Hot DOG and WISE/radio AGN fields are compared using submm, SFR estimations, star formation rate density (SFRD) estimates, mid-infrared (mid-IR) and radio data with previous surveys of companion SMG sources in the Hot DOG and WISE/radio-selected AGN fields. The nature of the companion sources detected in the overdense regions of both Hot DOGs and WISE/radio AGNs. The nature and properties of the companion sources around Hot DOGs and WISE/radio AGNs are described in Section 5.
Throughout this paper we assume a -CDM cosmology with H0 = 71 km s-1Mpc-1, = 0.27 and = 0.73. WISE catalogue magnitudes are converted to flux densities using zero-point values on the Vega system of 306.7, 170.7, 29.04 and 8.284 Jy for WISE 3.4, 4.6, 12 and 22 m wavelengths, respectively (Wright et al., 2010).
2 Companion Source Density
JCMT SCUBA-2 observations of Hot DOGs and WISE/radio AGN were in the “CV DAISY” mode that produces a uniformly deep coverage 3-arcmin diameter map (Holland et al., 2013). Seventeen companion sources were detected at 3 significance or above in 10 JCMT SCUBA-2 fields of Hot DOGs reported by Jones et al. (2014) with an average root mean square (RMS) noise of 1.8 mJy beam-1, as shown in Table 1.
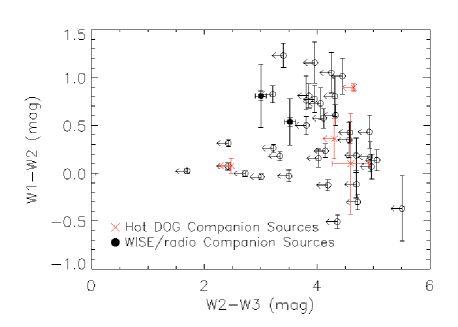
Eighty-one companion sources were detected at 3 or greater significance in 30 WISE/radio-selected AGN fields reported by Jones et al. (2015) with average RMS noise of 2.1 mJy beam-1, see Table 2-5. They concluded that they have a higher density of SMGs when compared with Hot DOGs by an additional factor of 2.4 0.9 (Jones et al., 2015). The WISE/radio AGNs have a lower redshift range, fewer of the WISE-selected AGNs are submm detected and lower total IR luminosities compared with Hot DOGs (Jones et al., 2014, 2015). The lower redshift range and higher overdensity of SMGs around WISE/radio AGNs can be seen in Figure 1. While the observed Hot DOGs have a typically higher redshift than the WISE/radio AGNs, the companion sources are matched in submm luminosity (see Tables 1-9) and they are consistent with having similar mid-IR to submm ratios. The K-correction at wavelengths longer than 500microns remains approx. constant with increasing redshift. Due to this K-correction effect the SCUBA-2 fraction of SMG detection should be independent of redshift.
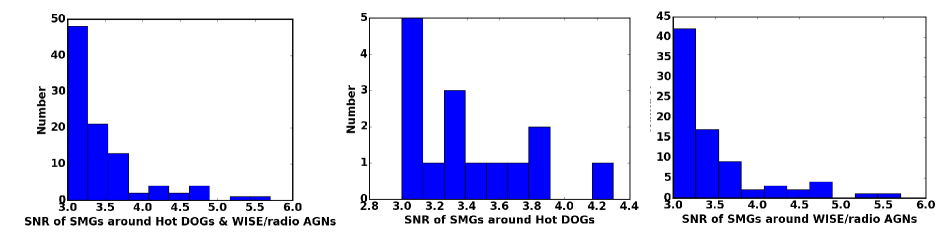
The detection level was set at 3 or greater in order to have completeness but reduce the chance of spurious false positive detections. However, there is controversy over whether 3 are reliable (e.g. (Coppin et al., 2005; Casey et al., 2012)). Figure 2 presents the signal-to-noise ratio (SNR) of the companion sources around Hot DOGs and WISE/radio AGN and for the two data sets combined. As expected the higher SNR the fewer sources detected and the less complete the sample. Jones et al. (2015) looked at the number of SMGs in the WISE/radio AGN fields detected at greater than 3 and 4 and compared to the LABOCA ECDFS Submm Survey (LESS) (Weiß et al., 2009) and concluded the overdensity of SMGs detected above 3 is consistent with SMGs detected above 4 .
Comparing these number counts to “blank field submm” surveys shows them to be overdense. The blank field submm surveys used to compare were the LESS survey, Cosmological Evolution Survey (COSMOS) (Casey et al., 2013) and the SCUBA Half-Degree Extragalactic Survey (SHADES) (Coppin et al., 2006) fields. The Hot DOG fields have a SMG overdensity by factor of 2 - 3 compared with previous blank field submm surveys , and the WISE/radio-selected AGN fields have an even greater overdensity, by a factor 5 - 6 (Jones et al. 2015). However, LESS fields could be under dense by a factor of 2 e.g. Swinbank et al. (2014), and the overdensity factor of the Hot DOG fields is less secure, but compared to COSMOS and SHADES there is still an overdensity factor between 2-3.
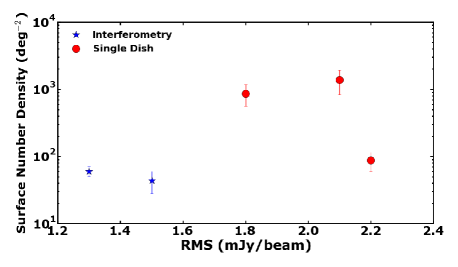
The surface number density of SMGs in the Hot DOG fields is 866210 deg-2, and 1375152 deg-2 in the WISE/radio AGN fields, to a depth of 1.8 mJy beam-1 and 2.1 mJy beam-1 (submm single dish), respectively. These are higher than previous observations of the surface number density of SMGs, as can be seen in Figure 3 where SMG surface number densities of different submm surveys are plotted against RMS. Toft et al. (2014) found at the surface density of bright SMGs is 6010 deg-2 to a depth of 1.3 mJy beam-1 (submm interferometry), which was found to be 30 lower than quiescent galaxies. SMGs from the LABOCA-COSMOS survey were found to have a surface density between 3414 deg-2 and 5418 deg-2 at a depth of 1.5 mJy beam-1 (submm interferometry), which was higher than models predicted (Smolčić et al., 2012). In the GOODS-N field the surface density of SMGs was found to be deg-2 (Pope et al., 2005) at depths ranging from 0.3 to 4.1 mJy beam-1 (submm single dish). This was likely higher than previous observations due to the association with a protocluster at . Geach et al. (2017) found a tentative overdensity in the GOODS-N compared to the rest of the S2CLS, while combining all of the S2CLS fields, the number counts are consistent with previous studies. Figure 3 also visually highlights the difference in RMS between single dish and interferometer measurements.
The space density of SMGs in the Hot DOG fields on average is 3.7 Mpc-3 (range 3.0 Mpc-3 to 6.2 Mpc-3) and in the WISE/radio AGN fields the average space density is 2.9 Mpc-3 (range 0.7 Mpc-3 to 15 Mpc-3). These space densities are higher than normal star-forming galaxies ( 2 Mpc-3) and local luminous red galaxies ( 10-4 Mpc-3) (Wake et al., 2008). Previous studies have found SMGs have low number densities of 1-2 Mpc-3, and are consistent across all redshifts (Wilkinson et al., 2017). The S2CLS was found to have SMG number densities between 4 Mpc-3 to 2 Mpc-3. This confirms that the fields around Hot DOGs and WISE/radio AGNs are overdense compared to previous studies of SMGs and normal star-forming galaxies.
3 Two-point Correlation Function
The angular two-point correlation function is a statistical way to characterise the clustering of galaxies in 2-dimensional (2D) space (Connolly et al., 1998; Efstathiou et al., 1991). We detect galaxies on a 2D surface and hence we use the angular version of the 3D spatial correlation function (Peebles, 1980). It is the excess probability of finding galaxies separated by as compared with a random distribution. Using the one of the popular estimators described by Landy & Szalay (1993);
where is the angular correlation function, DD is the number of pairs of galaxies counted in the sample, RR is the number of pairs of galaxies expected in a random distribution, DR is the number of pairs of galaxies counted between the sample and a random distribution and is the integral constraint (Groth & Peebles, 1977). The counts have been normalised by dividing by the total number of pairs in each of the three samples; DD, DR, RR.
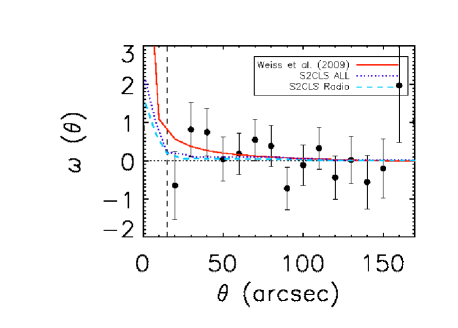
The angular correlation function was calculated for the 30 WISE/radio-selected AGN fields. It was not calculated for the Hot DOG fields because there were only 10 fields and not a large enough number of companion sources to be statistically significant: the errors would be greater than the large errors on the 30 WISE/radio AGNs. To calculate the angular correlation function, 100,000 random fake galaxies were used and compared with the blank-field survey from Weiß et al. (2009), that investigated clustering of faint galaxies, see Figure 4. Weiß et al. (2009) found significant clustering on scales less than 1 arcmin and a characteristic angular clustering scale and a spatial correlation length of Mpc. We also compared to Wilkinson et al. (2017) that analysed the largest sample of SMGs (610) in a single field to date from the SCUBA-2 Cosmology Legacy survey (S2CLS) in the redshift range . They found a marginally weaker clustering signal than previous studies, but within 1 uncertainty the results are consistent with Blain et al. (2004); Adelberger et al. (2005); Hickox et al. (2012). They also concluded that radio-selected SMGs were slightly more strongly clustered.
It can be seen in Figure 4 the results in the WISE/radio AGN fields provide an upper limit to the strength of an angular clustering signal, and yields a clustering angle of . The clustering signal appears to be inconsistent to previous clustering results of SMGs, however, further observations would provide more definite results. The results from Jones et al. (2014, 2015) found no evidence for angular clustering when looking at the cumulative fraction of the total number of companion sources in each field within different radii of the WISE target and when looking at typical separations compared to Monte Carlo simulations.
4 Properties of the companion sources around Hot DOGs and WISE/radio AGNs
4.1 Counterparts of the companion Sources
A search radius of half SCUBA-2 850 m beam size ( 8 arcsec) was used to find counterparts of these companion SMGs in other catalogues (Lilly et al., 1999; Ivison et al., 2002; Hainline et al., 2009). This search radius is determined from the probability of finding a source at a given distance from the SMG position (Lilly et al., 1999; Ivison et al., 2002). This search radius is relatively large due to the difficulty of identifying SMGs at optical and near-IR wavelengths because of the large submm (SCUBA-2) beam, 15 arcsec at 850 m (Dempsey et al., 2013).
Multiple objects within the WISE AllWISE Source catalog had two potential counterparts within the 8 arcsec search radius. To reduce ambiguity in the result the closest in WISE W1-W4 bands object is chosen while excluding objects that have WISE colours consistent with stars.
4.2 Mid-IR counterparts
The WISE colour-colour ([W2 - W3] vs [W1 - W2]) plots of the companion sources around Hot DOGs and WISE/radio AGNs are shown in Figure 5. These plots can separate different populations of galaxies because of the underlying mechanisms present in each, leading to different mid-IR emission. AGNs are dominated by power-law emission at mid-IR wavelengths. In contrast, normal and star-forming galaxies have a stellar Rayleigh-Jeans tail with additional strong PAH emission, and a continuum that peaks at 70-170 m due to warm dust heated by young stars (Jarrett et al., 2011).
Both sets of companion sources have similar WISE colours. However, most have upper limits in the W3 band and so have limits to their red W2 - W3 colour. When comparing with the WISE colour-colour diagram of different galaxy populations in Figure 12 in Wright et al. (2010) and Figure 26 Jarrett et al. (2011), the companion sources lie in both the starburst (star-forming) galaxy zone and AGN zone.
The Hot DOGs and WISE/radio AGNs are redder than the companion sources, see Figure 6. This is no surprise because they were selected to be red (Eisenhardt et al., 2012; Lonsdale et al., 2015), which could imply they have higher dust obscuration and/or a higher AGN contribution, and higher dust temperatures than that of their companion sources . Hot DOGs and WISE/radio AGNs are predominantly powered by AGN (Wu et al., 2012; Jones et al., 2014, 2015; Tsai et al., 2015; Lonsdale et al., 2015). SMGs are predominantly powered by star formation (Alexander et al., 2005), and have SEDs dominated by cooler dust emission (20 - 50 K) (Hainline et al., 2009).
Hainline et al. (2009) observed 73 radio-selected SMGs with known redshifts using Spitzer IRAC and MIPS and detected 91 at 3.6 m, 91 at 4.5 m, 78 at 5.8 m, 74 at 8 m, 71 at 24 m, and 7 at 70 m. They found that the detection rate in the shortest bands is less than SMGs in deeper Spitzer Wide Area Infrared Extragalactic Legacy Survey (SWIRE). These are higher mid-IR detection rates than the companion SMG sources in the AllWISE Source Catalog presented in this paper (Jones et al., 2015); where 24 and companion SMG sources in the Hot DOG and WISE/radio AGN fields, respectively, were detected. The difference in detection rates could be due to the depth of coverage. Spitzer IRAC had deeper mid-IR observations with sensitivity ranging from 0.1 - 0.9 Jy at 3.6m and 0.4 - 1.8 Jy at 4.5m, which are deeper than AllWISE Source Catalog 0.08 mJy at 3.4m and 0.11 mJy at 4.6m at 2 .
4.3 Submillimetre Emission, SFRs and SFRDs
The average submm flux density of SMGs around Hot DOGs is S850μm 6.2 1.8 mJy, which is comparable to SMGs around WISE/radio AGNs, S850μm = 7.2 2.1 mJy. Submm flux densities provide a reliable measurement of SFR (Alexander et al., 2016). Submm flux densities can be converted to SFRs for SMGs with using
SFR850μm = 200 S850μm
(Barger et al., 2014). The average SFR is 1240 M⊙yr-1 for SMGs around WISE/radio AGNs, slightly lower than the SFR 1460 M⊙yr-1 for SMGs around Hot DOGs.
Cosmological simulations predict that overdense regions, 5 density peak, are associated with high SFRs, 750 M⊙yr-1 (Yajima et al., 2015). Observations at redshifts found higher SFRs are associated with higher densities (Cooper et al., 2007). The mean SFR at the core of protoclusters have been found to be enhanced, up to a factor 5.9 over the field (Alexander et al., 2016), and outside of the central region the SFR is consistent with field galaxies. ALMA observations of the SSA22 protocluster at redshift found enhanced SFR in the densest regions (Umehata et al., 2015). Therefore, higher SFRs of the SMGs around WISE/radio AGNs than the SMGs around Hot DOGs is expected.
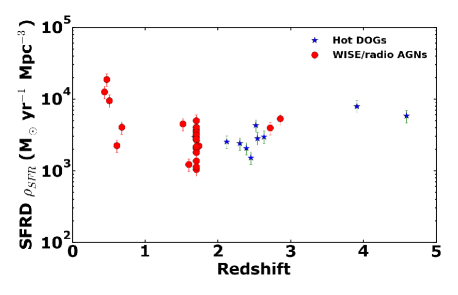
The star formation rate density (SFRD) represents the total star formation transpiring per unit time and volume at a given redshift, as seen in Figure 6. SFRD allows direct comparison of the importance of IR-luminous galaxies to the build-up of stellar mass in the Universe. From previous work the SFRD in clusters increases with redshift from to e.g. (Hopkins et al., 2006; Bouwens et al., 2011; Magnelli et al., 2011; Clements et al., 2014), e.g. Dannerbauer et al. (2014) measured an SFRD of M⊙ yr-1 Mpc-3 in the field around the spiderweb radio galaxy at redshift in a region of 2 Mpc. However, there are observations of high-redshift clusters with a combination of quiescent and star-forming galaxies (Gobat et al., 2013; Strazzullo et al., 2013), and clusters dominated by quiescent galaxies (Tanaka et al., 2013). Therefore, higher redshift SFRDs are needed to understand the history of galaxy clusters especially in the peak epoch of star formation at redshifts , which includes this paper. The SFRDs were calculated for each cluster, which is the WISE-selected source and its surrounding SMGs, assuming the SMGs are at the same redshift as the source. We assumed that each cluster was spherical, and derived an angular radius from the SCUBA-2 map, 1.5 arcmin. The angular radius was converted to a proper distance at the redshift for each cluster, where the redshift is unknown the average redshift is assumed, for WISE/radio AGNs. The volume for each cluster was calculated by assuming this proper distance is the radius of the cluster. The SFRDs are presented in Table 6, these are lower limits because faint SMGs could be missed due to the shallow depths of the SCUBA-2 maps.
The SFRDs range for Hot DOGs from 152330M⊙ yr-1 Mpc-3 to 7949159 M⊙ yr-1 Mpc-3, and average 3533 M⊙ yr-1 Mpc-3. These are lower than WISE/radio AGNs with a range from 121949 M⊙ yr-1 Mpc-3 to 18715374 M⊙ yr-1 Mpc-3, and average 3929 M⊙ yr-1 Mpc-3. Our results can be compared to Figure 15 from Clements et al. (2014) and the SFRDs calculated in this paper are higher than field galaxies from Hopkins et al. (2006) and Bouwens et al. (2011), with SFRDs of M⊙ yr-1 Mpc-3 and M⊙ yr-1 Mpc-3 at respectively. Our values are similar to four Herschel Multitiered Extragalactic Survey (HerMES) clusters of dusty, star-forming galaxies at redshifts between to , and other clusters with MIR/FIR measurements from the literature with SFRDs ranging from 200M⊙ yr-1 Mpc-3 to 3000M⊙ yr-1 Mpc-3. Simulations of massive galaxy clusters cannot account for the overdensity found by Clements et al. (2014), which is thought to be due to insufficient peaks of star formation activity in the simulations at early epochs, and including strong starbursts in the simulations is required to explain the statistical properties of SMGs (Granato et al., 2015).
Dusty star forming galaxies (DSFG)-rich protoclusters at redshifts were shown to have slightly higher SFRDs compared to the field, due to their large occupying volumes (Casey, 2016). In contrast virialised clusters at redshifts have a substantially higher SFRD. This is in agreement with the lower redshift WISE-selected AGNs W03423753, W15011324 and W22300720 that have a redshift of , and , respectively and a significantly higher SFRD at 18715374 M⊙ yr-1 Mpc-3, 9501190 M⊙ yr-1 Mpc-3 and and 12596252 M⊙ yr-1 Mpc-3, respectively. This is due to a high overdensity of SMGs in each field; seven, four and four serendipitous SMG sources in each field respectively.
Completeness is the rate at which a source is expected to be detected in a map (Hatsukade et al., 2013). It is computed by simulating the detection rate of 1,000 fake point sources per flux bin placed in the real cleaned signal map (Tamura et al., 2009). Brighter SMGs where the flux density is S1100μm mJy were found not to be significantly affected from incompleteness and false detections (Tamura et al., 2009). They found that the completeness was 50 at 2.7 mJy and 90 at 4.0 mJy. All the companion sources detected around Hot DOGs and WISE/radio AGNs have flux densities S850μm mJy and S850μm mJy, respectively see Tables 1-5. The completeness was found to range from 77 and 100 reported by Hatsukade et al. (2013) from 15 SMGs observed. It was concluded that the correction for incompleteness and contamination has an effect on the low flux density bins (S850μm mJy) and a minimal effect on the high flux density bins S850μm mJy (Casey et al., 2013). This is also confirmed by Weiß et al. (2009) where the source extraction is complete ( 95 ) for sources with flux densities S870μm mJy and 50 complete at 4.0 mJy. Therefore, the SMG completeness of the fields around Hot DOGs and WISE/radio AGNs should be between 50 and 100 complete. Hence the SFRDs could be higher than calculated here. This will also have an effect on the number count comparison with other submm surveys, where the overdensities in the WISE-selected Hot DOG and WISE/radio-selected AGN fields could have an even higher overdensity.
4.4 Radio Emission
None of the companion sources around Hot DOGs or WISE/radio AGNs were detected at radio wavelengths in FIRST and/or NVSS, where the typical 1.4 GHz detection limit was 1.0 mJy/beam, see Table 1-5. From previous observations 65 of SMGs with submm flux densities S850μm 5 mJy had detectable radio emission in much deeper observations with RMS 10 Jy (range 2.3 to 17.4 Jy) (Ivison et al., 1998, 2002; Chapman et al., 2005).
None of the 17 or 81 companion sources in the Hot DOG and WISE/radio AGN fields, respectively, are detected in NRAO snapshot follow-up VLA radio maps (priv. comm. with C. Lonsdale). The non-detections are consistent with SMG SEDs at relevant redshifts.
4.5 X-ray Emission
No counterparts to the companion sources from point sources were found in the third XMM-Newton companion Source Catalog, 3XMM-DR5 (Rosen et al., 2015). However, previous deeper X-ray observations of SMGs found only 16 with X-ray detections from sample size of 35 (458%) (Laird et al., 2009). These observations were from the 2-Ms Chandra survey with flux limits on the order of 10-17erg cm-2 s-1 and a range 1.1 to 17.710-16erg cm-2 s-1 , and are deeper compared with 3XMM-DR5 of the order 10-15erg cm-2 s-1 for 3 sigma detections. Therefore, non-detections from point sources are expected.
5 Discussion
5.1 Companion Source Clustering
Figure 4 provides an upper limit to the strength of an angular clustering signal in the WISE/radio AGN fields, and appears to be inconsistent with previous clustering studies of SMGs from Weiß et al. (2009); Hickox et al. (2012); Wilkinson et al. (2017). Weiß et al. (2009) found consistent correlation length values of SMGs with Blain et al. (2004); Farrah et al. (2006) but inconsistent with Scott et al. (2006), this could be explained by the small significance of the clustering signal in both studies.
Hickox et al. (2012) reanalysed SMGs from the LABOCA survey in a novel method to cross-correlate SMGs in the LABOCA survey and galaxies from Spitzer IRAC. They found a lower correlation length, Mpc at , than Weiß et al. (2009), but one that is consistent with measurements for optically-selected QSOs. The observed clustering could depend on the submm flux limit of the survey, presence of redshift spikes and uncertainties in redshift selection function (Williams et al., 2011; Adelberger et al., 2005), which could result in uncertainties in clustering estimates. Hickox et al. (2012) compared their autocorrelation length to previous SMG results with a range of 850m flux limit from 3 to 6 mJy, and found consistent angular clustering estimates. They concluded that SMGs are likely to represent a short-lived transition phase from cold, gas-rich, star-forming galaxies to passively evolving systems.
Wilkinson et al. (2017) found when analysing the largest sample of SMGs in the S2CLS, SMGs are not as strongly clustered as previously thought. However, their measurements were in agreement with previous studies Blain et al. (2004); Hickox et al. (2012) within 1 errors, and found a weaker clustering signal when comparing to Weiß et al. (2009). Accounting for blending could bring the previous studies into better agreement with Wilkinson et al. (2017). Alternatively, the SMG clustering could depend on redshift, large-scale environment and merger history. They found that the clustering of SMGs are consistent with star-forming population and lower than passive population at the same redshift, and tentative evidence of halo downsizing. Chapman et al. (2009) proposed that SMGs do not necessary trace the most massive dark matter halos.
Donoso et al. (2014) analysed the angular clustering properties of a sample of 170,000 WISE-selected AGN with very red mid-IR colours. The whole sample were found to have a similar clustering strength to optically-selected quasars at comparable redshifts () in the Sloan Digital Sky Survey (SDSS) (Porciani et al., 2004; Croom et al., 2005; Myers et al., 2007). They are found in denser environments when compared with all SDSS galaxies at that redshift. Redder AGN which are well detected at 4.6 m (W2) have a stronger clustering bias (relationship between the distribution of dark matter and luminous matter) than blue AGN. WISE/SDSS obscured AGN are more strongly clustered and inhabit denser environments than unobscured AGN. DiPompeo et al. (2014) confirmed this but found a smaller difference in angular clustering amplitude between WISE-selected obscured quasars and unobscured quasars. However, Mendez et al. (2016) found no significant difference between obscured and unobscured AGN.
There is an overdensity of SMGs with 2 or 3 SMGs per SCUBA-2 field compared with the expectation of 1 SMG from blank field submm surveys. The number of sources for the angular two-point correlation function of Hot DOGs and WISE/radio AGN fields were not numerous enough to see an angular clustering clustering signal. Monte Carlo simulations of the typical separation of the companion sources and the cumulative fraction of the total number of companion sources within different radii from the WISE target showed no angular clustering. This is agreement with Assef et al. (2015) that found no angular dependence of the IRAC overdensities around a subset of Hot DOGs.
From previous evidence there could be clustering on scales greater than the SCUBA-2 fields (Scoville et al., 2000; Blain et al., 2004; Greve et al., 2004; Farrah et al., 2006; Ivison et al., 2007; Weiß et al., 2009; Cooray et al., 2010; Scott et al., 2010; Hickox et al., 2012). Alternatively, the clustering peak could be off centre from the WISE source and not on the SCUBA-2 1.5 arcmin map scale. This agrees with Smail et al. (2014) where overdensities of the most active, ultraluminous star-forming galaxies were offset from the assumed protocluster centre and are situated in the lower-density environments. Dannerbauer et al. (2014) observed a density of SMGs up to four times greater than in blank field surveys that were not centred on the submm-bright radio galaxy.
Muldrew et al. (2015) explored the structures of protoclusters and their relationship with high-redshift galaxies using the Millennium Simulation. They found that protocluster structures are very extended at the redshifts () we are probing with 90 of their mass is dispersed across 30 arcmin ( 35 Mpc comoving). This would imply that many observations of protoclusters and high-redshift clusters are not imaging all of the cluster. Many protoclusters have no central or main halo that could be classified as a high-redshift cluster, only 10 were dominated by a single halo at redshift . This could explain why there is no evidence or only an upper limit of angular clustering in the Hot DOGs and WISE/radio AGNs fields on 1.5 arcmin scales from Monte Carlo simulations of typical separations. Alternatively, the cluster might be peaked substantially off-centre from the WISE target. Further observations of companion sources in the fields around WISE/radio AGN are needed to determine the angular two-point correlation function . Wide-field sub(mm) surveys are needed to cover the total (proto)cluster structure, and is in agreement with results from Casey (2016); Hung et al. (2016), where Casey (2016) found protoclusters subtend 10 arcsec to a half degree in the sky and at redshifts their overdensity is difficult to detect due to their large occupied volumes. Hung et al. (2016) found large scale structure around a cluster to within 10 arcsec.
Viero et al. (2013) presented observations from Herschel and found a clustering signature from SMGs that could be decomposed into 2-halo (linear) power from galaxies in separate halos, and 1-halo (non-linear) power from multiple central and satellite galaxies occupying massive halos. It has been found that a fraction of luminous sources are found within these satellite halos for example González et al. (2011) predicts 38 SMGs and 24 SMGs with S mJy are satellites. Additionally, star-forming galaxies in groups and clusters were found in the outskirts of massive cluster-scale halos (Muldrew et al., 2015). The lack of clustering signal of SMGs in the Hot DOG and WISE/radio AGN fields could be because they are also in the outskirts of diffuse massive halo and not having enough sources.
5.2 Companion Source Properties
Only a fraction of the SCUBA-2 companion sources are detected in WISE . The WISE colours of the companion sources are consistent with star-forming galaxies and AGN, while their mid-IR to submm ratios are not consistent with AGN dominated sources (Jones et al., 2015). The companion sources hence appear to be consistent with SMGs. The SMG SFRs were estimated using their submm flux densities and are consistent with SMGs; the average SFR is 1240 M⊙yr-1 for SMGs around WISE/radio AGNs, slightly lower than the SFR 1460 M⊙yr-1 for SMGs around Hot DOGs. The SMGs around WISE/radio AGNs have slightly higher SFRs than around Hot DOGs by 18, which is expected that SFRs are enhanced in denser regions.
When comparing the companion SMG sources radio properties to previous SMGs, around 65 - 70 of bright SMGs (S850μm 7 mJy) have been detected at S1.4GHz (Ivison et al., 2002; Borys et al., 2004). It has been suggested that the radio-undetected SMGs may have colder dust or lie at (Ivison et al., 2002; Eales et al., 2003; Swinbank et al., 2008). No companion sources have radio detections in shallow NVSS or FIRST images, and the radio data are not deep enough to assess their dust temperatures.
The SFRDs of the WISE-selected AGNs are higher than the field but consistent with measurements of clusters of dusty galaxies from HerMES and DSFGs or luminous AGN. Conclusions from observations of protoclusters suggest that the universe’s largest galaxy clusters are thought to built by massive M⊙ galaxies in short-lived bursts of activity. The challenge has been to observe these structures when they have such large volumes, subtending 0.5 degrees on the sky (Casey, 2016). However, the WISE-selected AGNs have high SFRDs with consistent values to these previous observations of clusters of dusty star-forming galaxies, but are on smaller volumes, with a SCUBA-2 map radius of 1.5 arcmin. Therefore, WISE-selected AGNs could be used to study protoclusters at high redshift on small volumes (arcmin scales) of the sky.
6 Summary
Previously Hot DOGs and WISE-selected AGNs were found to be extremely obscured, hyperluminous AGN at redshifts between . Their environments were found to be overdense in SMGs and these overdensities have been investigated here.
-
•
The space densities of SMGs around the WISE-selected AGNs were found to overdense compared to normal star-forming galaxies and SMGs in the S2CLS.
-
•
The SMGs around WISE/radio AGNs 18 higher SFRs than SMGs around Hot DOGs.
-
•
The SFRDs of the WISE-selected AGNs are higher than field galaxies, and consistent with values for known clusters of dusty galaxies.
-
•
The results impose an upper limit to the strength of angular clustering of the companion SMG sources in Hot DOGs and WISE/radio AGNs on SCUBA-2 1.5 arcmin scales. The typical separations when compared to Monte Carlo simulations showed no angular clustering. This is an agreement with the cumulative fraction of companion sources in different radii from the WISE target. This could be because they are satellite galaxies in the massive halo or that the protocluster is on bigger scales (up to 30 arcmin) and we are not fully probing the protocluster.
-
•
Hot DOGs and WISE/radio AGNs appear to be signposts of overdense environments.
7 Acknowledgements
The authors thank the anonymous referee for his/her comments and suggestions, which have greatly improved this paper. S.F.J. thanks Kirsten K. Knudsen for inspiring comments and helpful advice.
This publication makes use of data products from the Wide-field Infrared Survey Explorer, which is a joint project of the University of California, Los Angeles, and the Jet Propulsion Laboratory/California Institute of Technology, funded by the National Aeronautics and Space Administration. The James Clerk Maxwell Telescope has historically been operated by the Joint Astronomy Centre on behalf of the Science and Technology Facilities Council of the United Kingdom, the National Research Council of Canada and the Netherlands Organisation for Scientific Research. Additional funds for the construction of SCUBA-2 were provided by the Canada Foundation for Innovation. The program IDs under which the data were obtained were M12AU10, M12BU07 and M13BU02. RJA was supported by FONDECYT grant number 1151408. This work is based in part on observations made with the Spitzer Space Telescope, which is operated by the Jet Propulsion Laboratory, California Institute of Technology under a contract with NASA
References
- Adelberger et al. (2005) Adelberger K. L., Steidel C. C., Pettini M., Shapley A. E., Reddy N. A., Erb D. K., 2005, \apj, 619, 697
- Alexander et al. (2016) Alexander D. M. et al., 2016, \mnras, 461, 2944
- Alexander et al. (2005) Alexander D. M., Smail I., Bauer F. E., Chapman S. C., Blain A. W., Brandt W. N., Ivison R. J., 2005, \nat, 434, 738
- Assef et al. (2015) Assef R. J. et al., 2015, \apj, 804, 27
- Barger et al. (2014) Barger A. J. et al., 2014, \apj, 784, 9
- Becker et al. (1995) Becker R. H., White R. L., Helfand D. J., 1995, \apj, 450, 559
- Blain et al. (2004) Blain A. W., Chapman S. C., Smail I., Ivison R., 2004, \apj, 611, 725
- Blain et al. (2002) Blain A. W., Smail I., Ivison R. J., Kneib J.-P., Frayer D. T., 2002, \physrep, 369, 111
- Borys et al. (2004) Borys C., Scott D., Chapman S., Halpern M., Nandra K., Pope A., 2004, \mnras, 355, 485
- Bouwens et al. (2011) Bouwens R. J. et al., 2011, \apj, 737, 90
- Bridge et al. (2013) Bridge C. R. et al., 2013, \apj, 769, 91
- Casey (2016) Casey C. M., 2016, \apj, 824, 36
- Casey et al. (2012) Casey C. M. et al., 2012, \apj, 761, 140
- Casey et al. (2013) Casey C. M. et al., 2013, \mnras, 436, 1919
- Casey et al. (2014) Casey C. M. et al., 2014, \apj, 796, 95
- Chapman et al. (2009) Chapman S. C., Blain A., Ibata R., Ivison R. J., Smail I., Morrison G., 2009, \apj, 691, 560
- Chapman et al. (2005) Chapman S. C., Blain A. W., Smail I., Ivison R. J., 2005, \apj, 622, 772
- Clements et al. (2014) Clements D. L. et al., 2014, \mnras, 439, 1193
- Condon et al. (1998) Condon J. J., Cotton W. D., Greisen E. W., Yin Q. F., Perley R. A., Taylor G. B., Broderick J. J., 1998, \aj, 115, 1693
- Connolly et al. (1998) Connolly A. J., Szalay A. S., Brunner R. J., 1998, \apjl, 499, L125
- Cooper et al. (2007) Cooper M. C. et al., 2007, \mnras, 376, 1445
- Cooray et al. (2010) Cooray A. et al., 2010, \aap, 518, L22
- Coppin et al. (2006) Coppin K. et al., 2006, \mnras, 372, 1621
- Coppin et al. (2005) Coppin K., Halpern M., Scott D., Borys C., Chapman S., 2005, \mnras, 357, 1022
- Croom et al. (2005) Croom S. M. et al., 2005, \mnras, 356, 415
- Dannerbauer et al. (2014) Dannerbauer H. et al., 2014, \aap, 570, A55
- Dempsey et al. (2013) Dempsey J. T. et al., 2013, \mnras, 430, 2534
- DiPompeo et al. (2014) DiPompeo M. A., Myers A. D., Hickox R. C., Geach J. E., Hainline K. N., 2014, \mnras, 442, 3443
- Donoso et al. (2014) Donoso E., Yan L., Stern D., Assef R. J., 2014, \apj, 789, 44
- Eales et al. (2003) Eales S., Bertoldi F., Ivison R., Carilli C., Dunne L., Owen F., 2003, \mnras, 344, 169
- Eales et al. (1999) Eales S., Lilly S., Gear W., Dunne L., Bond J. R., Hammer F., Le Fèvre O., Crampton D., 1999, \apj, 515, 518
- Efstathiou et al. (1991) Efstathiou G., Bernstein G., Tyson J. A., Katz N., Guhathakurta P., 1991, \apjl, 380, L47
- Eisenhardt et al. (2012) Eisenhardt P. R. M. et al., 2012, \apj, 755, 173
- Farrah et al. (2006) Farrah D. et al., 2006, \apjl, 641, L17
- Geach et al. (2017) Geach J. E. et al., 2017, \mnras, 465, 1789
- Gobat et al. (2013) Gobat R. et al., 2013, \apj, 776, 9
- González et al. (2011) González V., Labbé I., Bouwens R. J., Illingworth G., Franx M., Kriek M., 2011, \apjl, 735, L34
- Granato et al. (2015) Granato G. L., Ragone-Figueroa C., Domínguez-Tenreiro R., Obreja A., Borgani S., De Lucia G., Murante G., 2015, \mnras, 450, 1320
- Greve et al. (2004) Greve T. R., Ivison R. J., Bertoldi F., Stevens J. A., Dunlop J. S., Lutz D., Carilli C. L., 2004, \mnras, 354, 779
- Groth & Peebles (1977) Groth E. J., Peebles P. J. E., 1977, \apj, 217, 385
- Hainline et al. (2009) Hainline L. J., Blain A. W., Smail I., Frayer D. T., Chapman S. C., Ivison R. J., Alexander D. M., 2009, \apj, 699, 1610
- Hatsukade et al. (2013) Hatsukade B., Ohta K., Seko A., Yabe K., Akiyama M., 2013, \apjl, 769, L27
- Hickox et al. (2012) Hickox R. C. et al., 2012, \mnras, 421, 284
- Holland et al. (2013) Holland W. S. et al., 2013, \mnras, 430, 2513
- Hopkins et al. (2006) Hopkins P. F., Hernquist L., Cox T. J., Di Matteo T., Robertson B., Springel V., 2006, \apjs, 163, 1
- Hung et al. (2016) Hung C.-L. et al., 2016, \apj, 826, 130
- Ivison et al. (2007) Ivison R. J. et al., 2007, \mnras, 380, 199
- Ivison et al. (2002) Ivison R. J. et al., 2002, \mnras, 337, 1
- Ivison et al. (1998) Ivison R. J., Smail I., Le Borgne J.-F., Blain A. W., Kneib J.-P., Bezecourt J., Kerr T. H., Davies J. K., 1998, \mnras, 298, 583
- Jarrett et al. (2011) Jarrett T. H. et al., 2011, \apj, 735, 112
- Jones et al. (2015) Jones S. F. et al., 2015, \mnras, 448, 3325
- Jones et al. (2014) Jones S. F. et al., 2014, \mnras, 443, 146
- Laird et al. (2009) Laird E. S. et al., 2009, \apjs, 180, 102
- Landy & Szalay (1993) Landy S. D., Szalay A. S., 1993, \apj, 412, 64
- Lilly et al. (1999) Lilly S. J., Eales S. A., Gear W. K. P., Hammer F., Le Fèvre O., Crampton D., Bond J. R., Dunne L., 1999, \apj, 518, 641
- Lonsdale et al. (2015) Lonsdale C. J. et al., 2015, \apj, 813, 45
- Magnelli et al. (2011) Magnelli B., Elbaz D., Chary R. R., Dickinson M., Le Borgne D., Frayer D. T., Willmer C. N. A., 2011, \aap, 528, A35
- Mendez et al. (2016) Mendez A. J. et al., 2016, \apj, 821, 55
- Muldrew et al. (2015) Muldrew S. I., Hatch N. A., Cooke E. A., 2015, \mnras, 452, 2528
- Myers et al. (2007) Myers A. D., Brunner R. J., Nichol R. C., Richards G. T., Schneider D. P., Bahcall N. A., 2007, \apj, 658, 85
- Peebles (1980) Peebles P. J. E., 1980, The large-scale structure of the universe
- Pope et al. (2005) Pope A., Borys C., Scott D., Conselice C., Dickinson M., Mobasher B., 2005, \mnras, 358, 149
- Pope et al. (2006) Pope A. et al., 2006, \mnras, 370, 1185
- Porciani et al. (2004) Porciani C., Magliocchetti M., Norberg P., 2004, \mnras, 355, 1010
- Rosen et al. (2015) Rosen S. et al., 2015, in Astronomical Society of the Pacific Conference Series, Vol. 495, Astronomical Data Analysis Software an Systems XXIV (ADASS XXIV), Taylor A. R., Rosolowsky E., eds., p. 319
- Scott et al. (2010) Scott K. S. et al., 2010, \mnras, 405, 2260
- Scott et al. (2006) Scott S. E., Dunlop J. S., Serjeant S., 2006, \mnras, 370, 1057
- Scoville et al. (2000) Scoville N. Z. et al., 2000, \aj, 119, 991
- Smail et al. (2014) Smail I. et al., 2014, \apj, 782, 19
- Smail et al. (1997) Smail I., Ivison R. J., Blain A. W., 1997, \apjl, 490, L5
- Smail et al. (2000) Smail I., Ivison R. J., Owen F. N., Blain A. W., Kneib J.-P., 2000, \apj, 528, 612
- Smolčić et al. (2012) Smolčić V. et al., 2012, \aap, 548, A4
- Strazzullo et al. (2013) Strazzullo V. et al., 2013, \apj, 772, 118
- Swinbank et al. (2008) Swinbank A. M. et al., 2008, \mnras, 391, 420
- Swinbank et al. (2014) Swinbank A. M. et al., 2014, \mnras, 438, 1267
- Tamura et al. (2009) Tamura Y. et al., 2009, \nat, 459, 61
- Tanaka et al. (2013) Tanaka M. et al., 2013, \apj, 772, 113
- Toft et al. (2014) Toft S. et al., 2014, \apj, 782, 68
- Tsai et al. (2015) Tsai C.-W. et al., 2015, \apj, 805, 90
- Umehata et al. (2015) Umehata H. et al., 2015, \apjl, 815, L8
- Viero et al. (2013) Viero M. P. et al., 2013, \apj, 772, 77
- Wake et al. (2008) Wake D. A. et al., 2008, \mnras, 387, 1045
- Weiß et al. (2009) Weiß A. et al., 2009, \apj, 707, 1201
- Wilkinson et al. (2017) Wilkinson A. et al., 2017, \mnras, 464, 1380
- Williams et al. (2011) Williams C. C. et al., 2011, \apj, 733, 92
- Wright et al. (2010) Wright E. L. et al., 2010, \aj, 140, 1868
- Wu et al. (2012) Wu J. et al., 2012, \apj, 756, 96
- Wylezalek et al. (2013) Wylezalek D. et al., 2013, \apj, 769, 79
- Wylezalek et al. (2014) Wylezalek D. et al., 2014, \apj, 786, 17
- Yajima et al. (2015) Yajima H., Shlosman I., Romano-Díaz E., Nagamine K., 2015, \mnras, 451, 418
| Source Name | R.A. | Dec. | Distance To | WISE Name | 3.4 m | 4.6 m | 12 m | 22 m | 850 m | SNR | FIRST |
| (J2000) | (J2000) | WISE Target | (mag) | (mag) | (mag) | (mag) | (mJy) | /NVSS | |||
| (arcsec) | Detection | ||||||||||
| Limit | |||||||||||
| (mJy/beam) | |||||||||||
| W08310140-1 | 08:31:49.565 | 01:41:10.80 | 788 | WISE undetected | N/A | N/A | N/A | N/A | 6.4 2.1 | 3.0 | 1.00 |
| W08310140-2 | 08:31:48.498 | 01:40:30.80 | 737 | WISE undetected | N/A | N/A | N/A | N/A | 7.7 2.1 | 3.7 | 0.99 |
| W08310140-3 | 08:31:50.899 | 01:39:58.80 | 323 | WISE undetected | N/A | N/A | N/A | N/A | 6.9 2.1 | 3.3 | 0.99 |
| W11364236-1 | 11:36:32.868 | 42:35:14.42 | 485 | WISE undetected | N/A | N/A | N/A | N/A | 5.4 1.7 | 3.2 | 1.06 |
| W16032747-1a | 16:03:59.222 | 27:47:05.48 | 707 | WISE undetected | N/A | N/A | N/A | N/A | 6.8 1.8 | 3.8 | 0.93 |
| W18354355-1a | 18:35:28.518 | 43:54:52.36 | 778 | WISE undetected | N/A | N/A | N/A | N/A | 4.6 1.5 | 3.1 | Undetected |
| W22160723-1a | 22:16:21.520 | 07:24:06.50 | 303 | WISE undetected | N/A | N/A | N/A | N/A | 4.9 1.6 | 3.1 | 0.80 |
| W22160723-2a | 22:16:16.142 | 07:24:34.83 | 333 | WISE undetected | N/A | N/A | N/A | N/A | 5.3 1.6 | 3.3 | 0.79 |
| W22460526-1 | 22:46:02.433 | 05:26:35.43 | 747 | WISE undetected | N/A | N/A | N/A | N/A | 6.9 2.1 | 3.3 | 0.97 |
| W18143412-1b | 18:14:23.130 | 34:12:01.79 | 677 | J181423.13341205.2 | 16.848 0.080 | 16.748 0.243 | 12.153 0.283 | 8.791 | 5.4 1.8 | 3.0 | Undetected |
| W20260716-1 | 20:26:16.913 | 07:15:55.7 | 374 | J202616.55071600.6 | 15.336 0.038 | 15.259 0.085 | 12.781 | 9.034 | 7.3 1.7 | 4.3 | Undetected |
| W20260716-2 | 20:26:20.139 | 07:17:03.57 | 727 | WISE undetected | N/A | N/A | N/A | N/A | 6.1 1.7 | 3.6 | Undetected |
| W20540207-1 | 20:54:22.159 | 02:06:48.38 | 182 | WISE undetected | N/A | N/A | N/A | N/A | 6.9 1.8 | 3.8 | 0.96 |
| W20540207-2 | 20:54:24.376 | 02:06:46.54 | 162 | WISE undetected | N/A | N/A | N/A | N/A | 5.6 1.8 | 3.1 | 0.96 |
| W20540207-3 | 20:54:29.713 | 02:06:19.15 | 687 | WISE undetected | N/A | N/A | N/A | N/A | 6.8 1.8 | 3.8 | 0.98 |
| W23570328-1 | 23:57:08.930 | 03:27:11.40 | 485 | J235708.59032712.1 | 17.574 0.212 | 16.679 0.375 | 12.031 | 8.677 | 5.8 1.9 | 3.1 | 0.86 |
| W23570328-2 | 23:57:05.457 | 03:27:11.40 | 848 | J235705.39032710.3 | 16.536 0.084 | 16.177 0.240 | 11.869 | 8.856 | 6.7 1.9 | 3.5 | 0.86 |
| Source Name | R.A. | Dec. | Distance To | WISE Name | 3.4 m | 4.6 m | 12 m | 22 m | 850 m | SNR | FIRST |
| (J2000) | (J2000) | WISE Target | (mag) | (mag) | (mag) | (mag) | (mJy) | /NVSS | |||
| (arcsec) | Detection | ||||||||||
| Limit | |||||||||||
| (mJy/beam) | |||||||||||
| W00101643-1 | 00:10:41.983 | 16:43:44.70 | 323 | WISE undetected | N/A | N/A | N/A | N/A | 6.0 1.9 | 3.2 | Undetected |
| W00101643-2 | 00:10:42.284 | 16:43:28.70 | 364 | J001042.69164333.2 | 16.349 0.071 | 16.116 0.183 | 11.970 | 9.008 | 5.9 1.9 | 3.1 | Undetected |
| W00101643-3 | 00:10:40.614 | 16:42:52.37 | 344 | J001040.14164253.2 | 16.876 0.108 | 16.268 0.228 | 11.943 | 8.720 | 5.7 1.9 | 3.0 | Undetected |
| W00101643-4 | 00:10:36.461 | 16:42:16.37 | 233 | J001036.63164217.1 | 17.564 0.187 | 16.550 0.295 | 12.102 | 8.791 | 6.5 1.9 | 3.4 | Undetected |
| W02441123-1 | 02:44:23.184 | 11:24:58.40 | 586 | WISE undetected | N/A | N/A | N/A | N/A | 7.9 2.1 | 3.8 | Undetected |
| W02441123-2 | 02:44:20.191 | 11:24:58.40 | 767 | WISE undetected | N/A | N/A | N/A | N/A | 6.6 2.1 | 3.1 | Undetected |
| W02441123-3 | 02:44:19.421 | 11:24:10.40 | 687 | J024419.14112416.0 9 | 14.860 0.032 | 14.546 0.051 | 12.121 | 9.261 | 6.4 2.1 | 3.0 | Undetected |
| W02441123-4 | 02:44:19.942 | 11:23:10.06 | 747 | WISE undetected | N/A | N/A | N/A | N/A | 6.9 2.1 | 3.3 | Undetected |
| W03323205-1 | 03:32:28.489 | 32:05:28.67 | 213 | J033228.76320525.3 | 16.032 0.061 | 16.060 0.190 | 12.561 | 8.833 | 10.4 2.0 | 5.2 | Undetected |
| W03323205-2 | 03:32:34.155 | 32:05:48.99 | 697 | WISE undetected | N/A | N/A | N/A | N/A | 6.5 2.0 | 3.3 | Undetected |
| W03423753-1 | 03:42:23.576 | 37:54:37.60 | 606 | J034223.52375442.8 | 14.520 0.030 | 14.523 0.055 | 11.797 | 8.743 | 8.8 2.1 | 4.2 | Undetected |
| W03423753-2 | 03:42:22.562 | 37:54:22.93 | 324 | WISE undetected | N/A | N/A | N/A | N/A | 6.6 2.1 | 3.1 | Undetected |
| W03423753-3 | 03:42:20.872 | 37:54:26.27 | 525 | WISE undetected | N/A | N/A | N/A | N/A | 7.0 2.1 | 3.3 | Undetected |
| W03423753-4 | 03:42:16.170 | 37:53:45.92 | 788 | J034216.58375348.5 | 17.429 0.167 | 16.701 | 12.640 | 8.999 | 6.9 2.1 | 3.3 | Undetected |
| W03423753-5 | 03:42:28.278 | 37:52:58.26 | 586 | WISE undetected | N/A | N/A | N/A | N/A | 8.6 2.1 | 4.1 | Undetected |
| W03423753-6 | 03:42:28.644 | 37:53:26.26 | 576 | WISE undetected | N/A | N/A | N/A | N/A | 7.6 2.1 | 3.6 | Undetected |
| W03423753-7 | 03:42:20.872 | 37:53:58.27 | 344 | J034221.22375401.9 | 15.911 0.056 | 16.036 0.167 | 11.844 | 8.938 | 7.4 2.1 | 3.5 | Undetected |
| W03521947-1 | 03:52:09.368 | 19:47:08.86 | 545 | WISE undetected | N/A | N/A | N/A | N/A | 6.0 1.9 | 3.2 | Undetected |
| W04040712-1 | 04:04:41.751 | 07:12:59.20 | 404 | J040441.89071258.0 | 17.185 0.145 | 17.301 | 12.608 | 9.134 | 6.2 1.9 | 3.3 | Undetected |
| W04040712-2 | 04:04:43.566 | 07:12:30.20 | 354 | WISE undetected | N/A | N/A | N/A | N/A | 6.1 1.9 | 3.2 | Undetected |
| W04430643-1 | 04:43:32.581 | 06:43:50.10 | 324 | WISE undetected | N/A | N/A | N/A | N/A | 13.5 3.7 | 3.6 | Undetected |
| W04430643-2 | 04:43:34.230 | 06:42:09.81 | 687 | J044334.58064212.9 | 15.757 0.049 | 15.578 0.140 | 12.240 | 8.843 | 12.0 3.7 | 3.2 | Undetected |
| W04430643-3 | 04:43:35.534 | 06:42:18.67 | 707 | WISE undetected | N/A | N/A | N/A | N/A | 6.0 1.9 | 3.2 | Undetected |
| W08493033-1 | 08:49:02.961 | 30:32:33.00 | 626 | WISE undetected | N/A | N/A | N/A | N/A | 7.7 2.4 | 3.2 | 0.93 |
| Source Name | R.A. | Dec. | Distance To | WISE Name | 3.4 m | 4.6 m | 12 m | 22 m | 850 m | SNR | FIRST |
| (J2000) | (J2000) | WISE Target | (mag) | (mag) | (mag) | (mag) | (mJy) | /NVSS | |||
| (arcsec) | Detection | ||||||||||
| Limit | |||||||||||
| (mJy/beam) | |||||||||||
| W08493033-2 | 08:49:05.438 | 30:32:12.33 | 768 | WISE undetected | N/A | N/A | N/A | N/A | 7.5 2.4 | 3.1 | 0.93 |
| W08493033-3 | 08:49:07.270 | 30:32:12.33 | 838 | WISE undetected | N/A | N/A | N/A | N/A | 7.9 2.4 | 3.3 | 0.92 |
| W10256128-1 | 10:25:02.081 | 61:28:49.02 | 545 | WISE undetected | N/A | N/A | N/A | N/A | 6.3 2.0 | 3.2 | 0.98 |
| W10256128-2 | 10:25:12.691 | 61:27:40.36 | 586 | WISE undetected | N/A | N/A | N/A | N/A | 6.0 2.0 | 3.0 | 0.98 |
| W10256128-3 | 10:25:14.969 | 61:27:21.36 | 788 | WISE undetected | N/A | N/A | N/A | N/A | 6.1 2.0 | 3.1 | 0.98 |
| W10460250-1 | 10:46:31.465 | 02:50:06.70 | 304 | J104631.08025001.8 | 17.645 0.216 | 16.490 0.283 | 12.532 | 8.979 | 6.7 2.1 | 3.2 | 0.90 |
| W10460250-2 | 10:46:30.931 | 02:49:11.03 | 758 | WISE undetected | N/A | N/A | N/A | N/A | 7.2 2.1 | 3.4 | 0.90 |
| W10460250-3 | 10:46:37.272 | 02:50:32.70 | 596 | WISE undetected | N/A | N/A | N/A | N/A | 6.2 2.1 | 3.0 | 0.90 |
| W11073421-1 | 11:07:32.012 | 34:20:55.03 | 344 | WISE undetected | N/A | N/A | N/A | N/A | 7.0 2.0 | 3.0 | 0.89 |
| W11073421-2 | 11:07:30.425 | 34:19:51.36 | 888 | WISE undetected | N/A | N/A | N/A | N/A | 6.4 2.0 | 3.2 | 0.90 |
| W12104750-1 | 12:10:30.748 | 47:50:51.20 | 495 | J121031.00475052.0 | 17.411 0.141 | 16.638 0.254 | 12.681 | 8.527 | 8.2 2.3 | 3.6 | 0.96 |
| W12104750-2 | 12:10:37.038 | 47:50:30.51 | 888 | WISE undetected | N/A | N/A | N/A | N/A | 7.0 2.3 | 3.0 | 0.96 |
| W12104750-3 | 12:10:30.515 | 47:49:50.86 | 283 | J121030.53474956.7 | 16.952 0.095 | 16.452 0.203 | 12.641 | 9.071 | 7.6 2.3 | 3.3 | 0.97 |
| W12104750-4 | 12:10:26.676 | 47:48:38.87 | 858 | J121027.36474837.9 | 17.364 0.129 | 17.296 0.468 | 12.331 | 8.509 | 10.7 2.3 | 4.7 | 0.95 |
| W12104750-5 | 12:10:21.181 | 47:49:27.85 | 758 | J121021.04474927.4 | 17.210 0.124 | 16.402 0.207 | 12.546 | 8.992 | 7.7 2.3 | 3.3 | 0.99 |
| W12124659-1 | 12:12:08.419 | 47:00:07.23 | 364 | J121208.25470004.4 | 16.950 0.103 | 16.375 0.211 | 12.261 | 8.896 | 7.9 2.5 | 3.2 | 0.99 |
| W12124659-2 | 12:12:10.015 | 46:59:34.56 | 485 | WISE undetected | N/A | N/A | N/A | N/A | 6.0 1.9 | 3.2 | 0.98 |
| W12124659-3 | 12:12:11.970 | 46:59:42.22 | 636 | WISE undetected | N/A | N/A | N/A | N/A | 7.8 2.5 | 3.1 | 1.58 |
| W14091732-1 | 14:09:22.400 | 17:32:20.03 | 82 | WISE undetected | N/A | N/A | N/A | N/A | 6.4 2.0 | 3.2 | 1.58 |
| W14091732-2 | 14:09:26.832 | 17:31:44.35 | 304 | J140927.37173142.7 | 17.603 0.174 | 16.764 | 12.961 0.526 | 8.759 | 6.4 2.0 | 3.2 | 1.58 |
| W14091732-3 | 14:09:27.950 | 17:31:07.73 | 596 | J140928.23173108.2 | 17.956 0.211 | 16.908 0.311 | 12.657 | 9.339 | 7.9 2.0 | 4.0 | 0.93 |
| W14281113-1 | 14:29:00.256 | 17:12:11.25 | 687 | WISE undetected | N/A | N/A | N/A | N/A | 6.0 1.9 | 3.7 | 1.0 |
| W15011324-1 | 15:01:41.713 | 13:24:57.90 | 444 | J150141.93132450.8 | 18.011 0.214 | 17.207 | 12.892 | 9.321 | 7.1 2.2 | 3.2 | 0.95 |
| W15011324-2 | 15:01:42.192 | 13:23:57.23 | 636 | J150142.45132358.6 | 17.196 0.106 | 16.988 0.330 | 12.984 | 9.239 | 7.2 2.2 | 3.3 | 0.94 |
| Source Name | R.A. | Dec. | Distance To | WISE Name | 3.4 m | 4.6 m | 12 m | 22 m | 850 m | SNR | FIRST |
| (J2000) | (J2000) | WISE Target | (mag) | (mag) | (mag) | (mag) | (mJy) | /NVSS | |||
| (arcsec) | Detection | ||||||||||
| Limit | |||||||||||
| (mJy/beam) | |||||||||||
| W15011324-3 | 15:01:40.022 | 13:23:33.90 | 767 | WISE undetected | N/A | N/A | N/A | N/A | 7.3 2.2 | 3.3 | 0.94 |
| W15011324-4 | 15:01:38.423 | 13:24:33.57 | 203 | WISE undetected | N/A | N/A | N/A | N/A | 6.8 2.2 | 3.1 | 0.94 |
| W15173523-1 | 15:17:59.282 | 35:24:29.97 | 323 | WISE undetected | N/A | N/A | N/A | N/A | 5.8 1.9 | 3.1 | 0.94 |
| W15173523-2 | 15:17:56.992 | 35:23:49.97 | 243 | WISE undetected | N/A | N/A | N/A | N/A | 5.7 1.9 | 3.0 | 0.99 |
| W15173523-3 | 15:17:51.703 | 35:23:33.95 | 888 | J151751.39352327.9 | 17.874 0.158 | 17.702 | 12.762 | 9.464 | 5.7 1.9 | 3.0 | 0.99 |
| W15173523-4 | 15:17:54.348 | 35:23:02.30 | 727 | J151754.19352302.8 | 16.418 0.052 | 15.611 0.084 | 12.607 0.319 | 9.495 | 5.7 1.9 | 3.0 | 0.99 |
| W15173523-5 | 15:17:56.065 | 35:22:35.30 | 747 | WISE undetected | N/A | N/A | N/A | N/A | 5.8 1.9 | 3.1 | 0.99 |
| W16305126-1 | 16:30:41.014 | 51:26:52.03 | 566 | WISE undetected | N/A | N/A | N/A | N/A | 5.8 1.9 | 3.1 | 0.96 |
| W16305126-2 | 16:30:30.174 | 51:27:04.36 | 737 | WISE undetected | N/A | N/A | N/A | N/A | 5.8 1.9 | 3.1 | 0.97 |
| W17032615-1 | 17:03:35.673 | 26:16:19.28 | 707 | WISE undetected | N/A | N/A | N/A | N/A | 6.8 2.0 | 3.4 | 0.98 |
| W17175313-1 | 17:17:00.517 | 53:13:51.29 | 495 | WISE undetected | N/A | N/A | N/A | N/A | 7.5 2.5 | 3.0 | 0.95 |
| W17175313-2 | 17:17:00.592 | 53:13:15.63 | 535 | J171700.48531319.7 | 15.618 0.341 | 15.988 0.195 | 10.482 | 8.604 | 11.7 2.5 | 4.7 | 0.95 |
| W17175313-3 | 17:17:08.461 | 53:13:15.96 | 404 | WISE undetected | N/A | N/A | N/A | N/A | 7.5 2.5 | 3.0 | 0.96 |
| W21260103-1 | 21:26:17.587 | 01:04:18.48 | 505 | WISE undetected | N/A | N/A | N/A | N/A | 7.8 2.0 | 3.9 | 1.0 |
| W21331419-1 | 21:33:53.760 | 14:19:46.42 | 586 | J213353.65141946.5 | 15.002 0.037 | 14.929 0.080 | 12.506 | 8.595 | 5.5 1.8 | 3.1 | Undetected |
| W22123326-1 | 22:12:54.092 | 33:26:36.35 | 636 | WISE undetected | N/A | N/A | N/A | N/A | 8.9 2.0 | 4.5 | Undetected |
| W22123326-2 | 22:13:01.443 | 33:27:24.72 | 868 | WISE undetected | N/A | N/A | N/A | N/A | 6.7 2.0 | 3.4 | Undetected |
| W22121253-1 | 22:12:00.655 | 12:53:38.03 | 596 | WISE undetected | N/A | N/A | N/A | N/A | 8.0 2.1 | 3.8 | Undetected |
| W22121253-2 | 22:12:09.226 | 12:54:07.70 | 596 | WISE undetected | N/A | N/A | N/A | N/A | 7.5 2.1 | 3.6 | Undetected |
| W22220951-1 | 22:22:44.211 | 09:51:18.11 | 586 | WISE undetected | N/A | N/A | N/A | N/A | 7.3 2.0 | 3.7 | 0.86 |
| W22220951-2 | 22:22:46.971 | 09:50:09.38 | 787 | J222247.42095008.1 | 17.476 0.180 | 17.290 | 12.598 | 8.629 | 9.3 2.0 | 4.7 | 0.85 |
| W22220951-3 | 22:22:50.953 | 09:50:29.02 | 626 | WISE undetected | N/A | N/A | N/A | N/A | 8.6 2.0 | 4.3 | 0.86 |
| W22260025-1 | 22:26:20.255 | 00:24:35.57 | 697 | WISE undetected | N/A | N/A | N/A | N/A | 8.4 1.9 | 4.4 | 0.77 |
| W22260025-2 | 22:26:21.855 | 00:24:04.23 | 747 | WISE undetected | N/A | N/A | N/A | N/A | 6.9 1.9 | 3.7 | 0.77 |
| Source Name | R.A. | Dec. | Distance To | WISE Name | 3.4 m | 4.6 m | 12 m | 22 m | 850 m | SNR | FIRST |
| (J2000) | (J2000) | WISE Target | (mag) | (mag) | (mag) | (mag) | (mJy) | /NVSS | |||
| (arcsec) | Detection | ||||||||||
| Limit | |||||||||||
| (mJy/beam) | |||||||||||
| W22300720-1 | 22:30:06.993 | 07:19:51.90 | 707 | WISE undetected | N/A | N/A | N/A | N/A | 5.8 1.8 | 3.2 | 0.93 |
| W22300720-2 | 22:30:09.189 | 07:19:59.90 | 576 | WISE undetected | N/A | N/A | N/A | N/A | 6.0 1.8 | 3.3 | 0.93 |
| W22300720-3 | 22:30:12.080 | 07:20:47.90 | 596 | WISE undetected | N/A | N/A | N/A | N/A | 5.5 1.8 | 3.1 | 0.93 |
| W22300720-4 | 22:30:08.607 | 07:22:24.23 | 808 | J223008.35072220.9 | 17.423 0.174 | 16.992 0.438 | 12.065 | 8.834 | 5.7 1.8 | 3.2 | 0.92 |
| W23250429-1 | 23:25:06.972 | 04:28:44.43 | 667 | WISE undetected | N/A | N/A | N/A | N/A | 7.1 2.1 | 3.4 | 2.27 |
| W23250429-2 | 23:25:01.088 | 04:30:43.77 | 767 | WISE undetected | N/A | N/A | N/A | N/A | 9.8 2.1 | 4.7 | 2.20 |
| W23311411-1 | 23:31:05.148 | 14:11:08.87 | 485 | J233104.89141108.4 | 16.393 0.074 | 16.900 0.423 | 12.543 | 8.351 | 6.9 2.2 | 3.1 | Undetected |
| W23453120-1 | 23:45:44.634 | 31:19:41.80 | 566 | J234544.45311941.9 | 17.217 0.124 | 15.988 0.157 | 12.585 | 8.841 | 11.3 2.0 | 5.7 | Undetected |
| W23453120-2 | 23:45:34.358 | 31:20:02.12 | 848 | WISE undetected | N/A | N/A | N/A | N/A | 6.3 2.0 | 3.2 | Undetected |
| Source | SFRD | Redshift |
| M⊙ yr-1 Mpc-3 | ||
| W08310140 | 7949159 | 3.91 |
| W11364236 | 206441 | 2.39 |
| W16032747 | 298960 | 2.63 |
| W18143412 | 152330 | 2.45 |
| W18354355 | 240648 | 2.3 |
| W20260716 | 283557 | 2.54 |
| W20540207 | 430486 | 2.52 |
| W22160723 | 291758 | 1.68 |
| W22460526 | 5808116 | 4.59 |
| W23570328 | 253851 | 2.12 |
| W00101643 | 5311106 | 2.855 |
| W02441123 | 4035162 | Unknown |
| W03323205 | 179972 | Unknown |
| W03423753 | 18715374 | 0.47 |
| W03521947 | 104542 | Unknown |
| W04040712 | 213385 | Unknown |
| W04430643 | 3686147 | Unknown |
| W08493033 | 4005160 | Unknown |
| W10256128 | 3091124 | Unknown |
| W10460250 | 2699108 | Unknown |
| W11073421 | 211942 | Unknown |
| W12104750 | 4992100 | Unknown |
| W12124659 | 317864 | Unknown |
| W14091732 | 3454138 | Unknown |
| W14281113 | 121949 | 1.6 |
| W15011324 | 9501190 | 0.505 |
| W15173523 | 449990 | 1.515 |
| W16305126 | 204682 | Unknown |
| W17032615 | 136455 | Unknown |
| W17175313 | 3935157 | 2.717 |
| W21260103 | 224789 | 0.607 |
| W21331419 | 113245 | Unknown |
| W22121253 | 2931117 | Unknown |
| W22123326 | 179972 | Unknown |
| W22220951 | 314963 | Unknown |
| W22260025 | 402580 | 0.607 |
| W22300720 | 12596252 | 0.444 |
| W23250429 | 222088 | 1.737 |
| W23311411 | 217787 | Unknown |
| W23453120 | 2772111 | Unknown |