.
Possible existence of a filamentary state in type-II superconductors
Abstract
The standard interpretation of the phase diagram of type-II superconductors was developed in 1960s and has since been considered a well-established part of classical superconductivity. However, upon closer examination a number of fundamental issues arise that leads one to question this standard picture. To address these issues we studied equilibrium properties of niobium samples near and above the upper critical field in parallel and perpendicular magnetic fields. The samples investigated were very high quality films and single crystal discs with the Ginzburg-Landau parameters 0.8 and 1.3, respectively. A range of complementary measurements have been performed, which include dc magnetometry, electrical transport, SR spectroscopy and scanning Hall-probe microscopy. Contrarily to the standard scenario, we observed that a superconducting phase is present in the sample bulk above and the field is the same in both parallel and perpendicular fields. Our findings suggest that above the superconducting phase forms filaments parallel to the field regardless on the field orientation. Near the filaments preserve the hexagonal structure of the preceding vortex lattice of the mixed state and the filament density continuously falls to zero at . Our work has important implications for the correct interpretation of properties of type-II superconductors and can also be essential for practical applications of these materials.
Interpretation of equilibrium properties of superconductors has a pivotal significance for the entire realm of quantum physics, extending from neutron stars to the standard model Huebener ; Ranninger . Therefore it is important to verify any concern related to description of these properties.
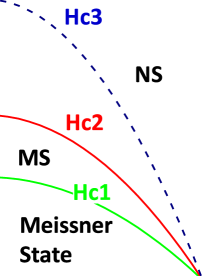
Type-II superconductors subjected to a magnetic field above the lower critical field can be found in three equilibrium states De Gennes ; L&P ; Abrikosov ; Tinkham : in the mixed state (MS), where average magnetic induction and currents form vortices organized in a hexagonal lattice; in a “surface superconductivity” state, where everywhere except a sheath with thickness of the order of the Ginzburg-Landau (GL) coherence length near the surface parallel to ; and in the normal state (NS). The typical phase diagram of type-II superconductors of cylindrical geometry (such as, e.g., infinite circular cylinders and slabs with thickness greatly exceeding the penetration depth) in parallel magnetic field, or of massive samples with demagnetizing factor Landafshitz_II is shown in Fig. 1. Transitions between states, occurring at the critical fields and , are second order phase transitions. In ellipsoidal samples with the sheath formes an equatorial band whose width decreases with increasing . In samples with (infinite slabs in perpendicular field) the band vanishes and surface superconductivity disappears. Since MS in such samples starts from , their phase diagram consists of a single curve .
This interpretation of the properties of type-II superconductors is based on two well known solutions of the linearized GL equation obtained by Abrikosov Abrikosov57 and Saint-James and de Gennes Saint-James . In spite of a narrow range of applicability of the GL theory GL ; Shoenberg ; Gorkov2 , its tremendous success has been due to an explanation of very puzzling properties of these materials.
One of such puzzles was a factor of two discrepancy in the upper critical field following from magnetic and resistive measurements. It was often attributed to defects and insufficient sensitivity of magnetometers (see, e.g. Druyvesteyn ) and therefore ignored in theories (e.g., Tinkham63 ). Saint-James and de Gennes treated superconductivity above as an equilibrium property, thus providing an interpretation of the entire phase diagram within one theory.
However this standard picture raises some questions. In particular, it implies that in parallel geometry superconductivity nucleates at a field () almost twice as large as the field at which it nucleates in perpendicular geometry (). By definition, the field passes the sample in the NS being unperturbed, i.e. not noticing the surface. Hence, nucleation at should not depend on the field-to-surface orientation. Also, in this scenario the states coexisting at belong to different classes of symmetry, like crystal and liquid. Hence, the phase transition at should not be of second order LL . In particular, in samples with the coexisting states are the MS and the NS. Apart from different symmetries, the minimum amount of a superconducting (S) phase needed to create the vortex lattice is 10% of the sample volume. Hence, this transition should not be continuous.
In this communication we challenge the standard interpretation of the phase diagram of type-II superconductors by showing that above the S phase forms filaments parallel to applied field regardless of its orientation.
To address the indicated questions, we measured magnetization, electrical transport, SR spectra and took scanning Hall-probe microscopy (SHPM) images on Nb samples. Those were two high-purity 5.7 m thick films 46 mm2 (Nb-F) and 24 mm2 (Nb-F2), and two one-side polished 1 mm thick discs with diameter 7 mm (Nb-SC) and 19 mm (Nb-SC2) cut from the same single crystal rod. The film samples were cut from a film grown on sapphire using electron cyclotron resonance technique Anne-Marie ; its residual resistivity ratio is 640. The GL parameter determined from magnetization curves in parallel field is 0.8 (1.3) near the critical temperature rising up to 1.1 (1.6) at 2 K for the Nb-F (Nb-SC) sample. of the film (single crystal) samples is 9.25 K (9.20 K). As verified by magnetization measurements, the samples are nearly pinning-free at 8 K.
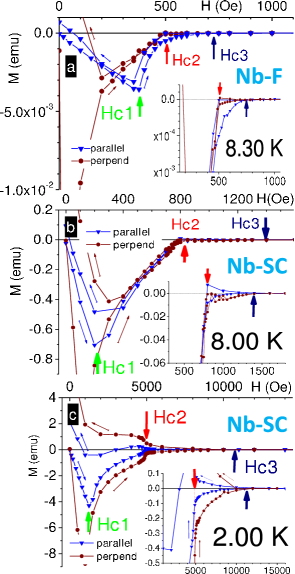
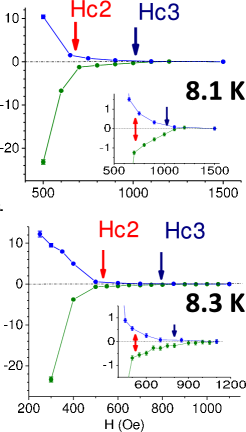
The magnetic moment was measured on the Nb-F and Nb-SC samples using Quantum Design MPMS system. Typical data for high temperatures are shown in Figs. 2a, b. We see that and are well distinguishable for both samples. At low temperatures flux trapping is more significant, however it is still possible to resolve the critical fields. An example of the low-temperature data for the Nb-SC sample is shown in Fig. 2c. We observe that above the S phase is present for both field orientations, and in both cases is the same. These results are inconsistent with the surface sheath interpretation. In particular, they suggest that above the S phase forms either droplets or filaments with decreasing number density under increasing field.
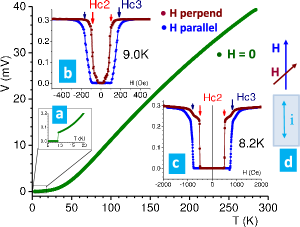
The electrical resistance was measured for Nb-F2 sample using a low-current (2 mA) ac bridge. Voltage across potential leads measured vs at and vs at constant is shown in Fig. 3. In Figs. 3b and 3c we see that resistance drops abruptly at in parallel and at in perpendicular field, where and are inferred from . This is in line with the data on electrical transport used to support the surface superconductivity interpretation (see, e.g., Hempstead ; Gygax ; Cardona ; Deutscher ). However, this interpretation conflicts with data. At the same time both resistance and are consistent with a filament scenario, provided the filaments are parallel to the applied field. The resistance data rule out the droplet scenario.
Alternatively, magnetic properties can be studied by SR. Its bulk version makes use of polarized muons, probing at 0.1 mm below the sample surface, i.e. in the bulk (see, e.g., NL ; Sonier ; Yaouanc for details).
SR spectra were acquired for the Nb-SC2 sample in perpendicular field at the Dolly instrument of the Swiss Muon Source. Number of events of muon decays collected in each data point is ; statistical error in measured field is . Typical time-spectra for the MS are shown in Fig. 4a, where insert shows the spectra for the NS. For comparison, Fig. 4b shows the spectra for the IS taken at the same reduced temperature and field for a type-I In sample; the insert shows the spectra of In in the NS.
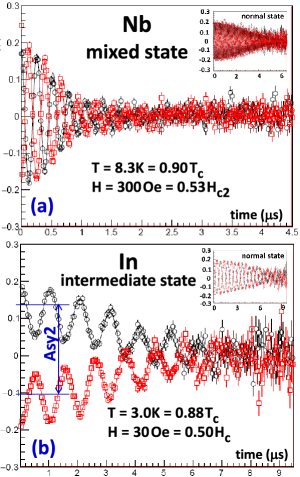
We see that apart from a much larger damping rate (the damping rate for Nb in the MS normalized relative to that in the NS is greater than the normalized damping rate for In in the IS by a factor of 5), indicating for a strong field inhomogeneity, the spectra of the MS differ from those of the IS by absence of the asymmetry (see Fig. 4b), caused by non-precessing muons stopped in S domains with the Meissner () phase Egorov . Unlike the IS, throughout the sample in the MS Abrikosov ; Brandt2003 . Therefore, all muons implanted in such samples precess, resulting in disappearance of . The absence of in SR spectra of our Nb sample confirms that it is in the MS but not in the intermediate-mixed state Forgan ; Khasanov .
Data for the most probable field extracted from the SR spectra Sonier are shown in Fig. 5 in terms of vs on two scales. As seen, abruptly changes at . At higher field decreases vanishing near . and were inferred from the data for the Nb-SC sample. The SR data are consistent with those on magnetization apart from a greater hysteresis under descending field, probably caused by a stronger pinning in the Nb-SC2 sample. The SR results confirm the presence of the S phase in the sample bulk above in perpendicular field, hence supporting the filament scenario.
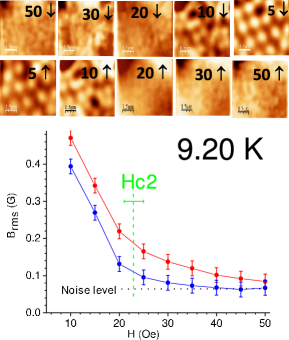
Images of the magnetic field pattern near the surface of the Nb-F sample were taken using a scanning Hall-probe microscope Simon . This was our most challenging experiment due to the low field contrast and the limited microscope resolution. To maximize the signal-to-noise ratio, the images were taken at the lowest possible fields, i.e. at a temperature (9.20 K) very close to .
Typical images are shown in Fig. 6, where the colors reflect the relative magnitude of the induction, the brightest color corresponds to the strongest . We see that while vortices are clearly distinguishable in a weak field, they become practically unresolvable as is approached. However, a field contrast exceeding the noise level remains below and above . To quantify this observation we calculated , where represents a statistical average over the scanned area (7.6 7.6 m2). The graphs for are shown in Fig. 6, where is inferred from . above and it decreases with increasing . This agrees with the data on and , confirming that the tiny contrast in the SHPM images above is a real feature consistent with the filament interpretation.
We conclude that (a) all obtained results are in line with each other; (b) the and SR data reveal the presence of the S phase above in perpendicular field at the same field range as in parallel field; (c) the resistivity data indicate that the S phase forms filaments parallel to the applied field; (d) the filament interpretation is also consistent with the SHPM images.
Now we turn to the question of what is happening near . First we note that contrary to the IS, where MM and Egorov exhibit strong supercooling at the critical field, in the MS, as seen from Figs. 2 and 5, both and are continuous functions exhibiting discontinuous change in and at . and are the first derivatives of the thermodynamic potentials and , respectively ( is the field strength inside the sample) Landafshitz_II . Therefore our results meet the classical definition of second order phase transition Ehrenfest , thus confirming the standard interpretation of the transition at .
Next, since , Khasanov and the heat capacity Serin are smooth functions in the MS, the equilibrium structure near hardly differs from a periodic lattice of vortices, well verified at low Essmann . Therefore the filament structure should also be periodic LL .
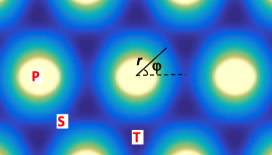
Due to hexagonal symmetry of the vortex lattice, a “landscape” of has “peaks” (vortex cores) with maximum , “troughs” with minimum and “saddle points” between the nearest peaks. Currents form loops about the peaks. The current per unit length of the vortex , being a function of the azimuthal () and radial () coordinates (see Fig. 7), is determined by the local gradient of the induction Landafshitz_II . The latter is minimal in the saddle points, thus making these points weak spots in the loops. At the current in the loops ceases. This happens when the angular momentum of electrons in Cooper pairs (or “superconducting electrons”) decreases down to its minimum value, i.e. a quantum of angular momentum , where is the effective mass of these electrons and is their speed at radius . This Bohr’s condition yields (see Appendix) the minimum difference between the peaks and the saddle points. In CGS units
| (1) |
where and are number density and charge of the superconducting electrons, is the London penetration depth, is the flux quantum, is the core radius, and is the radius at the saddle point.
Hence, consistently with Abrikosov Abrikosov57 , one can conclude that at the magnetic landscape is not flat. For instance, if differs from by only 0.01%, is already 1 G. In the troughs is smaller than in the saddle points, therefore, upon collapse of the vortex current at , S phase survives at the troughs where it formes filaments in the out-of-plane (parallel to the field) direction. The amount of S phase just above can be estimated from the difference between the areas of a hexagonal unit cell of the lattice and a circle inscribed in it, which yields about 10% of the sample volume. Currents driven by the field gradient in the troughs now circulate in the filaments. It is important that right above the filaments keep hexagonal symmetry of the vortex lattice below , thus removing the question about impossibility of the second order phase transition at .
Under increasing the filaments disappear one by one as it happens with S laminae in the IS IS . This implies that the filament density continuously decreases down to zero at . This is consistent with the data on (Fig. 2) and (Fig. 5).
A final point to be addressed is the nucleation of superconductivity under decreasing field. One can expect that the first stable nuclei are small droplets in the sample bulk. Then the field near the droplets is perturbed, making zones of depleted field near the droplet poles. Therefore the next nuclei will preferably appear in these zones, thus creating filaments parallel to the field. In such case the transition at is continuous, in consistent with experiments.
To summarize, results of reported magnetization, electrical transport, SR and SHPM measurements performed on Nb samples with different indicate that superconductivity in type-II materials nucleates at regardless of the orientation of the applied field. Between and superconducting phase exists in the sample bulk, most probably in form of filaments parallel to the applied field. Under increasing field above the filament number density decreases vanishing at .
The suggested interpretation of properties of type-II superconductors at high field is based on experimental results obtained for two low- (0.8 and 1.3) superconductors. Therefore it is interesting to verify these observations with materials of higher . Single crystal A15 compounds and high- materials at sufficiently close to temperatures (where pinning is minimal) can be appropriate for such a verification.
Acknowledgments
We are grateful to Oscar Bernal and Andrew MacFarlane for the crucial help in organizing the project and to Pabitra Biswas for help in conducting SR measurements. This work was supported in part by the National Science Foundation (Grant No. DMR 0904157), by the Research Foundation – Flanders (FWO, Belgium) and by the Flemish Concerted Research Action (BOF KU Leuven, GOA/14/007) research program. S.J.B. acknowledges support from EPSRC in the UK under grant number EP/J010626/1 and the NanoSC COST Action MP-1201. A.-M. Valente-Feliciano is supported by the U.S. Department of Energy, Office of Science, Office of Nuclear Physics under contract DE-AC05-06OR23177. V.K. acknowledges support from the sabbatical fund of the Tulsa Community College.
Appendix: Formula (1)
To calculate between the peak and the saddle points at we will use cylindrical coordinates with axis parallel to B with azimuthal and radial coordinates shown in Fig. 7.
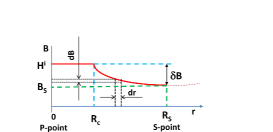
Change in the normal (radial) direction over a radial interval (see Fig. 8) occurs due to the current running in azimuthal direction in the cylindrical layer of radius and thickness , where is the length of the cylinder (length of the vortex) and is the current per unite length of the cylinder. In CGS units and are linked as Landafshitz_II
| (2) |
where is speed of light.
Therefore,
| (3) |
where , and is number density, charge and speed of superconducting electrons (electrons paired in Cooper pairs) in the layer, respectively, and is density of the current running through the cross sectional area .
Therefore,
| (4) |
At the Bohr condition for the minimal angular momentum of the superconducting electron is
| (5) |
Therefore,
| (6) |
Integrating the last expression over the radial interval from the radius of the core to the radius of the saddle point one obtains formula (1)
| (7) |
where and are the superconducting flux quantum and the London penetration depth, respectively.
-
(1)
Vortices in Unconventional Superconductors and Superfluids, R. P. Huebener, N. Schopol, G. E. Volovik (Eds.), (Soringer-Verlag, 2002).
- (2) J. Ranninger, The conceptual heritage of superconductivity - from Meissner-Ochsenfeld to the Higgs Boson, arXiv:1207.6911 [cond-mat.supr-con], 2012.
- (3) P. G. De Gennes, Superconductivity of Metals and Alloys (Perseus Book Publishing, L.L.C., 1966).
- (4) E. M. Lifshitz and L. P. Pitaevskii Statistical Physics v.2, M., Nauka, 1978.
- (5) L. D. Landau, E.M. Lifshitz and L. P. Pitaevskii, Electrodynamics of Continuous Media, 2nd ed. (Elsevier, 1984).
- (6) A. A. Abrikosov, Fundamentals of the Theory of Metals (Elsevier Science Pub. Co., 1988).
- (7) M. Tinkham, Introduction to Superconductivity (McGraw-Hill, 1996).
- (8) A. A. Abrikosov, Zh.E.T.F. 32, 1442 (1957).
- (9) D. Saint-James and P. G. De Gennes, Phys. Letters 7, 306 (1963).
- (10) V. L. Ginzburg and L. D. Landau, Zh.E.T.F. 20, 1064 (1950).
- (11) D. Shoenberg, Superconductivity, 2nd. ed., (Cambridge University Press, 1952).
- (12) L. P. Gor’kov, in 100 Years of Superconductivity, p. 72, Ed. H. Rogalla and P. H. Kes (CRC Press, 2012).
- (13) W. F. Druyvesteyn, D. J. Ooijen and T. J. Berren, Rev. Mod. Phys. 36, 58 (1964).
- (14) M. Tinkham, Phys. Rev. 129, 2413 (1963).
- (15) L. D. Landau and E. M. Lifshitz Statistical Physics p.1, 3d edition, (Elsevier Science Pub. Co., 2011).
- (16) A.-M. Valente-Feliciano, Development of SRF thin film materials for monolayer/multilayer approach to increase the performance of SRF accelerating structures beyond bulk Nb, PhD Dissertation Université Paris XI, 2014.
- (17) C. F. Hempstead and Y. B. Kim, Phys. Rev. Letters 12, 145 (1964).
- (18) S. Gygax, J. L. Olsen and R. H. Kropschot, Phys. Letters 8, 228 (1964).
- (19) M. Cardona and B. Rosenbblum, Phys. Letters 8, 308 (1964).
- (20) G. Deutscher, J. Phys. Chem. Solids 28, 741 (1967).
- (21) V. Kozhevnikov, A. Suter, H. Fritzsche, V. Gladilin, A. Volodin, T. Moorkens, M. Trekels, J. Cuppens, B. M. Wojek, T. Prokscha, E. Morenzoni, G. J. Nieuwenhuys, M. J. Van Bael, K. Temst, C. Van Haesendonck, J. O. Indekeu, Phys. Rev. B87, 104508 (2013).
- (22) J. E. Sonier, J. H. Brewer and R. F. Kiefl, Rev. Mod. Phys. 72, 769 (2000).
- (23) A. Yaouanc, P. Dalmas de Reotier, ”Muon Spin Rotation, Relaxation, and Resonance” (Oxford University Press, 2011).
- (24) E. H. Brandt, Phys. Rev. B 68, 054506 (2003).
- (25) V. S. Egorov, G. Solt, C. Baines, D. Herlach, and U. Zimmermann, Phis. Rev. B 64, 024524 (2001).
- (26) M. Laver, E. M. Forgan, S. P. Brown, D. Charalambous, D. Fort, C. Bowell, S. Ramos, R. J. Lycett, D. K. Christen, J. Kohlbrecher, C. D. Dewhurst, and R. Cubitt, Phys. Rev. Letters 96, 167002 (2006).
- (27) A. Yaouanc, A. Maisuradze, N. Nakai, K. Machida, R. Khasanov, A. Amato, P. K. Biswas, C. Baines, D. Herlach, R. Henes, P. Keppler, and H. Keller, PRB 89, 184503 (2014).
- (28) A. Oral, S. J. Bending and M. Henini, Appl. Phys. Lett. 69, 1324 (1996).
- (29) V. Kozhevnikov and C. Van Haesendonck, Phys. Rev. B 90, 104519 (2014).
- (30) U. Essmann and H. Trauble, Phys. Letters 24A, 526 (1967).
- (31) P. Ehrenfest, Proc. Acad. Sci. Amsterdam 36, 153 (1933).
- (32) B. Serin, in Superconductivity, v. 2, Ed. R. D. Parks (Marcel Dekker, Inc., N.Y., 1969).
- (33) V. Kozhevnikov, R. J. Wijngaarden, J. de Wit, and C. Van Haesendonck. PRB 89, 100503(R) (2014).
- (2) J. Ranninger, The conceptual heritage of superconductivity - from Meissner-Ochsenfeld to the Higgs Boson, arXiv:1207.6911 [cond-mat.supr-con], 2012.