A Large-Scale Exploration of Factors Affecting Hand Hygiene Compliance Using Linear Predictive Models
Abstract
This large-scale study, consisting of 24.5 million hand hygiene opportunities spanning 19 distinct facilities in 10 different states, uses linear predictive models to expose factors that may affect hand hygiene compliance. We examine the use of features such as temperature, relative humidity, influenza severity, day/night shift, federal holidays and the presence of new residents in predicting daily hand hygiene compliance. The results suggest that colder temperatures and federal holidays have an adverse effect on hand hygiene compliance rates, and that individual cultures and attitudes regarding hand hygiene exist among facilities.
Index Terms:
Public healthcare, Hand hygiene, Supervised learning, Linear regression, Event detectionI Introduction
Healthcare associated infections represent a major cause of morbidity and mortality in the United States and other countries [1]. Although many can be treated, these infections add greatly to healthcare costs [2]. Furthermore, the emergence of multidrug resistant bacteria have greatly complicated treatment of healthcare associated infections [3], making the prevention of these infections even more important. One of the most effective interventions for preventing healthcare associated infections is hand hygiene [4]. Yet, despite international programs aimed at increasing hand hygiene [4, 5, 6], rates remain low, less than 50% in most cases [4, 6, 7].
Because of the importance of hand hygiene in preventing healthcare associated infections, infection control programs are encouraged to monitor rates to encourage process improvement [8, 6, 9]. In most cases, hand hygiene monitoring is done exclusively by human observers, which are still considered the gold standard for monitoring [7]. Yet, human observations are subject to a number of limitations. For example, human observers incur high costs and there are difficulties in standardizing the elicited observations. Also, the timing and location of observers can greatly affect the diversity and the quantity of observations [10, 11]. Furthermore, the distance of observers to healthcare workers under observation and the relative busyness of clinical units can adversely affect the accuracy of human observers [11]. The presence of human observers may artificially increase hand hygiene rates temporarily as the presence of other healthcare workers can induce peer effects to increase rates [12, 13]. Finally, the number of human observations possible is quite small in comparison to the number of opportunities [7, 12]. Several automated approaches to monitoring have been proposed [14, 8, 15, 16]. Many of these measure hand hygiene upon entering and leaving a patient’s room. The subsequent activation of a nearby hand hygiene dispenser is recorded as a hand hygiene opportunity fulfilled whereas, if no such activation is observed, the opportunity is not satisfied. Such approaches, while not capturing all five moments of hand hygiene, do provide an easy and convenient measure of hand hygiene compliance. With automated approaches becoming more common, a more comprehensive picture of hand hygiene adherence should emerge, providing new insights into why healthcare workers abstain from practicing hand hygiene.
II Data and Methods
II-A Hand Hygiene Event Data
Our hand hygiene event data is a proprietary dataset provided by Gojo Industries. The data were obtained from a number of installations consisting of door counter sensors, which increment a counter anytime an individual goes in or out of a room, and hand hygiene sensors, which increment a counter when soap or alcohol rub are dispensed. Additional supporting technology was also installed to collect and record timestamped sensor-reported counts. In this paper, we will use the term dispenser event to designate triggering and use of an instrumented hand hygiene dispenser and door event to designate the triggering of a counter sensor located on one of the instrumented doors.
A total of 19 facilities in 10 states were outfitted with sensors; because of privacy concerns, we provide only the state and CDC Division for each. The facilities comprise a wide range of geographies, spanning both coasts, the midwest, and the south. A total of 1851 door sensors and 639 dispenser sensors reported a total of 24,525,806 door events and 6,140,067 dispenser events, beginning on October 21, 2013 and ending on July 7, 2014. Each facility contributed an average of 172.3 reporting days, making this study the largest investigation of hand hygiene compliance to date (i.e., larger than the 13.1 million opportunities reported in [17]). Assuming each door event corresponds to a hand hygiene opportunity, we compute an estimated intra-facility compliance rate of 25.03%, in line with if not just below the reported low-end rate found in [18].
The original data, consisting of timestamped counts reported from individual sensors over short intervals, were re-factored to support our analysis. First, data from each sensor were binned by timestamp, , into 12 hour intervals, corresponding to traditional day and night shifts, as indicated by an additional variable, , defined as follows:
Second, door and dispenser counts were aggregated based on day and night shift so as to produce a series of records. For each such record we compute hand hygiene compliance, or just compliance, by dividing the number of reported dispensed events by the number of door events:
Such a definition of compliance assumes that each door event corresponds to a single hand-hygiene opportunity and each dispenser event corresponds to a single hand-hygiene event whereas, in reality, a health care worker might well be expected to perform hand hygiene more than once per entry, resulting in rates that exceed one, if only slightly. This estimator also ignores the placement of doors with respect to dispensers: multiple dispensers may well be associated with a single doorway, and some dispensers may be in rooms having multiple doors. Adding new dispensers will raise apparent compliance rates, while adding new door sensors will appear to reduce compliance. Even so, when applied consistently and if system layouts are fixed, this estimator is a reasonable approximation of true hand hygiene compliance, and supports sound comparisons within a facility (but not across facilities).
Because malfunctioning sensors or dead batteries can produce outliers (i.e., very low or very high values), records with fewer than 10 door or dispenser events reported per day (possibly indicating an installation undergoing maintenance), zero compliance, or compliance values greater than 1 were removed prior to analysis (at the cost of possibly excluding some legal records). The remaining data consists of 5308 shifts from the original 5647 records, having 21,273,980 hand hygiene opportunities and 5,296,749 hand hygiene events (see Table I).
| Facility | State | CDC Div | Tot Disp | Tot Door | Days Rep |
| 91 | OH | ENC | 234292 | 518772 | 252 |
| 101 | OH | ENC | 350901 | 2021665 | 260 |
| 105 | TX | WSC | 238899 | 1940024 | 260 |
| 119 | MN | WNC | 123877 | 242939 | 156 |
| 123 | TX | WSC | 325618 | 1112198 | 243 |
| 127 | NM | Mnt | 1306855 | 4546171 | 260 |
| 135 | OH | ENC | 125731 | 264331 | 258 |
| 144 | CA | Pac | 398961 | 1744642 | 260 |
| 145 | CA | Pac | 567096 | 2073566 | 260 |
| 147 | CA | Pac | 500979 | 2462900 | 260 |
| 149 | CA | Pac | 590708 | 2306392 | 260 |
| 153 | CT | New E | 169564 | 603482 | 208 |
| 155 | NY | M-At | 171275 | 619507 | 117 |
| 156 | NC | S-At | 4381 | 38200 | 15 |
| 157 | OH | ENC | 39455 | 313396 | 101 |
| 163 | OH | ENC | 344 | 10233 | 5 |
| 168 | PA | M-At | 30421 | 86909 | 20 |
| 170 | IL | ENC | 112604 | 353631 | 47 |
| 173 | OH | ENC | 4788 | 15122 | 32 |
| Total | 10 | 8 | 5296749 | 21273980 | 3274 |
II-B Feature Definitions
In this subsection we define the features (factors) that will be examined, and how each is derived.
II-B1 Local Weather Data
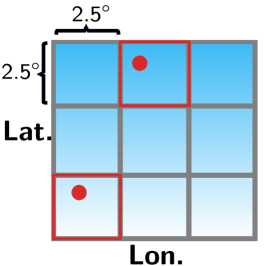
Because health care workers frequently cite skin dryness and irritation as a factor in decreased compliance (particularly in cold weather months where environmental humidity is reduced), we associate daily air temperature and relative humidity to each timestamped record based on each facility’s reported zip code. Spatially assimilated weather values () for the entire globe were obtained from the National Oceanic and Atmospheric Administration (NOAA) [19]. Given in terms of grid elements (a tessilation of bounding boxes covering latitude by longitude), the world is thus defined as a 144 by 73 grid having 10512 distinct grid elements. Weather data are available at a fine level of temporal granularity (on the order of 4 times daily for each grid unit) for the entire period of interest. The geographical assignment of weather data was obtained by first mapping each facility’s numerical zipcode to the zipcode’s centroid (2010 US Census data), given by (latitude,longitude), which was subsequently mapped to the matching NOAA grid element. An example of this assignment can be observed in Figure 1. We associate weather information from the 6am reporting hour with records corresponding to traditional day shifts (7am-6:59pm) and use the 6pm reporting hour for traditional night shifts (7pm-6:59am).
II-B2 Influenza Severity
We conjecture that the local severity of common seasonal diseases, such as influenza, may also affect hand hygiene compliance rates. We define influenza severity as the number of influenza-related deaths relative to all deaths over a specified time interval.
Influenza severity data were obtained from the CDC’s Morbidity and Mortality Weekly Report (MMWR), which also reports data at weekly temporal granularity. Rather than reporting data by CDC region, however, data are provided by reporting city (one of 122 participating cities, mostly large metropolitan areas). We map each facility in our dataset to the closest reporting city in order to associate the appropriate severity value to each record. In other words
where , the Euclidean distance between two entities given in terms of (lat, lon) coordinates. Eight of 19 facilities were located in a reporting city (i.e., dist). The remaining 11 facilities were mapped to a reporting city that was, on average, 66.2 miles away (only 3 of 19 facilities were mapped to a reporting city further than this average, with the largest distance being 142 miles).
II-B3 Temporal Factors
We also conjecture that external factors associated with specific holidays or events may affect hand hygiene compliance rates. Holidays may change staffing rates or affect healthcare worker behaviors in various ways. The number of visitors (affecting door counter rates) may also be greater than during regular weekdays. Holidays such as the 4th of July are often associated with alcohol-related accidents, and may increase health care facility workloads. Such factors may also be observable during weekends.
We define a new variable that reflects whether a given shift occurs on one of the 10 federal holidays (New Year’s Eve, Martin Luther King Day, President’s Day, Memorial Day, the 4th of July, Labor Day, Columbus Day, Veteran’s Day, Thanksgiving or Christmas):
Similarly, in order to ascertain the impact of weekends on compliance, we define a new variable as follows:
A related concept is the presence of new resident physicians, who traditionally start work the first of July. We define a new variable that corresponds with this time period in order to see if the data reveal the presence of a July effect:
II-C Exploring Factors Affecting Hand Hygiene
II-C1 Ridge Regression for Feature Examination
With covariates defined and associated with the collected sensor data, we wish to build a linear hypothesis that (a) accurately estimates hand hygiene and (b) reports the direction and degree of effect of our defined features.
In accomplishing (b) we bear in mind two things:
-
(1)
There may be multi-collinearity among features, which may adversely affect the output.
-
(2)
That (a) and (b) may be at odds with one another; i.e., obtaining good predictions may entail discarding some prediction-inhibiting features for which we would like to obtain effect estimates (in practice, we find that this is not actually the case).
Therefore, we propose an Ridge Regression for Feature Examination method designed to accomplish (a) and (b), while bearing (1) and (2) in mind. This method is given by
| (3) |
where is a design matrix, is the hypothesis, is the target vector consisting of compliance rates in which a particular , is a regularization term, is the -norm, and is a function that reports the p-value of a hypothesis term (this constraint is ensured via sequential backwards elimination [20]). The function can be defined as
| (4) |
where is hypothesis selected from a tree of hypotheses constructed using the method [21]. Effectively, (4) only reduces the dimension, acting as a feature selection method, and having no bearing on the dimension.
There are a few benefits of the above method worth pointing out. First, the hypothesis class is linear and common to both (3) and (4). Two-stage optimization approaches, where the first objective is optimized, taking into account the hypothesis class, before the hypothesis itself is optimized for predictive accuracy (or some other such measure), have been shown to work well [22]. Secondly, such a method is specifically geared toward producing a hypothesis that makes use of features that have an immediate bearing upon the problem, while eliminating interpretability obscuring effects, such as multi-collinearity. Moreover, these desirables are obtained while attempting to produce the most accurate hypothesis: an that elicits feature indicativeness, produces accurate results, and controls for confounding effects is the goal of this two-step optimization procedure.
Ultimately, we conduct our analysis by observing the sign and magnitude of the values in the hypothesis vector in order to determine the factors that influence hand hygiene compliance, and whether such factors affect compliance in a positive or negative manner. We also observe correlation and RMSE values to determine how well our predictive model works, and whether the corresponding results can be trusted. All results and are obtained via -fold cross-validation ().
II-C2 Supporting Methodology
We also use two established/standard techniques – RReliefF feature ranking and marginal effects modeling – that will serve as a point of comparison between our method, and also help inform the discussion of the obtained results111Note that both the LASSO [23] and Elastic Net [24] would have also made appropriate supporting methods..
Feature ranking: First, we propose the use of the RReliefF algorithm [25], a modification of the original Relief algorithm of Kira and Rendell [26]. RReliefF finds a feature ’s weight by randomly selecting a seed instance from design matrix and then using that instance’s nearest neighbors to update the attribute. This description consists of three terms: the probability of observing a different rate of hand hygiene compliance than that of the current value given that of the nearest neighbors, given by
| (5) |
the probability of observing the current attribute value given the nearest neighbors, given by
| (6) |
and the probability of observing a different hand hygiene rate than the current value given a different feature value and the nearest neighbors, given by
| (7) |
Attribute distance weighting is used in order to place greater emphasis on instances that are closer to the seed instance when updating each term; final weights are obtained by applying Bayes’ rule to the three terms maintained for each attribute, which can be expressed
| (8) |
By using this method we could then rank attributes in terms of their importance. We again report rankings using -fold () cross validation.
Marginal Effects Modeling: To provide additional insight into the features that are relevant to hand hygiene we analyzed their marginal effects [27]. Marginal effects, also referred to as instantaneous rates of change, are computed by first training a hypothesis , then, using the testing data, the effect of each covariate can be estimated by holding all others constant and observing the predictions. Such a method can be expressed by
| (9) |
where, with a slight abuse of notation, , the value of instance ’s th feature, is added to the vector , which consists of the average of each non- feature, at the appropriate location (namely, the th position). Here, the notation is used to reinforce the fact that the vector of averages has it’s th element replaced by . Other non- entries are given by , for an arbitrary index position .
III Results
III-A Predictive Power: Ridge Regression
We learned a hypothesis using all available features, including a nominalized facility identifier. Our predictive results can be observed in Table II. We note that the RMSE is not large and the correlation is moderate, implying relatively good predictive performance.
| Measure | Value |
|---|---|
| Correlation | 0.3441 |
| RMSE | 0.1702 |
| Feature | |
|---|---|
| Air Temp | |
| Rel. Humid | |
| = | |
| Flu Severity | |
III-B Examining Hypothesis
We next examine the terms of the learned hypothesis (see Table III). The model includes all 19 facilities, 12 of which had positive values, indicating relatively higher rates of compliance. The size remaining facility’s terms had relatively small negative values, indicating lower rates of compliance. Among other features, holidays are associated with lower compliance rates, while influenza severity has higher compliance. Weekdays are associated with higher compliance rates, as are higher temperatures and humidity. Interestingly, the Ridge Regression model appears to have eliminated some holidays (Martin Luther King day, Memorial day, Labor day, Columbus day, and Thanksgiving), as well as Facility 163 (the facility with the lowest amount of hand-hygiene data). This means that these features do not contribute to hand-hygiene compliance rates in any meaningful way.
III-C RReliefF
By using RReliefF we could rank features in terms of their importance in order to support and supplement the result obtained using Ridge Regression. The results are reported in Table IV, where rankings shown are averages for 10-fold cross-validation. Note that here was represented as a single discretely-valued feature in order to determine the importance of facility as a whole (instead of treating each facility as its own feature), as was .
| Attribute | Avg Val | Avg Rank |
|---|---|---|
| Facility | ||
| Flu Sev | ||
| Air Temp | ||
| Rel. Humid. | ||
III-D Marginal Effects
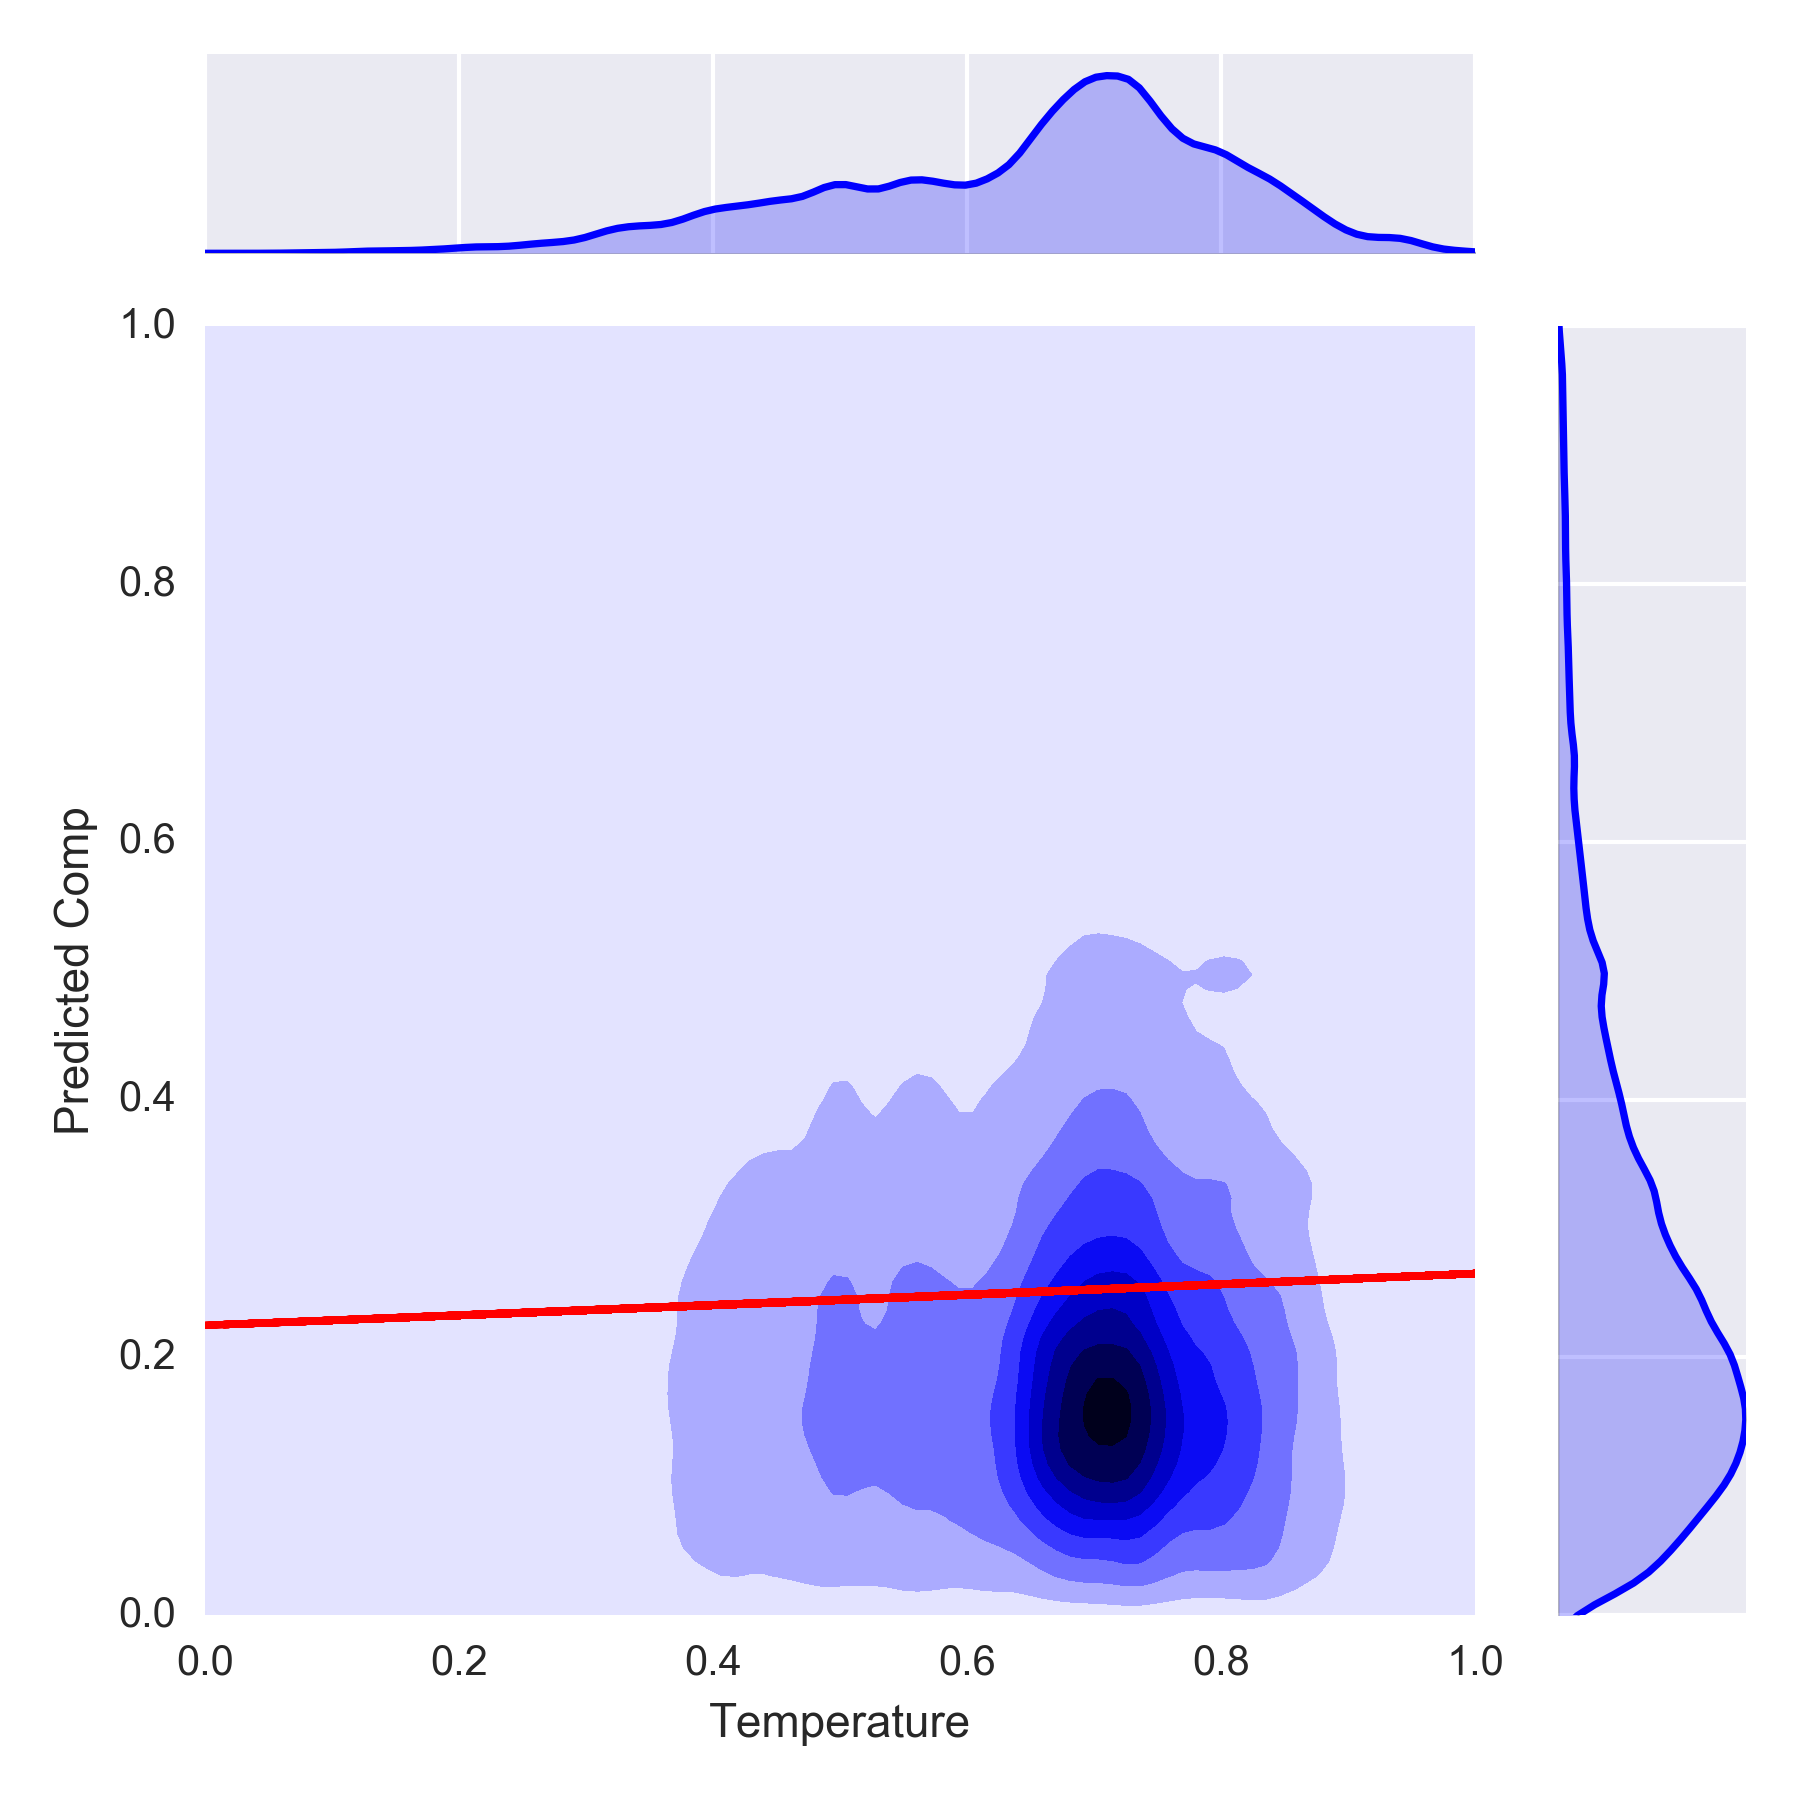
The results obtained from modeling the marginal effects can be observed in Figure 2.
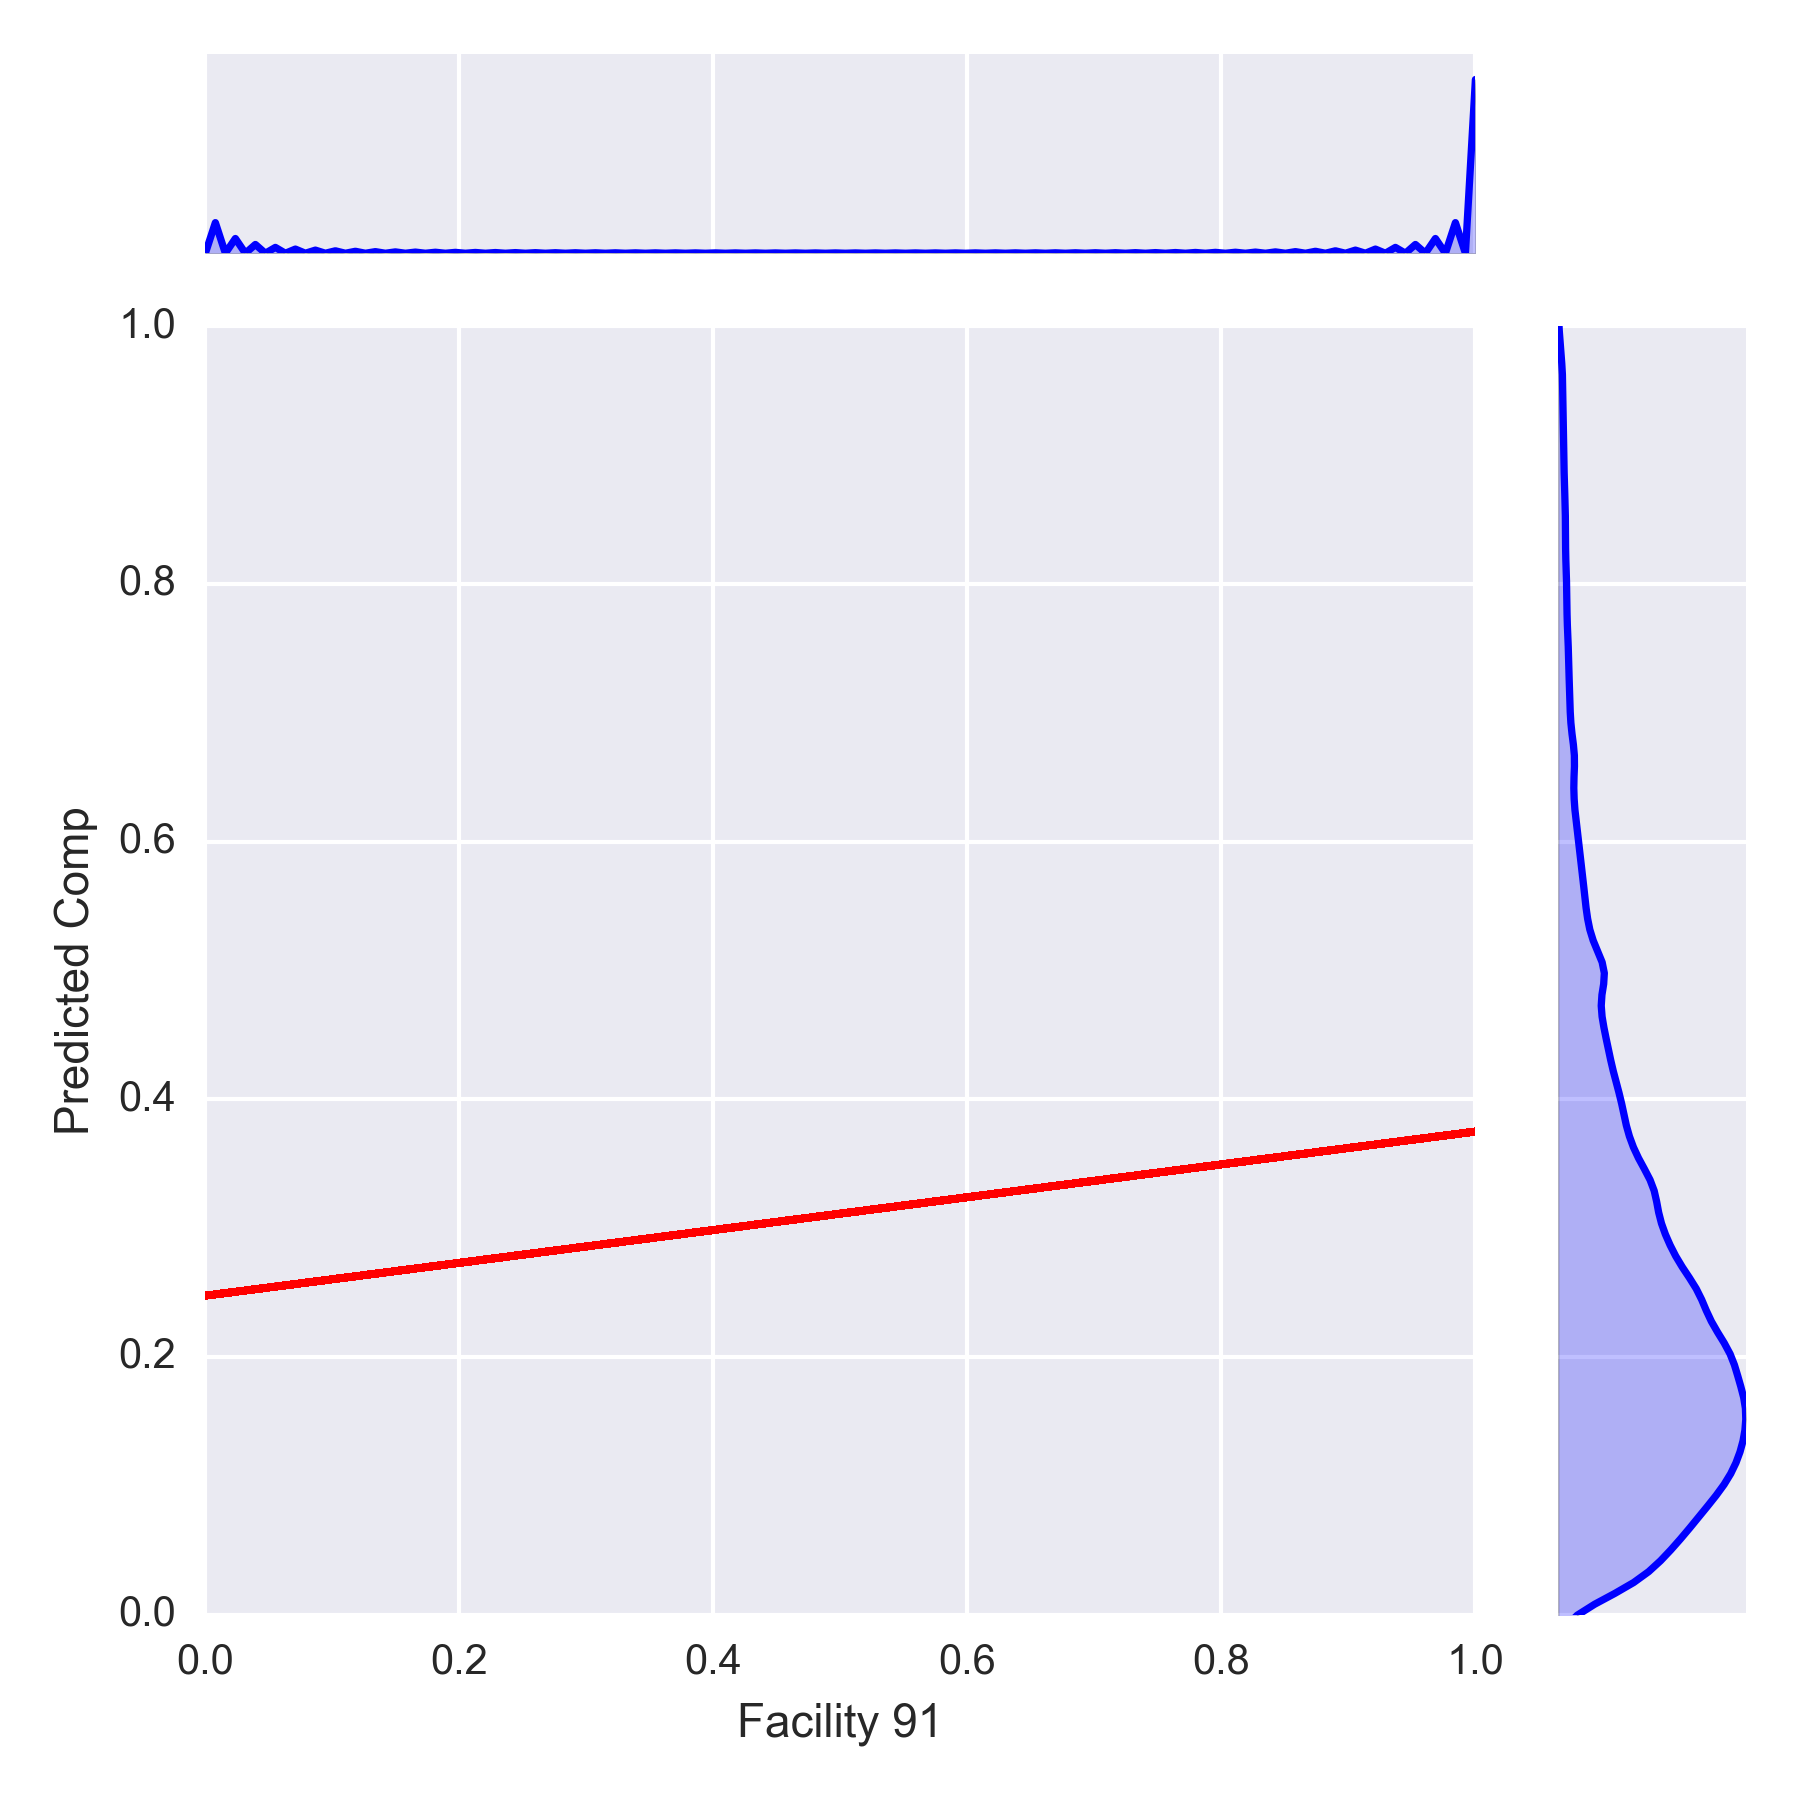
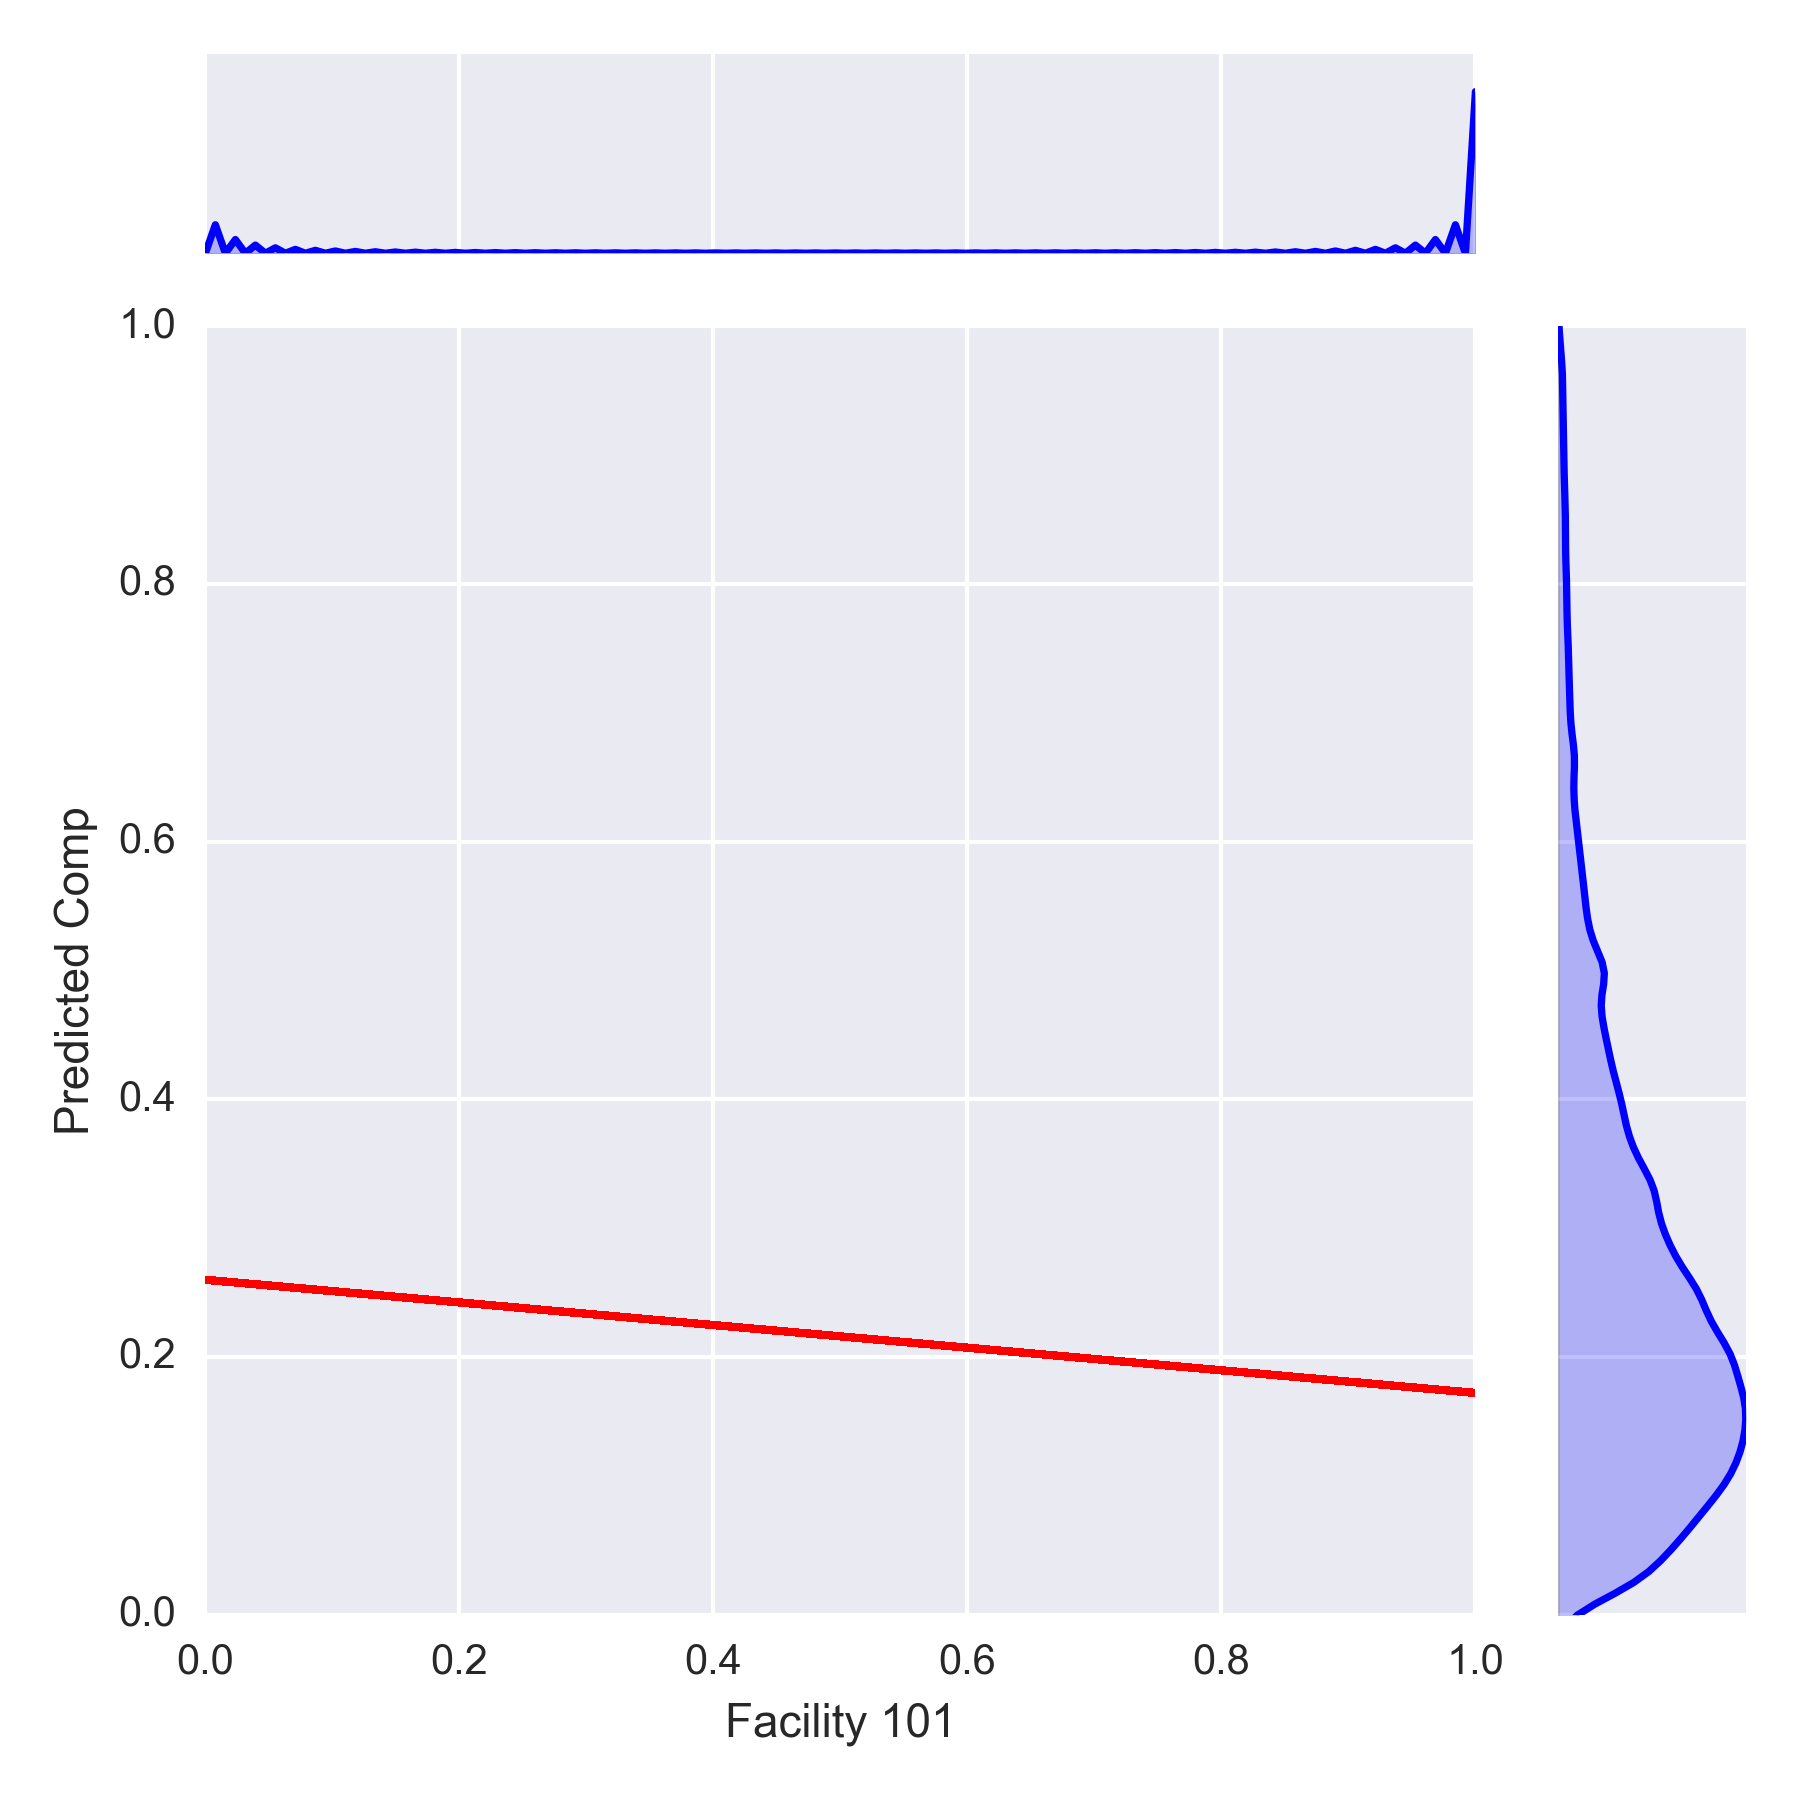
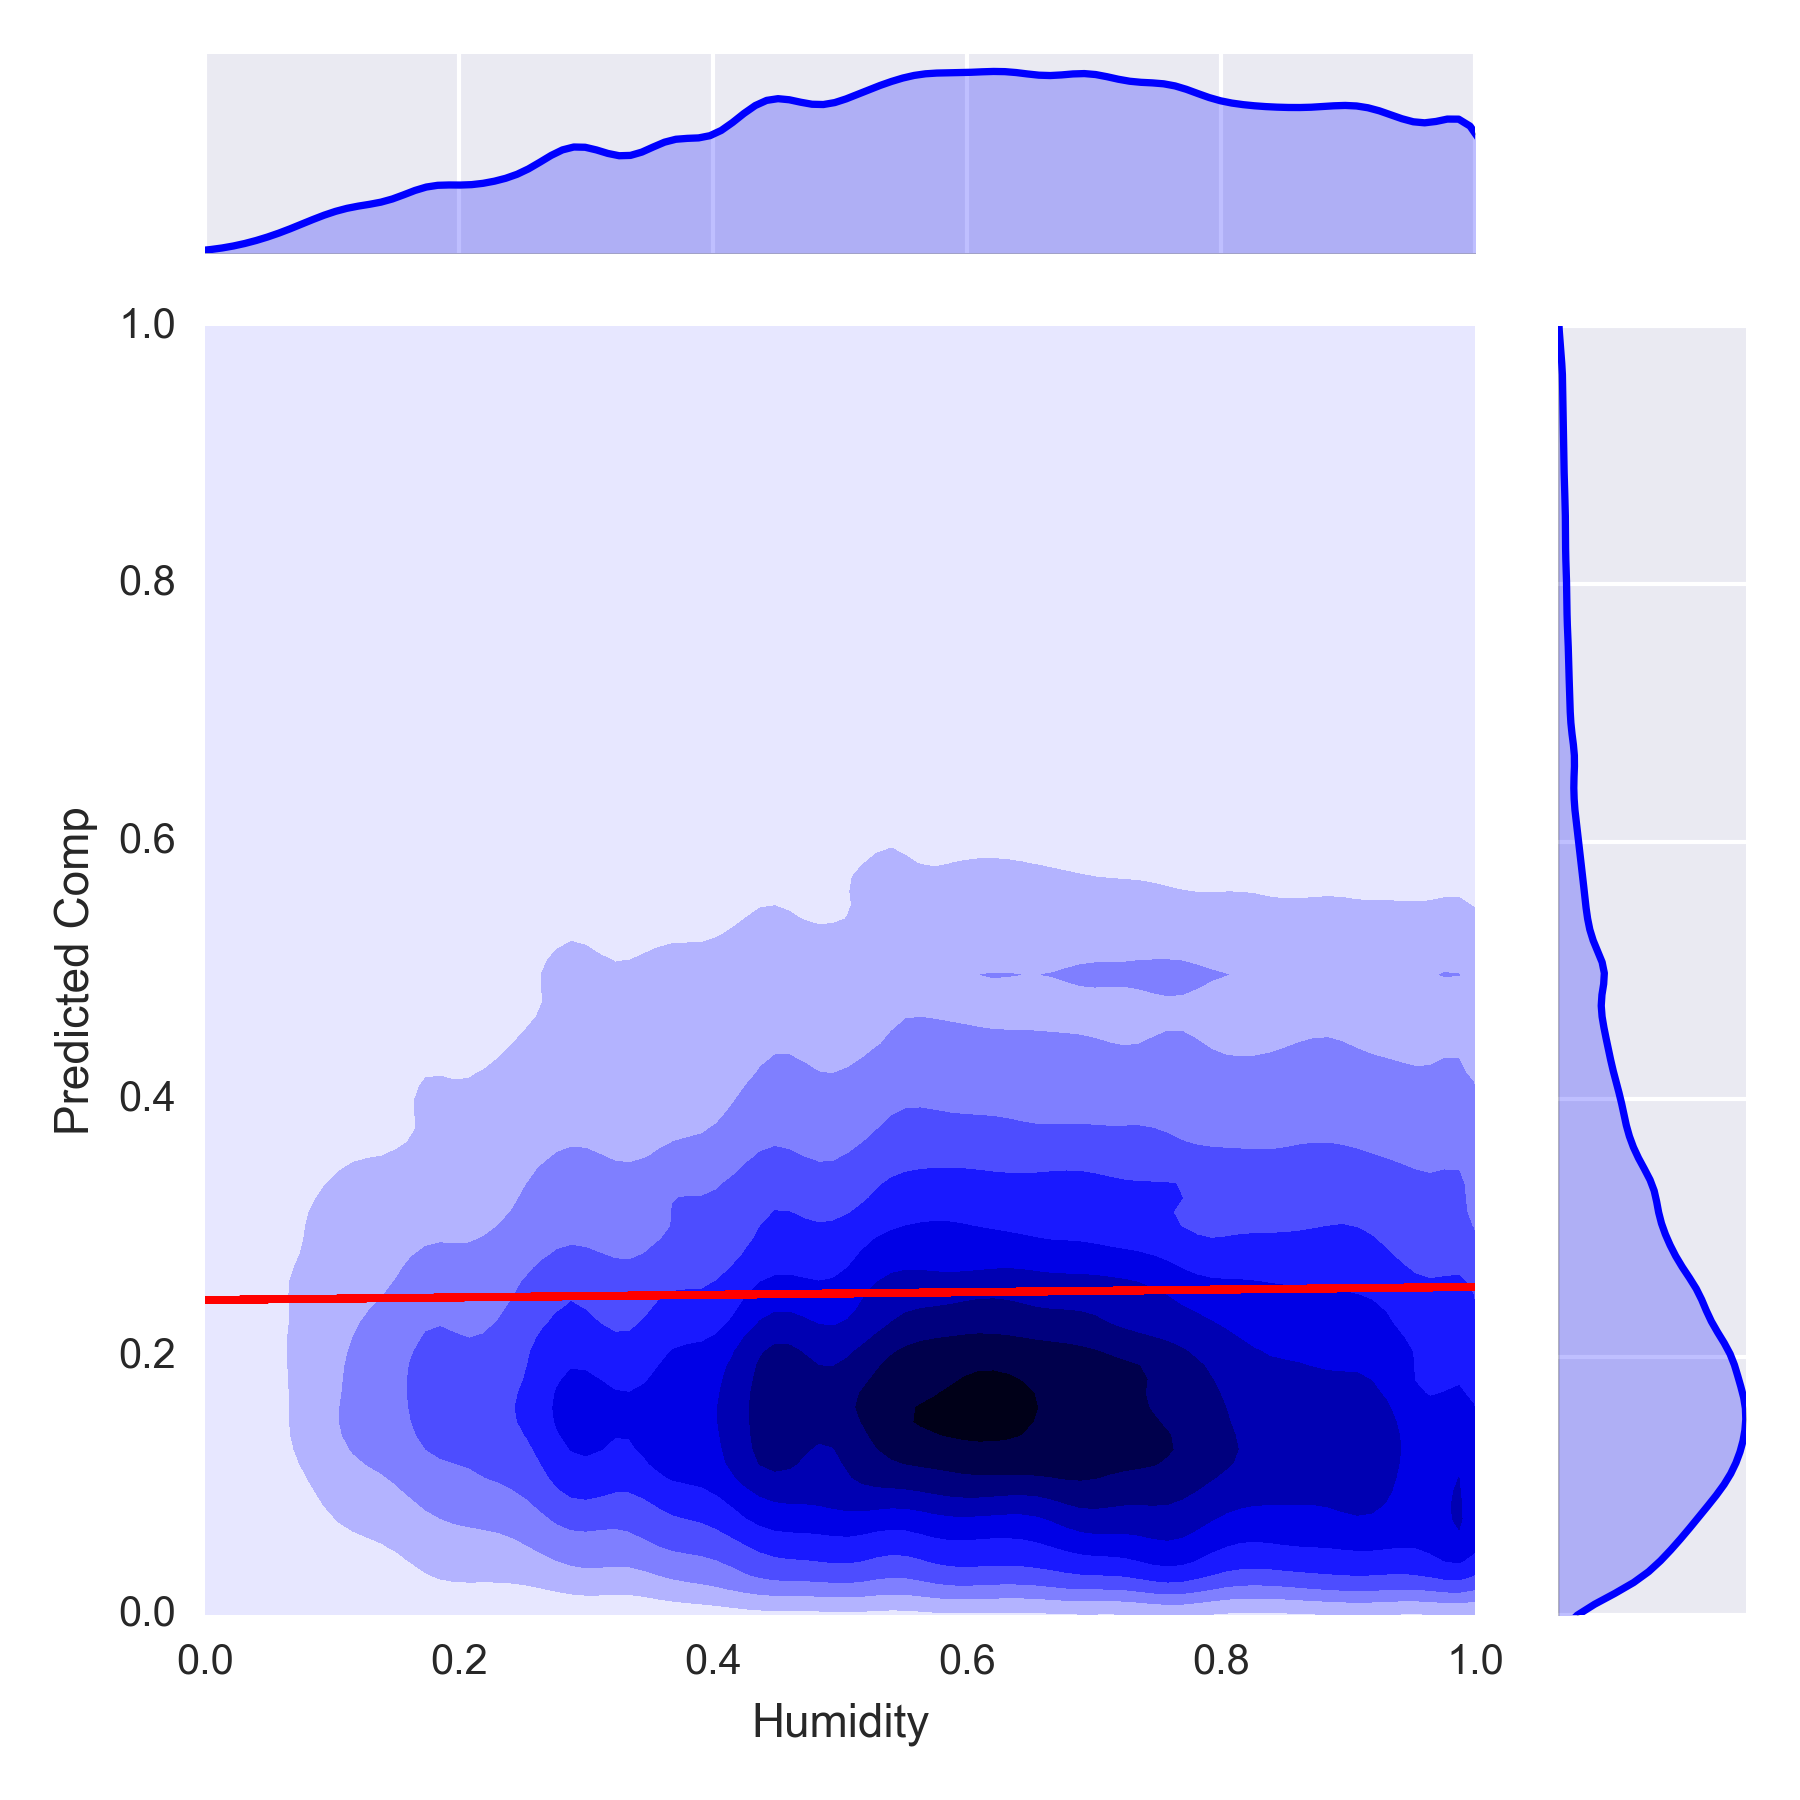
Figures 2(a) and 2(b) show the marginal effects of two randomly selected facilities; one identified as being associated with lower rates of compliance and one identified as having higher rates of compliance (from Table III). Note that, because these are binary features (taking on values of either zero or one), the kernel density of the underlying data is not readily visible (unlike the other figures, which show results for non-binary features). As we can see the marginal effects support the result obtained using both Ridge Regression and RReliefF, and also seem to suggest an even greater association between facilities and rates of compliance than was originally apparent (at least for these two facilities).
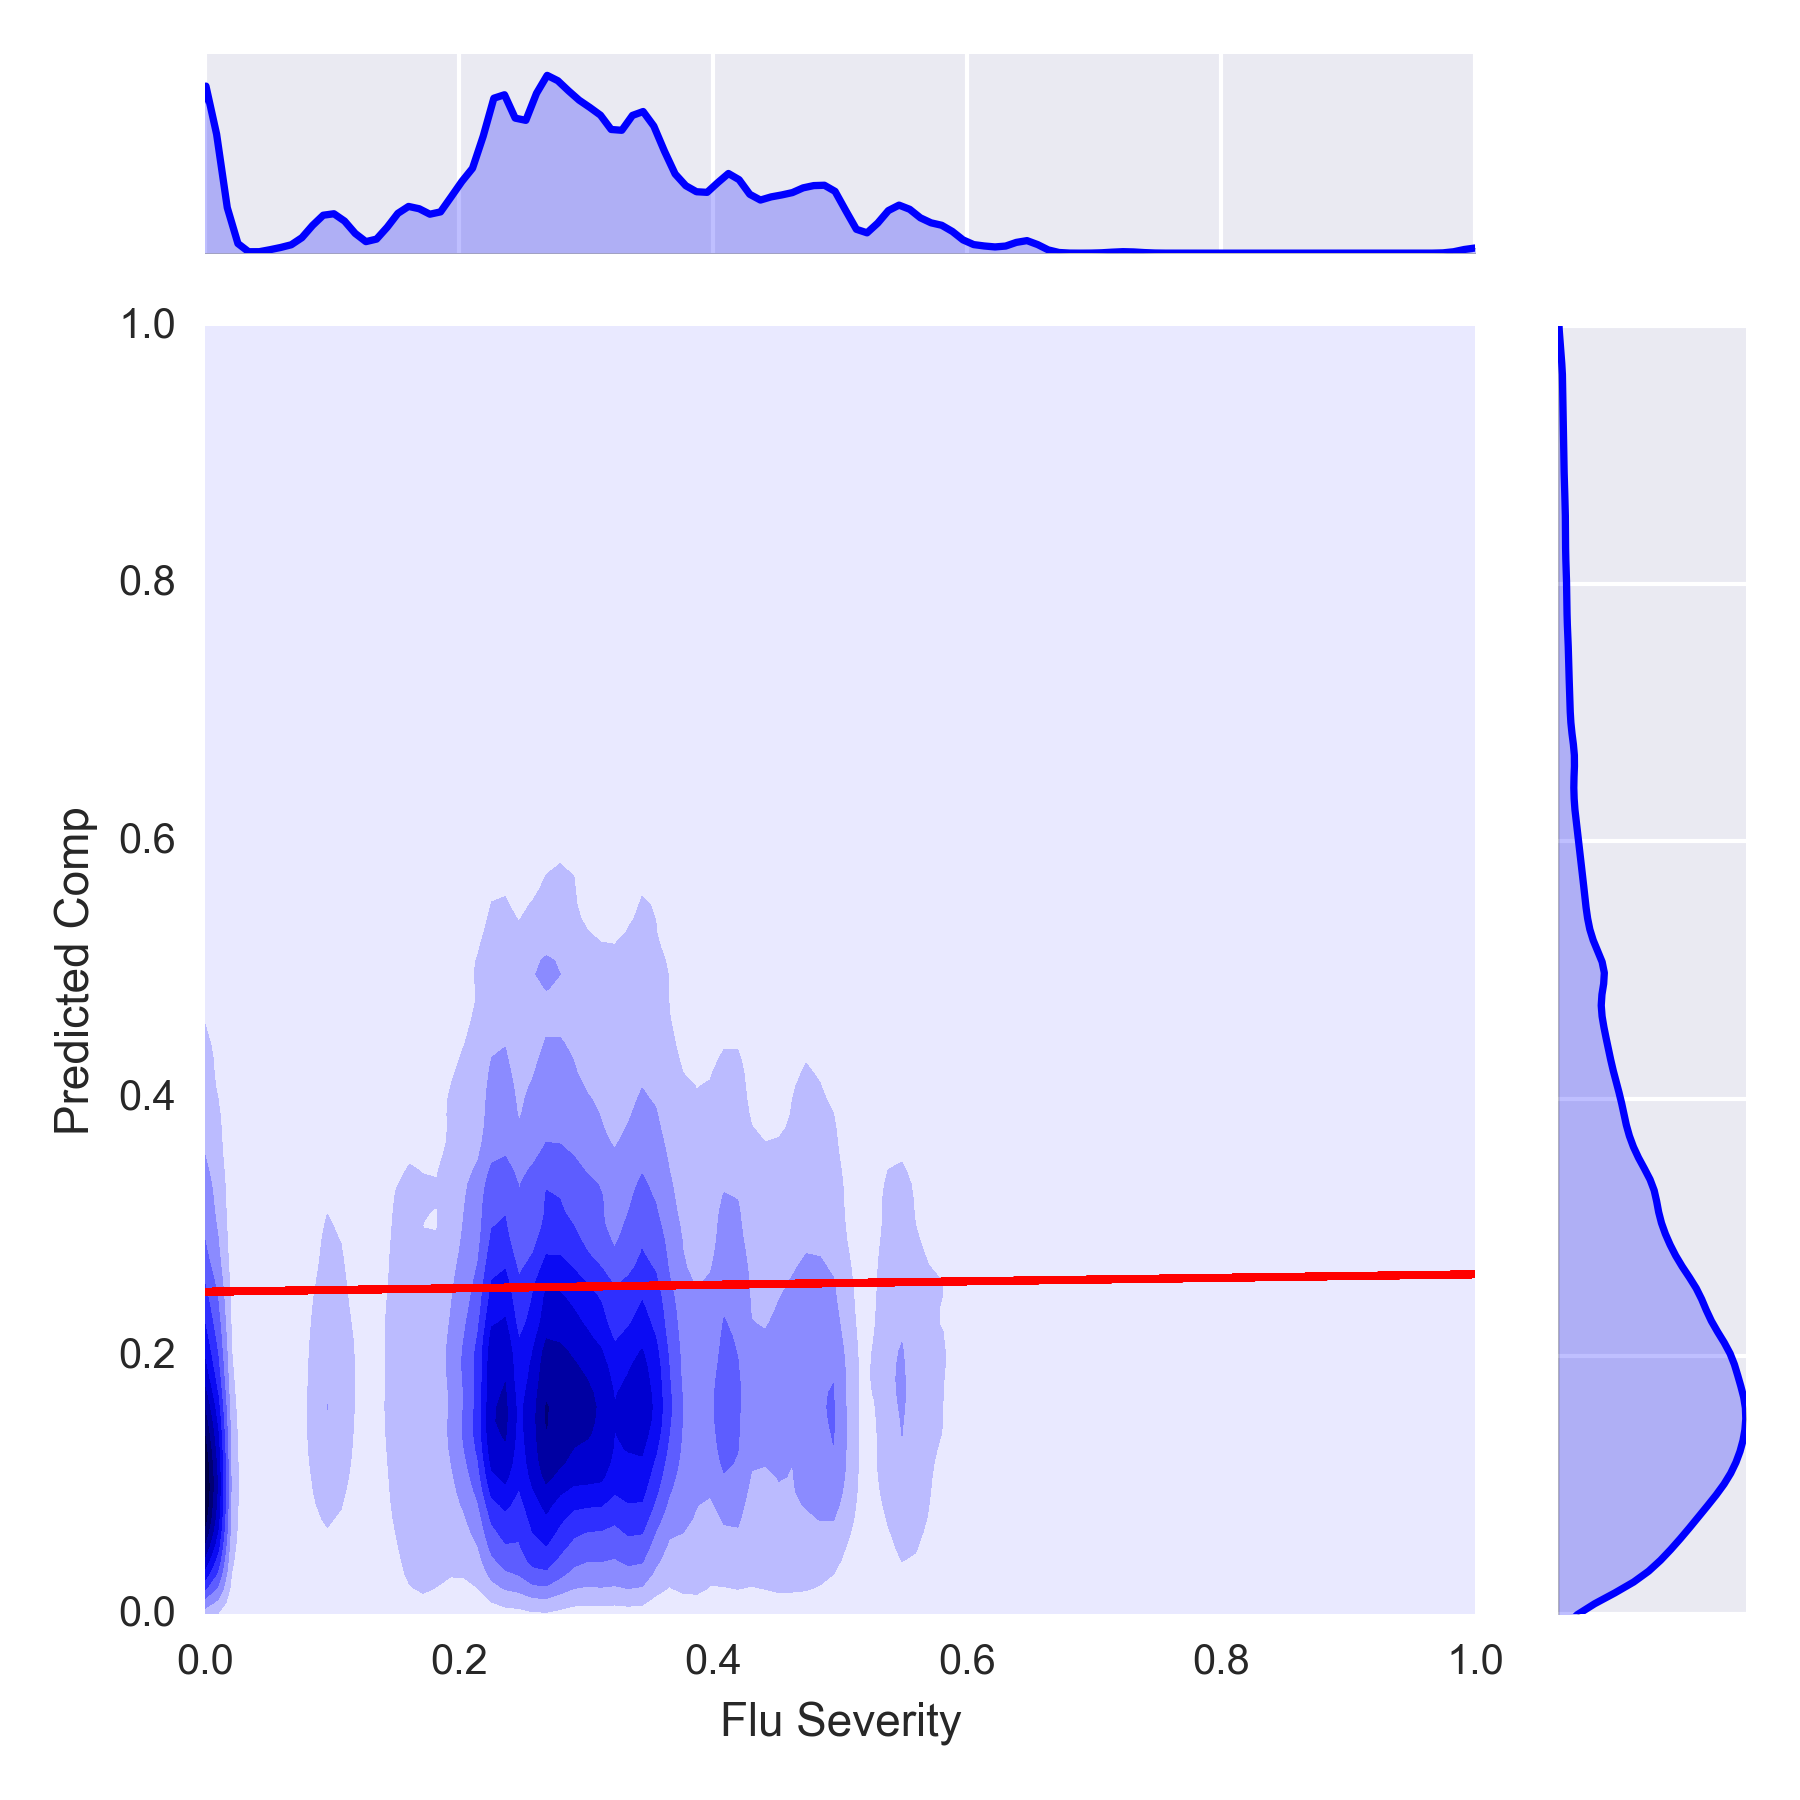
Figure 2(c) shows the marginal effects of flu Severity. The Flu Severity result shows a slightly positive relationship between the severity of flu, measured in terms of mortality, and hand-hygiene compliance rates. This is further supported by the result obtained from Ridge Regression and the RReliefF ranking.
Figures 2(d) and 2(e) show the marginal effects of humidity and temperature. The result obtained for both is consistent with that from Ridge Regression. The lesser effect of humidity and greater effect of temperature are also reflected in the RReliefF ranking.
To further explore the relationship between hand-hygiene and weather effects, we conducted a simple statistical analysis. For each facility, we selected the temperature and humidity values corresponding to the bottom 10% and top 10% of hand-hygiene compliance rates. We then performed a paired t-test on each set of samples; temperature and humidity values were scaled to . The results of this analysis are reported in Table V.
| Facility | State | Temperature | Humidity |
|---|---|---|---|
| (p-val) | (p-val) | ||
| 91 | OH | -0.004 (0.750) | -0.007 (0.489) |
| 101 | OH | 0.001 (0.909) | 0.004 (0.457) |
| 105 | TX | 0.041 () | -0.028 (0.001) |
| 119 | MN | -0.008 (0.699) | -0.013 (0.337) |
| 123 | TX | 0.017 (0.002) | 0.029 () |
| 127 | NM | 0.032 () | -0.063 () |
| 135 | OH | -0.045 (0.010) | 0.017 (0.278) |
| 144 | CA | 0.009 () | -0.018 (0.002) |
| 145 | CA | -0.001 (0.675) | 0.004 (0.549) |
| 147 | CA | 0.011 () | -0.013 (0.017) |
| 149 | CA | -0.007 (0.025) | 0.008 (0.214) |
| 153 | CT | 0.043 () | -0.003 (0.746) |
| 155 | NY | 0.093 () | 0.012 (0.341) |
| 156 | NC | 0.040 (0.007) | -0.041 (0.445) |
| 157 | OH | -0.132 () | -0.020 (0.638) |
| 163 | OH | 0.180 (0.010) | 0.179 (0.021) |
| 168 | PA | 0.012 (0.122) | 0.071 (0.006) |
| 170 | IL | -0.001 (0.772) | -0.007 (0.642) |
| 173 | OH | 0.037 (0.003) | -0.033 (0.440) |
Table V shows that most facilities have statistically significant differences between the two samples and that . Such results indicates that higher temperatures and levels of humidity (particularly temperature) are statistically associated with higher rates of hand hygiene. However, we find that some facilities co-located in the same geographic region have conflicting statistical results (e.g., Facs. 91, 173). We conjecture that such a result may attributable to differences in sensor deployment location, but we leave such an investigation as future work.
III-E Facility-Specific Modeling
The full Ridge Regression models’ reliance on facility identities suggests that compliance relies, at least in part, on facility-specific health care worker attitudes, administrative culture, or even simply the disposition of sensors and the architecture of the facility. Given the magnitude of the coefficients associated with facilities in the previous model, we propose to construct and analyze a facility-specific model.
Here, we selected a facility (facility 91) with both a high rate of compliance and a large number of reported events for further investigation (see Table VI). As expected, the facility-specific model is better at predicting compliance than the full model (Table II), while the correlation is comparable.
| Measure | Value |
|---|---|
| Correlation | 0.3179 |
| RMSE | 0.0381 |
The hypothesis terms associated with this model are shown in Table VII. Unlike the previous model, temperature is negatively associated with compliance, which is somewhat surprising. We also note a larger negative association between compliance and flu severity which, while somewhat harder to explain, may also reflect the narrower geographic scope accounted for by this model. Ultimately, only and humidity positively impact compliance, which is a different result than in our global model. These differences aren’t surprising, however: the original model attempts to capture effects across a broad geographic region, while this model need only capture the associations found in a specific location.
| Feature | |
|---|---|
| Air Temp | |
| Rel. Humid. | |
| Weekday | |
| Day Shift | |
| Flu Sev. |
IV Discussion and Future Work
In this section we discuss the broader implications of our findings, as well as directions for future work.
The full model and marginal effects models, in conjunction with the RReliefF feature ranking, provided several insights. First, we found that facility identities are strongly related to compliance, suggesting that facility-wide attitudes towards hand hygiene exist, persist in time, and are predictive of compliance rates. This observation may also reflect differences in sensor installation, where different facilities may have sensors instrumented in different departments, thus affecting reported rates. Second, increases in influenza severity were associated with an increase in compliance, which is encouraging. Third, our conjecture regarding lower weekend and holiday compliance appears to have some merit, although the holidays associated with negative compliance were somewhat surprising. We again acknowledge that this result may be affected by increased visitors during these times. Fourth, our conjectures that higher humidity and temperature are indicative of higher rates of compliance were confirmed by the full model, marginal effects model, and statistical analysis. This finding is important as health care workers often cite skin irritation or dry skin as reasons for reduced frequency of hand hygiene. Fifth, we found that compliance during the first week of residents’ attendance ran contrary to our original conjecture: the was essentially unobservable. Finally, we found that was associated with slightly lower compliance rates.
Our facility-specific model (constructed for Facility 91) found contradictions with the full hypothesis. We believe that this supports the facility-specific attitudes conjecture and that, moreover, different factors may be at play at different facilities spanning different geographical regions. Further work is needed to tease these differences out, however.
This work has several limitations. First, there are differences among installations: not all doors and dispensers may be instrumented and, therefore, we cannot track, for example, the use of personal alcohol dispensers (we assume stable practices). Thus our compliance estimates may be based on partial information and are certainly not comparable across facilities. Second, our compliance estimates are facility wide, meaning that we do not exploit the co-location of dispensers and door event sensors, but only the temporal correlation of the individual events. Thus, our assumption that each door event corresponds to a hand-hygiene opportunity may be fundamentally flawed, even as it allows for consistent intra-facility comparisons. Third, we acknowledge the possibility of location and sampling bias with regard to both the sensors and facilities. If sensors were to be placed in only the ICU of one facility and in the emergency room of another, we may observe different rates, which has not been accounted for. Additionally, though facilities are distributed across the United States, they are by no means meant to be a representative sample of facility types or climatic conditions.
There are also a number of opportunities for future work. First, we would like to consider alternative definitions of compliance and examine compliance at finer-grained temporal levels, perhaps incorporating time-series analyses as an additional avenue of exploration. We intend to also explore framing the problem as one of classification, rather than only regression, which may help tease out uncertain factors. Finally, data pertaining to compliance rates under certain interventions would give way to exploration of intervention efficacy both in general and using prediction-based methodology, such as inverse classification, to recommend facility-specific intervention policies [28, 29].
Hand hygiene compliance is a simple yet effective method of preventing the transmission of disease, both among the population at large, and within health care facilities. This study presents a first look at factors that underlie health care worker hand-hygiene compliance rates, including weather conditions, holidays and weekends, and infectious disease prevalence and severity, and serves as a model for future studies that will exploit the availability of temporally and spatially rich compliance data collected by the sophisticated sensor systems now being put into practice.
Acknowledgments
The authors would like to thank Gojo Industries for access to the hand-hygiene data and for their financial support of this work, as well as Andrew Arthur for his help in preparing the data.
References
- [1] R. Klevens, J. Edwards, C. Richards, and T. Horan, “Estimating health care-associated infections and deaths in us hospitals,” Public Health, no. 122, pp. 160–166, 2007.
- [2] R. Roberts, R. Scott, B. Hota, L. Kampe, F. Abbasi, S. Schabowski, I. Ahmad, G. Ciavarella, R. Cordell, S. Solomon, R. Hagtvedt, and R. Weinstein, “Costs attributable to healthcare-acquired infection in hospitalized adults and a comparison of economic methods,” Medical Care, vol. 48, no. 11, pp. 1026–1035, November 2010.
- [3] R. Roberts, B. Hota, I. Ahmad, R. Scott, S. Foster, F. Abbasi, S. Schabowski, L. Kampe, G. Ciavarella, M. Supino, J. Naples, R. Cordell, S. Levy, and R. Weinstein, “Hospital and societal costs of antimicrobial-resistant infection in a chiago teaching hospital: implications for antibiotic stewardship,” Clinical Infectious Diseases, vol. 49, no. 8, pp. 1175–1184, October 2009.
- [4] J. M. Boyce and D. Pittet, “Guidelines for hand hygiene in health-care settings: recommendations of the healthcare infection control practices advisory committee and the hicpac/shea/apic/idsa hand hygiene task force,” Infection Control and Hospital Epidemiology, no. 23, pp. S3–S41, 2002.
- [5] B. Allegranzi, H. Sax, L. Bengaly, H. Richet, D. Minta, M. Chraiti, F. Sokona, A. Gayet-Ageron, P. Bonnabry, and D. Pittet, “World health organization ”point g” project management committee. successful implementation of the world health organization hand hygiene improvement strategy in a referral hospital in mali, africa,” Infection Control and Hospital Epidemiology, vol. 31, no. 2, pp. 133–141, February 2010.
- [6] D. Pittet, B. Allegranzi, and J. Boyce, “World health organization world alliance for patient safety first global patient safety challenge core group of experts. the world health organization guidelines on hand hygiene in health care and their consensus recommendations,” Infection Control and Hospital Epidemiology, vol. 30, no. 7, pp. 611–622, July 2009.
- [7] J. P. Hass and L. E. L., “Measurement of compliance with hand hygiene,” Journal of Hospital Infection, no. 66, pp. 6–14, 2007.
- [8] J. Boyce and M. Cooper, T anda Dolan, “Evaluation of an electronic device for real-time measurement of alcohol-based hand rub use,” Infection Control and Hospital Epidemiology, vol. 30, no. 11, pp. 1090–1095, 2009.
- [9] Joint Commission of Accreditation of Healthcare Organizations, “Patient safety goals,” Tech. Rep. [Online]. Available: http://www.jcaho.org/accredited+organizations/patient+safety/npsg.htm
- [10] J. Fries, A. Segre, G. Thomas, T. Herman, K. Ellingson, and P. Polgreen, “Monitoring hand hygiene via human observers: How should we be sampling?” Infection Control and Hospital Epidemiology, vol. 33, no. 7, pp. 689–695, Jul. 2012, [PMID: 22669230].
- [11] D. Sharma, G. Thomas, E. Foster, J. Iacovelli, K. Lea, J. Streit, and P. Polgreen, “The precision of human-generated hand-hygiene observations: a comparison of human observation with an automated monitoring system,” Infection Control and Hospital Epidemiology, vol. 33, no. 12, pp. 1259–1261, December 2012.
- [12] T. Eckmanns, J. Bessert, M. Behnke, and H. Gastmeier, P anda Ruden, “Compliance with antiseptic hand rub use in intensive care units: The hawthorne effect,” Infection Control and Hospital Epidemiology, no. 27, pp. 931–934, 2006.
- [13] M. Monsalve, S. Pemmaraju, G. Thomas, T. Herman, and P. Segre, AM anda Polgreen, “Do peer effects improve hand hygiene adherence among healthcare workers?” Infection Control and Hospital Epidemiology, vol. 35, no. 10, pp. 1277–1285, 2014.
- [14] V. Boscart, K. McGilton, A. Levchenko, G. Hufton, P. Holliday, and G. Fernie, “Acceptability of a wearable hand hygiene device with monitoring capabilities,” Journal of Hospital Infection, vol. 70, no. 3, pp. 216–222, 2008.
- [15] A. Venkatesh, M. Lankford, D. Rooney, T. Blachford, C. Watts, and G. Noskin, “Use of electronic alerts to enhance hand hygiene compliance and decrease transmission of vancomycin-resistant enterococcus in a hematology unit,” vol. 36, no. 3, pp. 199–205, 2008.
- [16] P. M. Polgreen, C. S. Hlady, M. a. Severson, A. M. Segre, and T. Herman, “Method for automated monitoring of hand hygiene adherence without radio-frequency identification.” Infection control and hospital epidemiology : the official journal of the Society of Hospital Epidemiologists of America, vol. 31, no. 12, pp. 1294–1297, 2010.
- [17] H. Dai, K. L. Milkman, D. A. Hofmann, and B. R. Staats, “The Impact of Time at Work and Time Off from Work on Rule Compliance: The Case of Hand Hygiene in Healthcare,” Journal of Applied Psychology, vol. 100, no. 3, pp. 846–862, 2014. [Online]. Available: http://papers.ssrn.com/sol3/papers.cfm?abstract_id=2423009
- [18] C. Jarrin Tejada and G. Bearman, “Hand Hygiene Compliance Monitoring: the State of the Art,” Current Infectious Disease Reports, vol. 17, no. 4, 2015. [Online]. Available: http://link.springer.com/10.1007/s11908-015-0470-0
- [19] E. Kalnay, M. Kanamitsu, R. Kistler, W. Collins, D. Deaven, L. Gandin, S. Iredell, S. Saha, G. White, Y. Zhu, a. Leetmaa, R. Reynolds, M. Chelliah, W. Ebisuzaki, W. Higgins, J. Janowiak, K. Mo, C. Ropelewski, J. Wang, R. Jenne, and D. Joseph, “The NCEP/NCAR 40-Year Reanalysis Project,” pp. 437–471, 1996. [Online]. Available:
- [20] N. R. Draper, H. Smith, and E. Pownell, Applied Regression Analysis. Wiley New York, 1966, vol. 3.
- [21] J. R. Quinlan, “Learning with continuous classes,” in 5th Australian Joint Conference on Artificial Intelligence, vol. 92, 1992, pp. 343–348.
- [22] F. D. Johansson, U. Shalit, and D. Sontag, “Learning representations for counterfactual inference,” in 33rd International Conference on Machine Learning (ICML), 2016.
- [23] R. Tibshirani, “Regression shrinkage and selection via the lasso,” Journal of the Royal Statistical Society. Series B (Methodological), pp. 267–288, 1996.
- [24] H. Zou and T. Hastie, “Regularization and variable selection via the elastic net,” Journal of the Royal Statistical Society: Series B (Statistical Methodology), vol. 67, no. 2, pp. 301–320, 2005.
- [25] M. Robnik-Šikonja and I. Kononenko, “An adaptation of relief for attribute estimation in regression,” in Machine Learning: Proceedings of the Fourteenth International Conference (ICML97), 1997, pp. 296–304.
- [26] K. Kira and L. A. Rendell, “A practical approach to feature selection,” in Proceedings of the ninth international workshop on Machine learning, 1992, pp. 249–256.
- [27] R. Williams et al., “Using the margins command to estimate and interpret adjusted predictions and marginal effects,” The Stata Journal, vol. 12, no. 2, p. 308, 2012.
- [28] M. T. Lash, Q. Lin, W. N. Street, J. G. Robinson, and J. Ohlmann, “Generalized inverse classification,” in Proceedings of the 2017 SIAM International Conference on Data Mining (SDM’17).
- [29] M. T. Lash and W. N. Street, “Realistic risk-mitigating recommendations via inverse classification,” arXiv preprint; arxiv:1611.04199, 2016. [Online]. Available: https://arxiv.org/abs/1611.04199