Determination of the strong coupling at NNLO from jet production in DIS
Abstract:
A first determination of the strong coupling in next-to-next-to-leading order (NNLO) from inclusive jet and dijet production cross sections in deep-inelastic scattering at HERA is presented. Data collected by the H1 experiment in the years 1995 to 2007 covering the range of momentum transfer and jet transverse momenta are explored. The strong coupling is determined in a fit to inclusive jet and dijet data to . Further studies on the phenomenological application of the new NNLO calculations and on fits to the individual data sets are presented. The running of the strong coupling is probed in a single experiment over one order of magnitude in the remormalisation scale and consistency with the QCD expectations is found.
1 Introduction
The strong coupling constant is one of the least known parameters of the Standard Model (SM) and a precise knowledge is of crucial importance for precision physics and searches for physics beyond the SM at the LHC. Cross sections for jet production in deep-inelastic electron-proton scattering (DIS) are directly sensitive to the strong coupling constant already in leading order in perturbative QCD (pQCD) as these measurements are performed in the Breit frame of reference. The cross section calculations are performed in next-to-next-to-leading order (NNLO) accuracy, where the cross section predictions are obtained with the program NNLO JET [1, 2].
2 Methodology
Cross sections for jet production in collisions have been measured by the H1 experiment at HERA at different center-of-mass energies and for different kinematic regions. Here, jet and dijet cross sections taken during the years 1995 to 2007 [3, 4, 5, 7, 6] are considered. Consistent to all data sets, jets are defined using the jet-algorithm with a parameter of , and jets are required to be contained in the pseudorapidity range defined in the laboratory frame. For the selected data, inclusive jet cross sections have been measured double-differentially as a function of the photon virtuality and jet transverse momentum , and dijet cross sections as a function of and the average transverse momentum of the two hardest jets, . A brief summary of the employed measurements and the kinematic range of the observables is given in table 1.
| Data set | int. | DIS kinematic | Inclusive jets | Dijets | |
|---|---|---|---|---|---|
| [Ref.] | range | ||||
| [3] | 300 | 33 | |||
| HERA-I [4] | 319 | 43.5 | |||
| HERA-I [5] | 319 | 65.4 | |||
| HERA-II [6] | 319 | 290 | |||
| HERA-II [6, 7] | 319 | 351 |
The data sets are separated into different data taking periods and two -regions, where the scattered lepton is identified in different experimental devices. In case of the dijet cross sections, regions of the phase space exhibiting an infrared sensitivity due to ‘back-to-back’ topologies are avoided by imposing asymmetric cuts on the transverse momenta of the two leading jets.
The predictions are calculated as a convolution of parton density functions (PDFs) and a partonic cross section. Both these components exhibit a dependence on and their impact on the results are assessed below. The partonic cross section has its -dependence explicit as it is calculated in terms of a perturbative expansion in orders of . The -dependence of the PDFs is given by the factorisation theorem and where it originates from the QCD splitting kernels and the -functions. Once a PDF is determined for a given value of it can be translated to any other value of by an integration step. This translation defines the -dependence of the PDF. An equivalent solution to this explicit integration is obtained by evaluating the PDFs at a suitable value of , which depends on , thus taking full benefit of the factorisation theorem [8]. The PDF parameterisation is based on the NNPDF3.0 PDF set [9], which was determined for a value of . Multiplicative correction factors are applied in order to account for non-perturbative hadronisation effects. The renormalisation and factorisation scales are chosen to be , where denotes in case of inclusive jet and for dijet cross sections.
The value of the strong coupling constant is determined in a fit of these NNLO calculations to the H1 jet data, where the -dependencies in the predictions, both in the partonic cross sections and in the PDF, are taken into account. The NNLO coefficients are stored in the fastNLO format [10] in order to allow for a repeated calculation with different values of and different PDF sets. The fit -definition accounts for experimental, hadronisation and PDF uncertainties. Correlations of systematic uncertainties and statistical correlations of the data are considered. The uncertainties on the resulting value of due to experimental and theoretical sources are estimated. The PDF and hadronisation uncertainties are obtained by repeating the fit with these uncertainties excluded in the fit and comparing the resulting fit uncertainty. The scale uncertainty is estimated by repeating the fit with scale factors of 0.5 and 2. The ‘PDFSet’ uncertainty is obtained as half of the maximum difference of the results from fits using alternatively the ABMP, CT14, HERAPDF2.0, MMHT or NNPDF3.0 PDF set, and the ‘PDF’ uncertainty is estimated as half of the difference of the results obtained from fits using PDFs which were determined with -values differing by 0.004.
3 Results
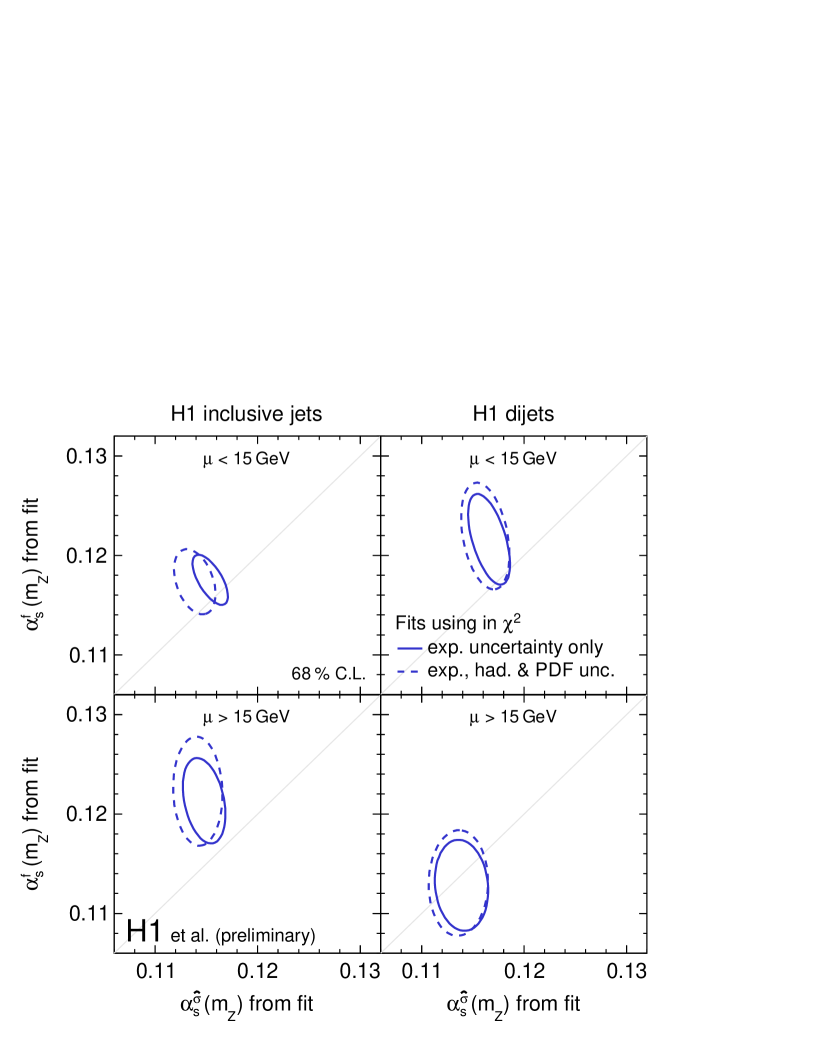
The sensitivity of the data to is studied in fits with two free parameters representing the two contributions to the calculation, assuming those can be chosen independently, i.e. one parameter for the PDFs, , and another parameter for the hard coefficients, . The fits are performed using inclusive jet or dijet cross section measurements, with data points below or above the renormalisation value of 15 . The contours displaying the 68 % confidence level of the fitted results are displayed in figure 2. The two values determined in the fit are consistent, while the sensitivity to of the hard coefficients outperforms the one of the PDF. The two fit parameters are negatively correlated, resulting in an increased sensitivity for fits using a common .
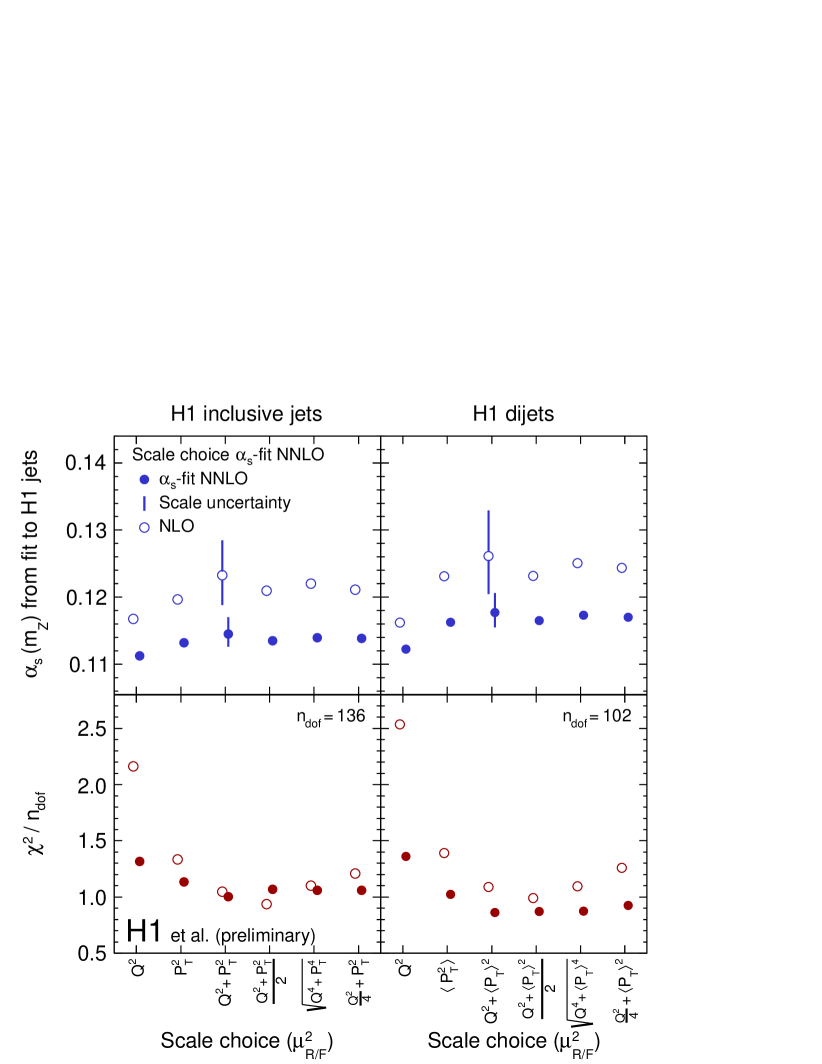
Fits are also performed employing alternative definitions for the renormalisation and factorisation scales. The resulting -values and related values of / for the individual fits are displayed in figure 2 for fits to inclusive jet and to dijet cross sections. The results obtained with alternative scale choices are typically covered by the scale uncertainty. Choosing is disfavored, presumably because this scale is not sufficiently related to the dynamics of jet production. For comparison the fits are also repeated with hard coefficients calculated in NLO accuracy only. These calculations typically yield higher values of / of the fits and the scale choice has a higher impact on the NLO results. These observations emphasize the improved perturbative convergence of the NNLO calculations as compared to NLO accuracy.
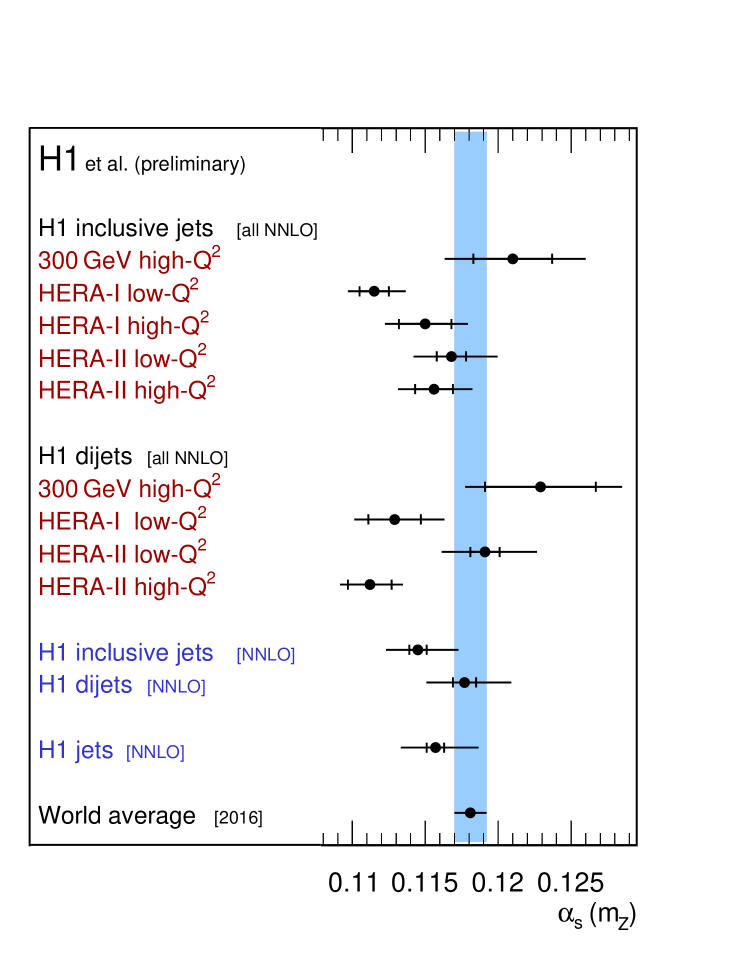
The values for obtained from fits to the individual data sets are displayed in figure 4 and compared to the world average value of [11]. The results obtained when using only inclusive jet data or only dijet data are also shown. An overall reasonable consistency between the results from the individual data sets is found.
A fit to all H1 jet cross section data (denoted ‘H1 jets’), where however the HERA-I dijet cross sections are excluded from the fit because their statistical correlations to the inclusive jets are not precisely known, yields a value of for 203 data points and the value of the strong coupling constant is determined to
This is consistent with the world average and with fits of the individual data sets.
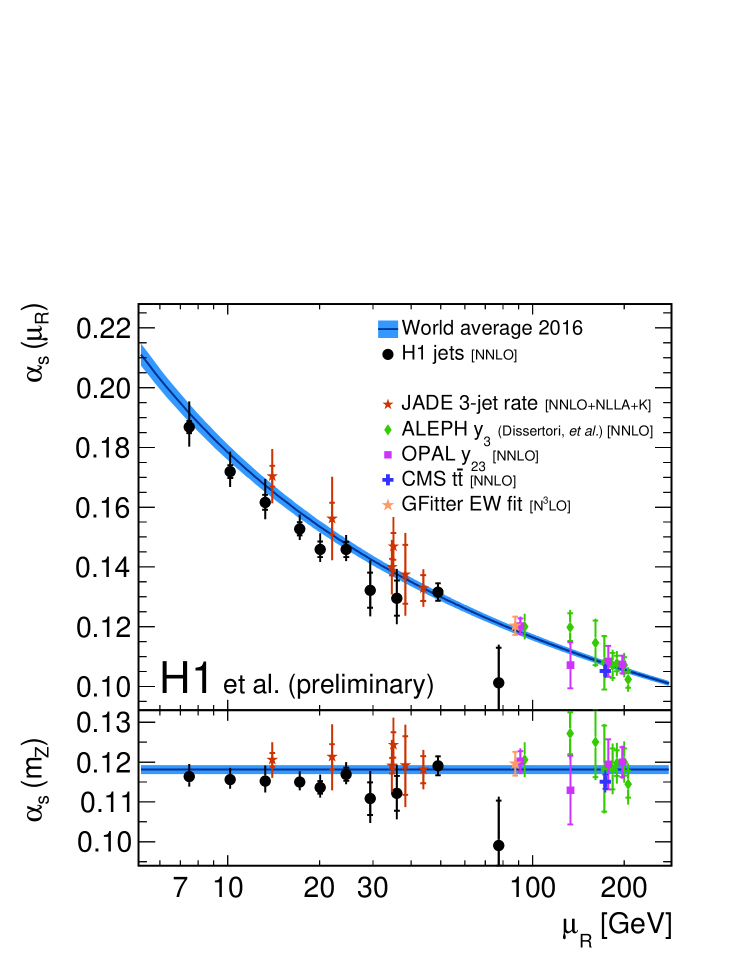
The running of the strong coupling constant as a function of the renormalisation scale , is studied by repeating the fit for groups of data points with comparable values of . The resulting values of and are displayed at a representative value for the given range in figure 4. The results confirm the expectations from the QCD renormalisation group equation within the accessible range in of approximately 7 to 90 . The -values are also compared to -determinations at NNLO in other reactions at similar scales and consistency is found.
4 Summary and conclusion
The strong coupling constant is determined in a fit of new next-to-next-to-leading order (NNLO) QCD predictions to inclusive jet and dijet cross section measurements by the H1 experiment as [8], which is in consistency with the world average value. The running of the strong coupling constant is probed over one order of magnitude and consistency with the QCD expectation is found. The NNLO calculations reduce significantly the dominating theoretical uncertainty in comparison to previously available NLO calculations. The experimental uncertainty is reduced by considering the entire set of inclusive jet and dijet cross section measurements by the H1 experiment.
References
- [1] J. Currie, T. Gehrmann, and J. Niehues, Phys. Rev. Lett. 117 (2016) 042001, arXiv:1606.03991.
- [2] J. Currie, T. Gehrmann, A. Huss, and J. Niehues, arXiv:1703.05977.
- [3] H1 Collaboration, C. Adloff et al., Eur. Phys. J. C19 (2001) 289, arXiv:hep-ex/0010054.
- [4] H1 Collaboration, F. D. Aaron et al., Eur. Phys. J. C67 (2010) 1, arXiv:0911.5678.
- [5] H1 Collaboration, A. Aktas et al., Phys. Lett. B653 (2007) 134, arXiv:0706.3722.
- [6] H1 Collaboration, V. Andreev et al., arXiv:1611.03421.
- [7] H1 Collaboration, V. Andreev et al., Eur. Phys. J. C75 (2015) 65, arXiv:1406.4709.
-
[8]
H1 Collaboration and V. Bertone et al., H1 preliminary report,
H1prelim-17-031
(2017),
available at: https://www-h1.desy.de/publications/H1preliminary.short_list.html. - [9] NNPDF Collaboration, R. D. Ball et al., JHEP 04 (2015) 040, arXiv:1410.8849.
- [10] D. Britzger et al., Conf. Proc. C12-03-26.1 (2012) 217, arXiv:1208.3641.
- [11] Particle Data Group Collaboration, C. Patrignani et al., Chin. Phys. C40 (2016) 100001.