A broadband self-consistent modelling of the X-ray spectrum of 4U 1626–67
Abstract
The accretion-powered X-ray pulsar 4U 1626–67 is one of the few highly magnetized pulsars that accretes through Roche-lobe overflow from a low-mass companion. The characteristics of its broadband spectrum are similar to those of X-ray pulsars hosted in a high-mass X-ray binary systems, with a broad resonant cyclotron scattering feature (CRSF) at 37 keV. In this work, we examine the pulse-resolved and the pulse-averaged broadband spectrum using data from NuSTAR and Swift. We use the Becker & Wolff model of bulk+thermal Comptonization to infer key physical parameters of the accretion column flow and a broadband model for the disk reflected spectrum. In the softer X-ray band, we need to add a soft black-body component with 0.5 keV, whose characteristics indicate a possible origin from the neutron star surface. Residuals suggest that the shape of the cyclotron line could be more satisfactorily fitted using a narrow core and broader wings and, at higher energies, a second harmonic could be present at 61 keV.
keywords:
line: identification – line: formation – stars: individual (4U 1626–67) — X-rays: binaries — X-rays: general1 Introduction
The X-ray pulsar 4U 1626–67 is hosted in a very tight binary system with 43 min orbital period (Middleditch et al., 1981) and spins with a period of 7.7 s (Rappaport et al., 1977). Since its discovery, it appears as a persistent X-ray source. Its mass function is one of the smallest known ( 1.3 10-6 M⊙), thus requiring a very low-mass companion. Chakrabarty (1998) estimated the most likely values for the companion’s star mass, source distance and inclination angle being 0.08 M⊙, 3 kpc and deg, respectively. However, the same authors found a larger distance ( = 9 4 kpc) assuming that the observed optical flux is produced by the accretion disk and that the X-ray albedo is 0.9. This distance range was also indicated by Takagi et al. (2016) by using the Ghosh & Lamb model to the spin-up/down history of 4U 1626–67.
The X-ray spectrum can be well described with a combination of a soft (temperature less than 1 keV) thermal component and a hard power-law component with a high-energy cut-off, typically observed at 20 keV. Over-imposed to this continuum the spectrum shows a complex of soft X-ray emission lines from a photo-ionized plasma at energies close to 1 keV, a moderately broad iron fluorescence emission line, and a broader absorption feature at 37 keV that has been interpreted as a cyclotron resonant scattering feature (Orlandini et al., 1998). Cyclotron lines are key diagnostic tools to directly infer the strength of the magnetic field in the close neighborhood of the neutron star (NS) surface. These features are produced as an effect of resonant scattering of photons in an electron plasma, where electrons energies are quantized according to the Landau levels. Iwakiri et al. (2012) claimed in phase-resolved spectra of 4U 1626–67 that at the phase of the pulsed minimum the cyclotron feature could be detected in emission rather than in absorption.
Since the discovery of its pulsed emission, the spin evolution of 4U 1626–67 has been regularly monitored. Episodes of torque reversal were observed, with the latest one occurred at the begin of 2008 from a spin-down to a spin-up state (Jain et al., 2010; Beri et al., 2014). The broadband spectral change before and after the latest torque reversal was studied by Camero-Arranz et al. (2012) using two Suzaku observations. They show that the complex of the softer emission lines, mostly dominated by the hydrogen-like Ne Ly line, increased dramatically after the torque reversal, the softer black-body emission temperature increased from 0.2 to 0.5 keV, while the spectral parameters characterizing the harder component and the cyclotron feature remained consistent.
In this work, we report on the broadband spectral study of the source exploiting the high energy resolution of the Nuclear Spectroscopic Telescope Array (NuSTAR; Harrison et al., 2013) observatory, coupled with the softer and harder X-ray coverage offered by the Swift/X-Ray Telescope (XRT; Burrows et al., 2005) and Swift/Burst Alert Telescope (BAT; Barthelmy et al., 2005). We are able to self-consistently model the 0.5–150 keV spectrum using a physical model and we find evidence for the presence of a second harmonic of the CRSF at 61 keV.
2 OBSERVATIONS AND DATA REDUCTION
2.1 NuSTAR data reduction
NuSTAR observed 4U 1626–67 from 2015 May 4 12:26:07 UT to May 5 20:41:07 UT (ObsID 30101029002), for a total collecting time of 65.2 ks. NuSTAR comprises two similar Focal Plane Modules (FPMA and FPMB) which collect photons in the 3–79 keV energy band. We extracted high-level scientific products using nupipeline v.0.4.5 (part of the heasoft software v. 6.19), adopting default filtering and screening criteria. Source events were extracted using a circular region of 100 arcsec radius centred at the source coordinates (RA = 16:32:16.79, Dec. = -67:27:39.3). A region with the same area, but outside the source point-spread function wings, where no other point-like contaminating sources were present, was used to extract background events. The background-subtracted averaged count rates in the two modules were 15.7 and 14.2 counts s-1 for FPMA and FPMB, respectively.
The NuSTAR light curve from 4U 1626–67 shows moderate variability, whose main characteristic is the presence of an irregular pattern of small flares. Such flares last tens of seconds, repeat every 100-1000 seconds, reach a peak luminosity which is 2–3 times the persistent one, and can sometimes show complex substructures (Kii et al., 1986). To assess the degree of spectral variability during these episodes, we selected two energy-filtered light curves (3.0–6.4 keV and 6.4–12.0 keV, for the soft and hard bands, respectively) and derived the corresponding hardness ratio (HR). The overall level of spectral variability is negligible as it is shown in Fig. 1. We note a marginal softening of the spectrum only during the peaks of the flaring episodes, whereas for the remaining part of the observation the HR variations are not significant (see also Kii et al., 1986). Because the total duration of the flaring peaks is only a small fraction of the overall observing time, we considered the time-averaged spectral shape of the source only marginally affected by these flares and proceeded on to the study the time-averaged spectrum.

2.2 Swift data reduction
Swift/XRT (XRT, hereafter) observed 4U 1626–67 multiple times during its operational life-time. To provide a better constraint of the softer (below 3 keV) X-ray emission for our broadband analysis, we selected the XRT observation with identification number (ObsID) 00031156002 performed on 2014 March 05, which is the temporarily closest observation to the NuSTAR one. XRT operated in Window Timing mode, and we extracted spectra and light curves using a 20 pixel extraction strip centred on the source position along the collapsed row. Background products were extracted from a region away from source. The net exposure for this observation amounts to 4579 s and the background-subtracted count rate is 12.5 count s-1 in the 0.3–10 keV range. Pile-up is not an issue for WT spectra at this rate.
We then used the Swift/BAT (BAT, hereafter) survey data on 4U 1626–67 collected between 2004 December and 2015 November. Data were processed with the batimager (Segreto et al., 2010), a software built for the analysis of data from coded mask instruments that performs screening, mosaicking and source detection and produces scientific products of any revealed source.
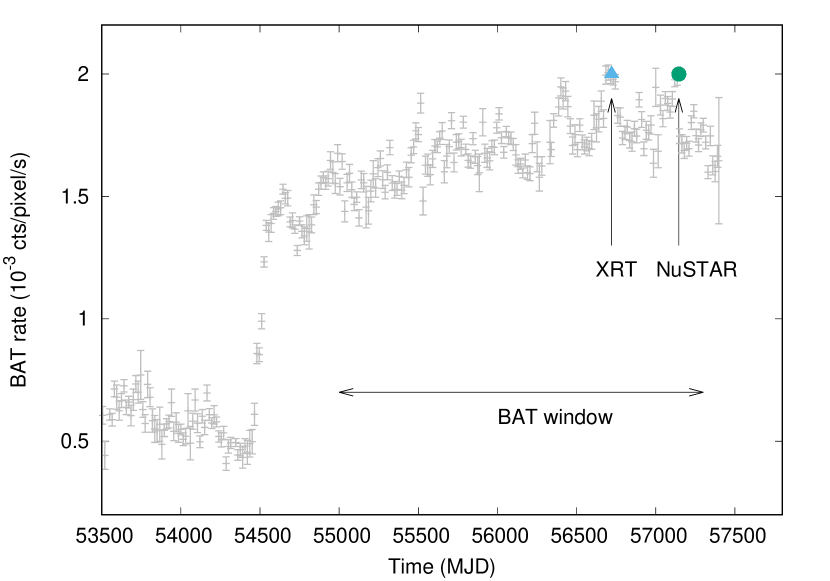
We show in Fig. 2 the BAT 15–80 keV long-term light curve of 4U 1626–67 with over-imposed the dates of the XRT and NuSTAR observations. The steep increase in the observed rate around MJD 54500 is coincident with the time of the torque-reversal. After that, the long-term rate appears to be steadily increasing, being at the epoch of the NuSTAR observation a factor 3 higher with respect to the pre-reversal rate.
We used xspec v. 12.9.0 for spectral analysis. Spectra are re-binned to a minimum of 20 counts per energy channel to allow use of statistics. Errors on spectral parameters are given at 90 % confidence level ( = 2.706) unless otherwise stated. Luminosities are given assuming isotropic emission and a distance of 9 kpc.
3 SPECTRAL ANALYSIS
3.1 Spectral analysis of the single datasets
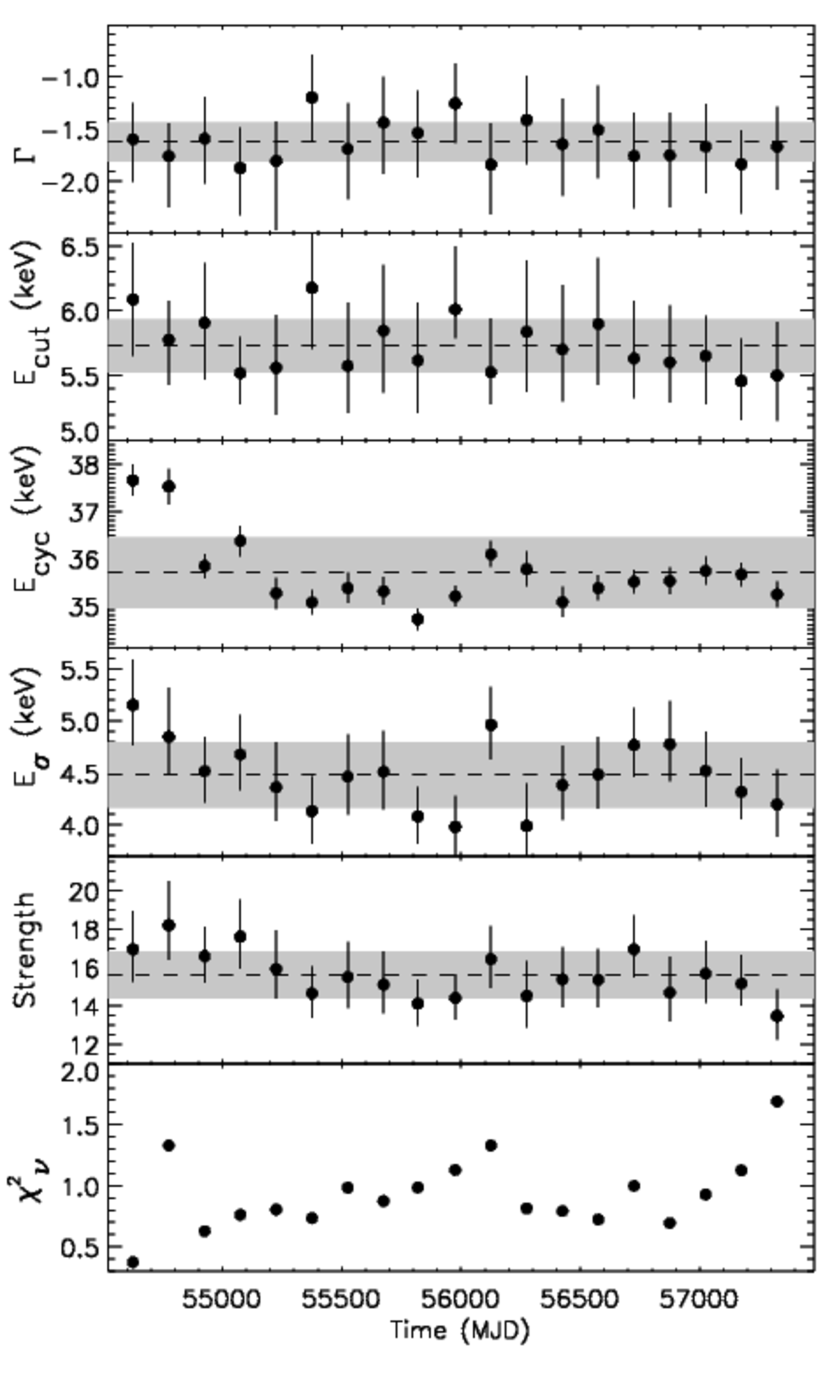
We first focused on the spectral analysis of the Swift/BAT data after the torque-reversal episode in early 2008. Starting from MJD 54550 (2008 March 28), we built a time-averaged spectrum every 150 days, up to MJD 57400 (2016 January 13). We assigned to each spectrum a systematic error of 2 per cent. We fitted each time-averaged spectrum in the 15–90 keV range with a cut-off power law and a Gaussian absorption feature (gabs in Xspec) at 37 keV. This simple model provided a satisfactory description of the spectra, with an average reduced of 0.6, and it allowed us to check the spectral variability of the high-energy emission over this long period. We found that the parameters describing the continuum emission, that are in our case the photon-index of the power law and the cut-off energy, did not significantly change in the last years. The line position of the cyclotron line shows marginally significant (at a level of 3 , Fig. 3, panel 3 from the top) higher values in the first 300 days after the torque reversal, while after this period, the line parameters (position, width, and strength) are consistent with each other. We summarize the fit results in Fig. 3, where we show the best-fit spectral values of each fit as a function of time. We checked that the first two higher line position values of the gabs component are not correlated with the values of the line width. To this aim we repeated the fitting process, after keeping the line width fixed to the sample averaged value, finding again a marginal evidence for higher line positions value in the first two time-windows. To be conservative and to obtain a high signal-to-noise ratio (SNR) spectrum, we extracted a time-averaged Swift/BAT spectrum for the days 54850–57400, where we are more confident that the spectral shape remained stable. In this time window the source is detected in the 60–110 keV band at 3.5 . Finally, we also associated to this spectrum a systematic error of the order of 2 per cent using deviations from the Crab spectrum (see La Parola et al., 2016).
We then studied the time-averaged NuSTAR/FPMA and FPMB spectra, leaving a normalization constant free to vary between the two spectra. In fitting the spectra, we used the 3–55 keV energy band as the signal-to-noise ratio (SNR) was very low above 55 keV. The hard X-ray continuum emission can be well described by different phenomenological models usually adopted for the spectra of X-ray pulsars (see e.g. Fürst et al., 2013). Because the statistical differences among the different models were not significant, to simplify the presentation of our results and without loss of generality , we only report on the best-fit model composed of a power-law modified with a high-energy cut-off (highecutpower-law in Xspec), and a soft thermal component (bbody), both absorbed by a neutral absorption column fixed at a reference value of 1 1021 cm-2 (Camero-Arranz et al., 2012). To smooth the discontinuity at the cut-off energy we used a Gaussian absorption line at the same position of the cut-off energy as explained in Coburn et al. (2002). We fitted the CRSF using a Gaussian absorption profile (gabs in Xspec). The line is found at 37.72 0.13 keV energy, it has a width a 4.22 0.13 keV and a strength () of 13.6 0.7. The strength of the line is a measure of the optical depth () at the line centre that is expressed as = 1.3 0.1. We tested if a Lorentzian profile (cyclabs in Xspec) can also equally well fit the cyclotron line, but we found a significant worsening of the fit ( = 114 between the two profiles) and, therefore, we no longer considered it.
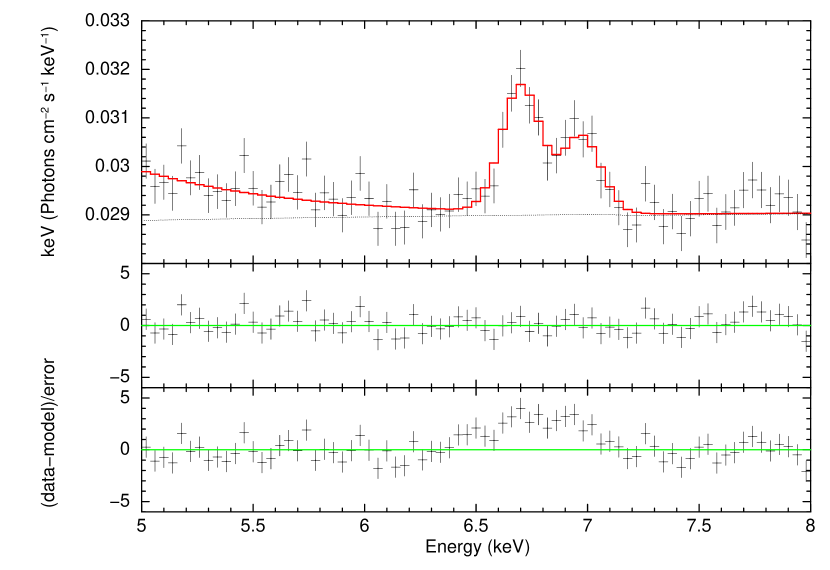
An apparent moderately broad emission line in the iron range is significantly detected in the residuals (see Fig. 4). Using a single emission line, we constrain its position at 6.79 0.04 keV, with a of 160 60 eV, and an equivalent width of 31 6 eV. The line energy is not consistent with a known rest-frame resonant energy from iron ions, as it lies in-between the energy of the Ly transitions of the He-like (6.70 keV) and the H-like (6.97 keV) ion. The line width is indicative instead of a possible blending of these two lines. In fact, we can alternatively fit the residuals using a combination of two lines, fixing their position to the expected rest-frame energies (6.7 and 6.97 keV), keeping their line widths tied. In this case, we derived an upper limit to the common width of 180 eV, thus compatible with the emission from two narrow lines, and the equivalent widths are 19 6 eV and 11 5 eV for the He-like and H-like Fe transitions, respectively. The middle and lower panels of Fig. 4 show the residuals for this last fit and for the continuum only best-fit. The passed from 1815 (no line, 1704 dof), to 1692 (one single, moderately broad, line, 1701 dof), to 1694 (two narrow lines at fixed energies, 1699 dof).
The soft thermal black-body component has a temperature of 0.50 0.02 keV, a bolometric flux of 1.1 10-10 erg cm2 s-1, and a corresponding black-body radius of 11 1.5 km. The hard X-ray emission is well described by a power-law of photon-index = 0.993 0.006, cut-off energy, = 21.86 0.16 keV, e-folding energy = 10.51 0.22 keV. The unabsorbed flux in the extrapolated 0.1–100 keV band of 1.5 10-9 erg cm2 s-1. The final reduced for this fit is 0.996 (1701 dof).
Finally, we examined the Swift/XRT spectrum (0.5–10.0 keV range) collected in 2014 March. Adopting a simple two-components continuum consisting of a soft thermal black-body emission and a power-law, we clearly detected local residuals, suggesting emission structures around, and below, 1 keV and in the iron range (Krauss et al., 2007). We used Gaussian profiles to model them, and we obtained the following constraints: an iron line is detected at 6.87 0.09 keV, the line width is determined only with an upper limit at 0.2 keV, and the equivalent width (EW) is 120 50 eV. This line is marginally compatible with a resonant Ly transition from Fe xxvi, but, in analogy to what shown for the NuSTAR spectrum, a similar fit can be obtained by setting two Gaussians at the expected rest-frame energies of the Ly transitions from Fe xxv and Fe xxvi.
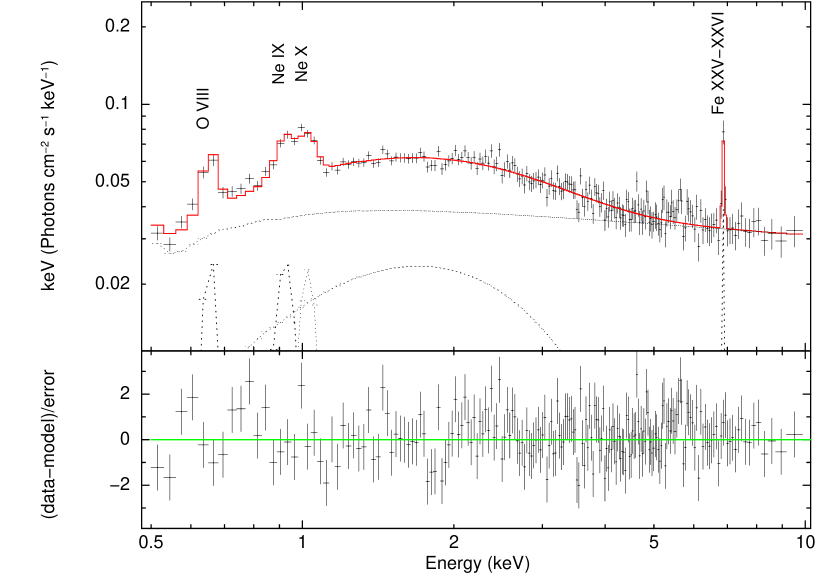
A moderately broadened line is detected at 0.970 0.011 keV, the width is 50 17 eV, and the EW is 70 10 eV; this line is possibly a convolution of the two Ly resonant transitions from Ne ix (rest-frame energy at 0.9218 keV) and Ne x (rest-frame energy at 1.022 keV). An equivalent fit is obtained by setting two Gaussians at these rest-frame energies with their widths tied. In this fit, the EWs are 37 10 eV and 36 8, for the Ne ix and Ne x ions respectively. Finally, we detected the Ly O viii oxygen line at 0.64 0.02 keV, the width was kept frozen at 0 because unconstrained, and the EW is 120 60 eV. We do not detect emission at the energy of the O vii resonant line.
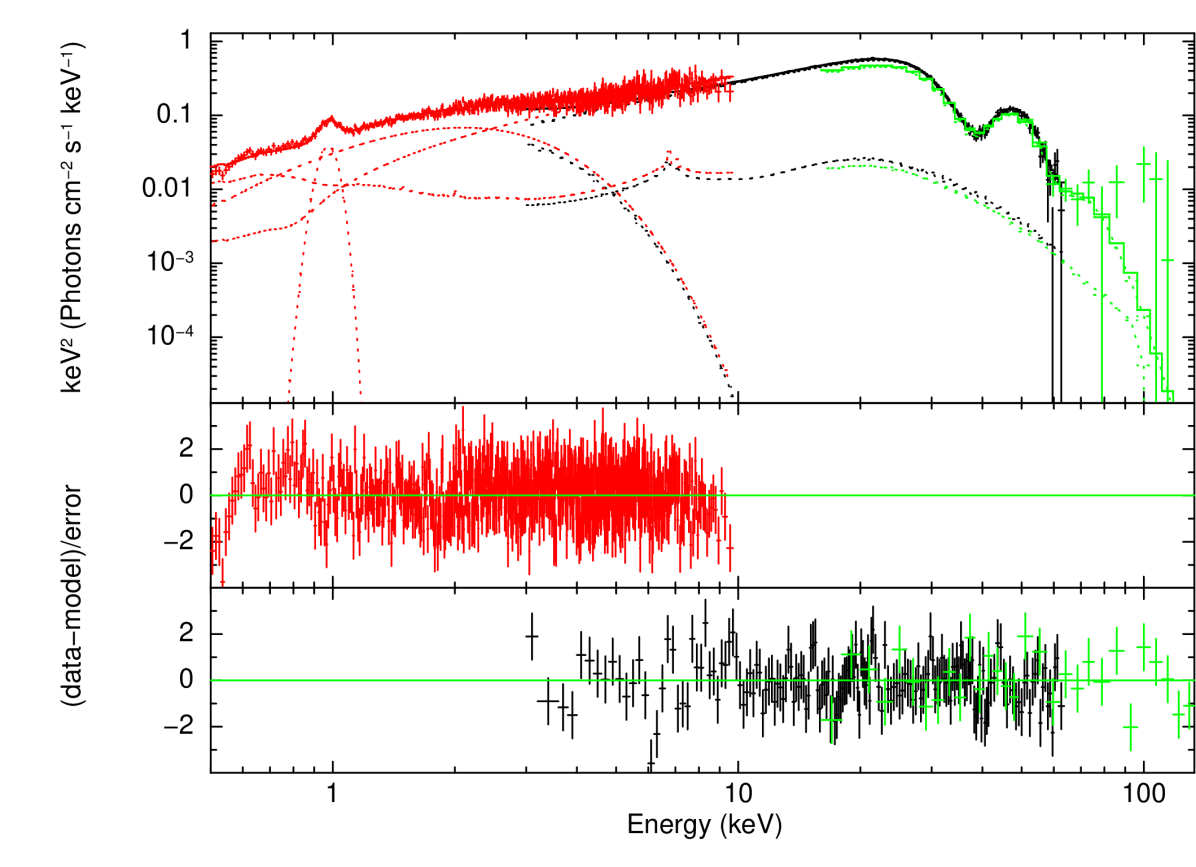
The continuum emission is well constrained mostly at softer energies; we determined an equivalent absorption column of (6.9 3.6) 1020 cm-2; a thermal component of temperature 0.59 0.02 keV, a black-body radius of 8.0 1.1 km, and luminosity of 9.0 1.0 1035 erg s-1; the harder component is compatible in this range with a power-law of index 1.16 0.10. The reduced for this best-fitting model is 0.960 (597 dof). We show in Fig. 5 the unfolded spectrum, the model, the contribution of the additive components, and the residuals.
3.2 The broadband spectrum of 4U 1626–67
In this section, we analyse the broadband, time-averaged spectrum of 4U 1626–67, using all the previously discussed datasets, looking for a self-consistent spectral model able to fit all the data in a combined fit. We leave a normalization constant free to vary among the different spectra to take into account flux differences, as they are different observations performed at different times, and residual absolute flux inter-calibration uncertainties. We combined and re-binned the NuSTAR FPMA and FPMB spectra into a single spectrum (FPMAB, hereafter) to increase the SNR ratio at higher energies using the addascaspec tool, thus extending the range up to 65.0 keV, for a total of 168 channels. Similarly, we re-binned the original 80-channels BAT spectrum into a 22-channels one. In searching for a common model for these data, we assume to have only marginal variations of the spectral shape of the source during the whole post-torque reversal period, as shown, at least for the BAT band, in Fig. 3. To describe this broadband (0.5–150 keV) spectrum we adopted a physical model suited for the conditions in the accretion column of an accreting X-ray pulsar (Becker & Wolff, 2007) and implemented as a local model in xspec by Ferrigno et al. (2009). The model (bwmodel) takes into account all the relevant physical processes involved in the particle-photon and photon-photon interactions in a magnetically-dominated environment. It assumes a cylindrically collimated radiation-dominated radiative shock above the NS polar cap, with free-fall particles velocities that Compton scatter photons produced by bremsstrahlung and cyclotron processes along the accretion column and thermal black-body photons emerging from the accretion mound at the base of the accretion column. Plasma is stopped at the shock front by radiation pressure, while gas pressure is considered negligible. Comptonization of the initial photon spectrum takes into account both thermal and bulk-motion effects. A very detailed description of the model is given in Wolff et al. (2016).
As suggested by the usage guidelines111http://www.isdc.unige.ch/~ferrigno/images/Documents/BW_distribution/BW_cookbook.html, we set the following parameters frozen during the fitting procedure: the mass and radius of the NS ( = 1.4 M⊙ and = 10 km), the source distance (9 kpc), the magnetic field of the NS (4.2 G, as derived by the cyclotron line position, and assuming a gravitational redshift, = 0.3), and the normalizations of the cyclotron and bremsstrahlung emission seed photon components (set to 1). The following parameters were left free to vary: the radius of the accretion column, ; the electron temperature, ; the photon diffusion parameter, , defined as:
| (1) |
where and are the electron cross-sections relative to perpendicular and parallel diffusion with respect to the magnetic field lines, and and are the proton mass and the speed of light; the Comptonization parameter, , defined as:
| (2) |
where , , and are the angle-averaged electron scattering cross section, the electron mass, and the Boltzmann constant, respectively. is a factor proportional to expressed as:
| (3) |
The bwmodel does not automatically conserve energy, because of some simplifying assumptions in the energy transport in the post-shock region (Wolff et al., 2016). A way to force consistency is to fix the accretion rate model parameter, , using the observed flux () and a distance guess, inverting the equation . We calculated the unabsorbed, extrapolated (0.1–150 keV) flux during the NuSTAR observation 1.5 10-9 erg cm-2 s-1 and, for a distance of 9 kpc, we derived and fixed in the model a value of 7.6 1016 g s-1. In the next section we will discuss how the model parameters depend on this assumption.
We could not find a satisfactory fit using only the absorbed bwmodel for the whole energy band; broad residuals in the softer band suggested the need for an additional component, that we modelled using a black-body. We then interpreted the highly ionized lines described in Sect. 3.1 as due to a broadband reflection model and, to self-consistently describe the whole spectrum, we adopted the coplrefl reflection model developed by Ballantyne et al. (2012) suited for the typical hard X-ray spectra of accreting pulsars. The reflection is computed from a continuum made of a power-law with a high-energy cut-off. We froze the parameters of this continuum using the results from the previous section (NuSTAR fit) setting the power-law index, the cut-off energy and the e-folding energy to 0.995, 21.5 keV, and 12 keV, respectively. We allow the ionization parameter (log ) and the model normalization as free parameters. We do not convolve the model with a relativistic smearing kernel, as the inner accretion disk radius is expected to be truncated at a distance from the NS where no detectable Doppler broadening can be resolved by our data (Koliopanos & Gilfanov, 2016). This model takes well into account the emission from iron, it fits satisfactorily the oxygen lines (small residuals are yet seen but not at high significance), but leaves strong residuals at 1 keV, possibly due to an over-abundance of Neon with respect to the fixed abundance set in the table model (see e.g. Schulz et al., 2001); we added a local Gaussian at the fixed energy 0.97 keV and = 0.05 keV to flatten residuals in this range.
We describe the cyclotron line with a Gaussian profile. However, as noted by the different values in the line parameters shown in the previous section, the FPMAB and BAT spectra cannot be fitted together with tied parameters. The most significant differences were the values of line energy and line depth. We retain that the energy shift is most likely due to a gain drift of the BAT response matrix with respect to the FPMAB’s one (see Fig. 2 in Baumgartner et al., 2013), while the difference in the depth values (of the order of 20–30 per cent) reflects a small difference between the two averaged fluxes as measured in the two different time windows. Therefore, we applied a gain correction to the BAT spectrum and we left the depth of the cyclotron line in the BAT spectrum as a free parameter. We obtained for the BAT matrix an offset of 1.2 keV (as similarly found by Ferrigno et al., 2016; Doroshenko et al., 2017) with respect to FPMAB, while the slope was consistent with unity.
Further, we noted that the highest energy emission, above and around the cyclotron line, gave still significant residuals both in the BAT and FPMAB data (see upper panel of Fig. 6). To resolve the nature of these residuals, if either due to unresolved systematic mismatch between the and Swift spectra, or to a bad modelling of the continuum, or to a missing component, we obtained the best-fits separately for the XRT+FPMAB and for the XRT+BAT spectra. As shown by the residuals in Fig. 6, the general unsatisfactory value of the , is not linked to the combined FPMAB and BAT fits, but rather suggests the need for a more complex continuum, or cyclotron line description, or for an additional component. Secondly, we compared the residuals pattern with the one obtained from the phenomenological description using the highecut model for the hard X-ray emission. In this case, we swapped the bwmodel component for the highecut, leaving the parameters of the softer black-body and coplrefl components free to vary accordingly. The highecut model offered a slightly different pattern for the residuals, but it also pointed to the presence of an absorption feature around 60 keV. The overall quality of the fit was unsatisfactory (reduced = 1.34, for 788 dof) as in the case of the bwmodel. We concluded that the physically consistent description of the continuum offered a statistically similar value compared with the most widely used phenomenological description, and it is therefore not directly accountable by itself for the unsatisfactory value of the .
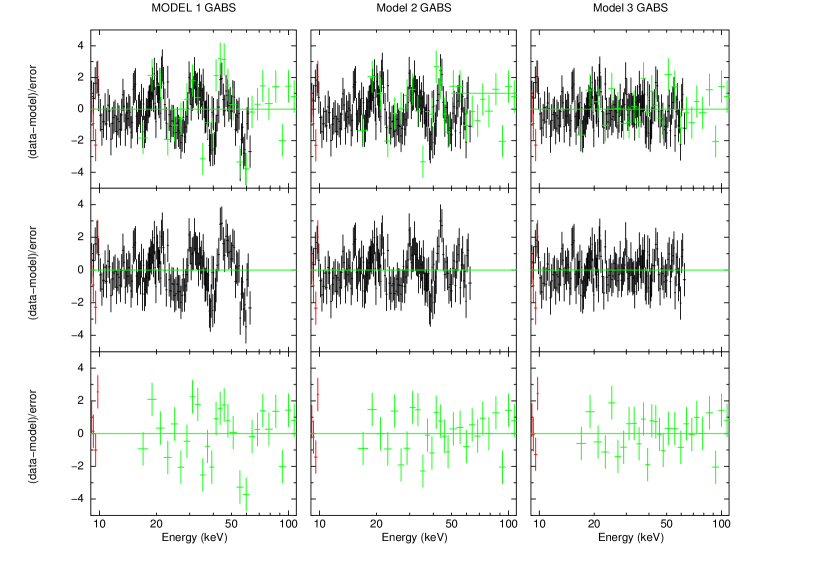
Subsequently, we tested the statistical significance for the addition of a second absorption Gaussian profile (model bwm2), which was strongly suggested both by the residuals in the highecut and bwmodel. This second absorption Gaussian line could represent a higher cyclotron harmonic and to better constrain its position and depth, we tied the width of the line to that of the first harmonic. We found that the improvement of the due to the flattening of the residuals in the higher energy range is always significant, obtaining a = 40, 52, and 116, for the XRT+BAT, XRT+FPMAB, and XRT+BAT+FPMAB fits, respectively (bwmodel).
Finally, we found that residuals could be flattened around the cyclotron line energies using a more complex line profile, but still preserving its symmetric characteristic, by imposing the superposition of two Gaussians with a common line energy, but free widths and depths (model bwm3). We note, however, that this more complex profile for the fundamental cyclotron line is only marginally seen in the FPMAB spectrum alone, but it becomes statistically very significant in combination with the XRT spectrum. We cannot, therefore, rule out that the shape of this cyclotron feature is biased by the inter-calibration of these two spectra, that are not contemporaneous. We comparatively report in Table 1 the final best-fitting parameter values for the three models, where it can be seen that the modelling of the fundamental cyclotron line only marginally impacts the determination of the other fit parameters. For completeness, we also report the best-fit parameters adopting the phenomenological model highecut (Table 1, last column).
| bwm1 | bwm2 | bwm3 | highecut | |
|---|---|---|---|---|
| (1021 cm-2) | 0.50.2 | 0.60.2 | 0.40.2 | 1.50.15 |
| bbody (keV) | 0.5130.011 | 0.5480.011 | 0.5320.013 | 0.5690.014 |
| bbody (km) | 3.700.20 | 9.60.5 | 10.72.6 | 2.80.2 |
| bbody Flux (10-10 erg cm-2 s-1) | 1.2 | 1.10 | 1.15 | 1.02 |
| coplrefl log () | 2.60.1 | 3.20.1 | 3.20.1 | 2.60.1 |
| coplrefl Flux (10-10 erg cm-2 s-1) | 1.2 | 0.8 | 0.8 | 1.1 |
| bwmodel | 1.180.02 | 1.310.05 | 1.21 | |
| bwmodel | 3.120.18 | 2.3 | 2.90.4 | |
| bwmodel (keV) | 4.050.09 | 4.70.20 | 4.50.2 | |
| bwmodel (m) | 24.80.8 | 28.5 | 26.0 | |
| bwmodel Flux (10-10 erg cm-2 s-1) | 14.5 | 15.8 | 16.4 | |
| highecut | 0.98 | |||
| highecut (keV) | 12.10.5 | |||
| highecut (keV) | 22.00.5 | |||
| highecut Flux (10-10 erg cm-2 s-1) | 15.7 | |||
| gabs (keV) | 37.40.12 | 38.000.16 | 37.950.15 | 37.950.15 |
| gabs Width (keV) | 4.880.10 | 5.340.16 | 6.00.3 | 3.9 |
| gabs Strength | 20.90.7 | 25.61.3 | 23.00.9 | 11.0 |
| gabs2 | 60.8 | 61.01.0 | 673 | |
| gabs2 Strength | 19 | 225 | 50 | |
| gabs3 Width (keV) | 2.90.6 | 7.80.6 | ||
| gabs3 Strength | 3.7 | 123.3 | ||
| 0.8280.011 | 0.8230.010 | 0.8150.011 | 0.8110.010 | |
| 1.2170.016 | 1.2220.014 | 1.2190.016 | 1.2210.016 | |
| (dof) | 1.271 (789) | 1.133 (787) | 1.051 (785) | 1.048 (783) |
3.3 Dependence of the bwmodel parameters on the distance estimate
As discussed in the previous section, to force consistency between the energy implied by the bwmodel and that corresponding to the observed flux ( 1.5 10-9 erg cm-2 s-1), we set the parameter fixed. However, this choice depends on the assumed distance, which, for the case of 4U 1626–67 is highly uncertain. Therefore, we fitted the data with BWM3 model (the BAT spectrum was not considered to simplify the fitting procedure) assuming distance values, and consequently different , within the range 3–13 kpc at a step of 1 kpc (see Fig. 8). For distances 6 kpc, the value is much worse than for any larger distance. Some of the bwmodel parameters tend to the extreme values of the allowed parameter space ( to the upper hard limit, to the bottom limit) and the physical interpretation could be unreliable. For , we obtained acceptable fits, but the electron temperature and the parameters resulted strongly anti-correlated. For distance values , parameters do not show any significant correlation: , , and reach a plateau value and the only parameter that shows a significant correlation with the distance is . Besides the distance issue, the accretion rate estimation depends on two further approximations we made: the whole observed flux is dissipated in the shock region and the emission comes from only one pole. However, these represent second-order approximations compared to the uncertainty on the distance.

4 Spin-resolved spectral analysis of the NuSTAR data
We performed a timing analysis of the pulsed emission of 4U 1626–67. We barycentred the photon arrival times with respect to the Solar system barycentre using the barycorr tool. Adopting the folding search technique (efsearch tool), we found a spin period of 7.672952(3) s, consistent with the Fermi/Gamma-ray Burst Monitor (GBM) value222http://gammaray.nsstc.nasa.gov/gbm/science/pulsars/lightcurves/4u1626.html. The background-subtracted folded pulsed profile is shown in the upper panel of Fig. 9, while in the lower panel we show the energy-dependence of the pulsed fraction () as given by the root-mean-squared value (rms) of the pulsed profile. An et al. (2015) showed that this definition of is a reliable estimator of the true value, although a direct comparison with other estimators needs a proper scale factor to be taken into account. We verified that the value of the folded profile is consistent within a few percent with what obtained by computing the truncated Fourier expansion and subtracting the Fourier noise (Eq. 3 in An et al., 2015).
The pulsed fraction has a very steep increase above 10 keV, and the plot of the energy-resolved profiles in Fig. 10 shows that this increase is also marked with a significant change in the pulsed emission from a double-peaked profile, for energies below 12 keV, to a single-peaked profile at higher energies. Such results are consistent with a previous analysis on the shape of the pulsed emission after the most recent torque reversal (Beri et al., 2014) and indicate that during this last spin-up phase the profile has not significantly varied.


We performed a spin-resolved spectral analysis of the NuSTAR data, adopting a spin interval of 0.05 in phase. This choice assures a satisfactory SNR for each phase-selected spectrum. We are mostly interested in the dependence of the cyclotron line energy with the spin phase. To this aim, we simplify our approach and adopt the highecut+bbody phenomenological model, as the bwmodel, being an integrated version of the total accretion column emission, does not give parameters of interest. The first harmonic is simply fitted with one gabs and we do not add the possible second harmonic, as the line energy is out of our fitted range (3–55 keV) and we are dealing with spectra of much lower statistics than the full spin-averaged spectrum. We verified that the use of this model does not affect the results concerning the cyclotron line parameters. We left the equivalent absorption column and the coplref parameters frozen to the spin-averaged best-fitting values as we do not expect any spin-dependent change in these components. The best-fit values of the continuum and the cyclotron line parameters are shown in Fig. 11. We found this model to be adequate for all the 20 spectra, with an average reduced of 1.02 and no significant residuals in any spectrum.

 |
 |
Because 50 per cent of counts are above 8.5 keV, the flux dependence on the spin phase reflects the single-peaked folded profile of the high-energy bands as shown in Fig. 10. Continuum parameters show the highest scattering from the average around phase 0, when the spectrum clearly shows a sudden change in the photon-index and in the cut-off energy; the softer black-body temperature significantly decreases, pointing to a spin-dependence of this component.
The parameters of the cyclotron line also show significant changes when the spin phase passes through the minimum at phase 0. As the flux decreases the line shifts towards lower values as well as the line depth. At the dip bottom, the line is not significantly detected, unless we put some additional constraints, e.g. fixing the line position at the middle between the best-fitting values of the two adjacent phase intervals. In this case, we find a non-zero value for the line strength (Strength = 3.5 1.5).
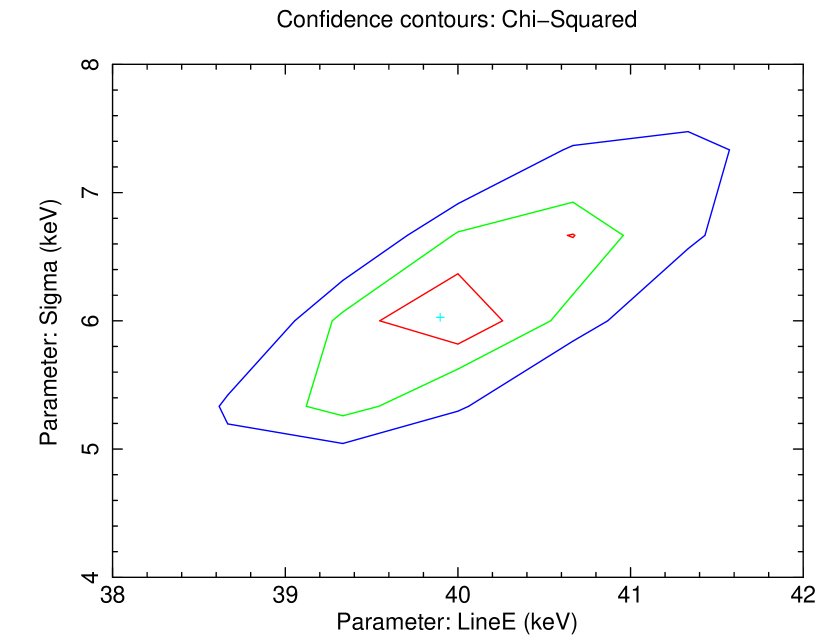
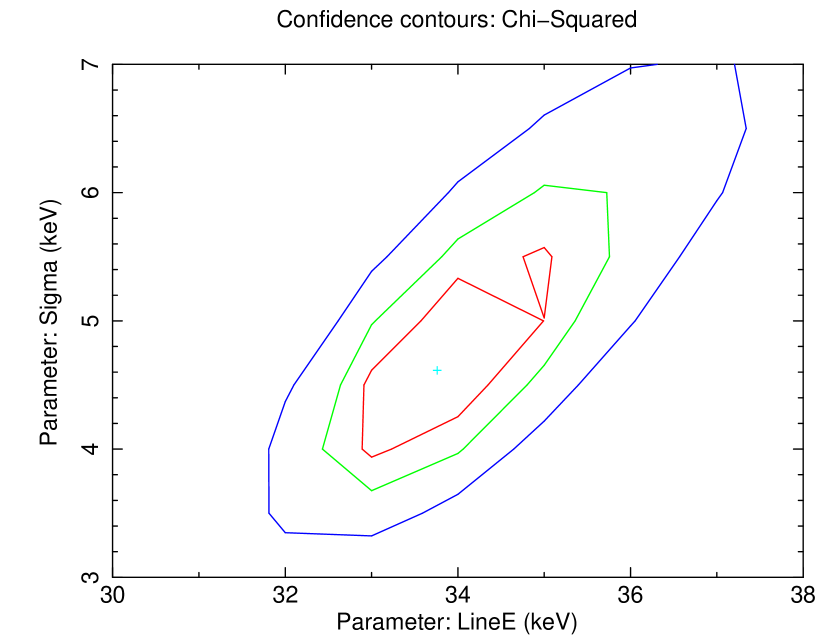
We checked if the intrinsic correlation of the line parameters affects the measured quantities (right panels of Fig. 11). To this aim, we selected the most interesting leap of values that occurs between the first peak of the folded profile at soft energies (phase 0.2) and the flux minimum, that independently from the energy selection falls at phase 0. Because of the low statistics at this phase, we summed the three spectra that covered the phase interval 0–0.15. We tested the case of the line energy drop that passes from 40 to 32 keV between these two phases by taking the two strongest correlated parameters, the and line width parameters. As shown by their contour plots in Fig. 12, the line energy error regions are well detached.
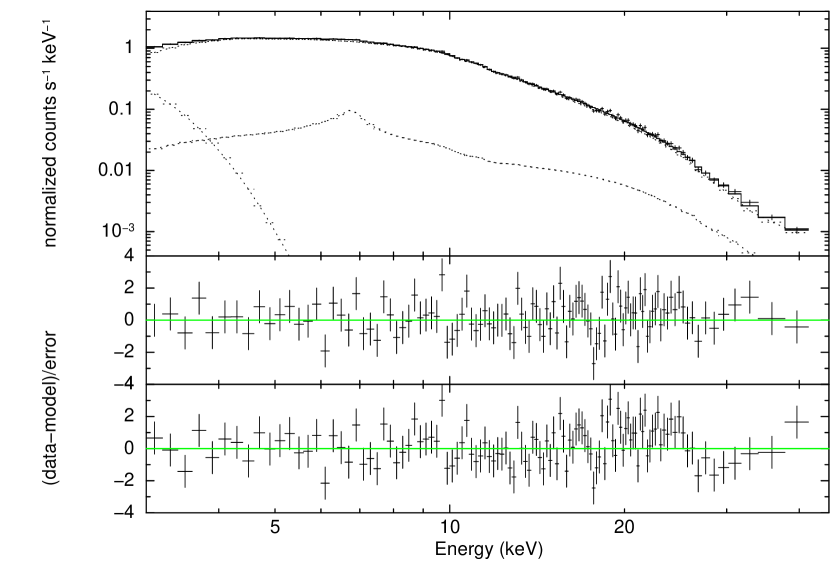
In Fig. 13 we show the data and best-fit model for the spectrum extracted from phase interval 0–0.15. The middle panel shows residuals of our best-fit model continuum with a cyclotron line in absorption at 31.6 1.7 keV, the bottom panel shows the residuals without any cyclotron line. There is no significant support in the NuSTAR data for any emission feature emerging at this particular phase interval as was earlier suggested in the Suzaku analysis by Iwakiri et al. (2012).
 |
 |
Finally, it is interesting to note that the depth and the width of the line seem to be clearly much more affected by the shape of the softer X-ray spectrum, as these parameters track more clearly the double-peaked profile. This is possibly caused by the Doppler broadening of the line which is caused by the thermal motion of the electron plasma () at the site of the line formation and by the geometrical dependence of the line width with the angle formed between our line-of-sight and the direction of the electron plasma motion according to the broadening formula given in Meszaros & Nagel (1985)
| (4) |
where is the full-width at half maximum (FWHM 2.35 ) of the line.
5 Discussion
We presented the results of a broadband analysis of X-ray spectral data on the accreting low-mass X-ray pulsar 4U 1626–67, covering the 0.5–150 keV band. For the first time, we apply to its broadband spectrum a self-consistent description of the continuum emission and of its local features. The model assumes that the channelled accretion flow is stopped close to the NS by the radiation pressure. This is not always the case as matter can be decelerated through other mechanisms, e.g. Coulomb interactions, especially at lower accretion rates. The critical luminosity above which a radiative shock can be formed has been derived by Basko & Sunyaev (1976) and can be expressed (Becker & Wolff, 2007) as:
| (5) |
For the observed X-ray intensity of 4U 1626–67 and assuming a distance of 9 kpc, the isotropic luminosity is 1.5 1037 erg s-1, which can be in principle below this threshold. From the derived best-fitting parameters using the bwmodel, we are able to infer some of these key physical parameters in the accretion environment. Assuming that the photon cross-section perpendicular to the B-field is the same as the Thomson cross-section, i.e. = = 6.6527 10-25 cm-2, we can, by simple algebraic passages, derive the values for , and , that are 0.335, 4.510-5 , and 210-4 . This leads to an estimate for 1.5 1037 erg s-1, that is exactly our estimated luminosity. We are at the threshold for the applicability of the radiation dominated shock model, so it is reasonable to question if the derived parameters can be confidently interpreted. To answer this question, it is interesting to compare the bwmodel set of values with the ones obtained in a similar study for Her X-1 (Wolff et al., 2016), given that both sources accrete through Roche lobe overflow via an accretion disk, and the inferred values of the cyclotron lines are similar, thus indicating a similar value for the dipole magnetic field. The two sources mainly differ in the mass accretion rate, which for Her X-1 is higher (2.6 1017 g s-1), while 4U 1626–67 accretes in the range 5–14 1016 g s-1. The distance to Her X-1 is well constrained and this allows to confidently set its accretion regime above the critical rate.
The parameter can be expressed as the ratio of the -parameters for the bulk () and thermal Comptonization processes ():
| (6) |
and both sources show values ( = 2.38 in Her X-1) which are consistent, thus indicating that the combined overall effect of the bulk and thermal Comptonizations is similar despite the difference in the accretion rate. That the thermal Comptonization term in the formation of the total spectrum is similar can also be noted by the electron plasma temperature that is the same in both sources ( = 4.58 keV in Her X-1).
The derived radius of the accretion column in 4U 1626–67 is about a quarter of the value inferred for Her X-1 ( = 107 2 m) indicating that a much smaller fraction of the NS surface actually accretes. The area of the accreting pole-cap () is inversely proportional to the magnetospheric radius, , where is given by
| (7) |
where is the magnetic moment in units of 1030 G cm3, the mass accretion rate is in units of 1016 g s-1 and the NS mass, in units of solar masses; is the Alfvén geometrical correction factor that for accretion through a disk should be 1 and was estimated by D’Aì et al. (2015) to be 0.2. Based on the assumed magnetic field of 4U 1626–67 we derive a in the range 1.0–1.4 108 cm, depending on the assumed accretion rate (or distance). Because , in the case the cyclotron lines are produced quite close to the NS surface, it is straightforward to relate the derived accretion columns radii in these two sources, assuming similar masses and radii for the NSs and for the Alfvén geometrical factor, as:
| (8) |
The ratio of the column radii is then expected to be close to 1.3, a value apparently distant from the factor of 4, but, as noted before, the value depends on the assumed distance, and for greater distances (12 kpc), we found values that are compatible with this expected ratio. The value of is similar to the one obtained for Her X-1 (5.2 10-5 ). This parameter is proportional to the square of the averaged photon energy () below the cyclotron energy, and thus implies that the in 4U 1626–67 is close to the one in Her X-1, as expected by the two similar spectra. We conclude that the list of physical parameters derived from the application of the bwmodel to the broadband spectrum of 4U 1626–67 is strikingly consistent with Her X-1, and thus strongly favours a luminosity above the critical value of Eq. 5 and a distance 9 kpc.
5.1 The soft X-ray black-body
The bwmodel takes also into account the emission from thermal reprocessing of the accretion flow in the post-shock region. Matter settling sub-sonically on the surface of the NS forms a mound of accreted plasma and from the derived best-fitting values of the bwmodel, we are able to estimate the temperature of this mound and the optical depth at its top (see Eq. 11 in Wolff et al., 2016), obtaining 6.9 107 K and 0.08, respectively. This temperature is greater than the value derived for Her X-1 (4.3 107 K), and it is mostly driven by the dependence from the accretion radius ( ).
In our broadband modelling, we find still evidence that part of this emission could be emitted without interacting with the accreting plasma in the column at a lower temperature, with 0.5 keV. This temperature was observed to significantly change from the spin-down to the spin-up phase, passing from 0.3 keV to 0.6 keV (Camero-Arranz et al., 2012). The high relative fraction of this component with respect to the overall observed emission ( 6 per cent), the small inferred black-body equivalent radius, and the spin dependence of its parameters support an origin from the neutron star surface, whereas the high temperature disfavours an origin from the truncated accretion disk, because at the inferred inner radius there is not enough dissipation to reach this temperature. We argue that this component could emerge from the surface of the NS that is not directly accreting matter, and it is not shadowed by the accretion column.
5.2 The shape of the cyclotron features
Application of the physical model to the broadband spectrum gave significant residuals at the energy of the cyclotron line and at higher energies. However, when the dataset was analysed in Sect. 3.1, the residual pattern using a phenomenological model, appeared much flatter. It follows therefore that any constraint on the cyclotron shape strongly depends on the available energy band and on the broadband model used to fit the data. Lacking a firmly recognized physical model to fit the cyclotron features (but for recent advances in this direction see e.g. Schwarm et al., 2017), we applied a simple convolution model of two nested Gaussians to fit the shape of the fundamental line as also been done by Pottschmidt et al. (2005) and Nakajima et al. (2010) for the case of the accreting pulsar V0332+53. In the case 4U 1626–67 we do not detect any asymmetry in the residuals and we found that these two nested lines had a common line energy, so that we tied them together (but see the case of Cep X-4 for a notable exception, Fürst et al., 2015). The widths of the lines indicate a broader feature of 6 keV, and a narrower one of about half this value. With respect to the fit using a single Gaussian (columns 2 and 3 in Table 1), the line position is not changed, whereas the increase in the width of the broader line is an expected consequence of the flattening of the residual pattern on the whole fitted energy range. The position of the line at 38 keV is consistent with previous studies (Orlandini et al., 1998; Coburn et al., 2002; Camero-Arranz et al., 2012), despite observations span different source luminosities and spin-up states.
Another pattern of residuals indicates a possible second cyclotron harmonic but its position is significantly different for an expected harmonic ratio of 2. However, there are both observational evidences from other X-ray pulsars that show anharmonic ratios and theoretical studies that predict even larger deviations (Nishimura, 2005; Nakajima et al., 2010). Coburn et al. (2002) did also note significant deviations from the continuum at energies above the fundamental cyclotron using RXTE data, however the line position was estimated at 80 keV, which is not consistent with our estimate.
5.3 The reflection component
For the first time we applied a self-consistent broadband reflection spectrum taking into account, besides the resonant transitions of the iron and low-Z metals, also the Compton-scattering continuum. The reflection model was computed for a constant density accretion disk. It represents an angle-averaged emission, and the illuminating source is assumed central and isotropic (Ross & Fabian, 1993; Ballantyne et al., 2012). All these assumptions are not assured in the case of a complex beam pattern produced by the accretion column walls of a pulsar but we retain that in this particular case, being the disk truncated at more than 500 gravitational radii, our simplified approach might still hold.
We showed that this particular model can well fit the high-statistics data of the NuSTAR data and the best-fitting parameters indicate a moderately highly ionized reflecting medium, which well reproduces the blended complex of Fe xxv and Fe xxvi and also leaves no significant residuals at the energies of O viii, but an excess around the Ne complex is still evident, and possibly due to an over-abundance of this element. The combined NuSTAR/Swift observation is the first to constrain iron resonant features in this high ionisation state, as past Chandra and Suzaku observations found iron in a neutral, or mildly ionized state. This can be due to the higher accretion rate of the source during the NuSTAR observation, which at the same time, brings the accretion disk closer to the compact object and gives also a stronger irradiating flux. We note that this is also supported by the measured higher equivalent widths, as the iron line seen by Chandra in 2010 had a width of 36 15 eV and an EW of 18 6 eV (Koliopanos & Gilfanov, 2016).
We calculated a reflection strength of 0.05 (defined as the ratio in the 20–40 keV range of the reflection component flux to the continuum). The reflection fraction, estimated with the pexriv model fitting only the reflection bump, results in a similar value (see Dauser et al., 2016, for the difference between the two definitions). This value is considerably lower with respect to the non-pulsating NS X-ray binaries, since the disk is truncated at a larger distance from the NS and, thus, subtends a lower angle from the primary source of hard X-ray photons. In the case of GRO J1744-28, a similar low-mass X-ray pulsar seen at similar low inclination angle, the inferred reflection fraction was also 0.05, but the width of the reflecting lines was found significantly wider. This indicates that the reflecting disk was similar in size but the inner radius was much closer to the pulsar, where Keplerian and relativistic effects to the line broadening become statistically detectable in the spectrum (Younes et al., 2015; D’Aì et al., 2015).
6 Acknowledgments
AD acknowledges contract ASI-INAF I/004/11/0. We acknowledge the heasoft software use developed and maintained by the NASA High Energy Astrophysics Science Archive Research Center [heasarc]).
References
- An et al. (2015) An H., et al., 2015, ApJ, 807, 93
- Ballantyne et al. (2012) Ballantyne D. R., Purvis J. D., Strausbaugh R. G., Hickox R. C., 2012, ApJ, 747, L35
- Barthelmy et al. (2005) Barthelmy S. D., Barbier L. M., Cummings J. R. e. a., 2005, Space Sci. Rev., 120, 143
- Basko & Sunyaev (1976) Basko M. M., Sunyaev R. A., 1976, MNRAS, 175, 395
- Baumgartner et al. (2013) Baumgartner W. H., Tueller J., Markwardt C. B., Skinner G. K., Barthelmy S., Mushotzky R. F., Evans P. A., Gehrels N., 2013, ApJS, 207, 19
- Becker & Wolff (2007) Becker P. A., Wolff M. T., 2007, ApJ, 654, 435
- Beri et al. (2014) Beri A., Jain C., Paul B., Raichur H., 2014, MNRAS, 439, 1940
- Burrows et al. (2005) Burrows D. N., Hill J. E., Nousek J. A., Kennea J. A., Wells A., Osborne 2005, Space Science Reviews, 120, 165
- Camero-Arranz et al. (2012) Camero-Arranz A., Pottschmidt K., Finger M. H., Ikhsanov N. R., Wilson-Hodge C. A., Marcu D. M., 2012, A&A, 546, A40
- Chakrabarty (1998) Chakrabarty D., 1998, ApJ, 492, 342
- Coburn et al. (2002) Coburn W., Heindl W. A., Rothschild R. E., Gruber D. E., Kreykenbohm I., Wilms J., Kretschmar P., Staubert R., 2002, ApJ, 580, 394
- D’Aì et al. (2015) D’Aì A., et al., 2015, MNRAS, 449, 4288
- Dauser et al. (2016) Dauser T., García J., Walton D. J., Eikmann W., Kallman T., McClintock J., Wilms J., 2016, A&A, 590, A76
- Doroshenko et al. (2017) Doroshenko V., Tsygankov S. S., Mushtukov A. A., Lutovinov A. A., Santangelo A., Suleimanov V. F., Poutanen J., 2017, MNRAS, 466, 2143
- Ferrigno et al. (2009) Ferrigno C., Becker P. A., Segreto A., Mineo T., Santangelo A., 2009, A&A, 498, 825
- Ferrigno et al. (2016) Ferrigno C., et al., 2016, A&A, 595, A17
- Fürst et al. (2013) Fürst F., et al., 2013, ApJ, 779, 69
- Fürst et al. (2015) Fürst F., et al., 2015, ApJ, 806, L24
- Harrison et al. (2013) Harrison F. A., et al., 2013, ApJ, 770, 103
- Iwakiri et al. (2012) Iwakiri W. B., et al., 2012, ApJ, 751, 35
- Jain et al. (2010) Jain C., Paul B., Dutta A., 2010, MNRAS, 403, 920
- Kii et al. (1986) Kii T., Hayakawa S., Nagase F., Ikegami T., Kawai N., 1986, PASJ, 38, 751
- Koliopanos & Gilfanov (2016) Koliopanos F., Gilfanov M., 2016, MNRAS, 456, 3535
- Krauss et al. (2007) Krauss M. I., Schulz N. S., Chakrabarty D., Juett A. M., Cottam J., 2007, ApJ, 660, 605
- La Parola et al. (2016) La Parola V., Cusumano G., Segreto A., D’Aì A., 2016, MNRAS, 463, 185
- Meszaros & Nagel (1985) Meszaros P., Nagel W., 1985, ApJ, 298, 147
- Middleditch et al. (1981) Middleditch J., Mason K. O., Nelson J. E., White N. E., 1981, ApJ, 244, 1001
- Nakajima et al. (2010) Nakajima M., Mihara T., Makishima K., 2010, ApJ, 710, 1755
- Nishimura (2005) Nishimura O., 2005, PASJ, 57, 769
- Orlandini et al. (1998) Orlandini M., et al., 1998, ApJ, 500, L163
- Pottschmidt et al. (2005) Pottschmidt K., et al., 2005, ApJ, 634, L97
- Rappaport et al. (1977) Rappaport S., Markert T., Li F. K., Clark G. W., Jernigan J. G., McClintock J. E., 1977, ApJ, 217, L29
- Ross & Fabian (1993) Ross R. R., Fabian A. C., 1993, MNRAS, 261, 74
- Schulz et al. (2001) Schulz N. S., Chakrabarty D., Marshall H. L., Canizares C. R., Lee J. C., Houck J., 2001, ApJ, 563, 941
- Schwarm et al. (2017) Schwarm F.-W., et al., 2017, A&A, 597, A3
- Segreto et al. (2010) Segreto A., Cusumano G., Ferrigno C., La Parola V., Mangano V., Mineo T., Romano P., 2010, A&A, 510, A47
- Takagi et al. (2016) Takagi T., Mihara T., Sugizaki M., Makishima K., Morii M., 2016, PASJ, 68, S13
- Wolff et al. (2016) Wolff M. T., et al., 2016, ApJ, 831, 194
- Younes et al. (2015) Younes G., Kouveliotou C., Grefenstette B. W., 2015, ApJ, 804, 43