Swift monitoring of the massive X-ray binary
SAX J0635.2+0533
SAX J0635.2+0533 is a binary pulsar with a very short pulsation period ( = 33.8 ms) and a high long-term spin down ( 3.8 s s-1), which suggests a rotation-powered (instead of an accretion-powered) nature for this source. While it was discovered at a flux level around 10-11 erg cm-2 s-1, between 2003 and 2004 this source was detected with XMM–Newton at an average flux of about 10-13 erg cm-2 s-1; moreover, the flux varied of over one order of magnitude on time scales of a few days, sometimes decreasing below erg cm-2 s-1. Since both the rotation-powered and the accretion-powered scenarios have difficulties to explain these properties, the nature of SAX J0635.2+0533 is still unclear. Here we report on our recent long term monitoring campaign on SAX J0635.2+0533 carried out with Swift and on a systematic reanalysis of all the RXTE observations performed between 1999 and 2001. We found that during this time interval the source remained almost always active at a flux level above 10-12 erg cm-2 s-1.
Key Words.:
stars: individual: SAX J0635.2+0533 - X-rays: binaries1 Introduction
SAX J0635.2+0533 (also known as PSR J0635+0533) is a very peculiar X-ray source. Its first detection, obtained with BeppoSAX in 1997 (Kaaret et al. 1999), revealed a 2-10 keV flux of 1.2 10-11 erg cm-2 s-1 and a hard power-law spectrum (photon index 1.5) extending to 40 keV; based on these spectral properties and on the positional coincidence with a Be star, it was classified as a high-mass X-ray binary (HMXRB). The BeppoSAX data revealed also X–ray pulsations at 33.8 ms (Cusumano et al. 2000). This is the shortest pulsation period observed in a high-mass binary pulsar: a comparably short period in a HMXRB has been detected only in A0538-66, a transient Be/X-ray binary in the Large Magellanic Cloud with a pulse period of 69 ms (Skinner et al. 1982). Based on the pulse frequencies measured with RXTE in 1999, it was possible to set a lower limit ( 3.8 s s-1) on its long–term spin down (Kaaret et al. 2000). This slow-down rate is high enough that the corresponding rotational energy loss ( = 1045 4 = 41038 erg s-1) can sustain the observed X-ray luminosity: in this interpretation, alternative to the mass-accretion scenario, the X-ray emission could be due to the shocks between the relativistic wind of the pulsar and that of the companion star. This emission mechanism has been invoked for other binary systems composed of a compact object (a neutron star in most cases) orbiting a massive star, such as PSR B1259–63 (Tam et al. 2015), LS I +61∘ 303 (Paredes-Fortuny et al. 2015), and LS 5039 (Takata et al. 2014). These binaries have been observed also at very high energies, up to the TeV range, thus proving that they are among the main sites of particle acceleration in the Galaxy (Dubus 2015). It is interesting to note that SAX J0635.2+0533 was considered a candidate counterpart of the EGRET source 2EG J0635+0521/3EG J0634+0521 (Hartman et al. 1999), since its position is within the error box of this unidentified galactic –ray source. This EGRET source corresponds to the FERMI source 1FGL J0636.0+0458c (Abdo et al. 2010), which however was not confirmed in the second (Nolan et al. 2012) and third (Acero et al. 2015) FERMI catalogues; very probably in these catalogues the source was undetected since its significance dropped below the threshold, either as a result of time variability, change in the diffuse model, or the shift from unbinned to binned likelihood in the catalog analysis procedure.
Between September 2003 and April 2004 SAX J0635.2+0533 was observed by XMM–Newton in two different periods, with 8 pointings in September–October 2003 (epoch D) and other 2 pointings in March–April 2004 (epoch E, Mereghetti & La Palombara (2009)). The source was detected only in six pointings, showing a large variability among the different observations: between September and October 2003 the source flux varied by at least a factor 10, with a rise/decay time of only a few days. The source spectrum was well fitted with an absorbed power law and the average flux in the energy range 0.2–12 keV was erg cm-2 s-1. The maximum flux detected in these observations was 10-13 erg cm-2 s-1, a factor 20 smaller than that measured at the time of the discovery in 1997. For the other four observations we could only set an upper limit on the source flux, with a minimum upper-limit value erg cm-2 s-1.
There are no precise estimates for the distance of SAX J0635.2+0533, but from the properties of the proposed optical counterpart Kaaret et al. (1999) derived a range of 2.5–5 kpc; a distance far in excess 5 kpc is unlikely, since this source is in the Galactic anti–center direction. Assuming a conservative source distance d5 of 5 kpc, the average flux during the XMM–Newton observations corresponds to a luminosity of a few 1032 d erg s-1, a value which is very small compared to the classical Be/neutron stars systems.
Due to the low luminosity and short spin period, direct accretion of matter onto the neutron star surface would require a magnetic field smaller than B G, at least three orders of magnitude lower than that expected in a young neutron star. If instead SAX J0635.2+0533 has a typical magnetic field, its low luminosity observed with XMM–Newton could be explained with mass accretion stopped at the magnetospheric radius (Campana et al. 1995). However, this scenario is difficult to reconcile with the higher luminosity state observed with BeppoSAX and RXTE, since the pulsations with a relatively high pulsed fraction are unlikely when the magnetic centrifugal barrier operates.
Also the alternative scenario of a rotation–powered neutron star presents some problems. The large flux variability seen in September 2003 could be explained only if the source was near to periastron in a very eccentric orbit, where big changes in the shock properties can be expected. Moreover, if the system indeed contains a neutron star with greater than a few 1038 erg s-1, a larger pulsar luminosity would be expected, since the typical efficiency of conversion of rotational energy to X-ray luminosity is of the order of 10-3, as observed in the case of PSR B1259–63 (Chernyakova et al. 2006, 2009) and PSR B1957+20 (Huang & Becker 2007).
In summary, SAX J0635.2+0533 is a unique source among the HMXRBs. Its luminosity is unusually low, both in quiescence and during outbursts. Due to these properties, both the accretion–powered and the rotation–powered scenarios imply several peculiarities with respect to other known HMXRBs. In order to investigate the long– and short–term behaviour of this source, we performed a monitoring campaign with Swift between 2015 and 2016 and analyzed in a systematic way all the observations performed with RXTE between 1999 and 2001. In this way, we could obtain the overall long-term light-curve of this source and study its variability pattern. Our aim was to investigate if this source is characterized by prolonged periods of activity or it spends most of the time in a quiescent state, interrupted only sporadically by bright (possibly periodic) outbursts.
2 Observations and data analysis
2.1 Swift
SAX J0635.2+0533 was observed repeatedly with Swift: 31 different pointings were performed between 2015 November 12th and 2016 May 15th (epoch F); then, after a time gap of three months, two additional pointings were performed on 2016 August 16th and 23rd (epoch G). We considered the data of the X-ray Telescope (XRT), which were obtained in photon-counting mode (Gehrels et al. 2004). In Table 1 we report the date and effective exposure time of each observation.
We ignored pointing 28, since it was too short ( 100 s) for a meaningful investigation. For each of the other pointings we retrieved from the Swift archive111http://www.swift.ac.uk/swift_live/index.php the reduced files produced with the standard xrtpipeline processing routine. To study the source variability, we analyzed separately the 32 data-sets; for each of them we performed a source detection to obtain an accurate evaluation of the source count rate (CR) and significance. We considered the source detected if its signal-to-noise ratio was above a threshold value of 2 c.l.; we adopted such a loose detection criterion considering that the presence of a source at this position was already known. We found that SAX J0635.2+0533 was detected in 22 observations, while it was undetected in the first six observations (December 2015) and in other four observations during 2016; in case of a non-detection we set a 3 c.l. upper limit on the CR (Table 1).
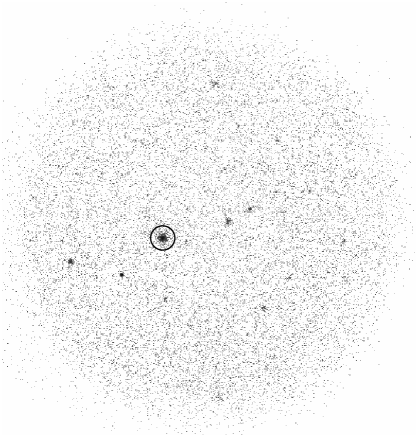
In order to investigate the average spectral properties of the source, we used xselect to merge the event lists of the 22 observations where the source was detected and to accumulate an image of the field–of–view (reported in Fig.1). In the total observing time of 74 ks, SAX J0635.2+0533 was detected with an average CR = (1.580.05) cts s-1. To minimize the background contribution, we extracted the source spectrum by selecting events in a circular region of 20 pixel radius, corresponding to 47′′; the background spectrum was accumulated from a large circular area with no sources and radius of 100 pixels. We generated a cumulative exposure image of the merged observations and, then, used the task xrtmkarf to calculate the ancillary response file. The total spectrum was rebinned with a minimum of 20 counts per bin, and fitted in the energy range 0.3–10 keV using XSPEC 12.7.0. We obtained a good fit with an absorbed power–law (Fig.2), yielding a hydrogen column density cm-2 and a photon index . The average absorbed flux in the energy range 0.3–10 keV is erg cm-2 s-1, while the corresponding unabsorbed flux is erg cm-2 s-1. Acceptable fits were also obtained with a thermal bremsstrahlung (kT = 6.5 keV) and with a blackbody (kT 1 keV), although in the last case there are large residuals at high energies.

To investigate also the possible spectral dependence on the source flux, we accumulated two separate spectra for, respectively, the observations with a source CR 0.02 cts s-1 and those with a lower CR; in this way we obtained two spectra with a similar count statistics. We performed a simultaneous fit of the two spectra with an absorbed power-law model, assuming a common hydrogen column density in order to avoid any degeneracy with the photon index. In Fig.3 we report, for both spectra, the contour plot between the normalization and the photon index, which shows no evidence for a variation in the photon index within the uncertainties. Using the flux/CR ratio obtained for the total spectrum we converted the measured CR of each observation (or, in the case of missing detection, its upper limit at a 3 c.l.) into the corresponding energy flux; they are reported in Fig. 5.

We also performed a search for long-term periodicities in the Swift data by applying the Lomb–Scargle method (Scargle 1982). In Fig. 4 we report, as an example, the power distribution obtained by searching 1000 independent periods. In this case, a power 11.5 is necessary to claim a signal detection at 99 % c.l.; on the other hand, the highest peak in our diagram, with power 5, has a probability higher than 99.9 % to be obtained in the absence of a periodic signal. Therefore, we found no evidence of a periodic signal; in particular, with the available data it is not possible to confirm the proposed orbital period of 11.2 days (Kaaret et al. 2000).

2.2 RXTE
RXTE (Bradt et al. 1993) observed SAX J0635.2+0533 in three different epochs between 1999 and 2001, with 13 pontings in August–September 1999 (epoch A), 5 pointings in May 2000 (epoch B), and 49 pointings between November 2000 and January 2001 (epoch C); in Table 2 we report the dates and effective exposure times of each observation. Only the results of epoch A were published (Kaaret et al. 2000). Therefore, we have analyzed in the same way all the observations of the three epochs. We considered only the data of the Proportional Counter Array (PCA), which covers the energy range 2–100 keV and comprises five identical coalligned gas-filled Proportional Counter Units (PCUs). The exposures of the individual observations were between 1.6 and 6.9 ks and, during each of them, between 2 and 5 PCUs were active.
For the spectral analysis we considered the Standard 2 data and applied the procedure suggested by the instrument team222http://heasarc.gsfc.nasa.gov/docs/xte/recipes/pca_spectra.html. We analyzed separately each observation; moreover, within each observation, we analyzed separately the time intervals characterized by a different number of active PCUs (if any). In each case we created the applicable Good Time Interval and extracted the source and background spectra using only the PCU top layer, which gives a higher signal-to-noise ratio. Then we corrected for the dead time and created the applicable response matrix.
Although the source was always detected, for most observations the spectrum had a low count statistics, which hampered an accurate spectral analysis. Therefore, we assumed an absorbed power-law model fixing both and to the best-fit values obtained with Swift (2.7 cm-2 and 2, respectively) and left only the normalization free to vary. In this way we estimated the fluxes reported in Fig.5.
We searched for the presence of the pulsations at 34 ms in the data of 2000 and 2001 (epochs B and C), that were not analyzed by Kaaret et al. (2000). Following these authors, we used the top-layer data in the energy range 4.4–23.6 keV collected in Good Xenon format. The arrival times were barycentered using the position of the optical counterpart and analysed using the Rayleigh test statistics. To take into account a possible spin-up or spin-down of the pulsar since the time of the previous period measurement (P = 33.9 ms in August-September 1999), we searched for periods in a relatively large range, from 33.4 to 34.4 ms. This corresponds to a conservative assumption of || s s-1 for the maximum spin-up/spin-down of the source. We performed the period search in each observation separately, without finding any significant excess in the power distributions; in all cases we found distribution peaks with power , corresponding to a chance detection probability 3.8 %. We searched for excess power also in the periodograms summed over groups of observations, again with negative results. Note, however, that the frequency modulation induced by orbital motion reduces the sensitivity of this analysis. Unfortunately the orbital parameters derived by Kaaret et al. (2000) are not sufficiently precise to correct the arrival times for the orbital motion. After accounting for the large contribution of the background counts, we estimate that the single observations give a sensitivity to pulsed fractions of the order of 40-60 %, with the exact value depending on their duration and source flux.
3 Discussion
In Fig. 5 (lower panel) we report the long-term light curve of SAX J0635.2+0533 since MJD = 51400 (August 10th, 1999); it includes all the flux measurements obtained after the source discovery in 1997 with different telescopes. In the four upper panels we show a zoom into the observations of epochs A, C, D, and F, respectively; for each of them we use the same scale for the time and flux axes, in order to better compare the flux variability among the different epochs. The light-curve shows that SAX J0635.2+0533 was clearly detected in most of the observations, although at very different flux levels. The source is very variabile, with a dynamic range of more than two orders of magnitude; moreover, this variability is also rather fast, since the source flux can increase/decrease of one order of magnitude over a timescale of a few days. However, in spite of this high variability, we never observed again an outburst as luminous as that seen with BeppoSAX in 1997. Therefore, this type of event must be very rare.

In most observations the source was detected at a flux level erg cm-2 s-1, corresponding to erg s-1. In the latest years similar quiescent luminosities have been observed in several Be X-ray binaries, and various emission mechanisms have been proposed to explain them (see e.g. Tsygankov et al. 2017b). In the case of SAX J0635.2+0533, we can exclude that the observed low-luminosity originates from the companion: in fact, although the intrinsic X-ray luminosity of Be stars can be as high as erg s-1 (Nazé 2009; Nazé et al. 2011), these stars do not show the high and fast variability observed in SAX J0635.2+0533. For the same reason also thermal emission from the neutron star due to crustal heating in previous outbursts cannot be considered. Moreover, based on the relation between quiescent luminosity and average accretion rate, = ( yr-1) erg s-1 (Tsygankov et al. 2017b), we would expect erg s-1, a value well below those observed in SAX J0635.2+0533. Therefore, we conclude that the source emission is most likely due to matter accretion. However, the very short pulse period of 33.8 ms puts several constraints of the accretion regime: on one hand, it hampers any possibility of accretion from a cold recombined disc, regardless of the magnetic field (Tsygankov et al. 2017a); on the other hand, it makes very unlikely the subsonic accretion, even in the case of plasma radiative cooling (Shakura et al. 2013). For a typical neutron star magnetic field () the low source luminosity can be explained only with a propeller regime, where the accreting matter is stopped by the centrifugal barrier at the magnetosphere: this is true not only for the low luminosity states, but even for the outburst observed in 1997.
A large flux variability is rather unusual for a low-luminosity BeXRB such as SAX J0635.2+0533, where the maximum flux observed in 1997 implies erg s-1. From this point of view, it is interesting to compare this source with other known BeXRBs, both in the Milky Way (MW) and in the Small Magellanic Cloud (SMC). In Fig. 6 we report the ratio as a function of , for several known BeXRBs: open circles represent the transient MW sources (Tsygankov et al. 2017b), while the crosses refer to the SMC sources reported by Haberl & Sturm (2016); in addition, filled circles represent the class of persistent, long spin period and low-luminosity BeXRBs (see e.g. La Palombara et al. 2012); finally, we report (as star) also the short-period ( = 69 ms) binary pulsar in the LMC A0538-66 (Skinner et al. 1982; Kretschmar et al. 2004). The figure shows that the variability properties as a function of maximum luminosity for the MW and MC sources are similar: in both cases the source dynamic range increases with the maximum luminosity, while the low-luminosity sources are also less variable (as in the case of the persistent sources). The lack of persistent high-luminosity sources (lower-right corner of the figure) is due to the transient nature of the BeXRBs which show a high luminosity only during the periastron passage of the NS (type I outbursts) or during a massive matter ejection from the Be star (type II outbursts).
In Fig. 6, SAX J0635.2+0533 (indicated as a filled square) is clearly an outlier: it shows the largest dynamic range () among the less luminous sources. Although the lack of SMC sources in the same region of the plot might be due to the difficulty of detecting low luminosity sources at such a large distance333for SMC sources, the minimum detected flux is erg cm-2 s-1, which implies erg s-1., this caveat does not apply to the sources in the Milky Way. This confirms that SAX J0635.2+0533 has rather peculiar properties at variance with those of the normal accretion-powered BeXRBs.

Acknowledgements.
We acknowledge the constant support of the Swift team for the execution of the source monitoring between 2015 and 2016.References
- Abdo et al. (2010) Abdo, A. A., Ackermann, M., Ajello, M., et al. 2010, ApJS, 188, 405
- Acero et al. (2015) Acero, F., Ackermann, M., Ajello, M., et al. 2015, ApJS, 218, 23
- Bradt et al. (1993) Bradt, H. V., Rothschild, R. E., & Swank, J. H. 1993, A&AS, 97, 355
- Campana et al. (1995) Campana, S., Stella, L., Mereghetti, S., & Colpi, M. 1995, A&A, 297, 385
- Chernyakova et al. (2009) Chernyakova, M., Neronov, A., Aharonian, F., Uchiyama, Y., & Takahashi, T. 2009, MNRAS, 397, 2123
- Chernyakova et al. (2006) Chernyakova, M., Neronov, A., Lutovinov, A., Rodriguez, J., & Johnston, S. 2006, MNRAS, 367, 1201
- Cusumano et al. (2000) Cusumano, G., Maccarone, M. C., Nicastro, L., Sacco, B., & Kaaret, P. 2000, ApJ, 528, L25
- Dubus (2015) Dubus, G. 2015, Comptes Rendus Physique, 16, 661
- Gehrels et al. (2004) Gehrels, N., Chincarini, G., Giommi, P., et al. 2004, ApJ, 611, 1005
- Haberl & Sturm (2016) Haberl, F. & Sturm, R. 2016, A&A, 586, A81
- Hartman et al. (1999) Hartman, R. C., Bertsch, D. L., Bloom, S. D., et al. 1999, ApJS, 123, 79
- Huang & Becker (2007) Huang, H. H. & Becker, W. 2007, A&A, 463, L5
- Kaaret et al. (2000) Kaaret, P., Cusumano, G., & Sacco, B. 2000, ApJ, 542, L41
- Kaaret et al. (1999) Kaaret, P., Piraino, S., Halpern, J., & Eracleous, M. 1999, ApJ, 523, 197
- Kretschmar et al. (2004) Kretschmar, P., Wilms, J., Staubert, R., Kreykenbohm, I., & Heindl, W. A. 2004, in ESA Special Publication, Vol. 552, 5th INTEGRAL Workshop on the INTEGRAL Universe, ed. V. Schoenfelder, G. Lichti, & C. Winkler, 329
- La Palombara et al. (2012) La Palombara, N., Sidoli, L., Esposito, P., Tiengo, A., & Mereghetti, S. 2012, A&A, 539, A82
- Mereghetti & La Palombara (2009) Mereghetti, S. & La Palombara, N. 2009, A&A, 504, 181
- Nazé (2009) Nazé, Y. 2009, A&A, 506, 1055
- Nazé et al. (2011) Nazé, Y., Broos, P. S., Oskinova, L., et al. 2011, ApJS, 194, 7
- Nolan et al. (2012) Nolan, P. L., Abdo, A. A., Ackermann, M., et al. 2012, ApJS, 199, 31
- Paredes-Fortuny et al. (2015) Paredes-Fortuny, X., Ribó, M., Bosch-Ramon, V., et al. 2015, A&A, 575, L6
- Scargle (1982) Scargle, J. D. 1982, ApJ, 263, 835
- Shakura et al. (2013) Shakura, N., Postnov, K., & Hjalmarsdotter, L. 2013, MNRAS, 428, 670
- Skinner et al. (1982) Skinner, G. K., Bedford, D. K., Elsner, R. F., et al. 1982, Nature, 297, 568
- Takata et al. (2014) Takata, J., Leung, G. C. K., Tam, P. H. T., et al. 2014, ApJ, 790, 18
- Tam et al. (2015) Tam, P. H. T., Li, K. L., Takata, J., et al. 2015, ApJ, 798, L26
- Tsygankov et al. (2017a) Tsygankov, S. S., Mushtukov, A. A., Suleimanov, V. F., et al. 2017a, ArXiv e-prints
- Tsygankov et al. (2017b) Tsygankov, S. S., Wijnands, R., Lutovinov, A. A., Degenaar, N., & Poutanen, J. 2017b, ArXiv e-prints
Appendix A Summary of the Swift and RXTE observations
| Observation | Start Observation | Net exposure | CR | Flux (0.3-10 keV) | Luminosity(a) (0.3-10 keV) |
|---|---|---|---|---|---|
| Number | date - UT | (ks) | ( cts s-1) | ( erg cm-2 s-1) | ( erg s-1) |
| 1 | 2015-11-12 - 00:44:56 | 9.3 | 1.4 | 1.0 | 0.6 |
| 2 | 2015-12-03 - 00:59:16 | 9.7 | 1.8 | 1.2 | 0.8 |
| 3 | 2015-12-17 - 03:05:54 | 6.0 | 1.7 | 1.2 | 0.8 |
| 4 | 2015-12-18 - 12:44:49 | 1.9 | 6.1 | 4.2 | 2.8 |
| 5 | 2015-12-22 - 02:44:50 | 3.8 | 6.5 | 4.4 | 2.9 |
| 6 | 2015-12-23 - 23:29:48 | 0.9 | 16.4 | 11.1 | 7.3 |
| 7 | 2015-12-31 - 16:23:48 | 5.2 | 333 | 222 | 151 |
| 8 | 2016-01-01 - 13:09:41 | 3.8 | 363 | 252 | 162 |
| 9 | 2016-01-24 - 03:39:37 | 5.2 | 303 | 212 | 131 |
| 10 | 2016-02-02 - 17:37:57 | 1.9 | 224 | 153 | 102 |
| 11 | 2016-02-04 - 09:27:21 | 5.0 | 323 | 222 | 141 |
| 12 | 2016-02-07 - 05:52:29 | 2.2 | 173 | 122 | 81 |
| 13 | 2016-02-09 - 20:37:15 | 0.4 | 2010 | 147 | 94 |
| 14 | 2016-02-10 - 05:43:32 | 1.8 | 93 | 62 | 41 |
| 15 | 2016-02-11 - 13:38:18 | 3.1 | 82 | 51 | 3.50.9 |
| 16 | 2016-02-14 - 11:50:20 | 7.1 | 51 | 3.20.7 | 2.10.4 |
| 17 | 2016-02-21 - 16:07:04 | 8.1 | 152 | 101 | 6.70.7 |
| 18 | 2016-02-28 - 01:12:03 | 2.9 | 41 | 31 | 1.90.7 |
| 19 | 2016-03-02 - 01:00:09 | 1.5 | 52 | 31 | 21 |
| 20 | 2016-03-03 - 04:09:49 | 0.8 | 13 | 9 | 6 |
| 21 | 2016-03-04 - 05:38:50 | 4.6 | 52 | 31 | 2.30.7 |
| 22 | 2016-03-24 - 15:32:05 | 3.4 | 8 | 6 | 4 |
| 23 | 2016-03-30 - 00:45:50 | 4.2 | 21 | 1.40.7 | 0.90.4 |
| 24 | 2016-04-06 - 08:03:15 | 1.7 | 9 | 6 | 4 |
| 25 | 2016-04-07 - 01:38:57 | 2.1 | 42 | 31 | 1.90.8 |
| 26 | 2016-04-14 - 12:15:17 | 3.7 | 92 | 61 | 4.10.8 |
| 27 | 2016-04-20 - 05:26:58 | 0.5 | 146 | 94 | 63 |
| 28 | 2016-04-21 - 15:15:29 | 0.1 | - | - | - |
| 29 | 2016-04-27 - 00:13:19 | 3.6 | 82 | 61 | 3.70.8 |
| 30 | 2016-05-04 - 00:03:16 | 3.2 | 41 | 31 | 2.00.7 |
| 31 | 2016-05-12 - 02:28:06 | 4.4 | 5 | 4 | 2 |
| 32 | 2016-08-16 - 06:16:08 | 3.9 | 72 | 41 | 2.90.7 |
| 33 | 2016-08-23 - 04:06:43 | 5.0 | 142 | 101 | 6.40.9 |
(a) Corrected for the absorption, and assuming a distance of 5 kpc.
| Observation | Observation | Start Observation | Net exposure | Flux (2-10 keV) | Luminosity(a) (2-10 keV) |
|---|---|---|---|---|---|
| number | ID | date - UT | (s) | ( erg cm-2 s-1) | ( erg s-1) |
| 01 | 40131-01-01-00 | 1999-08-25 22:10:06.8 | 2896 | 6.60.2 | 22.0 0.7 |
| 02 | 40131-01-02-00 | 1999-08-26 22:06:28.2 | 2880 | 8.6 | 28.7 |
| 03 | 40131-01-03-00 | 1999-08-27 23:43:50.6 | 2640 | 6.4 | 21.3 |
| 04 | 40131-01-04-00 | 1999-08-28 17:15:50.1 | 2800 | 3.9 | 13.0 |
| 05 | 40131-01-05-00 | 1999-08-30 01:12:46.7 | 2368 | 4.9 | 16.3 |
| 06 | 40131-01-06-00 | 1999-08-30 21:57:38.6 | 2944 | 2.5 | 8.3 |
| 07 | 40131-01-07-00 | 1999-09-01 20:35:06.1 | 2592 | 2.2 | 7.3 |
| 08 | 40131-01-08-00 | 1999-09-02 21:48:36.9 | 2928 | 4.0 | 13.3 |
| 09 | 40131-01-09-00 | 1999-09-03 23:32:07.3 | 2816 | 2.80.2 | 9.3 0.7 |
| 10 | 40131-01-10-00 | 1999-09-04 21:49:58.9 | 3120 | 2.50.2 | 8.3 0.7 |
| 11 | 40131-01-11-00 | 1999-09-06 21:51:07.2 | 3120 | 4.5 | 15.0 |
| 12 | 40131-01-12-00 | 1999-09-07 21:42:20.2 | 3184 | 4.80.3 | 16.0 1.0 |
| 13 | 40131-01-13-00 | 1999-09-08 21:47:07.0 | 3168 | 4.30.2 | 14.3 0.7 |
(a) Corrected for the absorption, and assuming a distance of 5 kpc.
| Observation | Observation | Start Observation | Net exposure | Flux (2-10 keV) | Luminosity(a) (2-10 keV) |
|---|---|---|---|---|---|
| number | ID | date - UT | (ks) | ( erg cm-2 s-1) | ( erg s-1) |
| 14 | 50085-01-01-00 | 2000-05-26 04:18:08.9 | 6064 | 3.60.2 | 12.0 0.7 |
| 15 | 50085-01-02-00 | 2000-05-27 02:42:24.2 | 6480 | 3.20.2 | 10.7 0.7 |
| 16 | 50085-01-03-00 | 2000-05-28 02:58:28.4 | 5704 | 3.20.2 | 10.7 0.7 |
| 17 | 50085-01-04-00 | 2000-05-29 04:09:25.3 | 3248 | 3.0 | 10.0 |
| 18 | 50085-01-05-00 | 2000-05-30 05:36:15.3 | 2832 | 3.4 | 11.3 |
| 19 | 50085-01-06-00 | 2000-11-24 18:36:26.8 | 1960 | 4.5 | 15.0 |
| 20 | 50085-01-07-00 | 2000-11-25 16:47:27.2 | 2488 | 3.5 | 11.7 |
| 21 | 50085-01-08-00 | 2000-11-26 10:18:51.3 | 3104 | 3.9 | 13.0 |
| 22 | 50085-01-09-00 | 2000-11-27 11:48:54.7 | 2352 | 3.9 | 13.0 |
| 23 | 50085-01-10-00 | 2000-11-28 16:28:57.8 | 2016 | 3.5 | 11.7 |
| 24 | 50085-01-11-00 | 2000-11-29 08:24:00.9 | 2432 | 3.2 | 10.7 |
| 25 | 50085-01-12-00 | 2000-11-30 16:18:04.6 | 2000 | 3.2 | 10.7 |
| 26 | 50085-01-13-00 | 2000-12-01 08:10:08.8 | 3264 | 3.20.3 | 10.7 1.0 |
| 27 | 50085-01-14-00 | 2000-12-02 12:51:11.5 | 3024 | 3.00.3 | 10.0 1.0 |
| 28 | 50085-01-15-00 | 2000-12-03 11:08:20.8 | 2664 | 2.90.3 | 9.7 1.0 |
| 29 | 50085-01-16-00 | 2000-12-04 15:50:21.4 | 2032 | 2.7 | 9.0 |
| 30 | 50085-01-17-00 | 2000-12-05 14:04:06.8 | 2448 | 3.4 | 11.3 |
| 31 | 50085-01-18-00 | 2000-12-06 15:36:32.0 | 2544 | 2.60.3 | 8.7 1.0 |
| 32 | 50085-01-19-00 | 2000-12-07 17:07:44.5 | 2448 | 2.7 | 9.0 |
| 33 | 50085-01-20-00 | 2000-12-08 15:22:41.7 | 2800 | 2.50.3 | 8.3 1.0 |
| 34 | 50085-01-21-00 | 2000-12-09 16:53:56.8 | 2528 | 2.7 | 9.0 |
| 35 | 50085-01-22-00 | 2000-12-10 15:07:56.1 | 2880 | 2.50.3 | 8.3 1.0 |
| 36 | 50085-01-23-00 | 2000-12-11 16:39:04.3 | 2608 | 3.20.3 | 10.7 1.0 |
| 37 | 50085-01-24-00 | 2000-12-12 14:54:09.2 | 2944 | 2.70.3 | 9.0 1.0 |
| 38 | 50085-01-25-00 | 2000-12-13 10:01:16.3 | 2704 | 2.7 | 9.0 |
| 39 | 50085-01-26-00 | 2000-12-14 14:44:05.3 | 3040 | 3.10.3 | 10.3 1.0 |
| 40 | 50085-01-27-00 | 2000-12-15 16:10:35.3 | 2784 | 3.3 | 11.0 |
| 41 | 50085-01-28-00 | 2000-12-16 17:41:46.2 | 2528 | 3.2 | 10.7 |
| 42 | 50085-01-29-00 | 2000-12-17 20:46:32.2 | 1768 | 3.40.4 | 11.3 1.3 |
| 43 | 50085-01-30-00 | 2000-12-18 17:27:43.8 | 2608 | 3.20.4 | 10.7 1.3 |
| 44 | 50085-01-31-00 | 2000-12-19 18:53:40.1 | 2336 | 3.10.3 | 10.3 1.0 |
| 45 | 50085-01-32-00 | 2000-12-20 17:07:39.4 | 2672 | 3.10.3 | 10.3 1.0 |
| 46 | 50085-01-33-00 | 2000-12-21 18:40:44.3 | 2416 | 3.0 | 10.0 |
| 47 | 50085-01-34-00 | 2000-12-22 16:55:42.2 | 2736 | 3.4 | 11.3 |
| 48 | 50085-01-35-00 | 2000-12-23 20:02:39.6 | 2664 | 2.60.3 | 8.7 1.0 |
| 49 | 50085-01-36-00 | 2000-12-24 18:20:17.4 | 3248 | 3.10.3 | 10.3 1.0 |
| 50 | 50085-01-37-00 | 2000-12-27 16:19:45.7 | 2896 | 3.20.3 | 10.7 1.0 |
| 51 | 50085-01-38-00 | 2000-12-30 12:47:45.9 | 1528 | 3.9 | 13.0 |
| 52 | 50085-01-38-01 | 2000-12-30 14:31:56.9 | 1608 | 3.40.4 | 11.3 1.3 |
| 53 | 50085-01-39-00 | 2001-01-01 12:34:12.9 | 3296 | 3.80.3 | 12.7 1.0 |
| 54 | 50085-01-40-00 | 2001-01-02 16:21:06.0 | 4512 | 3.30.3 | 11.0 1.0 |
| 55 | 50085-01-41-00 | 2001-01-03 16:17:06.7 | 2728 | 3.0 | 10.0 |
| 56 | 50085-01-42-00 | 2001-01-04 15:32:15.4 | 2736 | 3.3 | 11.0 |
| 57 | 50085-01-40-01 | 2001-01-05 07:24:44.6 | 1872 | 3.10.4 | 10.3 1.3 |
| 58 | 50085-01-43-00 | 2001-01-05 10:48:27.6 | 2112 | 2.90.4 | 9.7 1.3 |
| 59 | 50085-01-44-00 | 2001-01-06 10:24:52.4 | 2912 | 2.1 | 7.0 |
| 60 | 50085-01-45-00 | 2001-01-07 08:38:26.6 | 2448 | 1.5 | 5.0 |
| 61 | 50085-01-46-00 | 2001-01-08 08:31:10.3 | 2416 | 1.3 | 4.3 |
| 62 | 50085-01-47-00 | 2001-01-09 14:56:14.5 | 2848 | 1.7 | 5.7 |
| 63 | 50085-01-48-00 | 2001-01-10 09:57:12.7 | 2816 | 1.30.2 | 4.3 0.7 |
| 64 | 50085-01-49-00 | 2001-01-11 08:15:47.5 | 2368 | 1.5 | 5.0 |
| 65 | 50085-01-50-00 | 2001-01-14 07:49:49.7 | 2336 | 2.3 | 7.7 |
| 66 | 50085-01-51-00 | 2001-01-17 13:57:52.7 | 2000 | 2.8 | 9.3 |
| 67 | 50085-01-52-00 | 2001-01-22 13:24:36.9 | 2000 | 2.1 | 7.0 |