Determination of spin relaxation times in heavy metals via 2nd harmonic spin injection magnetoresistance
Abstract
Abstract: In tunnel junctions between ferromagnets and heavy elements with strong spin orbit coupling the magnetoresistance is often dominated by tunneling anisotropic magnetoresistance (TAMR). This makes conventional DC spin injection techniques impractical for determining the spin relaxation time (). Here, we show that this obstacle for measurements of can be overcome by 2nd harmonic spin-injection-magnetoresistance (SIMR). In the 2nd harmonic signal the SIMR is comparable in magnitude to TAMR, thus enabling Hanle-induced SIMR as a powerful tool to directly determine . Using this approach we determined the spin relaxation time of Pt and Ta and their temperature dependences. The spin relaxation in Pt seems to be governed by Elliott-Yafet mechanism due to a constant resistivityspin relaxation time product over a wide temperature range.
pacs:
72.25.Rb, 72.25.Ba, 73.50.Bk, 73.40.RwThe large applied potential of spin-orbit-torques for magnetic random access memory has stimulated intensive interest in investigating spin orbit coupling (SOC) in heavy metals such as Pt and Ta Avci et al. (2012); Finocchio et al. (2013); Martinez et al. (2013); Sim et al. (2014); Ong et al. (2015); Haney et al. (2013); Meng et al. (2016); Huang et al. (2012); Hoffmann and Bader (2015); Kong et al. (2016); Zhang et al. (2016). Their spin Hall angle (), spin diffusion length () and spin relaxation time (), which influence switching efficiency are important parameters for determining their effectiveness, but especially the latter two are experimentally hard to assess. Accurate determination of could also help to identify the spin relaxation mechanisms Žutić et al. (2004). Though and have been measured by spin pumping Zhang et al. (2013); Mosendz et al. (2010a); Vlaminck et al. (2013); Mosendz et al. (2010b); Rojas-Sanchez et al. (2014) and 2nd harmonic Hall measurement Woo et al. (2014); Fan et al. (2014); Reichlova et al. (2015), of Pt and Ta is rarely reported. In principle, , with being the diffusion constant, which is also difficult to determine independently.
Electron spin resonance (ESR) has been a standard technique to measure the spin relaxation time of bulk light metals Monod and Beuneu (1979). However, it is not suitable for ultrathin films Schultz and Latham (1965); Lewis and Carver (1967). In addition, Elezzabi et al. Elezzabi et al. (1996) developed a time-resolved optical technique to directly measure the spin relaxation process in Au to be ps. However, this method is not suitable for heavy metals such as Pt, Ta and W with short Riego et al. (2016). Recently, DyakonovDyakonov (2007) theoretically, then Vélez et al. Vélez et al. (2016) and Wu et al. Wu et al. (2016) experimentally demonstrated a so-called Hanle magnetoresistance (MR) effect in Pt and Ta: a spin accumulation at the sample boundaries caused by the spin Hall effect is dephased by a magnetic field via the Hanle effect, which results in an additional positive MR. This electrical method can be applied to estimate from the magnetic field dependenceVélez et al. (2016); Wu et al. (2016). Using this approach 1.9 ps was determined for Pt/\ceSiO2 and 0.61 ps for Pt/YIG Wu et al. (2016).
In fact, spin injection experiments in nonlocal spin valves Johnson and Silsbee (1985); Jedema et al. (2001, 2002); Ku et al. (2006); van’t Erve et al. (2007); Ji et al. (2004, 2006) and 3-terminal geometries Dash et al. (2009); Jeon et al. (2011); Lou et al. (2006); Uemura et al. (2012); Dash et al. (2011) are both powerful tools in measuring in metals and semiconductors. In these experiments, ferromagnetic layer (FM)/tunnel barrier/nonmagnetic layer (NM) junctions are adopted to both inject a non-equilibrium spin accumulation and simultaneously determine their magnitude. These measurement were used to determine spin relaxation times in a wide variety of materials, e.g., =55 - 285 ps for heavily doped silicon Dash et al. (2011); 1 ns for graphene/BN Singh et al. (2016); =110 ps for aluminum Johnson and Silsbee (1985), =22 ps for copper Garzon et al. (2005) and =45 ps for gold Ku et al. (2006).
However, it is impractical to apply these spin injection experiments to measure in heavy metals with strong SOC for at least two reasons. First, in this case is so short (about several nanometers) that the preparation of nonlocal spin valves with comparable dimensions is beyond current lithography capabilities. Second, the real contact resistance is , where and are the contact resistance induced by spin injection (SI) and the original contact resistance without , respectively. Here equals to and the spin resistance in the NM layer is defined as . and are the resistivity and spin relaxation length of NM, respectively. For this discussion we ignore the influence of spin resistance in FM on due to the small values of in FM. Because for metals, . As one increases a field perpendicular to the spin polarization in the NM, the spin accumulation dephases, resulting in a vanishing due to the Hanle effect. This gives rise to a . This negative spin-injection-induced MR (SIMR) has been utilized in 3-terminal geometries to measure in semiconductors Dash et al. (2009); Jeon et al. (2011); Lou et al. (2006); Uemura et al. (2012) but is negligible in metallic systems, since by several orders of magnitude. Besides, can also exhibit a field dependence due to SOC in FM/Barrier/NM junctions Matos-Abiague and Fabian (2009); Txoperena et al. (2013). This so-called tunneling anisotropy MR (TAMR) Gould et al. (2004) further complicates the analysis.
In this Letter, we will show that even with a 3-terminal geometry, SIMR can be clearly observed by 2nd harmonic voltage measurements, since TAMR only dominates the 1st harmonic voltages. We adopted this method to determine in Pt and Ta and also their corresponding temperature dependences.
First we discuss the basic concept of these measurements. The tunneling conductance is composed by counterparts for opposite spin channels, . Here we have already neglected in the contact resistance due to the fact that . Spin injection into the NM or spin extraction from NM induces a non-equilibrium spin accumulation in NM, which increases or decreases Fermi levels of opposite spin channels. This can further lead to a change of by . The spin accumulation is given by , where and are the tunneling spin polarization and current density across the junction Fert and Jaffres (2001). Thus with . The voltage across the junction is then
| (1) |
Here is the contact conductance at zero current, or with being the contact resistance at zero current. Note that does not contain SIMR. Assuming that and , results in , where and are the contact resistance and spin resistance at and , respectively. This equation can be further reduced considering TAMR1 and SIMR1:
| (2) |
In practice, an AC current satisfying was selected to make the above Taylor expansion reasonable. Thus has no explicit dependence on SIMR while has a dependence on both SIMR and 2TAMR. They also differ in phase by 90∘. We would expect that TAMR dominates in while SIMR becomes comparable to the TAMR and thus observable in as shown in the following experiments.

Stacks of \ceSiO2//Ta(10) or Pt(10)/MgO(2)/\ceCo40Fe40B20(4)/Ta(5)/Ru(7) (thickness in nm) provided by Singulus Technologies AG were deposited via magnetron-sputtering and then post-annealed with a magnetic field of 1 along the -axis at 300 oC for 1 hour to induce an easy axis along the -axis. - curves acquired by vibrating sample magnetometer (Microsense) showed in-plane magnetic anisotropy for both Ta/MgO/CoFeB and Pt/MgO/CoFeB stacks [Fig. 1(a) and (b)]. The anisotropy field of each sample is about 15 kOe along the -axis, while the easy axis is along the -axis. smaller than 1 kOe is sufficient to align the magnetization along the easy axis.
The extended films were then processed into magnetic tunneling junctions by ultraviolet lithography and argon ion etching. The junctions had one top electrode (E1) and three bottom ones (E2, E3 and E4) [Fig. 1(c) and (d)]. The size of the junctions was 6 6 . Ta/MgO/CoFeB or Pt/MgO/CoFeB junctions were surrounded by MgAlOx for protection and also for isolating E1 from the remaining electrodes. Magnetotransport properties were measured in a physical property measurement system (Quantum Design-9T). To measure the inverse spin Hall effect (ISHE) of the bottom electrodes, an AC current with sine wave and Hz was applied between E1 and E3 using a Keithley 6221 and the 1st harmonic voltage between E2 and E4 was firstly pre-amplified (Stanford Research, SR560) and then picked up by a lock-in amplifier (SR830) [Fig. 1(d)].
In this setup, spin-polarized current was perpendicularly injected from the FM to the NM layer. Their spin orientation was along the -axis at 500 Oe. Then a voltage in the open circuit can be detected along the -axis due to the ISHE. The field dependences of the 1st harmonic voltage between E2 and E4 in Ta and Pt junctions are illustrated in Fig. 1(e) and (f). The sign of reverses as expected with reversed sign of . has opposite signs in the Ta and Pt due to their opposite Hahn et al. (2013); Hoffmann (2013), which indicates successful spin injection into the bottom heavy metal layer. Similar ISHE behaviors in both junctions have also been observed near room temperature. The maximum of Ta and Pt junctions is about 1 and 0.1 at 300 K, which is in the same order of magnitude as in Ref. Liu et al. (2014).
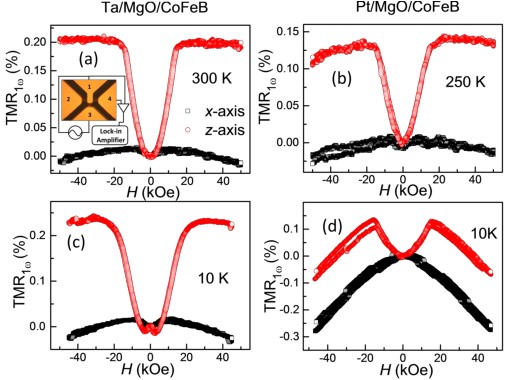
3-terminal MR measurements are further performed on both Ta and Pt junctions. We have first detected the 1st harmonic voltage between E1 and E4 with an AC current applied between E1 and E3 [inset of Fig. 2(a)]. TMR1ω is defined as [-]/ and its field dependences is shown in Fig. 2(a)-(d). The MR originates from the tunneling junction instead of the anisotropy magnetoresistance (AMR) of the CoFeB layer. Direct measurements of AMR of the Ta and Pt showed negligible field dependence in the 1st harmonic measurements. AMR only appears in the DC measurement, whose value is negligibly small, only less than 0.05 at 10 Kref . Except Thus, the TMR is mainly attributed to anisotropic tunneling magnetoresistance (TAMR) of the CoFeB/MgO/heavy metal junctions, and we use TAMR instead of TMR in the following analysis.
At high temperature, TAMR first quadratically increases as increases from zero in both Ta and Pt junctions [Fig.2(a) and (b)] and later gradually saturates at 0.20 for Ta and 0.14 for Pt junction as approaches 15 kOe which is also the anisotropy field of the CoFeB layer. Further increasing leads to a MR reduction for both junctions. When is applied, TAMR increases only by about 0.01 and then decreases gradually toward the negative MR. Note that TAMR is much larger than TAMR. aligns the magnetization from in-plane to out-of-plane, which subsequently changes the density of state of the interfacial FM layer via SOC and results in TAMR as predicted theoretically Gould et al. (2004); Saito et al. (2005). The phenomenon TAMRTAMR is consistent with Ref.Hatanaka et al. (2015), since keeps the magnetization along the easy axis, and consequently TAMR varies little.
Similar behaviors are also observed at 10 K, except for larger saturation fields and slightly larger TAMR values [Fig. 2(c) and (d)]. The negative MR ,which depends on applied field instead of magnetization, is also observed at 10 K. Its origin is still unknown and beyond the scope of this study. The only remarkable difference between 10 K and high temperature is that a small negative MR (about -0.014) appears at low in the Ta junction [Fig.2(c)]. This negative MR exhibits a similar field dependence as the Hanle-effect-induced SIMR discussed below. Thus we attribute it to spin injection into Ta. This SIMR1ω should have been negligibly small due to the fact . In fact, it turns out to be unobservable in the Pt junction or at high temperatures. It might be possible that inhomogeneities of the MgO layer result in a significant reduction of the effective tunneling area and smaller in the Ta junction. This may lead to a reemerging of SIMR1ω although SIMR1ω is still one order smaller than TAMR. Inhomogeneous current distribution due to the resistance of the nonmagnetic layer within the junction area could reduce the measured tunneling resistance below the real tunneling resistance by about 10.8 and 4.5 for Ta and Pt junctions respectively due to device geometry as well as inhomogeneous current distribution within the junction Pedersen and Vernon (1967); Moodera et al. (1996). However, this would not affect the injected spins and their dephasing process in the heavy metal layers. Therefore, this resistance adjustment would not physically influence the field dependence of the TAMR and the SIMR effects which is the basis of estimating the spin relaxation times.
was detected in the same setup as shown in the inset of Fig. 2(a). The only difference is that the 2nd harmonic voltage with 90∘ phase shift was measured with the lock-in amplifier. As shown in Eq. (2), SIMR should be comparable to TAMR within a factor of 2 for the 2nd harmonic signal. Thus this method renders Hanle and inverted Hanle effect signals induced by SIMR detectable even in the presence of a TAMR background (Fig.3).
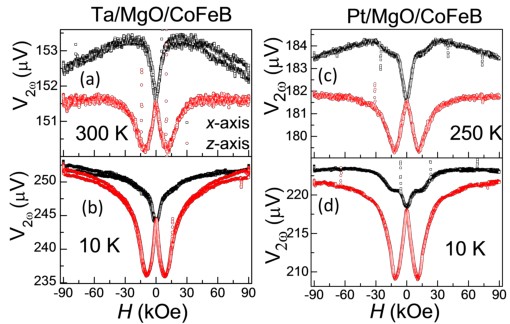
The field dependence of at 300 K or 250 K for Ta and Pt junction is shown in Fig. 3(a) and (b). For small , the magnetization is still aligned along the easy axis. An AC current injects (extracts) spins into (from) NM and leads to a non-equilibrium spin accumulation, which conversely influences tunneling resistance and contributes an additional . A vertical can dephase the spin accumulation via the Hanle effect and therefore diminish the additional , leading to a negative MR with a Lorentzian shape in the 2nd harmonic signal. This Hanle dephasing is the same as established by Silsbee Johnson and Silsbee (1988) for DC measurement. It is worth noting that TAMR2ω and SIMR2ω contribute to a positive and negative MR, respectively. In addition, TAMR2ω has a dependence at low field according to our results in Fig. 2, while SIMR2ω exhibits a Lorentzian-shape dependence. By fitting vs. curves with a Lorentzian function plus a function, we can obtain a spin relaxation time with the electron charge , electron mass and being the half width at half maximum of the Lorentzian fitting. is (7.81.6) ps at 300 K and (13.10.6) ps at 10 K for Ta [Fig.3(a) and (b)]. By further increasing beyond 10 kOe, increases due to both tilting of magnetization and the concomitant TAMR contribution.
In contrast, avoids dephasing of the spin polarization along , and therefore extends spin relaxation process and finally causes a positive MR in small field. This picture accounts for the inverted Hanle effect Dash et al. (2011). A similar positive SIMR also occurs for the 2nd harmonic signal (Fig.3). Besides, exhibits a dependence at high fields, especially at 10 K, but the origin of this field dependence is unclear at this point. The Hanle signal in Fig.3 (c) and (d) results in (5.01.5) ps at 250 K and (7.30.6) ps at 10 K for Pt. The inverted Hanle SIMR shows similar behavior for Ta. More than 4 devices are measured to estimate the for each type of stacks. The data for the other devices are attached in the Supplementary Informationref .
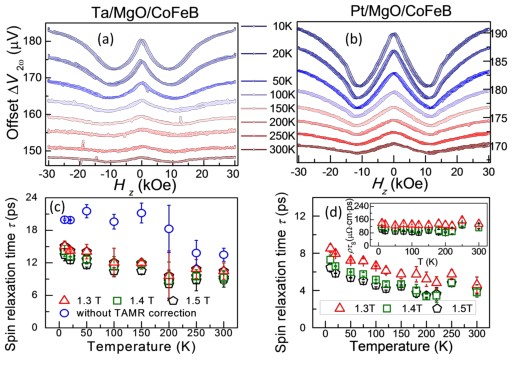
In order to investigate the temperature () dependence of , we have conducted the 2nd harmonic SIMR measurement in a Hanle geometry at different temperatures [Fig.4(a) and (b)]. As decreases from 300 K to 10 K, the Hanle-effect-induced grows significantly by nearly one order of magnitude. In order to examine whether the field range for selecting the data affects , we have tried different ranges (13 kOe, 14 kOe and 15 kOe) for the fitting. The dependence is basically the same for different fitting ranges. Their variance is less than 2 ps for both materials. Taking the 14 kOe fitting range, in Ta gradually decays from (13.10.6) ps at 10 K to (7.81.6) ps at 300 K. In contrast, if the TAMR correction is ignored in the fitting stays at 20 ps below 150 K and then decays to 14 ps at 300 K. These values are not only 50 higher than those with TAMR correction but also exhibits an unreasonable dependence. Thus the TAMR correction is indispensable. of Pt and Ta is about 10 ps or below. These values are 1-3 orders smaller than in light metals or semiconductors, consistent with the trend that elements with larger atomic number have stronger SOC. is about half of at all temperatures in our experiment and much smaller than of 45 ps. Here =(5.01.5) ps at 250 K is about twice of 1.9 ps measured by Hanle MR, which might be caused by lower resistivity in the former Pt and different film thickness in the two experiments. In our experiment, =24.4 at 300 K, while it is 58 in Ref. Wu et al. (2016). appears to be a constant for these two samples. The dependence of is also measured. For resistivity measurement, the top structure MgO/CFB/capping layers in the Pt/MgO/CFB stacks is etched away. decreases weakly with decreasing temperature and in Pt is nearly a constant from 300 K to 10 K for all the fitting ranges [inset in Fig.4(d)]. The momentum relaxation time is inversely proportional to . Thus is also a constant, which indicates that the spin relaxation in Pt is governed by Elliott-Yafet mechanism Žutić et al. (2004). We also applied a THz technique Jin et al. (2015) to directly measure momentum relaxation time and resistivity of Pt with 30 nm thickness, which gives =(53) fs and =16 at 300 K. Assuming that is proportional to 1/, in Pt/MgO/CFB is thus around 2.7 fs. Therefore the spin flip probability of each scattering is around 710-4 for Pt at 300 K.
Our is about 342 at 300 K, much larger than those reported for the resistivity of -phase and even -phase Ta Read and Altman (1965); Clevenger et al. (1992), which might be due to oxidation of Ta after the top structure is etched. Therefore vs. is not used here for examining the spin relaxation mechanism.
In conclusion, TAMR1ω dominates the 1st harmonic 3-terminal MR measurement while SIMR2ω becomes significant compared to the TAMR2ω background and turns out to be much easier measured in the 2nd than in the 1st harmonic signal. This renders conventional 3-terminal FM/barrier/NM devices suitable for directly measuring the spin relaxation time of heavy metals without complications from proximity effects Guo et al. (2014); Vogel et al. (1997); Wilhelm et al. (2000); Zhang et al. (2015) that occur, when the heavy metal is in direct contact with a ferromagnet. ISHE is also observed, which proves successful spin injection into Ta and Pt. By fitting Hanle curves with a Lorentzian function plus a parabolic TAMR background, we have obtained of Ta and Pt. The for both materials exhibits a small increase from 300 K to 10 K, such that is about (7.81.6) ps and (5.01.5) ps for Ta and Pt at high temperature while it is about (13.10.6) ps and (7.30.6) ps at 10 K, respectively. Since stays constant at all temperatures, the spin relaxation in Pt seems to be dominated by the Elliott-Yafet mechanism. This experimental approach provides an electrical manner to directly quantify spin relaxation time of heavy metals, which have been elusive from conventional SIMR or optical measurements. Furthermore, there is no physical limitation for this method to be generalized to other light metals and semiconductors.
I acknowledgments
Acknowledgements.
This work was supported by the 863 Plan Project of Ministry of Science and Technology (MOST) (Grant No. 2014AA032904), the MOST National Key Scientific Instrument and Equipment Development Projects [Grant No.2011YQ120053], the National Natural Science Foundation of China (NSFC) [Grant No. 11434014, 51229101, 11404382] and the Strategic Priority Research Program (B) of the Chinese Academy of Sciences (CAS) [Grant No.XDB07030200]. The work from Axel Hoffmann contributing to experiment conception and data analysis was also supported by the U.S. Department of Energy, Office of Science, Basic Energy Sciences, Materials Science and Engineering Division. X. M. Liu and Z. M. Jin have contributed to THz measurement. The annealed raw films were provided by Singulus Technologies AG.References
- Avci et al. (2012) C. O. Avci, K. Garello, I. M. Miron, G. Gaudin, S. Auffret, O. Boulle, and P. Gambardella, Appl. Phys. Lett. 100, 212404 (2012).
- Finocchio et al. (2013) G. Finocchio, M. Carpentieri, E. Martinez, and B. Azzerboni, Appl. Phys. Lett. 102, 212410 (2013).
- Martinez et al. (2013) E. Martinez, S. Emori, and G. S. D. Beach, Appl. Phys. Lett. 103, 072406 (2013).
- Sim et al. (2014) C. H. Sim, J. C. Huang, M. Tran, and K. Eason, Appl. Phys. Lett. 104, 012408 (2014).
- Ong et al. (2015) P. V. Ong, N. Kioussis, P. K. Amiri, K. L. Wang, and G. P. Carman, J. Appl. Phys. 117, 17B518 (2015).
- Haney et al. (2013) P. M. Haney, H. W. Lee, K. J. Lee, A. Manchon, and M. D. Stiles, Phys. Rev. B 88, 214417 (2013).
- Meng et al. (2016) K. K. Meng, J. Miao, X. G. Xu, J. X. Xiao, J. H. Zhao, and Y. Jiang, Phys. Rev. B 93, 060406 (2016).
- Huang et al. (2012) S. Y. Huang, X. Fan, D. Qu, Y. P. Chen, W. G. Wang, J. Wu, T. Y. Chen, J. Q. Xiao, and C. L. Chien, Phys. Rev. Lett. 109, 107204 (2012).
- Hoffmann and Bader (2015) A. Hoffmann and S. D. Bader, Phys. Rev. Appl. 4, 047001 (2015).
- Kong et al. (2016) W. J. Kong, Y. R. Ji, X. Zhang, H. Wu, Q. T. Zhang, Z. H. Yuan, C. H. Wan, X. F. Han, T. Yu, K. Fukuda, H. Naganuma, and M. J. Tung, Appl. Phys. Lett. 109, 132402 (2016).
- Zhang et al. (2016) X. Zhang, C. H. Wan, Z. H. Yuan, Q. T. Zhang, H. Wu, L. Huang, W. J. Kong, C. Fang, U. Khan, and X. F. Han, Phys. Rev. B 94, 174434 (2016).
- Žutić et al. (2004) I. Žutić, J. Fabian, and S. Das Sarma, Rev. Mod. Phys. 76, 323 (2004).
- Zhang et al. (2013) W. Zhang, V. Vlaminck, J. E. Pearson, R. Divan, S. D. Bader, and A. Hoffmann, Appl. Phys. Lett. 103, 242414 (2013).
- Mosendz et al. (2010a) O. Mosendz, V. Vlaminck, J. E. Pearson, F. Y. Fradin, G. E. W. Bauer, S. D. Bader, and A. Hoffmann, Phys. Rev. B 82, 214403 (2010a).
- Vlaminck et al. (2013) V. Vlaminck, J. E. Pearson, S. D. Bader, and A. Hoffmann, Phys. Rev. B 88, 064414 (2013).
- Mosendz et al. (2010b) O. Mosendz, J. E. Pearson, F. Y. Fradin, G. E. W. Bauer, S. D. Bader, and A. Hoffmann, Phys. Rev. Lett. 104, 046601 (2010b).
- Rojas-Sanchez et al. (2014) J. C. Rojas-Sanchez, N. Reyren, P. Laczkowski, W. Savero, J. P. Attane, C. Deranlot, M. Jamet, J. M. George, L. Vila, and H. Jaffres, Phys. Rev. Lett. 112, 106602 (2014).
- Woo et al. (2014) S. Woo, M. Mann, A. J. Tan, L. Caretta, and G. S. D. Beach, Appl. Phys. Lett. 105, 212404 (2014).
- Fan et al. (2014) Y. B. Fan, P. Upadhyaya, X. F. Kou, M. R. Lang, S. Takei, Z. X. Wang, J. S. Tang, L. He, L. T. Chang, M. Montazeri, G. Q. Yu, W. J. Jiang, T. X. Nie, R. N. Schwartz, Y. Tserkovnyak, and K. L. Wang, Nat. Mater. 13, 699 (2014).
- Reichlova et al. (2015) H. Reichlova, D. Kriegner, V. Holy, K. Olejnik, V. Novak, M. Yamada, K. Miura, S. Ogawa, H. Takahashi, T. Jungwirth, and J. Wunderlich, Phys. Rev. B 92, 165424 (2015).
- Monod and Beuneu (1979) P. Monod and F. Beuneu, Phys. Rev. B 19, 911 (1979).
- Schultz and Latham (1965) S. Schultz and C. Latham, Phys. Rev. Lett. 15, 148 (1965).
- Lewis and Carver (1967) R. B. Lewis and T. R. Carver, Phys. Rev. 155, 309 (1967).
- Elezzabi et al. (1996) A. Y. Elezzabi, M. R. Freeman, and M. Johnson, Phys. Rev. Lett. 77, 3220 (1996).
- Riego et al. (2016) P. Riego, S. Vélez, J. M. Gomez-Perez, J. A. Arregi, L. E. Hueso, F. Casanova, and A. Berger, Appl. Phys. Lett. 109, 172402 (2016).
- Dyakonov (2007) M. I. Dyakonov, Phys. Rev. Lett. 99, 126601 (2007).
- Vélez et al. (2016) S. Vélez, V. N. Golovach, A. Bedoya-Pinto, M. Isasa, E. Sagasta, M. Abadia, C. Rogero, L. E. Hueso, F. S. Bergeret, and F. Casanova, Phys. Rev. Lett. 116, 016603 (2016).
- Wu et al. (2016) H. Wu, X. Zhang, C. H. Wan, B. S. Tao, L. Huang, W. J. Kong, and X. F. Han, Phys. Rev. B 94, 174407 (2016).
- Johnson and Silsbee (1985) M. Johnson and R. H. Silsbee, Phys. Rev. Lett. 55, 1790 (1985).
- Jedema et al. (2001) F. J. Jedema, A. T. Filip, and B. J. van Wees, Nature 410, 345 (2001).
- Jedema et al. (2002) F. J. Jedema, H. B. Heersche, A. T. Filip, J. J. A. Baselmans, and B. J. van Wees, Nature 416, 713 (2002).
- Ku et al. (2006) J. H. Ku, J. Chang, H. Kim, and J. Eom, Appl. Phys. Lett. 88, 172510 (2006).
- van’t Erve et al. (2007) O. M. J. van’t Erve, A. T. Hanbicki, M. Holub, C. H. Li, C. Awo-Affouda, P. E. Thompson, and B. T. Jonker, Appl. Phys. Lett. 91, 212109 (2007).
- Ji et al. (2004) Y. Ji, A. Hoffmann, J. S. Jiang, and S. D. Bader, Appl. Phys. Lett. 85, 6218 (2004).
- Ji et al. (2006) Y. Ji, A. Hoffmann, J. E. Pearson, and S. D. Bader, Appl. Phys. Lett. 88, 052509 (2006).
- Dash et al. (2009) S. P. Dash, S. Sharma, R. S. Patel, M. P. de Jong, and R. Jansen, Nature 462, 491 (2009).
- Jeon et al. (2011) K. R. Jeon, B. C. Min, I. J. Shin, C. Y. Park, H. S. Lee, Y. H. Jo, and S. C. Shin, Appl. Phys. Lett. 99, 199902 (2011).
- Lou et al. (2006) X. Lou, C. Adelmann, M. Furis, S. A. Crooker, C. J. Palmstrom, and P. A. Crowell, Phys. Rev. Lett. 96, 176603 (2006).
- Uemura et al. (2012) T. Uemura, K. Kondo, J. Fujisawa, K. Matsuda, and M. Yamamoto, Appl. Phys. Lett. 101, 132411 (2012).
- Dash et al. (2011) S. P. Dash, S. Sharma, J. C. Le Breton, J. Peiro, H. Jaffres, J. M. George, A. Lemaitre, and R. Jansen, Phys. Rev. B 84, 054410 (2011).
- Singh et al. (2016) S. Singh, J. Katoch, J. S. Xu, C. Tan, T. C. Zhu, W. Amamou, J. Hone, and R. Kawakami, Appl. Phys. Lett. 109, 122411 (2016).
- Garzon et al. (2005) S. Garzon, I. Žutić, and R. A. Webb, Phys. Rev. Lett. 94, 176601 (2005).
- Matos-Abiague and Fabian (2009) A. Matos-Abiague and J. Fabian, Phys. Rev. B 79, 155303 (2009).
- Txoperena et al. (2013) O. Txoperena, M. Gobbi, A. Bedoya-Pinto, F. Golmar, X. N. Sun, L. E. Hueso, and F. Casanova, Appl. Phys. Lett. 102, 192406 (2013).
- Gould et al. (2004) C. Gould, C. Ruster, T. Jungwirth, E. Girgis, G. M. Schott, R. Giraud, K. Brunner, G. Schmidt, and L. W. Molenkamp, Phys. Rev. Lett. 93, 117203 (2004).
- Fert and Jaffres (2001) A. Fert and H. Jaffres, Phys. Rev. B 64, 184420 (2001).
- Hahn et al. (2013) C. Hahn, G. de Loubens, O. Klein, M. Viret, V. V. Naletov, and J. Ben Youssef, Phys. Rev. B 87, 174417 (2013).
- Hoffmann (2013) A. Hoffmann, IEEE Trans. Magn. 49, 5172 (2013).
- Liu et al. (2014) L. Liu, C.-T. Chen, and J. Z. Sun, Nat. Phys. 10, 561 (2014).
- (50) “See Supplementary Information.” .
- Saito et al. (2005) H. Saito, S. Yuasa, and K. Ando, Phys. Rev. Lett. 95, 086604 (2005).
- Hatanaka et al. (2015) S. Hatanaka, S. Miwa, K. Matsuda, K. Nawaoka, K. Tanaka, H. Morishita, M. Goto, N. Mizuochi, T. Shinjo, and Y. Suzuki, Appl. Phys. Lett. 107, 082407 (2015).
- Pedersen and Vernon (1967) R. J. Pedersen and F. L. Vernon, Appl. Phys. Lett. 10, 29 (1967).
- Moodera et al. (1996) J. S. Moodera, L. R. Kinder, J. Nowak, P. LeClair, and R. Meservey, Appl. Phys. Lett. 69, 708 (1996).
- Johnson and Silsbee (1988) M. Johnson and R. H. Silsbee, Phys. Rev. B 37, 5326 (1988).
- Jin et al. (2015) Z. M. Jin, A. Tkach, F. Casper, V. Spetter, H. Grimm, A. Thomas, T. Kampfrath, M. Bonn, M. Klaui, and D. Turchinovich, Nat. Phys. 11, 761 (2015).
- Read and Altman (1965) M. H. Read and C. Altman, Appl. Phys. Lett. 7, 51 (1965).
- Clevenger et al. (1992) L. A. Clevenger, A. Mutscheller, J. M. E. Harper, C. Cabral, and K. Barmak, J. Appl. Phys. 72, 4918 (1992).
- Guo et al. (2014) G. Y. Guo, Q. Niu, and N. Nagaosa, Phys. Rev. B 89, 214406 (2014).
- Vogel et al. (1997) J. Vogel, A. Fontaine, V. Cros, F. Petroff, J. P. Kappler, G. Krill, A. Rogalev, and J. Goulon, Phys. Rev. B 55, 3663 (1997).
- Wilhelm et al. (2000) F. Wilhelm, P. Poulopoulos, G. Ceballos, H. Wende, K. Baberschke, P. Srivastava, D. Benea, H. Ebert, M. Angelakeris, N. K. Flevaris, D. Niarchos, A. Rogalev, and N. B. Brookes, Phys. Rev. Lett. 85, 413 (2000).
- Zhang et al. (2015) W. Zhang, M. B. Jungfleisch, W. J. Jiang, Y. H. Liu, J. E. Pearson, S. G. E. te Velthuis, A. Hoffmann, F. Freimuth, and Y. Mokrousov, Phys. Rev. B 91, 115316 (2015).