Origin of the crossover from polarons to Fermi liquids in transition metal oxides
Abstract
Transition metal oxides (TMOs) host a wealth of exotic phenomena ranging from charge, orbital, and magnetic order to nontrivial topological phases and superconductivity. In order to translate these unique materials properties into novel device functionalities, TMOs must be doped. However, the nature of carriers in doped oxides and their conduction mechanism at the atomic scale remain unclear. Recent angle-resolved photoelectron spectroscopy (ARPES) investigations provided new insight into these questions, revealing that the carriers of prototypical metal oxides undergo a transition from a polaronic liquid to a Fermi liquid regime with increasing doping. Here, by performing ab initio many-body calculations of the ARPES spectra of TiO, we show that this transition originates from non-adiabatic polar electron-phonon coupling, and occurs when the frequency of plasma oscillations exceeds that of longitudinal-optical phonons. This finding suggests that a universal mechanism may underlie polaron formation in TMOs, and provides a new paradigm for engineering emergent properties in quantum matter.
Department of Materials, University of Oxford, Parks Road, Oxford OX1 3PH, United Kingdom.
Correspondence and requests for materials should be addressed to
F.G. (email: feliciano.giustino@materials.ox.ac.uk).
Elucidating the nature of charge carriers in doped transition metal oxides is key to understanding the mechanism of electrical conduction in these multifunctional materials. In conducting oxides the infrared-active vibrations can couple strongly to electrons, leading to the formation of polarons[1]. Polarons are electrons dressed by a phonon cloud[2], and represent a paradigmatic example of emergent state in condensed matter. Depending on their mass and size, polarons exhibit widely different conduction mechanisms, from band-like transport to thermally-activated hopping transport[3, 4]. Despite being central to the science and technology of oxides, little is known about the properties of polaronic states.
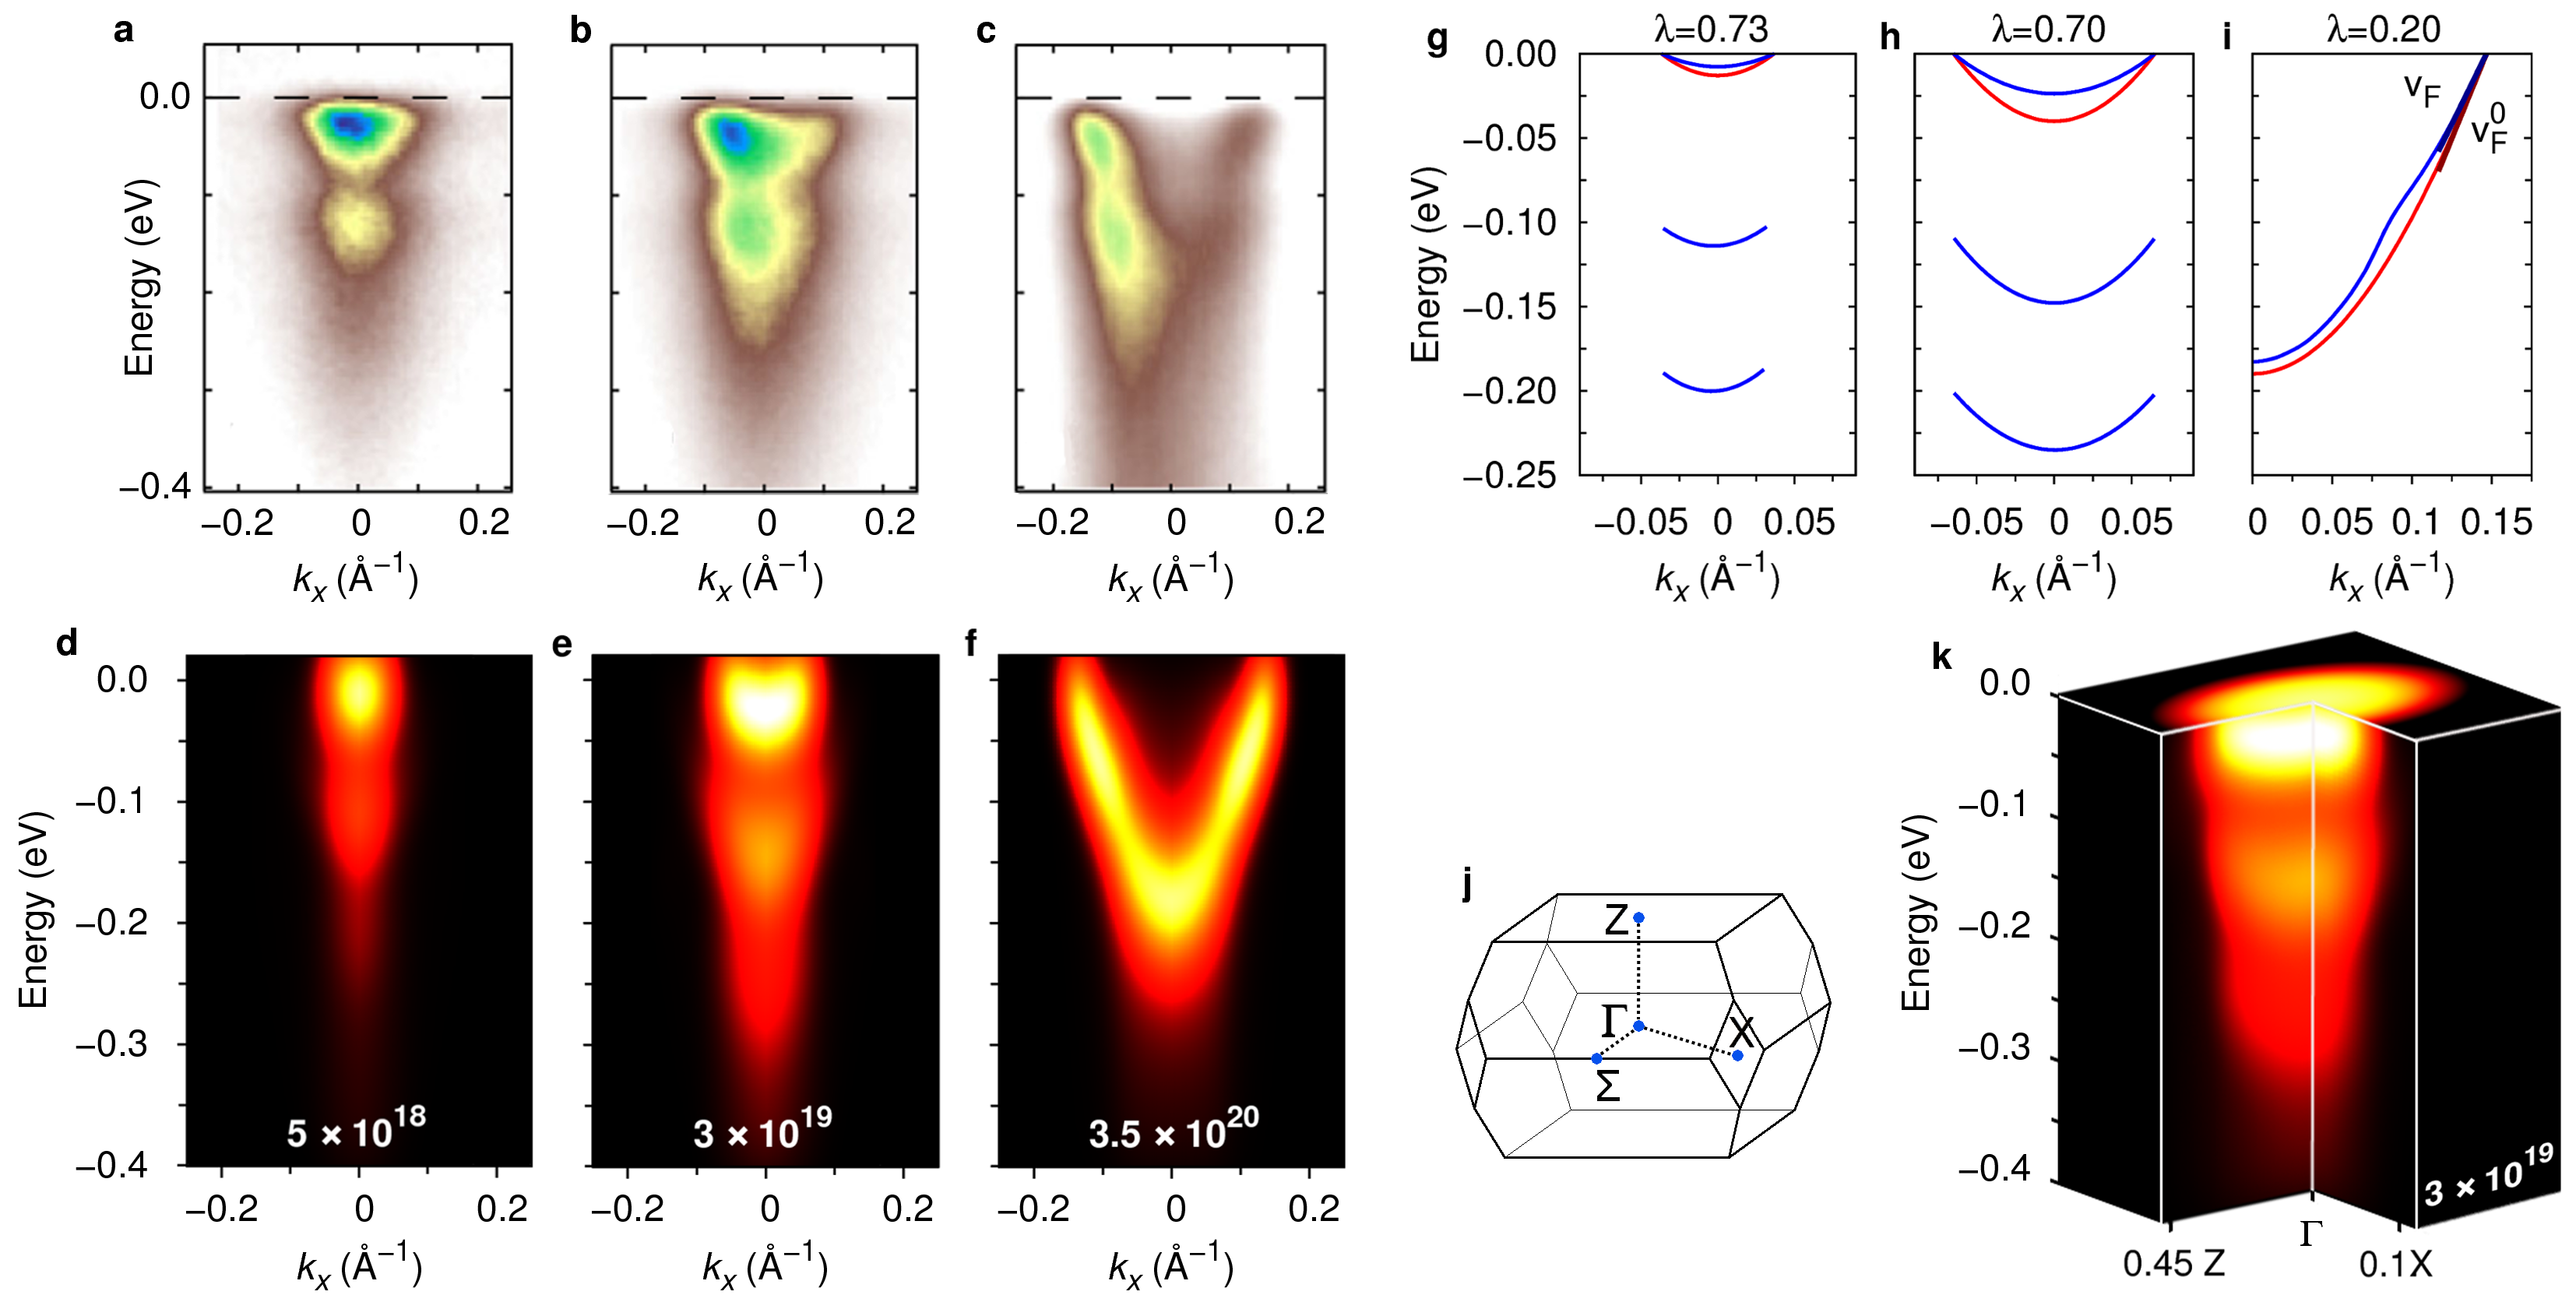
The interest in electron-phonon coupling and polaronic quasiparticles in TMOs has been reinvigorated by recent ARPES experiments[5, 6, 7, 8, 9]. The signature of polaronic behavior in ARPES spectra is the appearance of satellites below the conduction band, at integer multiples of the optical phonon energy. This is reported in Fig. 1a-b for the paradigmatic case doped anatase TiO2[5]. These pioneering measurements showed that, by increasing the carrier concentration, polaronic satellites gradually evolve into the photoemission kinks observed in metals and superconductors[10], see Fig. 1c. It was proposed that this crossover reflects the evolution of charge carriers from polarons to a Fermi liquid[5, 8]. In order to clarify the origin of this transition without making any a priori assumption about the underlying mechanism, first principles calculations are urgently called for. However, the investigation of polaronic features in ARPES spectra from first principles and their evolution with doping is exceptionally challenging and has never been reported before.
In the following we focus on the prototypical example of anatase TiO2. On top of its well-known applications in solar energy harvesting[11, 12] and superhydrophilic technology[13, 14], this material is also being investigated in the quest for transparent conducting oxides based on non-toxic and Earth-abundant elements[15, 16]. Despite its pivotal role in a broad range of technologies, the nature of the charge carriers in anatase is still controversial[17]. Here we address these issues by calculating ARPES spectra and polaron wavefunctions entirely from first principles. We develop a novel theoretical and computational framework that allows us to investigate polarons and Fermi liquid quasiparticles on the same footing, and without resorting to any empirical parameters. Using this new approach, we show how the interplay between the dynamical screening of the electron plasma and the Fröhlich electron-phonon coupling is responsible for the transition between polaronic and Fermi liquid states. We propose that the mechanism identified in this work may be universal, and also applies to other oxides such as SrTiO3 and ZnO.
Results
Angle-resolved photoemission spectra
Our calculated ARPES spectra are shown in Fig. 1d-f, for the same doping levels as in the measurements of ref. 5, reproduced in Fig. 1a-c. These maps show the bottom of the conduction band of -doped anatase TiO2, for three doping levels in the range to cm-3. All the spectra exhibit a bright parabolic band, whose size increases with doping. This reflects the rise of the Fermi energy inside the conduction band as the electron density increases. Besides this bright feature, panels a-b (experiments) and d-e (calculations) show each a pair of satellites, a bright one at a binding energy around 0.1 eV, and a dim one near 0.25 eV. These features are identified as polaronic effects[5]. Moving on to higher doping in panels c and f, the satellites disappear and are replaced by band structure kinks near 0.1 eV. Overall, our calculated ARPES spectra are in remarkable agreement with the experiments of ref. 5. In order to achieve this unprecedented level of precision without any adjustable parameters, we developed an innovative computational framework.
In our calculations the photoelectron intensity maps are obtained using the single-particle spectral function , where and are the electron momentum and binding energy, respectively, and is the reduced Planck constant. The spectral function is calculated using the state-of-the-art cumulant expansion, which has been employed recently to successfully describe plasmon satellites[18, 19, 20, 21]. The cumulant expansion can naturally be applied to investigate the spectral properties of a polaronic system since the theory stems from the exact solution of the Fröhlich electron-boson coupling Hamiltonian[22, 23]. In this formalism the spectral function is expressed as[24]:
| (1) |
where is the electron band index, is the electron eigenvalue in absence of many-body interactions, and is the time variable. The quantity is the so-called ‘cumulant’ function, and can be calculated by using the standard electron-phonon self-energy as a seed[25, 26] (see Methods and Supplementary Note 1):
| (2) |
Here is the electron-phonon vertex, and describes the probability amplitude for an electron in the initial state to be scattered into the final state by a phonon with momentum and energy in the branch [26]. The terms and denote the Bose-Einstein and Fermi-Dirac occupations, respectively; is the Brillouin zone volume, and a positive infinitesimal. The numerical evaluation of Eqs. (1)-(2) is very challenging owing to the singular nature of the Fröhlich interaction at long wavelengths[27]. To overcome this challenge we use the Wannier function technique of refs. 28, 29, as implemented in the EPW code[30].
The strength of the electron-phonon interaction is most commonly expressed in terms of a single parameter , which describes the enhancement of the electron mass from the band effective mass to the polaron mass via , as well as the renormalization of the Fermi velocity[31]. To determine this parameter we first extract the band structures underlying Fig. 1d-f, by tracking the maxima in the energy distribution curves. This procedure yields a set of parabolic bands and their satellites in Fig. 1g-h, and a distorted parabola in Fig. 1i (blue curves). For comparison we also report the electronic bands in absence of electron-phonon interactions (red curves). For carrier concentrations of and cm-3, polaron satellites are clearly visible in Fig. 1g-h, whereas at cm-3 we see a band structure kink but no satellites. From these band structures we obtain the mass enhancement parameter as the ratio between the Fermi velocity of the bare band, , and that of the dressed band, , as indicated in Fig. 1i: [31], where we explicitly included the dependence on the wavevector at the Fermi surface. As we move from the lowest to the highest doping level we obtain , 0.70, and 0.20, respectively. Our calculated value at intermediate doping is in excellent agreement with the mass enhancement determined in experiments, [5].
In Fig. 1k we show the spectrum calculated at intermediate doping for electron momenta along and , as well as the Fermi surface cut. Here we see that the Fermi surface pocket is elongated along the direction. This elongation reflects the anisotropic character of the band effective masses, which we calculate to be and along X and Z, respectively ( is the electron mass). Surprisingly this anisotropy is not reflected in the electron-phonon coupling strength: our calculations indicate that the mass enhancement varies by less than 10% along the [100], [110], and [001] directions, leading to an average value of , 0.70 and 0.19 for the three doping levels considered (see also Supplementary Note 2). These results are in good agreement with resonant inelastic X-ray scattering experiments on anatase TiO2[32].
Origin of satellites and kinks
Having established that our calculations can accurately reproduce experimental spectra without adjustable parameters, we now proceed to identify the mechanisms that drive the formation of polaron satellites by selectively turning off individual components of the calculations. The energy separations between the quasiparticle bands and the first satellite in Fig. 1d and Fig. 1e are 106 meV and 124 meV, respectively. In the case of Fig. 1f the kink appears at a binding energy of 100 meV. These energy scales are compatible with a Fröhlich-type coupling to the longitudinal-optical (LO) phonon at 109 meV (see phonon dispersions in Supplementary Fig. 1). This vibrational mode corresponds to the stretching of the Ti-O bonds in the plane, as shown in Fig. 2e. Another candidate bosonic mode is the -axis phonon at 88 meV[32], however the energy of this mode appears too small to account for the satellites and kinks in Fig. 1. In order to quantify the importance of the phonon, in Fig.2a we compare two calculations: the complete spectrum at intermediate doping (left) and a calculation where the coupling to modes with energy above 100 meV is artificially suppressed (right). We see that, upon removing high-energy phonons, the intensity of the first satellite decreases and the second satellite disappears. The effective mass is also visibly lower, in fact the analysis of the mass enhancement parameter yields , to be compared to the total coupling . It follows that the phonon contributes of the total coupling, hence it represents the primary mechanism behind the satellites.
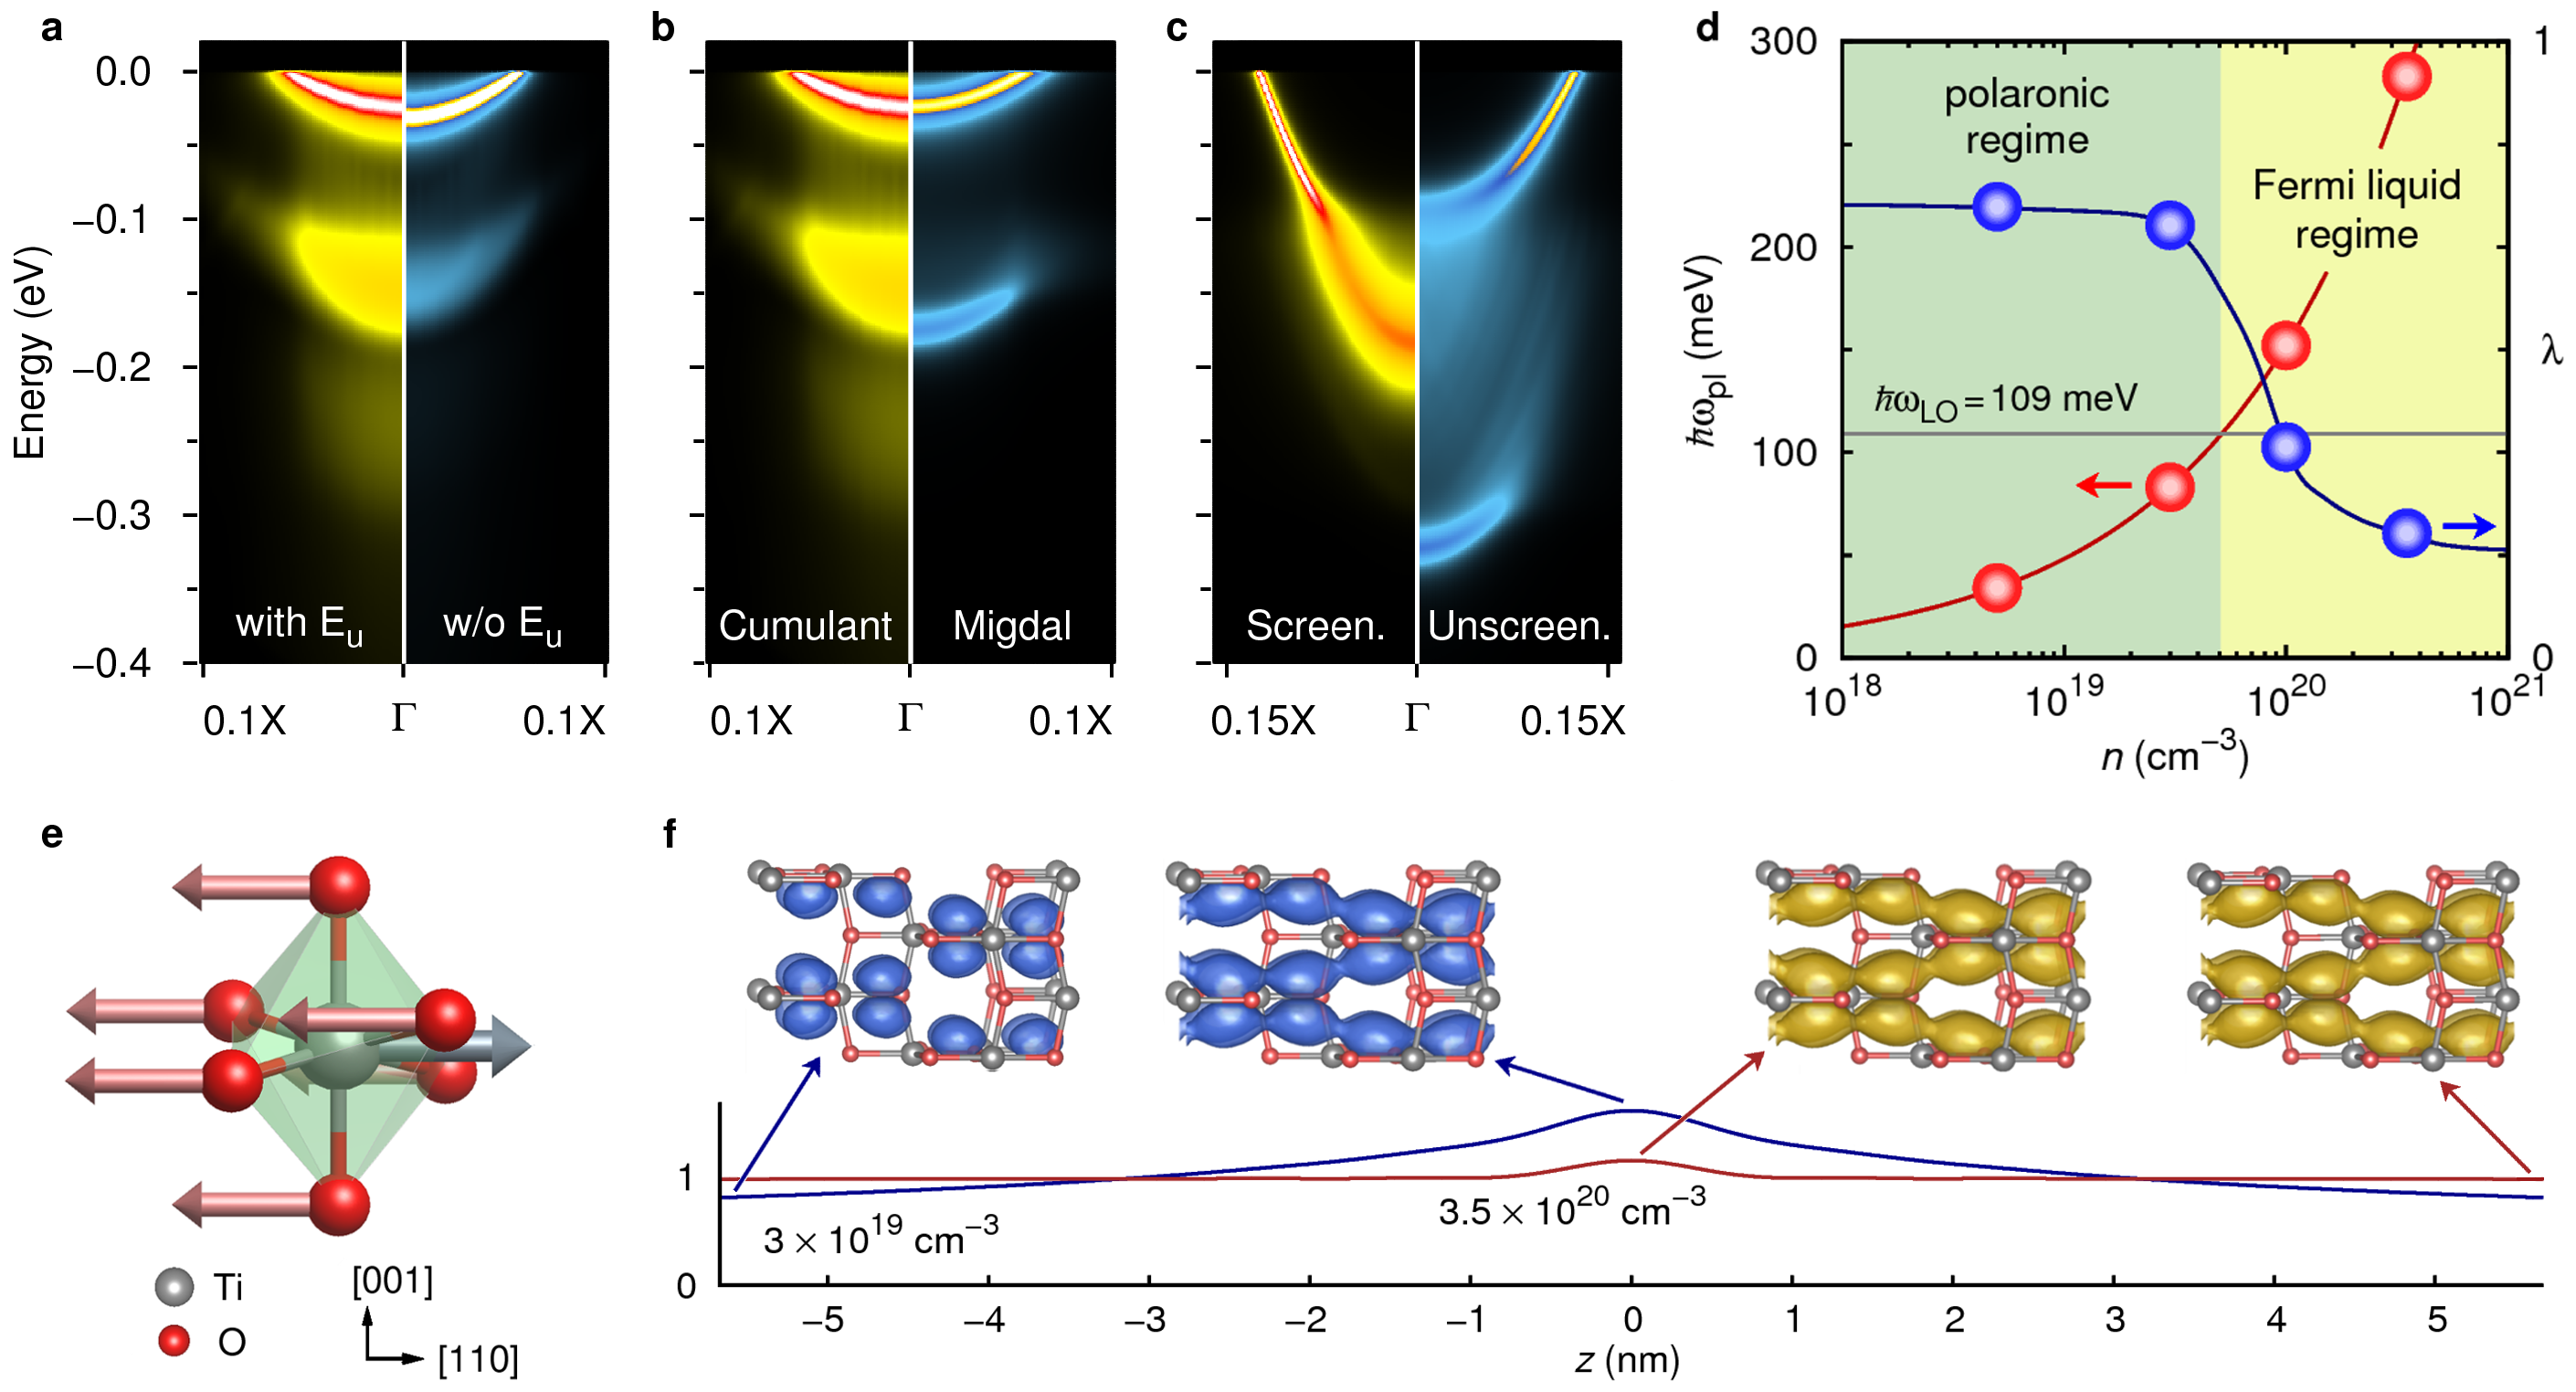
In Fig 2b we test the importance of many-body correlations beyond the one-shot Migdal approximation. On the left we show the spectrum at intermediate doping, obtained from the cumulant expansion; on the right we show the result of a calculation within the one-shot Migdal approximation (see Methods). The Migdal approximation is obtained from the complete electron-phonon self-energy by neglecting the three-point vertex[2]. In this approximation the electron-phonon self-energy contains only non-crossing diagrams. The additional approximation adopted in first principles calculations is to replace the fully renormalized electron and phonon propagators by those evaluated within density functional theory[26]. We name this choice the ‘one-shot’ Migdal approximation to emphasize the lack of self-consistency in the electron propagator. From Fig. 2b we notice that the one-shot Migdal approximation fails twice: firstly, the separation between the quasiparticle band and the first satellite is too large as compared to experiment (151 meV instead of meV); secondly, the dim satellite around 0.25 eV is completely missing. This test highlights the crucial role of high-order electron-phonon correlations in the description of polarons in conducting oxides. It would be interesting to see whether the deficiencies of the one-shot Migdal approximation could be avoided by performing a fully self-consistent Migdal calculation,[33] and to establish the importance of crossing diagrams which are included in the cumulant expansion; however this test is currently out of reach.
We now move to discuss the origin of the crossover between satellites and kinks in the spectra as a function of doping. The Fröhlich theory of polarons[27] considers a single electron added to a polar insulator. This description does not take into account that, as more electrons are added to the system, the polar electron-phonon coupling is weakened by the electronic screening of the charge carriers. Following ref. 2, we treat this issue by screening the electron-phonon vertex by the frequency-dependent Lindhard dielectric function with the calculated effective mass and dielectric permittivity of anatase TiO2 (see also Methods). For completeness we show in Supplementary Fig. 2 the dielectric screening as a function of carrier density and how the Fröhlich electron-phonon vertex is influenced by doping. In order to illustrate the importance of carrier screening, here in Fig. 2c we compare two scenarios: the spectrum calculated at high doping by accounting for electronic screening (left); the same system, but this time ignoring the screening of the electron-phonon coupling by doped carriers (right). The result is striking: in the absence of screening one obtains a sharp polaron satellite, in stark disagreement with experimental evidence. This comparison indicates that a correct description of the electronic screening is absolutely crucial to capture the photoemission kink at high doping. On the contrary, when we repeat the comparison of Fig. 2c for the cases of low and intermediate doping, we find a completely different picture: at these doping levels the electronic screening does not play any significant role.
These conflicting observations can be rationalized by inspecting the timescales of lattice vibrations and electronic screening. The phonon vibrates with a period fs. The characteristic response time of the electronic screening is set by the plasma frequency of doped carriers, . In the case of -doped TiO2 the electrons occupy a singly-degenerate parabolic band minimum, therefore , where is the electron density, the permittivity of vacuum, and the high-frequency dielectric constant of TiO2[2]. For the electron densities considered in Fig. 1a-c we calculate fs, 50 fs, and 15 fs, respectively. From these values we deduce that, at the lowest doping, the carriers are too slow to screen the long-range electric field generated by the oscillation of the phonon (122 fs vs. 38 fs). In this case the screening is ineffective and the Fröhlich interaction dominates the spectrum. On the contrary, at the highest doping the electrons oscillate faster than the LO phonon (15 fs vs. 38 fs). In this case the electronic screening is almost complete and the Fröhlich coupling is largely suppressed. In this regime the strength of the kink depends critically on the carrier concentration; with increasing doping the coupling to the LO phonons is gradually suppressed, and the ARPES spectrum is dominated by the weaker coupling of carriers to non-polar phonons [8]. These considerations are summarized in Fig. 2d, where we compare the energy of the phonon with the plasma energy of the carriers, and we monitor the evolution of the coupling strength with doping. We can identify two regions: a polaronic regime, corresponding to the situation , and a Fermi liquid regime, corresponding to . In the polaronic region the electronic screening is ineffective, we see satellites in the spectra, and the electron-phonon mass enhancement is not sensitive to the doping level. In the Fermi liquid region the Fröhlich coupling is strongly suppressed, polaron satellites are gradually replaced by photoemission kinks, and the coupling strength decreases. To further validate this trend, we performed additional calculations for a doping concentration of cm-3 in the transition region. We found that one satellite is still present in the spectrum (Supplementary Fig. 3). A careful investigation of the mass renormalization parameter yields , thus confirming that the electron-phonon coupling is weakened by the electronic screening. The present analysis reveals that the origin of the crossover from polarons to a Fermi liquid in the ARPES spectra of doped TiO2 is to be found in a novel form of electron-phonon coupling, which we refer to as a ‘non-adiabatic Fröhlich interaction’. The non-adiabatic treatment of the electronic screening is especially important to correctly capture the response of the electrons at low doping.
Given the qualitative change in the band structures at the crossover from the polaronic to the Fermi liquid regime, it is natural to ask how this evolution is reflected in the wavefunctions. In order to explore this aspect we calculate the polaron wavefunctions by generalizing the perturbation theory of ref. 2 to ab initio calculations. The top of Fig. 2f shows the square moduli of the polaron wavefunctions at the bottom of the conduction band near the maximum of the polaron wavefunction and a few unit cells away: on the left the intermediate doping level, which is inside the polaronic region of Fig. 2d; on the right the high doping level, in the Fermi liquid region. The bottom half of Fig. 2f shows the corresponding envelope functions. Here we see that the wavefunction of an electron in the Fermi liquid region is essentially akin to a periodic Bloch function. On the contrary, the wavefunction of an electron in the polaronic region shows spatial localization. To quantify the ‘size’ of the polaron in this latter case we define a polaron radius using the half width at half maximum. From Fig. 2f we obtain nm. This result indicates that, despite the qualitative changes in the ARPES spectra, we are in the presence of large polarons throughout the entire doping range, and that polarons in TiO2 are considerably more delocalized than previously thought[5]. Since thermally-activated hopping transport corresponds to of the order of the lattice constant[34], our finding supports the notion that electrical conduction in anatase TiO2 takes place via standard band-like transport. To avoid ambiguities we emphasize that the present result refers to intrinsic mobile polarons, not to localized electronic defect states such as those associated with O vacancies and which are not mobile[35].
Discussion
The non-adiabatic Fröhlich mechanism identified here is simple enough that it is likely to play a role in many other conducting oxides. In order to test this hypothesis we estimate the critical density for the crossover in doped SrTiO3[8] and doped ZnO[9]. In SrTiO3 the plasma energy for an electron concentration of cm-3 is meV[36], therefore to match the 100 meV LO phonon of SrTiO3 one would need a doping level of cm-3. In the experiments of ref. 8 the carriers are confined in a thin surface layer corresponding to approximately 3 unit cells, therefore we estimate the critical carrier density for the two-dimensional electron liquid in the range cm-2. This value is remarkably close to the critical density determined experimentally, cm-2 [8]. More accurate calculations will need to take into account the two-dimensional screening at the surface of SrTiO3 and its quantum paraelectric nature. A similar analysis can be carried out for ZnO[9]. In this case the energy of the highest LO phonon is 72 meV, while the plasma energy for a surface electron concentration of cm-2 is 320 meV[37]. The transition would then appear around cm-2, slightly below the density reported in ref. 9. In agreement with our estimate, the spectra of ref. 9 exhibit a behavior which is intermediate between kinks and satellites.
In summary, our findings indicate that the electron-phonon coupling in TiO2 is more complex than previously thought, and that the non-adiabatic Fröhlich coupling could be the unifying mechanism behind the transition from polarons to Fermi liquids in conducting oxides; explicit ab initio calculations will be required to confirm this point. Looking further ahead, our work suggests that a fine control of the interplay between lattice vibrations and plasma oscillations may offer a pathway for investigating novel emergent states in quantum materials, and provide opportunities in the development of quantum technologies based on TMOs.
Methods
Ground-state calculations
Ab initio calculations were carried out for anatase TiO2 (space group ), using the experimental lattice parameter Å[38]. We used density-functional theory (DFT) within the generalized gradient approximation of Perdew, Burke, and Ernzerhof[39]. The core-valence interaction was described by means of norm-conserving pseudopotentials, with the semicore Ti- and Ti- states explicitly taken into account. Electron wavefunctions were expanded in a planewaves basis set with kinetic energy cutoff of 200 Ry, and the Brillouin zone was sampled using a Monkhorst-Pack mesh. Lattice-dynamical properties were calculated using density functional perturbation theory (DFPT). All DFT and DFPT calculations were performed using the Quantum ESPRESSO[40] package.
Electron-phonon coupling
Calculations of electron-phonon couplings were performed using the EPW code[30], the cumulant expansion was performed separately (see Supplementary Note 1). The Fröhlich electron-phonon matrix element was calculated using the method of ref. 29. An accurate description of the Fröhlich vertex as described in ref. 29 is essential: ignoring this effect leads to a severe underestimation of the mass enhancement[41]. To evaluate Eq. (2) we computed electronic and vibrational states as well as the scattering matrix elements on a Brillouin-zone grid. These quantities were interpolated with ab initio accuracy onto a fine grid with random -points using EPW. The positive infinitesimal was set to 10 meV. Temperature effects were accounted for by including the Fermi-Dirac occupation in the spectral function, corresponding to the experimental temperature of 20 K.
Doping
Doping was included using the rigid-band approximation since the system is degenerate. In fact, by considering the Mott criterion for the metal-insulator transition[42], where is the effective Bohr radius, we obtain a value cm-3 for the critical density that is below the doping levels investigated. The screening of the electron-phonon interaction arising from the doped carriers was taken into account by computing the dielectric function in the random-phase approximation[2, 43], for a homogeneous electron gas with the calculated effective mass and dielectric permittivity of anatase TiO2[2, 43] (see Supplementary Note 3 for a rationale). In this expression the plasma frequency directly reflects the carrier density, therefore the influence of doping on the dielectric screening in anatase TiO2[44] is included in the calculations. The resulting non-adiabatic matrix element is , where is the electron lifetime near the band edge. Here we use meV from ref. 5. We checked that this choice does not affect our conclusions (Supplementary Fig. 4). We note that, owing to the strong anisotropy of the Fermi surface in -doped anatase TiO2, it is possible that the nominal doping levels estimated in ref. 5 using the Fermi momentum may underestimate the actual carrier densities in the measured samples.
Angle-resolved photoemission spectra
The cumulant function used in the calculation of the ARPES spectra is obtained from the self-energy of Eq. (2) as follows[18]: , where is the Heaviside function. More details on the cumulant expansion are provided in Supplementary Note 1. The calculations within the one-shot Migdal approximation shown in Fig. 2b were performed by using directly Eq. (2) inside the spectral function[26]: . The spectra were computed without including photon matrix elements effects[10]. This approximation is justified since the variation of the orbital character over the 0.1 eV binding energy range shown in Fig. 1 is negligible[10]. In order to extract the bands shown in Fig. 1g-i we proceeded as follows. For the quasiparticle bands, which are the brightest features in Fig. 1d-f, we calculate the poles of the electron Green’s function as , where and are the bare and the renormalized dispersions, respectively. For the satellites in Fig. 1d-e the previous procedure is not applicable since these features are not poles of the Green’s function. In this case we directly identify the maxima in the energy dispersion curves[10], and obtain the pairs of parabolic bands which are visible in Fig. 1g-h at binding energies below 0.1 eV.
Polaron wavefunction
In order to calculate the wavefunction of the polaron we generalized the perturbation theory approach of ref. 2 to the case of multiple electron bands and phonon branches, as well as ab initio electron-phonon matrix elements. We found , where and are the electron wavefunction without and with electron-phonon interactions, respectively. indicate the nuclear coordinates, is the phonon ground state and is a normalization constant. The details of the derivation are given in Supplementary Note 4. The wavefunctions in Fig. 2f were obtained by setting to the conduction band edge; the envelope functions were calculated by retaining only the term inside the square brackets in the above expression. A random grid with points was used for the Brillouin-zone integration, and a small imaginary part meV was added to the denominator.
Acknowledgements
The authors gratefully acknowledge Marco Grioni for granting permission to reproduce Fig. 1a-c, and M. Grioni, B. Gumhalter and P. D. C. King for fruitful discussions. This work was supported by the Leverhulme Trust (Grant RL-2012-001), the Graphene Flagship (Horizon 2020 Grant No. 696656 – GrapheneCore1), and the UK Engineering and Physical Sciences Research Council (Grant No. EP/M020517/1). This work used the ARCHER UK National Supercomputing Service via the ’AMSEC’ Leadership project, and the Advanced Research Computing facility of the University of Oxford [45].
References
References
- [1] Devreese, J. T. & Alexandrov, A. S. Fröhlich polaron and bipolaron: recent developments. Rep. Prog. Phys. 72, 066501 (2009).
- [2] Mahan, G. D. Many-Particle Physics (Plenum, New York, 1981).
- [3] Austin, I. G. & Mott, N. F. Polarons in crystalline and non-crystalline materials. Adv. Phys. 18, 41 (1969).
- [4] Ziman, J. M. Electrons and Phonons (Oxford University Press, 1960).
- [5] Moser, S. et al. Tunable polaronic conduction in anatase TiO2. Phys. Rev. Lett. 110, 196403 (2013).
- [6] Chen, C., Avila, J., Frantzeskakis, E., Levy, A. & Asensio, M. C. Observation of a two-dimensional liquid of Fröhlich polarons at the bare SrTiO3 surface. Nat. Commun. 6, 8585 (2015).
- [7] Cancellieri, C. et al. Polaronic metal state at the LaAlO3/SrTiO3 interface. Nat. Commun 7, 10386 (2016).
- [8] Wang, Z. et al. Tailoring the nature and strength of electron-phonon interactions in the SrTiO3(001) two-dimensional electron liquid. Nat. Mater. 15, 835 (2016).
- [9] Yukawa, R. et al. Phonon-dressed two-dimensional carriers on the ZnO surface. Phys. Rev. B 94, 165313 (2016).
- [10] Damascelli, A., Hussain, Z. & Shen, Z.-X. Angle-resolved photoemission studies of the cuprate superconductors. Rev. Mod. Phys. 75, 473 (2003).
- [11] Hardin, B. E., Snaith, H. J. & McGehee, M. D. The renaissance of dye-sensitized solar cells. Nat. Photon. 6, 162 (2012).
- [12] Green, M. A., Ho-Baillie, A. & Snaith, H. J. The emergence of perovskite solar cells. Nat. Photon. 8, 506 (2014).
- [13] Fujishima, A. & Honda, K. Electrochemical photolysis of water at a semiconductor electrode. Nature 238, 37 (1972).
- [14] Fujishima, A., Rao, T. N. & Tryk, D. A. Titanium dioxide photocatalysis. J. Photochem. Photobiol. C 1, 1 (2000).
- [15] Furubayashi, Y. et al. A transparent metal: Nb-doped anatase TiO2. Appl. Phys. Lett. 86, 252101 (2005).
- [16] Ellmer, K. Past achievements and future challenges in the development of optically transparent electrodes. Nat. Photon. 6, 809 (2012).
- [17] De Angelis, F., Di Valentin, C., Fantacci, S., Vittadini, A. & Selloni, A. Theoretical studies on anatase and less common TiO2 phases: Bulk, surfaces, and nanomaterials. Chem. Rev. 114, 9708 (2014).
- [18] Aryasetiawan, F., Hedin, L. & Karlsson, K. Multiple plasmon satellites in Na and Al spectral functions from ab initio cumulant expansion. Phys. Rev. Lett. 77, 2268 (1996).
- [19] Guzzo, M. et al. Valence electron photoemission spectrum of semiconductors: Ab Initio description of multiple satellites. Phys. Rev. Lett. 107, 166401 (2011).
- [20] Lischner, J., Vigil-Fowler, D. & Louie, S. G. Physical origin of satellites in photoemission of doped graphene: An Ab Initio plus cumulant study. Phys. Rev. Lett. 110, 146801 (2013).
- [21] Caruso, F., Lambert, H. & Giustino, F. Band structure of plasmonic polarons. Phys. Rev. Lett. 114, 146404 (2015).
- [22] Langreth, D. C. Singularities in the X-ray spectra of metals. Phys. Rev. B 1, 471 (1970).
- [23] Story, S. M., Kas, J. J., Vila, F. D., Verstraete, M. J. & Rehr, J. J. Cumulant expansion for phonon contributions to the electron spectral function. Phys. Rev. B 90, 195135 (2014).
- [24] Hedin, L. Effects of recoil on shake-up spectra in metals. Phys. Scr. 21, 477 (1980).
- [25] Gumhalter, B., Kovač, V., Caruso, F., Lambert, H. & Giustino, F. On the combined use of GW approximation and cumulant expansion in the calculations of quasiparticle spectra: The paradigm of Si valence bands. Phys. Rev. B 94, 035103 (2016).
- [26] Giustino, F. Electron-phonon interactions from first principles. Rev. Mod. Phys. 89, 015003 (2017).
- [27] Fröhlich, H. Electrons in lattice fields. Adv. Phys. 3, 325 (1954).
- [28] Giustino, F., Cohen, M. L. & Louie, S. G. Electron-phonon interaction using Wannier functions. Phys. Rev. B 76, 165108 (2007).
- [29] Verdi, C. & Giustino, F. Fröhlich electron-phonon vertex from first principles. Phys. Rev. Lett. 115, 176401 (2015).
- [30] Poncé, S., Margine, R., Verdi, C. & Giustino, F. EPW: Electron-phonon coupling, transport and superconducting properties using maximally localized Wannier functions. Comput. Phys. Commun. 209, 116 (2016).
- [31] Grimvall, G. The Electron-Phonon Interaction in Metals (North-Holland, New York, 1981).
- [32] Moser, S. et al. Electron-phonon coupling in the bulk of anatase TiO2 measured by resonant inelastic X-ray spectroscopy. Phys. Rev. Lett. 115, 096404 (2015).
- [33] Marsiglio, F. Pairing and charge-density-wave correlations in the Holstein model at half-filling. Phys. Rev. B 42, 2416 (1990).
- [34] Emin, D. Polarons (Cambridge University Press, 2012).
- [35] Setvin, M. et al. Direct view at excess electrons in TiO2 rutile and anatase. Phys. Rev. Lett. 113, 086402 (2014).
- [36] Gervais, F., Servoin, J.-L., Baratoff, A., Bednorz, J. G. & Binnig, G. Temperature dependence of plasmons in Nb-doped SrTiO3. Phys. Rev. B 47, 8187 (1993).
- [37] Many, A., Gersten, J. I., Wagner, I., Rosenthal, A. & Goldstein, Y. Two-dimensional plasma oscillation on ZnO surfaces. Surf. Sci. 113, 355 (1982).
- [38] Horn, M., Schwerdtfeger, C. F. & Meagher, E. P. Refinement of the structure of anatase at several temperatures. Z. Kristallogr. 136, 273 (1972).
- [39] Perdew, J. P., Burke, K. & Ernzerhof, M. Generalized gradient approximation made simple. Phys. Rev. Lett. 77, 3865 (1996).
- [40] Giannozzi, P. et al. QUANTUM ESPRESSO: a modular and open-source software project for quantum simulations of materials. J. Phys. Condens. Matter 21, 395502 (2009).
- [41] Zhukov, V. P. & Chulkov, E. V. Ab initio calculations of the electron-phonon interaction and characteristics of large polarons in rutile and anatase. Phys. Solid State 56, 1302 (2014).
- [42] Mott, N. F. Metal-insulator transitions (Taylor&Francis, London, 1990).
- [43] Hedin, L. New method for calculating the one-particle Green’s function with application to the electron-gas problem. Phys. Rev. 139, A796 (1965).
- [44] Mardare, D. & Rusu, G. I. Comparison of the dielectric properties for doped and undoped TiO2. J. Optoelectron. Adv. Mater. 6, 333 (2004).
- [45] Richards, A. University of Oxford advanced research computing. http://dx.doi.org/10.5281/zenodo.22558 (2015).
See pages 1-13 of supplementary.pdf