Compiled \ociscodes(270.1670) Coherent optical effects; (270.4180) Multiphoton processes; (270.3430) Laser theory.
Tailorable Dispersion in a Four-Wave Mixing Laser
Abstract
We present experimental results demonstrating controllable dispersion in a ring laser by monitoring the lasing-frequency response to cavity-length variations. Pumping on an N-type level configuration in 87Rb, we tailor the intra-cavity dispersion slope by varying experimental parameters such as pump-laser frequency, atomic density, and pump power. As a result, we can tune the pulling factor (PF), i.e. the ratio of the laser frequency shift to the empty cavity frequency shift, of our laser by more than an order of magnitude.
The sensitivity of a cavity’s resonant frequency to changes in its optical path length is at the heart of many interferometric optical measurements [1]. This effect is employed in lasers to tune their operating frequency, and in precision path-length measurements to permit a distance measurement resolution at the sub-atomic-length scale (as required for the detection of gravitational waves [2]). State-of-the-art high-finesse cavities are capable of seeing a frequency shift due to one excited atom in the cavity, providing the basis for cavity-quantum-electrodynamic tests [3]. The same effect, employed in optical gyroscopes, allows detection of minuscule changes in rotation speed [4, 5].
All of the above is reflected in the standard textbook formula governing the frequency shift of an empty cavity with respect to a change in its round-trip path length : , where is the resonant frequency for the path length . However, if there is a medium inside the cavity, then the cavity response must account for the dispersion of the medium [6]:
| (1) |
where is the group refractive index, is the refractive index at the light frequency , and is the dispersion.
If the dispersion is positive and sufficiently large, then will be . This suppresses the cavity sensitivity to length perturbations. The regime with is called the subluminal or the slow-light regime, since the group velocity . This regime is useful in producing stable laser systems, where the laser frequency is immune to cavity-length fluctuations [7].
If the dispersion is negative and sufficiently large, then will be . This is known as the superluminal or the fast-light regime, since the group velocity exceeds the speed of light in vacuum. In this regime the cavity response to the path change is enhanced. For the extreme case of , (1) seems to indicate that the resonance frequency has an infinite response to a cavity path-length change; however, an infinite number of round trips are required to achieve the steady state [8]. Nevertheless, a quite significant enhancement of the cavity response can theoretically be achieved, as suggested for cases of passive cavities filled with dispersive media [9, 10] and cavities with actively controlled atomic dispersion [11, 6]. For the passive-cavity case, there has been experimental demonstration of increasing cavity response by a factor of 5 [9].
So far there has been no direct demonstration of the dispersion-modified laser-frequency dependence on the cavity path change. The goal of this paper is to directly show the tailorable intra-cavity dispersion of the lasing cavity via its modified response. We demonstrate that the cavity response can be changed by more than an order of magnitude by varying experimental parameters.
Maintaining the fast-light regime for a lasing field is challenging. Due to the Kramers-Kronig relationship, an amplification line has positive dispersion, which is associated with the slow-light regime. To circumvent this, there must be a local absorption dip in the overall laser gain line.
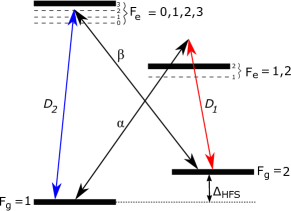
We base our setup on an N-configuration pumping scheme outlined in [12]. In this scheme, two strong pump lasers are tuned in the vicinity of the and the Rb lines as shown in Fig. 1. This creates favorable conditions for four-wave mixing of the pumps and the two additional new fields and that result from the Raman-gain conditions. The pump field by itself creates subluminal conditions for the field. In the presence of the strong pump, however, the gain line of the field splits, which creates the dip necessary for the fast-light regime. The pump also increases the gain for via the four-wave mixing process. During our preliminary studies on the N-scheme [13], we observed the fast-light regime without a cavity and also demonstrated that lasing is possible in this scheme.
There are several other proposals for achieving lasing in the fast-light regime. For example, a proposal from the Shahriar group [14] suggests that the presence of two Raman gain lines in the vicinity of each other will provide an absorption-like feature between the gain lines while retaining the positive gain necessary for lasing. For another design from this group, in which an absorptive dip is placed on top of a single Raman gain line [15], indirect measurements suggest an achievable cavity-response enhancement by a factor of 190.
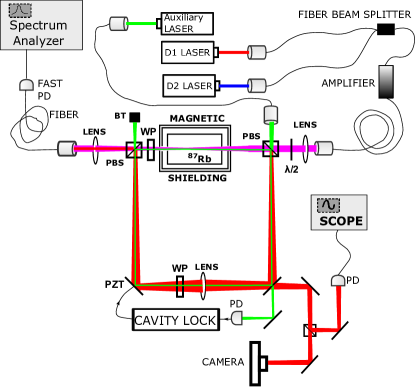
A schematic representation of our experimental setup is shown in Fig. 2. The gyroscope is a square-shaped cavity with perimeter cm, into which we inject two pump-laser fields tuned to the 87Rb line ( nm) and line (780 nm), respectively. These pumps are first combined using a fiber-optic beam splitter and injected into a solid-state amplifier to boost their total power level to about 200 mW before injecting them into the cavity. The power ratio of the pumps was approximately 1 for all of the data presented here. A cylindrical cell (length 22 mm, diameter 25 mm) filled with isotopically enriched 87Rb vapor and 5 torr of Ne buffer gas is placed inside of a 3-layer magnetic shielding and mounted inside the cavity. Two highly reflective flat mirrors and two polarizing beam splitter (PBS) cubes comprise the cavity, as depicted in Fig. 2. To stabilize the cavity, we use an intracavity lens with a focal length of 30 cm. Such a configuration effectively directs the most focused part of the cavity mode inside of the Rb cell. The overall finesse of the empty cavity was about 30–40, largely determined by absorption by the Rb-cell windows ( 0.9–0.95) and intentional polarization distortion by two waveplates (WP), as discussed below.
To control the cavity length, we lock it to an auxiliary laser that is far detuned from any atomic transitions and thus “sees” the empty cavity, unaffected by the atomic dispersion. The light from this laser is counterpropagating to the pumps’ direction to avoid saturation of the output detectors. While most of the auxiliary field passes through a polarizing beam splitter (PBS) and hits the beam trap (BT), a small polarization rotation, introduced by a waveplate, transfers a fraction of the auxiliary field into a cavity mode. When locked, the cavity length follows the frequency change of the auxiliary laser ().
The pump light’s polarization is set so that it can pass through the beam splitters, so the pump fields do not circulate in the cavity. However, the fields and are produced with polarization orthogonal to that of the pump, and thus are reflected by the PBSs and can lase when cavity resonant conditions are met. In our setup, the gain line is narrower than the cavity free spectral range, so we have to tune the cavity frequency to match the atomic gain line. Once the cavity detuning is such that it is lasing, we can measure the lasing frequency. This is done by observing the beat note between the pump and the lasing field on a fast photodiode. The photodiode mostly sees the pump fields passing through the output-cavity PBS. Normally, the lasing field would be fully reflected by this PBS back into the cavity. To allow a small pick-off, we rotate the light polarization by a few degrees using a waveplate between the atomic cell and the output PBS, so that a small fraction of the lasing field escapes the cavity in the same polarization as pumps. We can thus observe the beat note between the newly generated field and the corresponding pump occurring at a frequency near the 87Rb ground level splitting ( GHz). The linewidth of each of the beat notes is limited by the spectral-analyzer resolution bandwidth which was typically set to 300 kHz. While this particular detection scheme does not allow us to discriminate between the beat note of the lasing field and field or the field and , the theoretical analysis strongly indicates that the field has stronger gain and thus is the one which lases. If we block either of the pumps, the lasing ceases.
To measure the response of the generated-field frequency to cavity-length variations we continuously tune the frequency of the auxiliary laser (to which the cavity is locked), thus changing the empty-cavity detuning (), and track the changes in the beat-note-frequency position. Since the pump frequency is held constant, the measured shift corresponds to the lasing-frequency shift (). An example of this can be seen in Fig. 3. Most of the time the dependence of the lasing detuning on the change in cavity length (and thus on ) is linear. We define the pulling factor (PF) as the slope of this linear dependence. Combining this definition with (1), we obtain
| (2) |
If PF , the laser is in the fast-light regime with enhanced response to changes in the cavity path length. Conversely, for PF the laser is less sensitive to fluctuations in cavity length.
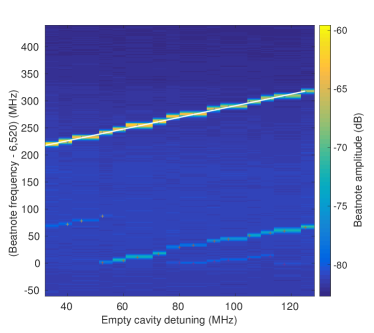
Often we see more than one beat note, corresponding to different spatial cavity-lasing modes as observed by the camera. The different spatial lasing modes have different pulling factors (seen as separate lines with different slopes in Fig. 3). For the results presented below we show only the mode that exhibited the greatest cavity response. Typically, this mode was the TEM00 spatial lasing mode, which was usually the strongest.
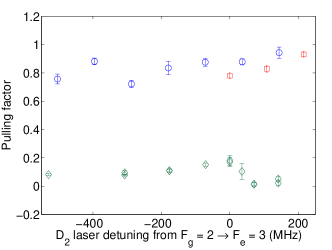
Fig. 4 presents measurements of the pulling factor as we varied the pump detuning from the Rb transition, keeping the pump laser frequency fixed at GHz above the transition. We did measurements in two different regimes. In the “low-pump-power, low-atomic-density” regime we set the total pump power at 6 mW, and maintained the Rb cell temperature at 80 ∘C (corresponding to the atomic density cm-3). In the “high-pump-power, high-atomic-density” regime we increased the total pump power to either 208 mW or 178 mW, and were able then to operate at higher Rb cell temperature of 100 ∘C (atomic density cm-3).
We see that in the high-pump-power regime, there is a slight trend toward higher PF as we increase the pump frequency. The PF reaches nearly unity as we approach approximately 200 MHz, at which point the lasing stops. On the other hand, the low-pump-power regime exhibits a dispersion-like dependence of the PF on the laser detuning. It reaches maximum when the detuning matches the transition and drops to almost zero as we increase the detuning further. We note that the low-pump-power regime is associated with much weaker lasing power, which is expected since the output power is related to the pumping strength.
The drastic difference in PF for high and low power regimes can be explained by the following. At low power the atomic gain line is narrow since the power broadening of the gain line is small, thus the lasing frequency, which is dictated by the product of the cavity transmission and atomic gain, is mainly governed by the atomic line position. On the other hand, in the high-power regime, the power-broadened atomic gain line is wider than the cavity line, so the lasing frequency mostly follows the cavity detuning.
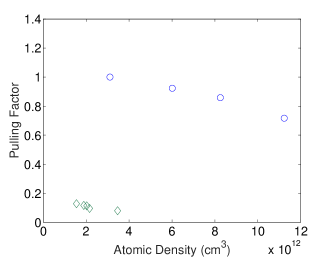
Next, we studied the dependence of the PF on atomic density. The results are shown in Fig. 5. It is expected that with increased atomic density, the dispersive-cavity properties will increasingly differ from those of an empty cavity, and the PF will deviate from unity. This behavior is very clear in Fig. 5: In the high-density and high-pump-power regime the PF changes from 1 to approximately 0.7. In the low-power regime the PF is small even in the low-density regime, but we also see a decrease of the PF with the increase of atomic density.
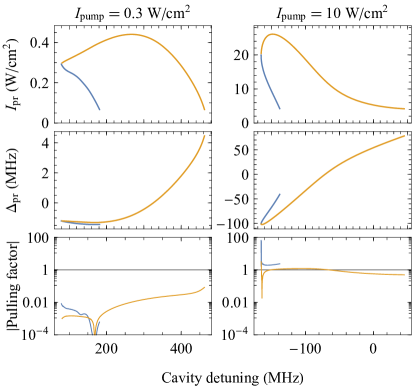
To better understand the prospects for extending the laser operation into the superluminal regime, we also conducted numerical simulations of probe-field generation for the four-level system shown in Fig. 1, including the effects of Doppler broadening. For a given set of pump parameters, the cavity round-trip complex amplitude gain for the probe light is calculated as a function of probe-field intensity and detuning, using the method described in Ref. [13]. For lasing to occur, we require unity round-trip gain; the probe intensities and detunings at which this happens are found as a function of cavity tuning. Fig. 6 shows results of the calculation with the pump tuned GHz above the optical resonance and the pump on resonance. The round-trip empty-cavity amplitude gain is set to 0.9 (corresponding to a finesse of 30) and the atomic density is (lower than the experimental value to offset differences between the four-level system and the full hyperfine structure of Rb). Probe intensity , detuning , and absolute value of the pulling factor (derivative of probe detuning with respect to cavity tuning) are shown for two pump intensities, roughly matching the experimental low- and high-pump-intensity regimes. Since there may be more than one combination of and at which lasing can occur for each cavity tuning, different branches are represented by different-color lines.
One can see that the calculated behavior qualitatively matches the experimental observations. For all stable modes, the pulling factors are smaller than one for the most part, approaching unity at high pump intensity. However, even at lower pump intensity, there are certain places where the probe detuning vs. cavity tuning plot has very steep slope, resulting in a pulling factor much greater than one over a narrow cavity tuning range. Observing this regime experimentally will require more precise mode control than allowed by our current approach for measuring the pulling factor, and thus it is not surprising that we were not able to demonstrate this high pulling factor experimentally.
In conclusion, we have shown that through a suitable choice of parameters one can change the laser PF by more than an order of magnitude. While we were not able to demonstrate the fast-light regime in our lasing system, we showed that we can bring the laser to the regime where its sensitivity to cavity-length perturbations is reduced to of its classical counterpart. Such a reduced sensitivity regime is of interest for the stable laser frequency systems used in metrology.
We would like to thank Matt Simons and ShuangLi Du for help with initial setup construction. We thank the Naval Air Warfare Center STTR program for supporting our research, Contract No. N68335-13-C-0227.
References
- [1] A. Siegman, Lasers (University Science Books, Sausalito CA, 1986).
- [2] B. P. Abbott and et al., Phys. Rev. Lett. 116, 061102 (2016).
- [3] C. J. Hood, M. S. Chapman, T. W. Lynn, and H. J. Kimble, Phys. Rev. Lett. 80, 4157 (1998).
- [4] G. E. Stedman, Reports on Progress in Physics 60, 615 (1997).
- [5] A. A. Velikoseltsev, D. P. Luk’yanov, V. I. Vinogradov, and K. U. Shreiber, Quantum Electronics 44, 1151 (2014).
- [6] M. S. Shahriar, G. S. Pati, R. Tripathi, V. Gopal, M. Messall, and K. Salit, Phys. Rev. A 75, 053807 (2007).
- [7] M. Sabooni, Q. Li, L. Rippe, R. K. Mohan, and S. Kröll, Phys. Rev. Lett. 111, 183602 (2013).
- [8] D. D. Smith, H. Chang, L. Arissian, and J. C. Diels, Phys. Rev. A 78, 053824 (2008).
- [9] K. Myneni, D. D. Smith, J. A. Odutola, and C. A. Schambeau, Phys. Rev. A 85, 063813 (2012).
- [10] D. D. Smith, K. Myneni, J. A. Odutola, and J. C. Diels, Phys. Rev. A 80, 011809 (2009).
- [11] M. S. Shahriar, R. Tripathi, G. S. Pati, V. Gopal, K. Salit, and M. Messall, “Enhancement of interferometric precision using fast light,” in “Frontiers in Optics,” (Optical Society of America, 2005), p. FTuCC3.
- [12] N. B. Phillips, I. Novikova, E. E. Mikhailov, D. Budker, and S. Rochester, Journal of Modern Optics 60, 64 (2013).
- [13] E. E. Mikhailov, J. Evans, D. Budker, S. M. Rochester, and I. Novikova, Optical Engineering 53, 102709 (2014).
- [14] G. S. Pati, M. Salit, K. Salit, and M. S. Shahriar, Phys. Rev. Lett. 99, 133601 (2007).
- [15] J. Yablon, Z. Zhou, M. Zhou, Y. Wang, S. Tseng, and M. S. Shahriar, Opt. Express 24, 27444 (2016).