.
MINERvA Technical Note No. 080
MINERvA DocDB document 12688
Fermilab Technical Publication FERMILAB-FN-1030-ND
Model uncertainties for Valencia RPA effect for MINERvA
Rik Gran, University of Minnesota Duluth
Abstract
This technical note describes the application of the Valencia RPA multi-nucleon effect and its uncertainty to QE reactions from the GENIE neutrino event generator. The analysis of MINERvA neutrino data in Rodrigues et al. PRL 116 071802 (2016) paper makes clear the need for an RPA suppression, especially at very low momentum and energy transfer. That published analysis does not constrain the magnitude of the effect; it only tests models with and without the effect against the data. Other MINERvA analyses need an expression of the model uncertainty in the RPA effect. A well-described uncertainty can be used for systematics for unfolding, for model errors in the analysis of non-QE samples, and as input for fitting exercises for model testing or constraining backgrounds. This prescription takes uncertainties on the parameters in the Valencia RPA model and adds a (not-as-tight) constraint from muon capture data. For MINERvA we apply it as a 2D (,) weight to GENIE events, in lieu of generating a full beyond-Fermi-gas quasielastic events. Because it is a weight, it can be applied to the generated and fully Geant4 simulated events used in analysis without a special GENIE sample. For some limited uses, it could be cast as a 1D weight without much trouble. This procedure is a suitable starting point for NOvA and DUNE where the energy dependence is modest, but probably not adequate for T2K or MicroBooNE.
1 Introduction
This paper describes the method for producing the leading RPA suppression effect and assigning an uncertainty. It is for use with a neutrino event generator when charged-current quasielastic (CCQE) events are generated with only a simple Fermi Gas model, such as GENIE [1] (version 2.10.2 used in for the figures in this note). The analysis of the hadronic energy in MINERvA neutrino data in [2] demonstrates the need for an RPA effect on top of a Fermi-gas model of the nucleus, especially to describe the suppression at very low momentum transfer. There have long been hints in neutrino data of the need for a suppression effect beyond Pauli blocking, since K2K [3] and the dawn of the NuInt workshop era, and even in deuterium bubble chamber data as discussed in the [4] reanalysis. Other MINERvA analyses need an expression of the model uncertainty in the RPA effect in order to extract cross sections and interpret neutrino nucleus reaction models. However taking “RPA on” vs. “RPA off” overestimates the uncertainty – neither nuclear theory nor reality would permit zero suppression at very-low .
A well-described uncertainty can be used for systematics for unfolding, for model errors in the analysis of non-QE samples, and as input for fitting exercises for model testing or constraining backgrounds. It can be used in conjunction with an improved axial form factor uncertainty such as proposed in [4], and an uncertainty estimate for the 2p2h process. This prescription is one component needed to replace the huge, default GeV uncertainty in GENIE with something more physical, more detailed, and better targeted.
The Valencia quasielastic with RPA model for neutrino data is described in [5], with a formal estimate of the uncertainties in [6]. The model originated with a similar analysis by some of the same authors and compared to electron scattering data [7]. The resulting model has been compared to muon capture on nuclei [5, 8], MiniBooNE data [9], and MINERvA data [2], with encouraging results. Further elaboration of the RPA effect in the Valencia model was done in [10], and the same in combination with a spectral function in [8]. RPA-type effects in neutrino reactions have long been considered by many authors [11, 12, 13, 14, 15, 16, 17, 18, 19, 20, 21, 22, 23]; interesting comparisons to others and to MINERvA data are beyond the scope of this work.
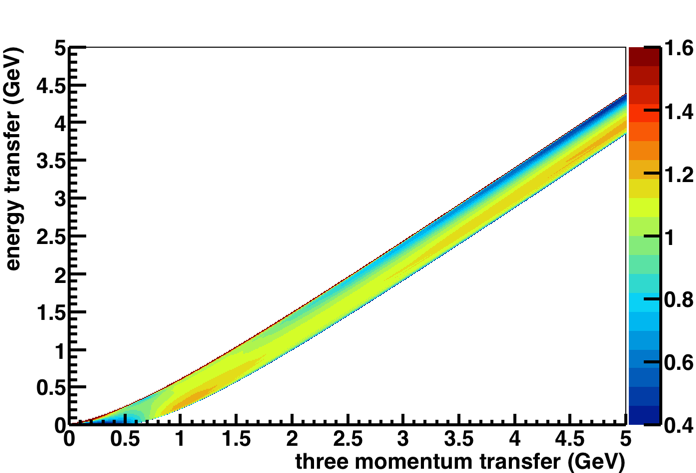
The work in this note focuses exclusively on the RPA effect. Quantitatively we have three samples from the model authors’ FORTRAN code: a no-RPA sample, a relativistic RPA sample, and a non-relativistic RPA sample. The ratio of the model with the effect turned on to a run of the model without any RPA effect at all is effectively a reweight that we will use in our analyses. The following figures illustrate the distortion through the ratio of the two model variations for the neutrino case, as a function of four momentum transfer = . In this paper, we will extensively use the shorthand for the energy transfer (the energy component of a four-vector, also called “nu” or by DIS folks or by nucleon/nucleus enthusiasts) and the magnitude of the three-momentum transfer (or or q). The anti-neutrino case is basically the same, though a few complications are more significant and are described after the neutrino case.
As of this writing, there has been additional effort in refining the elements of the model and understanding the interplay with spectral function features [8]. The same RPA code in that work is used here (but not the spectral function code), and these new comparisons do not change the interpretation presented here. The low suppression uncertianty based on muon capture data does not need to be adjusted.
2 Parameters in the model
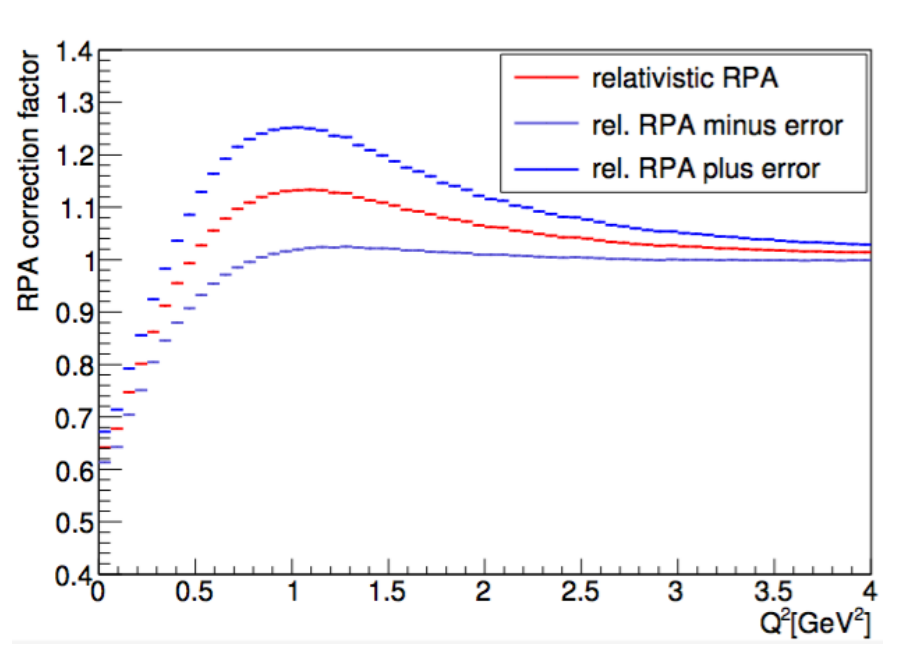
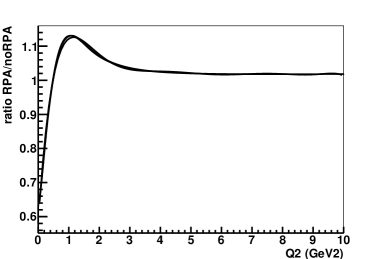
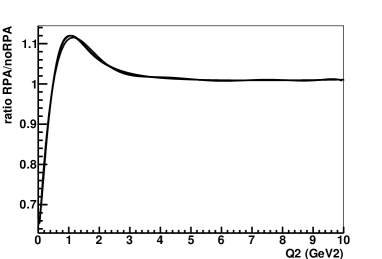
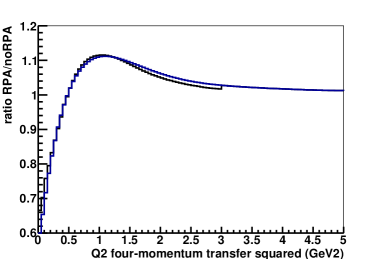
Federico Sanchez and a student at IFAE Barcelona unpacked the parameters in the Valencia RPA model in order to produce the error band in the left plot of Fig. 1. The values of those parameters were taken as in [6] to have 10% uncertainty. Then the calculation was rerun to produce variations around the central value, which were taken in quadrature.
| parameter | value | model effect | rough size | |
|---|---|---|---|---|
| 0.33 | 0.03 | in potential term | tiny effect | |
| 0.45 | 0.05 | in potential term | tiny effect | |
| 2.0 | 0.2 | in potential term | large effect | |
| 1.00 | 0.10 | small effect | ||
| 2.13 | 0.21 | in for | small effect | |
| 1200 | 120 MeV | in | tiny effect | |
| 2500 | 250 MeV | in | large effect | |
| 0.63 | 0.06 | in | large effect |
The parameters produce a crossover point around = 0.5 GeV2 : when a changed parameter raises the weight (ratio withRPA/without) above this spot and the effect goes more extremely low below this spot. The other systematic parameter shifts raise or lower the weight across all . The parameters do the latter also, but produce no weight in the limit GeV2.
For the enhancement at high , above the crossover point, all these parameter uncertainties produce the same kind of distortion. Our implementation, therefore, does not need each individual parameter, but only one parameter whose 1 is the sum of the effects in quadrature, which is what was shown in Fig. 1 left plot. We will construct the equivalent magnitude from simpler ingredients.
Below the crossover point we would need a more sophisticated treatment to capture the uncertainty. However there is an additional data-driven uncertainty that is not yet accounted for in Sanchez’ analysis, yet appears to be the largest effect. This is described in the next section, and can supply all the low uncertainty we need.
3 Additional uncertainty at very low momentum transfer
The success of the RPA multi-nucleon effect has been tested [5] against data for muon capture on nuclei. The Feynman diagram for this process is equivalent to the muon neutrino CCQE process in nuclei we are studying in MINERvA, but the data for the process are necessarily limited to very-low . The Valencia authors make a comparison of the rate for muon capture to their model with and without RPA. We will use that data-driven observation to create a second, independent uncertainty band.
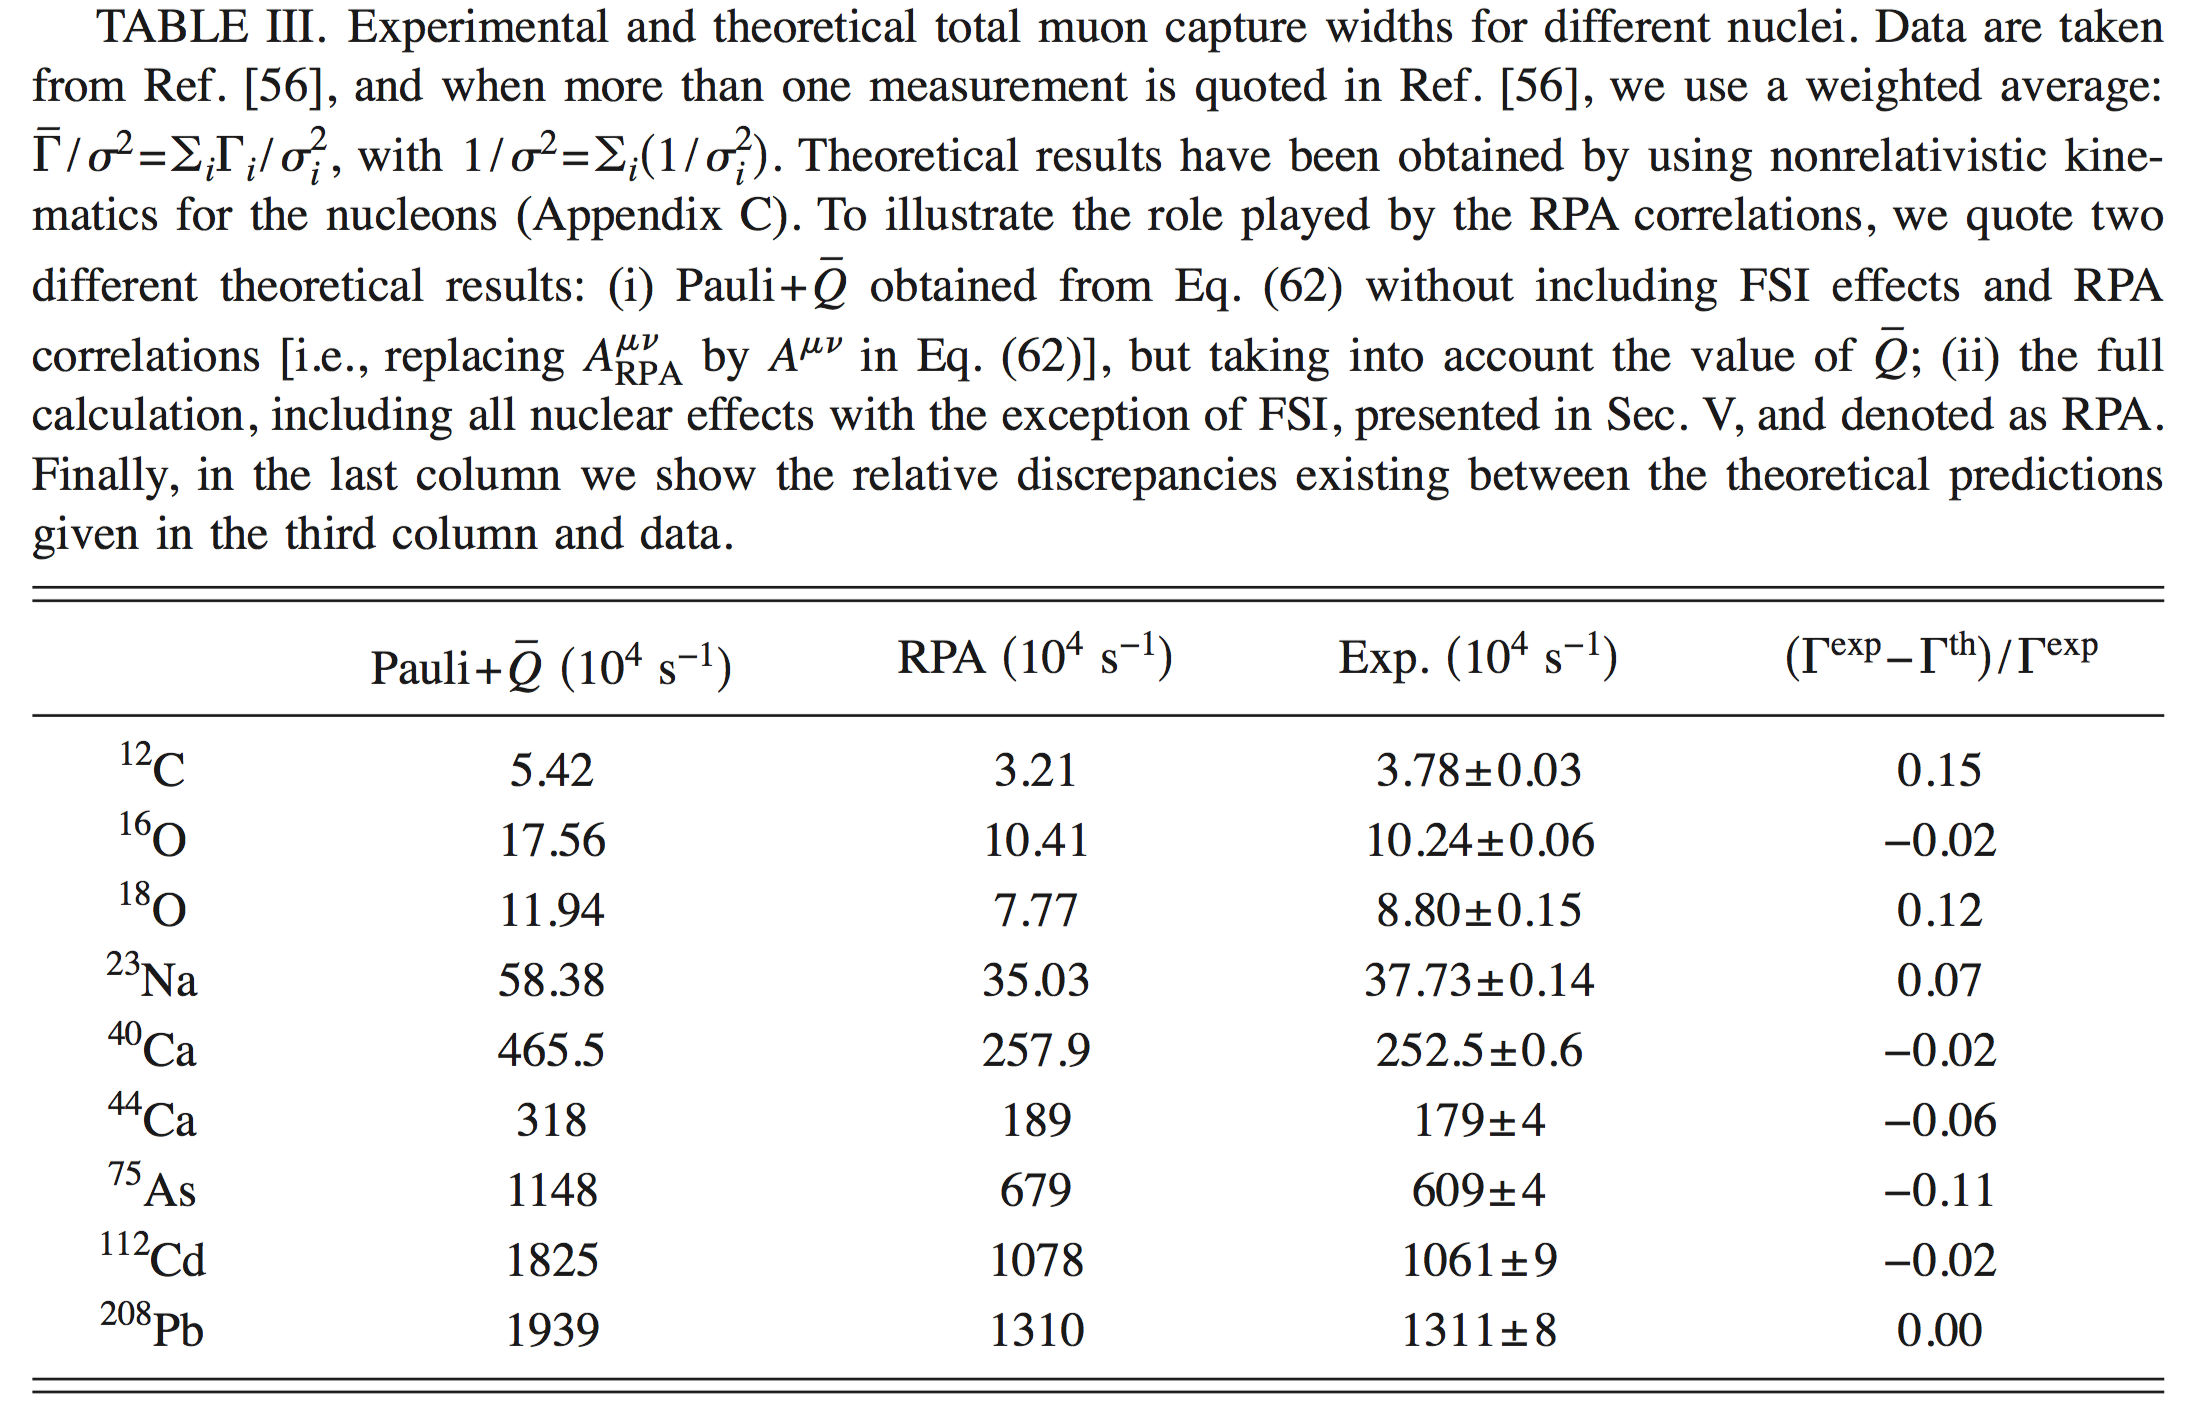
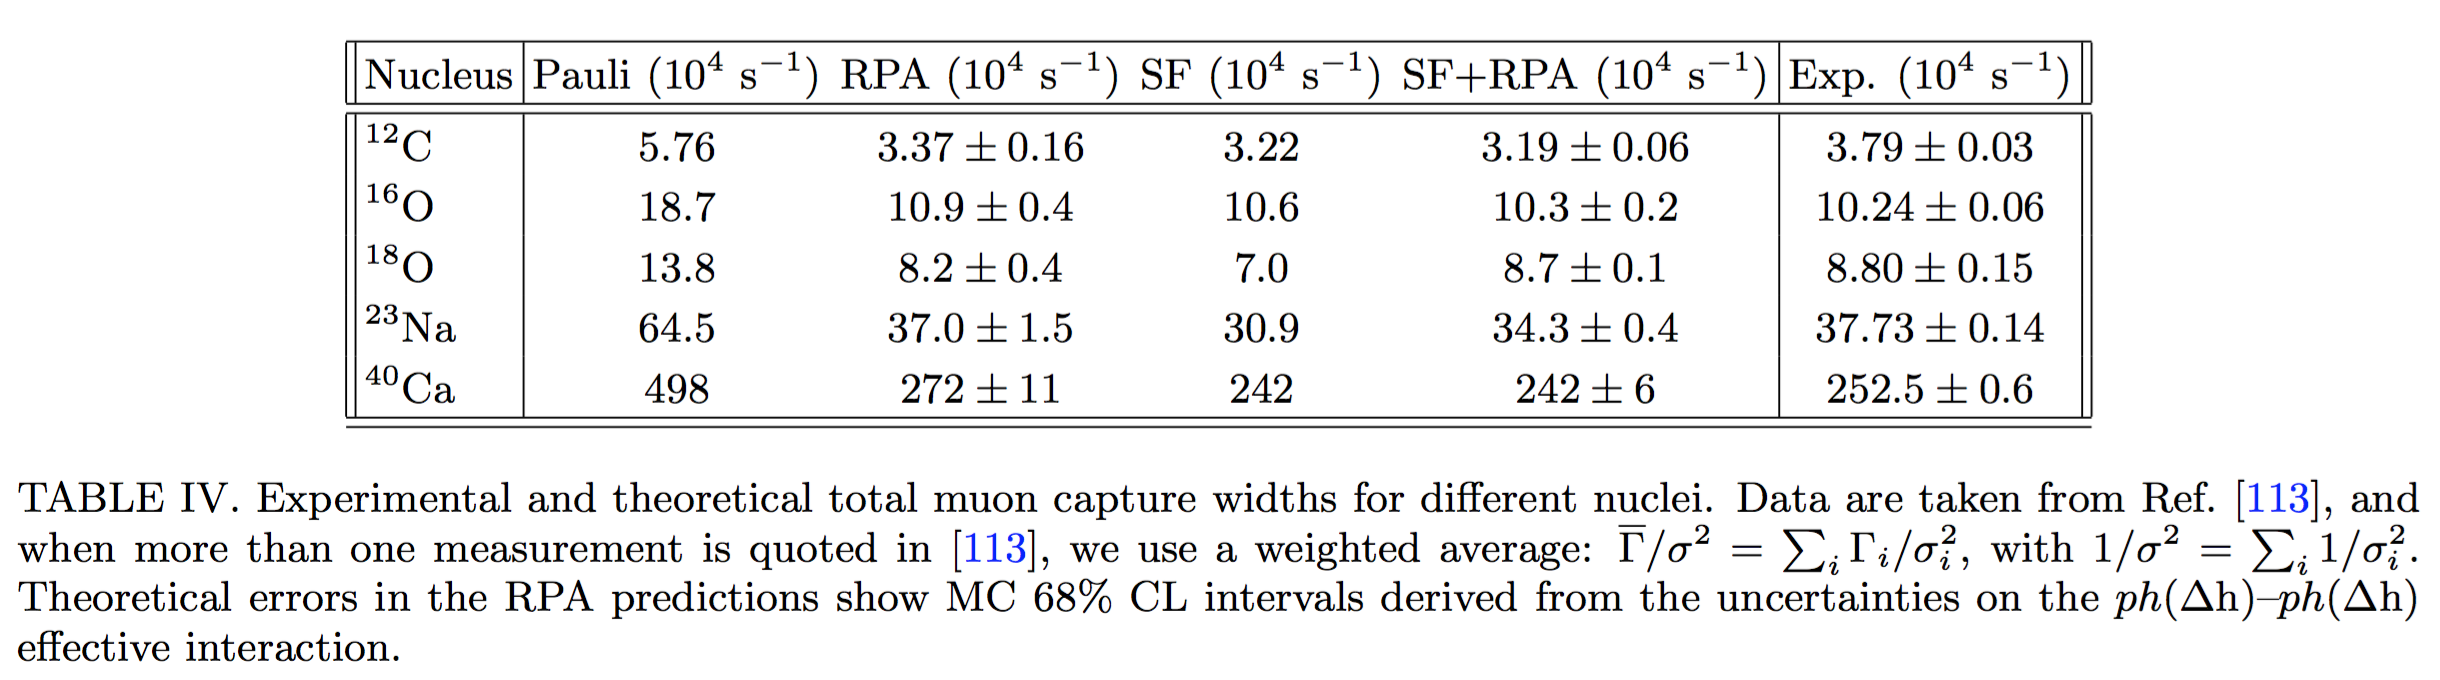
This figure 2 (really a screenshot of Table III from their [5] paper and Table IV of [8]) shows the model with RPA clearly describes the muon capture rate, and the one without does not describe it well at all.
The fractional discrepancy is given
in the right column, but it makes more
convenient reweighting code for us to recast that as an
uncertainty in the suppression from nominal.
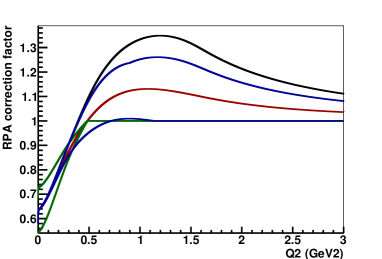
For example, the suppression factor
for carbon in the table is 3.21/5.42 = 0.6 = (1.0 0.4) in for RPA model to
default model,
but 3.78/5.42 = 0.7 = (1.0 0.3) for
data to default model. This 0.3 compared to 0.4 is 25% less suppression. We can
implement this as scaling (pseduo-math):
default 0.25 ( 1.0 default ) ;
so for carbon 0.6 0.25 (1.0 0.6) = 0.7 or 0.5,
producing the green band on the right plot in Fig. 1.
Overall, the model gives a suppression factor of 0.6 for practically all nuclei, as does the average of the data for these nuclei. [A spreadsheet is included in the MINERvA docdb for this technical note.] The standard deviation of the remaining discrepancy between model and data for the nuclei in the table is 10%, and could be used as an uncertainty. However, the carbon nucleus is essential to our physics program, and has the largest discrepancy, so we should take that larger value to represent our 1 uncertainty for MINERvA. There are subtle differences between the RPA effect for different nuclei, described in Sec. 9, we will apply the uncertainty prescription to a base central value specific to carbon, oxygen, iron, and lead, rather than reusing carbon for all of them.
There is some difference in the RPA effect for anti-neutrinos, which are exaggerated by an energy dependence, which is described in Sec. 8. It is driven by the vector-axial interference term, but is significant only at momentum transfers near the upper kinematic limits. It may cause artifacts when the high momentum transfer weights from the Valencia model are applied to events generated from another model like GENIE. For MINERvA, we have simplified our treatment of the weight as described in Sec. 6.
Finally, there is negligible difference between the predicted suppression for the and cases, and we use the latter for all neutrino reactions. The neutral current case is not currently considered, but should also show the effect, as it was obviously there also for electron scattering [7].
The RPA effect at low can be though of as a screening effect. The spectral function effect is more like a transfer of cross section strength to a high energy transfer tail, which can produce a distortion similar in some ways to the RPA effect. A followup study of nuclear effects [8] by Juan Nieves and Joanna Sobczyk incorporate spectral function like elements into the previous analysis, and remake comparisons to muon capture data in their Table IV. The variations of RPA, Spectral Function, and the two combined cluster closer together than the discrepancy with the data for Carbon. Therefore the prescription for a 25% uncertainty presented in this section still accomodates the tension between these models and the data, and is suitable for use without modification. Other aspects of the spectral function’s predicted energy and momentum transfer spectra are distorted more, and in ways not described by the RPA calculation.
4 Implementation of an uncertainty band
Repeating what was shown in Fig. 1, the Valencia model has both a relativistic calculation, which is our choice for the central value RPA effect, and also a non-relativistic calculation, and of course a CCQE calculation without RPA. A histogram file, saved from running their model code directly, includes all three calculations. Ratios are made from these calculations at = 20 GeV for both 1D distribution and on a 2D grid for momentum and energy transfers from 0.0 to 5.0 GeV. The differences between using the 1D or 2D inputs are described over the next two sections.
To produce a systematic that makes the enhancement bigger for most , we produce a weight that is 60% of the way from the central value RPA effect to the non-relativistic one. This fraction is increased smoothly from GeV2 down to lower , increasing the uncertainty to match the full non-relativistic prediction at a lower of 0.4 GeV2. This one-parameter magnitude is a good description of the band from the Sanchez/T2K analysis and is easy to implement.
The is made by going that far to the low side of the central value, but truncating the weight and not allowing it to go below 1.0 at high . The structure of the model does not allow a suppression at high , so this implementation also does not permit it. Note, this feature means we can not form a meaningful uncertainty, which requires special treatment in a many-universe method analysis.
Independently, a second set of weights are produced in the low momentum transfer regions (below 1.0 GeV) that reduce or increase the amount of suppression by 25%. These yield a data-driven error from the muon capture comparison, and are assumed to be uncorrelated with the uncertainty in the enhancement.
5 The implementation works also for a 2D weight
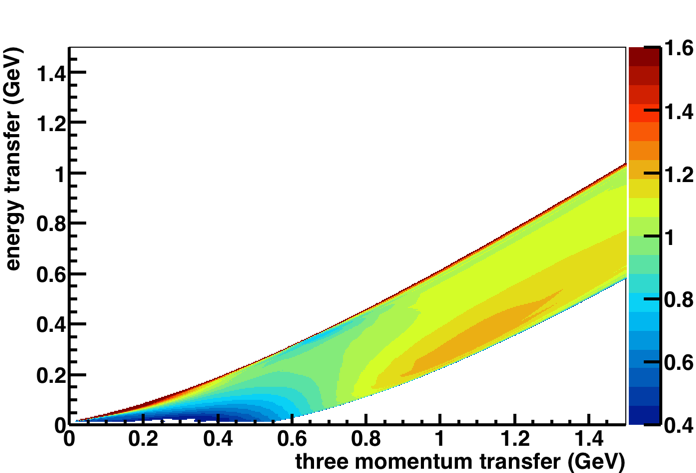
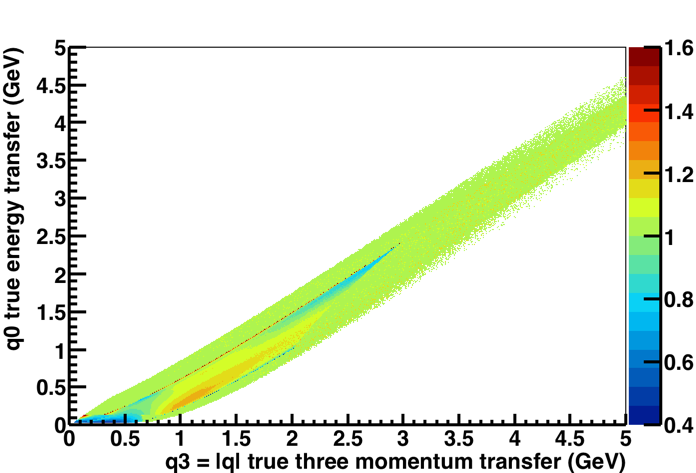
Sanchez and others in the past have done their analyses in one dimension , but the RPA effect in the model has substructure in energy transfer (also called “nu” or ) and three-momentum transfer (or or q). In the Valencia calculation, the suppression appears to be more a function of than . In contrast, the enhancement has the effect of slightly shifting the QE peak to lower in addition to the broad trend.
We capture these effects by implementing the CCQE reweight in two dimensions, using a lookup table saved as a TH2D Root histogram. The weight is made from the ratio of the CCQE with RPA / CCQE without RPA, both with the Valencia model, and so only captures the RPA effect. Other aspects that may make the Valencia model different than GENIE, such as their choice of MA or the use of a local Fermi gas are not part of the weight, but are visible in this analysis.
Two important points. The prescription in the previous section is applied at each point in a 2D space of (,), not , but will yield the required distortion for analyses that integrate the cross section to produce the distribution. There are differences in (,) between the GENIE events to be weighted and the Valencia cross section from which we obtain the weights that require a slight variation on the prescription.
The next subsections illustrate the 2D weight from the Valencia model, and are designed to allow you to flip-book the neutrino and anti-neutrino weights to see how similar they are.
For technical completeness, these are the same 20.0 GeV neutrino energy calculations from the Valencia authors’ FORTRAN code. They are binned finely with 1000 bins per GeV in momentum and energy transfer up to 5.0 GeV. With such fine binning, no interpolation is needed or used. However, the resulting filesize would typically be of megabytes when the full 5.0 GeV range is used (for each nu and anti-nu, for each nucleus). For running under MINERvA production-style Grid Computing conditions, histograms are made only up to 3.0 GeV. More coarsely binned histograms, with an interpolation could also be made, if Grid bandwidth or memory restrictions require it. The 2D histograms are the most natural basis for the calculation. The curves from the Valencia model shown in this paper are made directly integrating the double-differential cross sections.
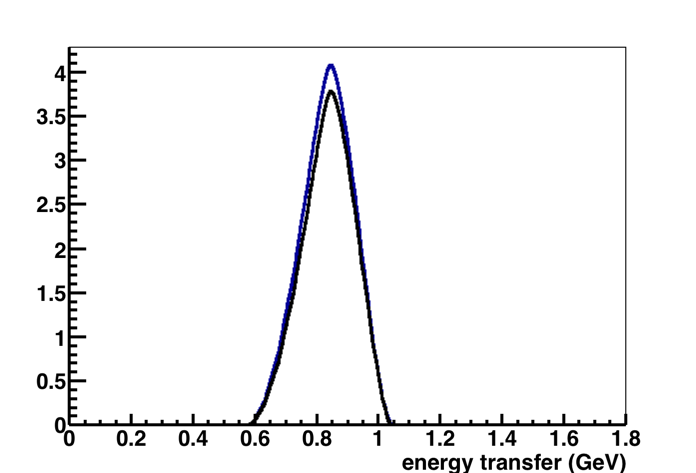
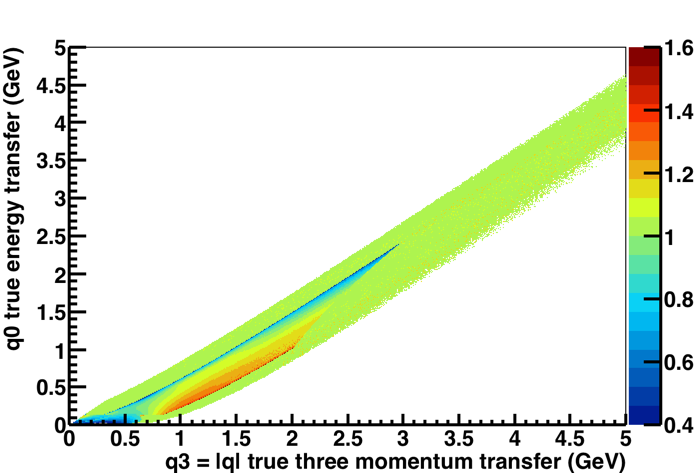
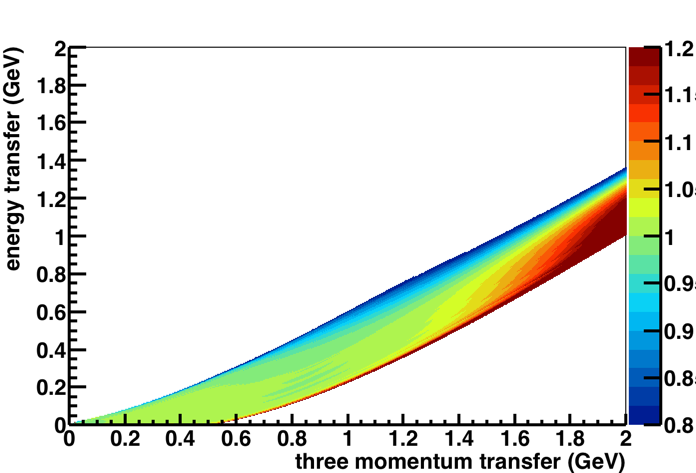
5.1 Neutrino 2D ratio used as central value weight
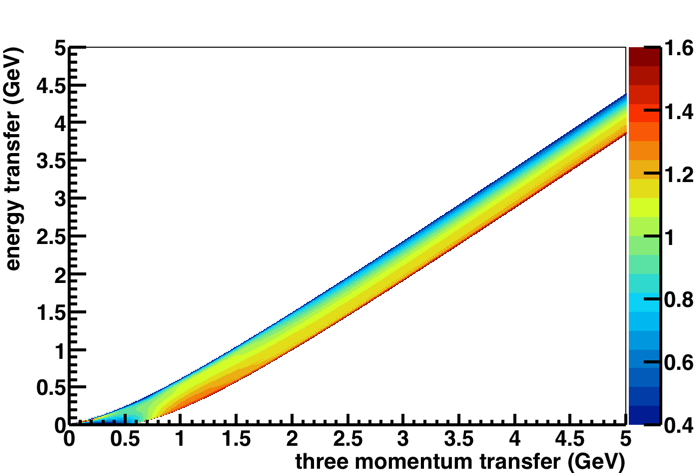

The low momentum transfer region shows a suppression that reduces energy transfers on the low side of each peak more than on the high side of each peak. By GeV, the enhancement (blue curve is higher than the black) is approximately but not perfectly the same shape as the original peak, enhanced and relatively wider and shifted slightly to lower energy transfers.
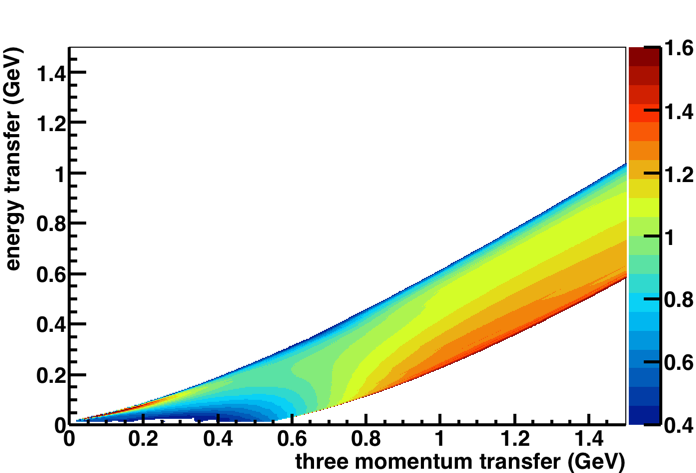
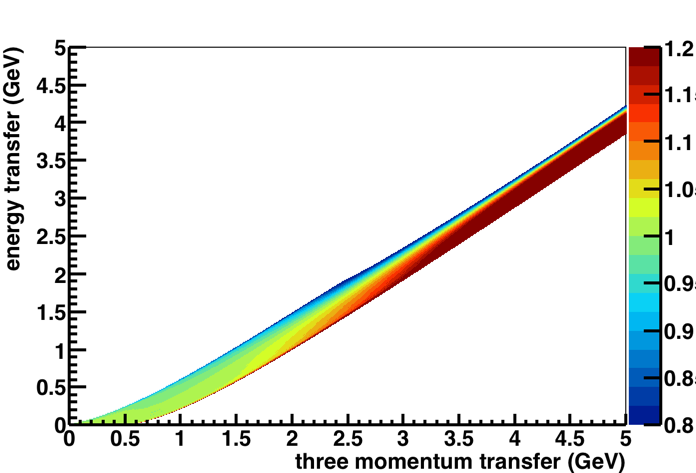
5.2 Anti-neutrino 2D ratio used as central value weight
The anti-neutrino trends have the same magnitude up to about 1.5 GeV. The low momentum transfer region shows a suppression that reduces energy transfers on the low side of each peak more than on the high side of each peak. By GeV, the enhancement (blue curve is higher than the black) is approximately but not perfectly the same shape as the original peak, enhanced and relatively wider and shifted slightly to lower energy transfers. The magnitude of the effect is slightly different, presumably following the vector-axial interference term’s significance as it changes sign.
6 Model Skew Workarounds
Because we are applying an “optional” feature of one model on top of another model’s base predictions, we will be afflicted by (and need to workaround) cases where the two base predictions disagree. (Its only optional from the code’s perspective. Its not optional physics.) Most relevant, we are faced with applying a weight to some GENIE events that have no analog in the Valencia model, and vice versa. A second concern, the ( or ) peaks of the two distributions are not in identical locations nor do they have identical shapes. We can do something sensible with these; its a classic case of not letting perfect be the enemy of the good. If MINERvA had the ability in 2016 to cleanly use a consistent base model, we would, but that is not a luxury we have until 2017. Instead, we are bootstrapping to a 2017/2018 model future, learning along the way.
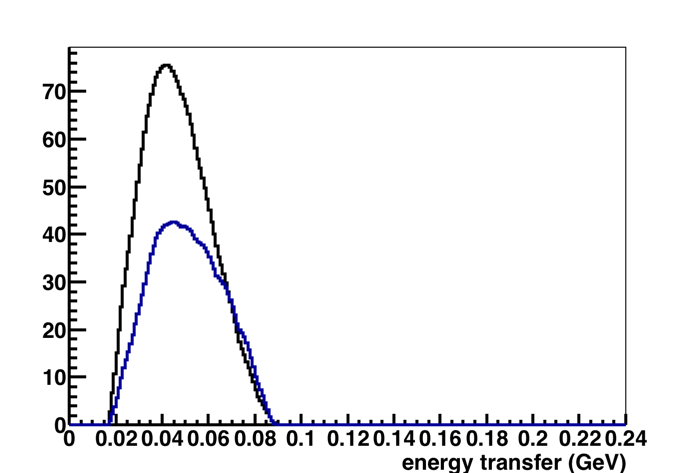
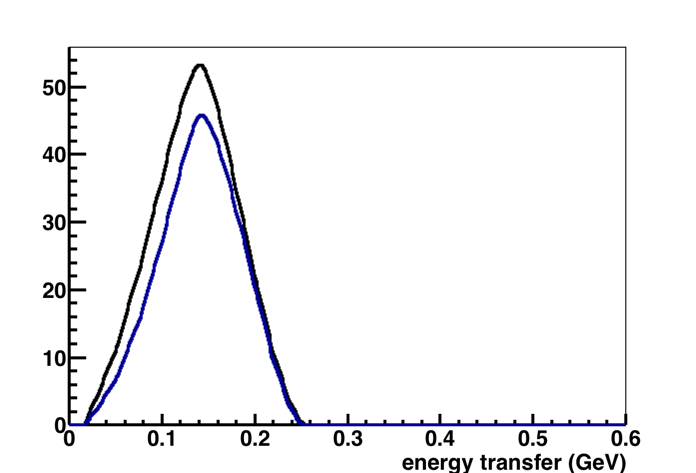
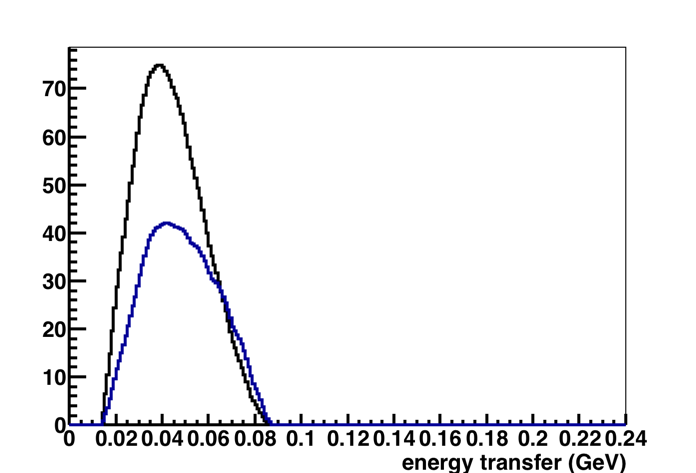
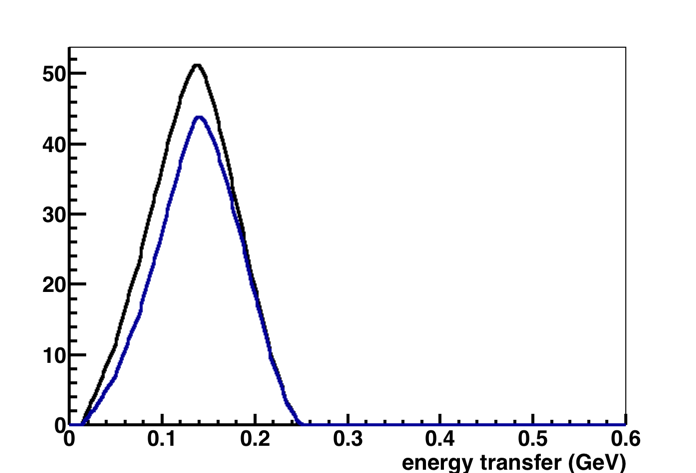
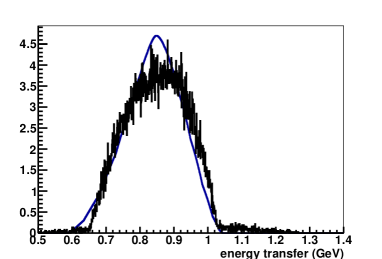
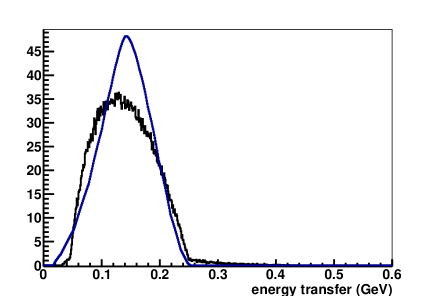
The following two 1D plots for 5 GeV anti-neutrino carbon quasielastic reactions show the effects better than the 2D plots. The Valencia model is the no-RPA, yes local Fermi-gas version; the GENIE model is the default global Fermi-gas. (There is no global Fermi-gas version of the Valencia model). The left is at the lowest = 0.1 MeV, the right is higher = 1.5 GeV.
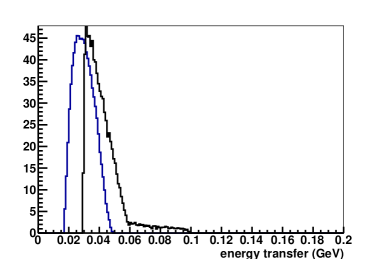
The pattern is a systematic shift of the cross section up by about 10 MeV; GENIE is the higher one. This is probably as simple as an overall offset due to different assumptions about removal energy. In effect, GENIE produces a higher threshold of 41 MeV for carbon, a combination of removal energy (25 MeV) and a Pauli blocking artifact, so events below that threshold do not contribute to the cross section or event rate. Valencia assumes something more like 17 MeV for neutrinos and 14 MeV for anti-neutrinos, coming from using the Q-value for the charged current reaction in the initial energy conservation step. Its possible there are complications due to the local Fermi-gas nature too, which allow different removal energies for different locations in the nucleus.
6.1 enhanced prescription item one: energy transfer offset
So the prescription described earlier has five more ingredients. We have engineered that the RPA weight given to a GENIE event comes from Valencia kinematics at the same but 0.010 GeV lower energy transfer.
6.2 enhanced prescription item two: momentum transfer offset
The second feature is that GENIE has a wider distribution, due in part or in most to the Bodek Ritchie tail designed to kinematically mimic the SRC/spectral function feature of the nucleon momentum distribution. These events do not have a corresponding weight in the Valencia model, though also they are a minority of events.
We identify these events, below 0.15 GeV energy and momentum transfer, as having no weight (zero weight) in the 2D histogram. Instead of eliminating them (weight of zero) or doing nothing (weight of 1.0), we assign them the weight from the Valencia model from the same energy transfer but a momentum transfer 0.150 GeV higher.
6.3 enhanced prescription item three: switch to parameterized weight
The underlying shapes and peak locations are different, even the middle of the peak at higher momentum transfers. The Valencia peak is narrower, an expected outcome of using a local-Fermi gas. Applying a weighting from one shape that tries to enhance and shift the cross section to another whose peak is different could have a detrimental effect, suppressing the cross section instead of enhancing it. In this situation, it is easiest to choose between preserving the few MeV shift or the enhancement of the integrated cross section, whichever is more important for the physics studies.
For MINERvA at high momentum transfers (i.e. relatively energetic hadron systems) preserving the integrated cross section is probably more important. The 2D histogram will be used only from GeV2, roughly equivalently GeV. The switch will also happen for GeV, which is a tiny part of parameter space not already covered, but allows us to optimally squeeze the input histogram size. Any events with higher momentum transfer will be assigned a weight from a polynomial parameterization up to GeV2 (or GeV). Finally, for the rare QE events at higher momentum transfers, we will assign no weight = 1.00 .
6.4 enhanced prescription item four: enhance the high momentum transfer uncertainty
At high momentum transfers there are artifacts of energy and dependence in this method that are larger than the difference between the relativistic and non-relativisic calculations. These artifacts could be as big as 2%. As the prescription described here leads to a value of the high enhancement of around 1.02 at roughly GeV2, the resulting uncertainty band will be smaller than these artifacts. We inflate the positive error to remain 0.03 above the central value and the negative error to remain pinned to a weight of 1.0. Actually, the anti-neutrinos have larger artifacts than the neutrinos, and we could use different errors in this spot. However, this is a situation where these model (and model-implementation) uncertainties will be dwarfed by the uncertainty in the axial form factor, and we need a concrete procedure more than we need to worry about the error on an error.
6.5 enhanced prescription item five: limit enhancement to 2.0
There are kinematics along the upper edge of the QE band where the RPA version of the model puts events where the no-RPA version has very few events. This leads to a narrow region that gets excessivey large weights. If it was applied to just the Valencia model, the net effect would be right. Because those weights are applied to a different default model, it can produce an anomalous absolute event rate at some kinematics. To prevent this, weights above 2.0 are forced back to exactly 2.0.
6.6 one more comment
The fundamental prescription in this technical note can be used to provide an uncertainty band even if the Valencia model itself is the base model being considered. For example, a version of the model is included in GENIE 2.12 in a form that includes explicit generation of proton kinematics, which this reweighting procedure can not do. With no skew between models, not all the enhanced prescription steps are necessary. Possibly only item four above is desireable. As of this writing, GENIE 2.12 does not generate an uncertainty band like is described here.
7 Q2 vs energy transfer weights
Historically, analysis of neutrino data has centered on distributions, and things like an RPA suppression has been expressed as a function . The Valencia calculation features a suppression that is arguably preserves more detail in form. The latter comes at the cost of a more computationally intense 2D weight. Is the difference observable, and does it matter? Probably.
These two plots show the distortion of GENIE events using two different RPA weighting methods. The left one using the method we propose for MINERvA; it is the central value weight actually applied after all details of the implementation described previously. The right one uses a polynomial fit to the same Valencia model projected onto Q2, then applied to the same GENIE events.
Notice the suppression has a radically different effect as a function of for momentum transfers GeV. This is particularly interesting kinematics for the MINERvA “low-recoil” analysis [2] observables. To use the weight, even if derived from the Valencia calculation, would not at all be keeping in the spirit of the physics of that calculation. In particular, the version systematically suppresses the QE in the dip region, which is the opposite of what the MINERvA data [2] want in an improved QE (or 2p2h) model. It may be interesting to have it coded up as an alternate, a tool for exploring sensitivities (e.g. its a functional form that can be applied to resonance events), but its definitely not the Valencia QE model.
The weights can be obtained directly from the integrated model, as saved and shown in Fig. 7, same as used for the central (red) value in Fig. 1. In addition, a polynomial with 10 parameters can be fit, for computational situations where reading in a large data file is not efficient enough. This fit is also shown on Fig. 7, where you can see variations and wiggles that are not larger than 0.5%, except for the data points closest to . As of this writing, we package the polynomial fits, the model Q2 ratios, and the 2D ratios in a single file for the neutrino, carbon combination, and a second file for anti-neutrino, carbon. Similar files are available for 16O, 40Ar, 40Ca, 56Fe, 208Pb, thus covering a wide range of nucleus sizes.


8 Energy dependence
The energy dependence of the predicted RPA effect is well controlled for most analyses at low momentum transfer, for the MINERvA flux.
The simplest implementation strategy is to use the weights generated from 20 GeV neutrino interactions for all energies. The lower energy GENIE events to be weighted simply have no events at impossible kinematics. Events at higher kinematics than available at 20 GeV will get a weight of 1.00 in any case. In the following discussion, I will refer to a the “energy simplicity mistake” to be the difference between result from the 20 GeV histogram and the one we should have applied if we generated the weight from the exact energy. This energy simplicity mistake is within 5% at most kinematics, and better than 1% when integrating slices of .
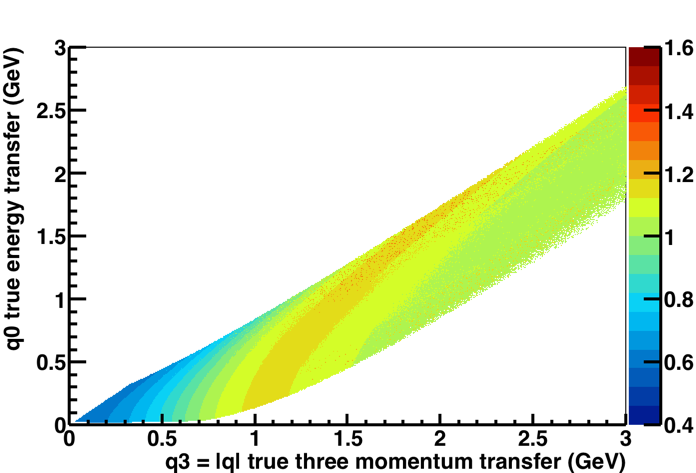
The actual detail of the Valencia model is more interesting, and is shown using a pair of double ratios in Fig. 8. These are computed for oxygen just for variety; the results are the same for carbon. The left plot is (neutrino oxygen 1 GeV RPA / noRPA) / (neutrino oxygen 20 GeV RPA / noRPA). The middle plot is the same, but with 2 GeV in the numerator, and the right plot is 5 GeV, where the bounds are wider to show the entire range. The color axis range is the same for all three plots, but smaller, just 20% here, instead of 60% elsewhere in this paper.
At low momentum transfer, the double ratio is all green. Applying a weight based on the 20 GeV calculation accurate to within 5%, in the suppression region especially, smaller than the errors we were already going to assign in that region.
In contrast, in the upper kinematic regions where the RPA effect enhances the QE cross section, there is a significant distortion of the RPA weight, and therefore the energy-transfer spectrum. At specific kinematics, the energy simplicity mistake (applying the 20 GeV weight) could be as much as 20% different than we would have applied had our implementation had built-in access to the full energy dependence.
The most serious effect is following the upper kinematic boundary of the 1 GeV and 2 GeV samples in this case. It is more severe, not at fixed kinematics, but for kinematics closest to the backscattered boundary. By a typical MINERvA energy like 5 GeV, the energy simplicity distortion only becomes significant above GeV. That the severity is worse still for the anti-neutrino case suggests a common cause within the calculation. The vector-axial interference term gains relative significance at momentum transfers closer to the neutrino energy (lepton is more backscattered), and especially so for anti-neutrino where the interference term reduces the cross section.
Though these 20% effects are visible in the model at specific high momentum-transfer kinematics, they represent a shift in the cross section strength to lower energy transfers, rather than an overall modification of the enhancement. Integrating the cross section along a line of constant three-momentum transfer yields a net energy simplicity mistake that translates into a shift in average energy transfer of 5 to 10 MeV, but at most 1% of the total event rate.
We already chose a simplification in Sec. 6 that takes advantage of this integral property of the Valencia model. We transition from the 2D weight below GeV2 to a 1D based weight, then to no weight above 9.0 GeV2. The justification here is the same: the accumulated simplifications on a small correction for the higher QE tail, which anyway we may never be able to analyze in detail, are safer than the application of the high momentum transfer 2D weights from the Valencia model to GENIE events.
This issue must be severe for T2K, MiniBooNE, and MicroBooNE, where all details of the RPA effect described here are active for their whole QE kinematics all the time. MiniBooNE explicitly measures backscattered leptons in all their core measurements. For NOvA to use this procedure, it may be enough to choose a baseline calculation of 3 or 4 GeV. The relevant energies in DUNE span the whole range, but they have the luxury of some time to investigate their best strategy, or even wait for more information from currently running experiments. If MINERvA analysis progresses to the point where we are picking out backscattered QE events at GeV2 and analyzing detailed hadron energy distributions, we will have achieved so many other victories along the way, we’ll be too busy with our adoring fans and “prizes and like that” 111phrase from a 1980’s Minneapolis radio D.J. that you would be challenged to find with a name-brand search engine to remember to fix this up.
9 Other nuclei
This figure illustrates the ratio of ratios Pb(RPA/not)/C(RPA/not). The Valencia model changes the Q-value for the reactions, as well as the nuclear density parameters used for the RPA and local Fermi-gas parts of the model.
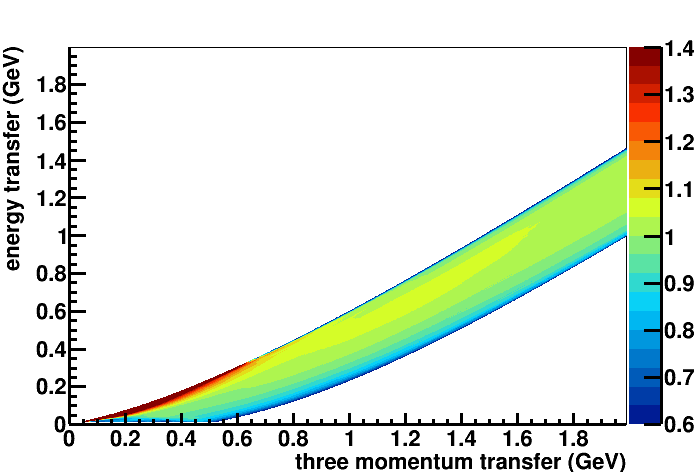
This also looks like a mild shift in the QE peak to higher energy transfers for the Pb at very low momentum transfer, and modestly different shape overall. The Q-value piece of the valencia model allows energy transfers down to near zero for Pb, instead of the 14 or 17 for Carbon. Combined with an RPA distortion that might otherwise be different in a larger nucleus.
10 Closure tests
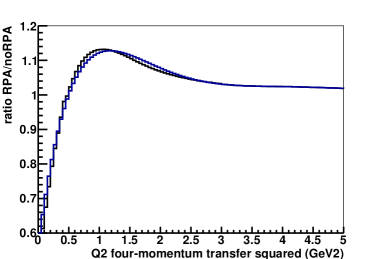
At the top of this page, Fig. 11 on the left are the final 2D weights applied to GENIE neutrino events. On the right are the same QE GENIE events integrated to produce the distribution, then the RPAweighted/default GENIE ratio is shown. This page can be flipbooked with the antineutrino equivalent on the next page.
The central-value ratio comes out nearly identical, so the procedure robustly implements the RPA effect as a weight, despite the differences between the Valencia and GENIE QE models. The differences at low are overwhelmed by the enhanced uncertainty from muon capture. The glitch at GeV2 is due to the model skew applying Valencia weights to the GENIE base model events, and is only 1%. That is easily within the 3% uncertainty assigned there, which anyway will be in quadrature with the larger axial form factor uncertainty.
Closure tests anti-neutrino
At the top of this page, Fig. 12 on the left are the final 2D weights applied to GENIE anti-neutrino events. Can flipbook in the electronic version of this document.
This also passes the test, that the 2D weight returns the 1D suppression more accurately than the rest of the uncertainties we will assign, despite the model skew between GENIE and Valencia.
11 Additional comments
11.1 Apply to the resonances?
Why not ? We can, almost. But the (,) weight is inappropriate as is. The Delta is offset to higher energy and momentum transfers, for the same , compared to QE events. We could simply apply the weights and see what happens. I’ve done that with some generator studies. The result is a fair match for the published MINOS result [24], the MiniBooNE result [25, 26], (and seems to go the right direction to describe some MINERvA distributions too). A central value like this with an on/off as uncertainty may be appropriate.
Speculation: a real RPA calculation may reveal a (,) structure similar to the QE case, with simple offsets to map it onto a line of invariant mass W=1.232 GeV, at least for the 1232 resonance. This would preserve a suppression on the low side of the W line, and have less suppression on the high side. Equally valid guess is we learn from our theory colleagues to expect much less RPA suppression for resonance events, but a yet different effect is large.
11.2 Neutral current
The neutral current case is not currently considered, but should also show the effect, as was there also for the electron scattering case. It may be possible to use the simpler or the more expensive (,) version of this weight, in the code fragment above, or a variation of it, as a crude approximation for NC events. Suitable to test for analysis sensitivity anyway, e.g. for sterile neutrino oscillations analyses.
11.3 Local Fermi gas
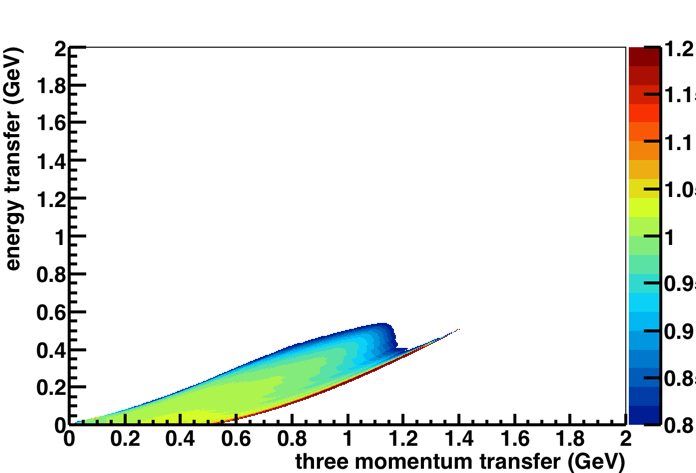
The Valencia calculation includes a local Fermi gas model (LFG), which is an additional interesting feature of the model. You can see the effects in the 1D plots of GENIE vs. Valencia, such as Fig. 5, for which the 500 MeV version is shown here.
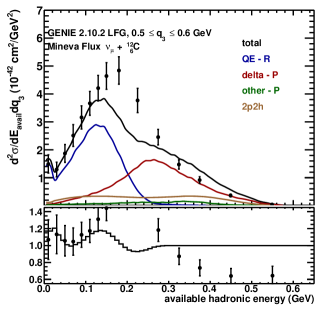
We have separately been exploring a reweight of Valencia LFG to GENIE QE, applied using the same histogram 2D weight method. To leading order, it appears the two effects are separable. One example is the right hand plot, comparing a modified model to the data from [2]. The baseline in that plot already had a prototype version of the RPA effect weight described in this paper, to which a new LFG weight is added based on the 5 GeV Valencia calculation. It is being compared to the cross section that additionally has a 2D histogram-based weight for the Valencia local Fermi gas. The distortions are the same size as the uncertainties on the data; modern experiments and analysis techniques do have sensitivity to these nuclear effects. However, the local Fermi gas does not distort the model enough to meet the data, it must be only one component of a post-Fermi gas answer.
Continuing this exploration is beyond the scope of this paper, but the reweight technique used for the RPA and here for LFG may be advantageous for fast exploration of these effects. An implementation of the full Valencia model, including the local Fermi gas, is newly available in GENIE version 2.12 .
12 Conclusion
We have captured the leading order effects of an RPA-type multi-nucleon model and assigned an uncertainty to these effects. This procedure can be used with a Fermi gas model from an event generator to apply an RPA model correction and its uncertainty as a reweight to already generated events.
Acknowledgements
We are grateful for the work of Federico Sanchez and his student Bruno [] . Juan Nieves offered suggestions to improve the paper, and insight from the latest preprint with Joanna Sobczyk. The Valencia model, with RPA and Local Fermi Gas effects has also now been coded directly into GENIE by Steve Dytman and his student , and is available as of release 2.12. The parameters discussed here may be exposed in that implementation, I’m not sure. That version was not yet available for testing for this analysis, but will be of interest to some users of CCQE interaction models. This work was supported by NSF awards 1306944 and 1607381 to the University of Minnesota Duluth.
References
- [1] C. Andreopoulos, et al., The GENIE Neutrino Monte Carlo Generator, Nucl. Instrum. Meth. A614 (2010) 87–104. arXiv:0905.2517, doi:10.1016/j.nima.2009.12.009.
- [2] P. A. Rodrigues, et al., Identification of nuclear effects in neutrino-carbon interactions at low three-momentum transfer, Phys. Rev. Lett. 116 (2016) 071802. arXiv:1511.05944, doi:10.1103/PhysRevLett.116.071802.
- [3] R. Gran, et al., Measurement of the quasi-elastic axial vector mass in neutrino-oxygen interactions, Phys.Rev. D74 (2006) 052002. arXiv:hep-ex/0603034, doi:10.1103/PhysRevD.74.052002.
- [4] A. S. Meyer, M. Betancourt, R. Gran, R. J. Hill, Deuterium target data for precision neutrino-nucleus cross sections, Phys. Rev. D93 (11) (2016) 113015. arXiv:1603.03048, doi:10.1103/PhysRevD.93.113015.
- [5] J. Nieves, J. E. Amaro, M. Valverde, Inclusive quasi-elastic neutrino reactions, Phys. Rev. C70 (2004) 055503. arXiv:nucl-th/0408005, doi:10.1103/PhysRevC.70.055503,10.1103/PhysRevC.72.019902.
- [6] M. Valverde, J. E. Amaro, J. Nieves, Theoretical uncertainties on quasielastic charged-current neutrino-nucleus cross sections, Phys. Lett. B638 (2006) 325–332. arXiv:hep-ph/0604042, doi:10.1016/j.physletb.2006.05.053.
- [7] A. Gil, J. Nieves, E. Oset, Inclusive (e, e-prime N), (e, e-prime N N), (e, e-prime pi): Reactions in nuclei, Nucl. Phys. A627 (1997) 599–619. arXiv:nucl-th/9710070, doi:10.1016/S0375-9474(97)00515-0.
- [8] J. Nieves, J. E. Sobczyk, In medium dispersion relation effects in nuclear inclusive reactions at intermediate and low energiesarXiv:1701.03628.
- [9] J. Nieves, I. Ruiz Simo, M. Vicente Vacas, The nucleon axial mass and the MiniBooNE Quasielastic Neutrino-Nucleus Scattering problem, Phys.Lett. B707 (2012) 72–75. arXiv:1106.5374, doi:10.1016/j.physletb.2011.11.061.
- [10] R. Gran, J. Nieves, F. Sanchez, M. Vicente Vacas, Neutrino-nucleus quasi-elastic and 2p2h interactions up to 10 GeV, Phys.Rev. D88 (2013) 113007. arXiv:1307.8105, doi:10.1103/PhysRevD.88.113007.
- [11] M. Martini, N. Jachowicz, M. Ericson, V. Pandey, T. Van Cuyck, N. Van Dessel, Electron-neutrino scattering off nuclei from two different theoretical perspectives, Phys. Rev. C94 (1) (2016) 015501. arXiv:1602.00230, doi:10.1103/PhysRevC.94.015501.
- [12] M. Martini, M. Ericson, G. Chanfray, J. Marteau, A Unified approach for nucleon knock-out, coherent and incoherent pion production in neutrino interactions with nuclei, Phys. Rev. C80 (2009) 065501. arXiv:0910.2622, doi:10.1103/PhysRevC.80.065501.
- [13] M. Martini, M. Ericson, G. Chanfray, J. Marteau, Neutrino and antineutrino quasielastic interactions with nuclei, Phys. Rev. C81 (2010) 045502. arXiv:1002.4538, doi:10.1103/PhysRevC.81.045502.
- [14] M. Martini, M. Ericson, G. Chanfray, Neutrino quasielastic interaction and nuclear dynamics, Phys. Rev. C84 (2011) 055502. arXiv:1110.0221, doi:10.1103/PhysRevC.84.055502.
- [15] S. K. Singh, E. Oset, Quasielastic neutrino (anti-neutrino) reactions in nuclei and the axial vector form-factor of the nucleon, Nucl. Phys. A542 (1992) 587–615. doi:10.1016/0375-9474(92)90259-M.
- [16] S. K. Singh, E. Oset, Inclusive quasielastic neutrino reactions in C-12 and O-16 at intermediate-energies, Phys. Rev. C48 (1993) 1246–1258. doi:10.1103/PhysRevC.48.1246.
- [17] S. K. Singh, N. C. Mukhopadhyay, E. Oset, Inclusive neutrino scattering in C-12: Implications for muon-neutrino to electron-neutrino oscillations, Phys. Rev. C57 (1998) 2687–2692. arXiv:nucl-th/9802059, doi:10.1103/PhysRevC.57.2687.
- [18] C. Volpe, N. Auerbach, G. Colo, T. Suzuki, N. Van Giai, Microscopic theories of neutrino C-12 reactions, Phys. Rev. C62 (2000) 015501. arXiv:nucl-th/0001050, doi:10.1103/PhysRevC.62.015501.
- [19] E. Kolbe, K. Langanke, G. Martinez-Pinedo, P. Vogel, Neutrino nucleus reactions and nuclear structure, J. Phys. G29 (2003) 2569–2596. arXiv:nucl-th/0311022, doi:10.1088/0954-3899/29/11/010.
- [20] N. Jachowicz, K. Heyde, J. Ryckebusch, S. Rombouts, Continuum random phase approximation approach to charged current neutrino nucleus scattering, Phys. Rev. C65 (2002) 025501. doi:10.1103/PhysRevC.65.025501.
- [21] V. Pandey, N. Jachowicz, J. Ryckebusch, T. Van Cuyck, W. Cosyn, Quasielastic contribution to antineutrino-nucleus scattering, Phys. Rev. C89 (2) (2014) 024601. arXiv:1310.6885, doi:10.1103/PhysRevC.89.024601.
- [22] V. Pandey, N. Jachowicz, T. Van Cuyck, J. Ryckebusch, M. Martini, Low-energy excitations and quasielastic contribution to electron-nucleus and neutrino-nucleus scattering in the continuum random-phase approximation, Phys. Rev. C92 (2) (2015) 024606. arXiv:1412.4624, doi:10.1103/PhysRevC.92.024606.
- [23] V. Pandey, N. Jachowicz, M. Martini, R. González-Jiménez, J. Ryckebusch, T. Van Cuyck, N. Van Dessel, Impact of low-energy nuclear excitations on neutrino-nucleus scattering at MiniBooNE and T2K kinematics, Phys. Rev. C94 (5) (2016) 054609. arXiv:1607.01216, doi:10.1103/PhysRevC.94.054609.
- [24] P. Adamson, et al., Study of quasielastic scattering using charged-current νμ -iron interactions in the MINOS near detector, Phys. Rev. D91 (1) (2015) 012005. arXiv:1410.8613, doi:10.1103/PhysRevD.91.012005.
- [25] A. A. Aguilar-Arevalo, et al., Measurement of Neutrino-Induced Charged-Current Charged Pion Production Cross Sections on Mineral Oil at E, Phys. Rev. D83 (2011) 052007. arXiv:1011.3572, doi:10.1103/PhysRevD.83.052007.
- [26] A. A. Aguilar-Arevalo, et al., Measurement of -induced charged-current neutral pion production cross sections on mineral oil at GeV, Phys. Rev. D83 (2011) 052009. arXiv:1010.3264, doi:10.1103/PhysRevD.83.052009.