Mass modelling of Superthin Galaxies: IC5249, UGC7321, IC2233
Abstract
Superthin galaxies are low surface brightness disc galaxies, characterised by optical discs with strikingly high values of planar-to-vertical axes ratios ( 10), the physical origin and evolution of which continue to be a puzzle. We present mass models for three superthin galaxies: IC5249, UGC7321 and IC2233. We use high resolution rotation curves and gas surface density distributions obtained from HI 21 cm radio-synthesis observations, in combination with their two-dimensional structural surface brightness decompositions at Spitzer 3.6 m band, all of which were available in the literature. We find that while models with the pseudo-isothermal (PIS) and the Navarro-Frenk-White (NFW) dark matter density profiles fit the observed rotation curves of IC5249 and UGC7321 equally well, those with the NFW profile does not comply with the slowly-rising rotation curve of IC2233. Interestingly, for all of our sample galaxies, the best-fitting mass models with a PIS dark matter density profile indicate a compact dark matter halo i.e., 2 where is the core radius of the PIS dark matter halo, and is the radial scale-length of the exponential stellar disc. The compact dark matter halo may be fundamentally responsible for the superthin nature of the stellar disc, and therefore our results may have important implications for the formation and evolution models of superthin galaxies in the universe.
keywords:
galaxies: spiral - galaxies: structure - galaxies: kinematics and dynamics - galaxies: individual: IC5249 - galaxies: individual: UGC7321 - galaxies: individual: IC22331 Introduction
Superthin galaxies are low surface brightness edge-on galaxies
with ”razor-thin” optical discs characterised by unusually high values of vertical-to-planar axes ratio ( 10) with little or
no discernable bulge component. They are typically gas-rich and dark matter dominated
with very low star formation rates, low metallicity and dust content, and are classic examples of
under-evolved, late-type galaxies (See Matthews, Gallagher & van Driel 1999; Kautsch 2009 for a review).
The term ”superthin” was coined by Goad & Roberts (1981) who did spectroscopic studies of a group of four such galaxies:
UGC 4278, 7170, 7321, and 9242. Karachentsev, Karachentseva & Parnovskij (1993) conducted a systematic search for disc-like edge-on-galaxies
with diameter a 40 and a major-to-minor axis ratio a/b 7 using the Palomar Observatory Sky Survey and the ESO/SERC
survey, which culminated in the Flat Galaxy Catalogue (FGC) containing 4,455 flat or bulge-less galaxies covering 56 of the whole sky, and
eventually the Revised Flat Galaxy Catalogue (RFGC) containing 4,236 galaxies covering the whole sky (Karachentsev et al. 1999). Superthins
constitute a special category of the FGC galaxies with major-to-minor axes ratio a/b 10, which have also been extensively
studied later as part of other surveys related to edge-on, disc galaxies in general (Dalcanton & Bernstein 2002; Kregel, van der Kruit & Freeman 2005; Kautsch et al. 2006; Yoachim & Dalcanton 2006; Comeron et al. 2011; Bizyaev et al. 2014).
Being rich in neutral hydrogen gas (HI) content, superthin galaxies have been observed in the HI 21 cm radio observations as well.
Matthews & van Driel (2000) conducted a survey to measure the HI content of a sample of 400 gas-rich FGC galaxies
which confirmed rich reserves of HI in them. However, HI 21 cm radio-synthesis
observations aimed at studying distribution and kinematics of HI in superthins have been sparse (But, see, van der Kruit et al. 2001;
Uson & Matthews 2003;
O’Brien et al. 2010a). Since the size of the HI disc in spiral galaxies is in general a few times the size of the optical disc, HI may act as a
useful diagnostic tracer of the underlying gravitational potential of the galactic dark matter halo. In fact, for edge-on or moderately edge-on
galaxies, HI 21 cm spectroscopic observations may be used to determine the galactic rotation curve, which, in combination with stellar surface
photometry studies, can be used to construct galaxy mass models, thereby determining the density profile of the dark matter halo.
(de Blok et al. 2001, 2008; Oh et al. 2008, 2015). In addition, HI vertical scale-height data may be used to
constrain the vertical component of the underlying gravitational field, and thereby the flattening of the
galactic dark matter halo density distributions (See, for example, Banerjee & Jog 2011 and the references therein).
According to the modern theories of galaxy
formation and evolution, galaxies form and evolve at the centres of the gravitational potentials of their dark matter haloes,
which therefore play a crucial role in regulating the disc structure and dynamics. Using the joint constraints of the HI rotation curve and
the HI scale-height data, Banerjee, Matthews & Jog (2010) found that the superthin
galaxy UGC 7321 has a dense and compact dark matter halo i.e., 2 where is the core radius of the dark matter halo, and
is the radial scale-length of the stellar disc (See, also, O’Brien, Freeman & van der Kruit. 2010d). Using their 2-component model of gravitationally-coupled
stars and gas in the force field of a dark matter halo, Banerjee & Jog (2013) further showed that the gravitational potential of the compact
dark matter halo is primarily responsible for the superthin vertical structure of the stellar disc in UGC7321. This was a vital
clue towards developing a comprehensive theory of the origin and evolution of superthin galaxies. However we do not know if a compact dark
matter halo is a generic
feature of superthin galaxies as detailed mass modelling studies of superthins have been lacking until the current work.
In this paper, we therefore construct detailed mass models for three superthin galaxies viz. IC5249, UGC7321 and IC2233 for which high resolution HI rotation curves, HI radial surface density profiles as well as structural surface brightness decompositions of Spitzer 3.6 m images were available in the literature, with the main aim of understanding the density profile of their dark matter haloes. The rest of the paper is organised as follows: In §2, we describe our sample, in §3 the data and the input parameters, in §4 we discuss the mass models, followed by the results and discussion §5 and finally the conclusions in §6.
2 Sample
We consider a sample of three galaxies for our mass modelling studies viz. IC5249, UGC7321 and IC2233, which are
classic examples of superthin galaxies. Out of these, UGC7321 and IC2233 were two of the four superthins originally observed by
Goad & Roberts 1981 (§1). UGC7321, in particular, was studied in detail as a prototypical superthin, both in
multi-wavelength observations including the optical, mid-infrared as well as in HI (Matthews, Gallagher & van Driel. 1999, Matthews 2000, Uson & Matthews 2003,
Matthews & Wood 2003). The shape and density profile of its dark matter halo was also modelled using the joint constraints of the HI rotation
curve and the HI vertical scale-height (Banerjee et al. 2010, O’Brien et al. 2010d), which revealed a dense and compact pseudo-isothermal dark
matter halo (§4.2.2). Among our other two sample galaxies, the kinematics of the stellar disc of IC5249, another prototype and also one of the
flattest or thinnest galaxies ever known, was investigated using
stellar spectroscopy and HI observations, which indicated a stellar disc as hot as that of the Galaxy, contrary to the expectation of
an ultra-cold stellar disc as implied by its razor-thin appearance (van der Kruit et al. 2001). Since the disc vertical thickness is also
strongly regulated by the mass distribution of the different gravitating components in terms of the resulting vertical gravitational field,
it is crucial to obtain the mass models of these galaxies to understand their origin and evolution. However, detailed
mass modelling of these superthins have not been attempted so far (§1) although high resolution HI rotation curves were available in the
literature. In this paper, we have obtained mass models of these three superthin galaxies, using their
HI rotation curves and the HI surface density along with structural surface brightness decompositions of Spitzer 3.6 m images, all of which
were available in the literature.
Our sample constitutes nearby galaxies located within a distance D 10 - 30 Mpc. The galaxies are highly inclined or edge-on with inclination angle 88o - 90o and have high values of major-to-minor axes ratio a/b 7 - 10.3. Finally, they are low surface brightness with a de-projected B-band central surface brightness 22.6 - 24.5 mag arcsec-2. We summarise the basic properties of our sample galaxies in Table 1.
| Galaxy | Distance | Inclination | a/b 111major-to-minor axes ratio | 222Face-on central surface brightness in B-band |
|---|---|---|---|---|
| (Mpc) | (o) | (mag arcsec-2) | ||
| IC5249333Values quoted from van der Kruit et al. (2001) | 30.4 | 90 | 10.2 | 24.5 |
| UGC7321444Values quoted from O’Brien et al. (2010d) | 10 | 88 1 | 10.3 | 23.5 |
| IC2233555Values quoted from Matthews & Uson (2008) | 10 | 88.5 1.5 | 7 | 22.6 |
3 Data & Input Parameters
3.1 Stellar Photometry
We get the radial surface brightness profiles for our sample galaxies from the two-dimensional structural surface
brightness decompositions at Spitzer 3.6 m band for the complete sample of S4G galaxies
(Salo et al. 2015). Mid-infrared emission traces the old stellar
population dominant in late-type galaxies, whereas optical photometry indicates the young stellar population which constitutes only
a small fraction of the total stellar dynamical mass. Besides, the primary source of error in deriving stellar mass from observed
surface brightness distribution lies in obtaining the stellar mass-to-light ratio ()
from the population synthesis models (§4.3), which gets complicated by dust extinction issues predominant in edge-on galaxies. Unlike the
optical, mid-infrared emission is less prone to dust extinction, and is also unaffected by recent star formation, young stellar population and
choice of the Initial Mass Function (IMF) in the stellar population synthesis model. Therefore, it is commonly preferred over optical photometry to model the galactic stellar disc in mass-modelling studies (de Blok et al. 2008; Oh et al. 2008; Oh et al. 2015).
Salo et al. (2015) performed multi-component decompositions of the surface brightness profiles of the complete sample of S4G
galaxies using GALFIT 3.0.
The surface brightness profiles of the edge-on and the nearly edge-on galaxies were fitted with the GALFIT function edgedisk,
which is that of an exponential disc with a finite vertical thickness as viewed edge-on, and therefore
has four free parameters: the face-on, central surface brightness (), radial scale-length (), vertical scale -length () and the
position angle of the disc.
In some cases, a bulge, a bar or an additional thick disc component
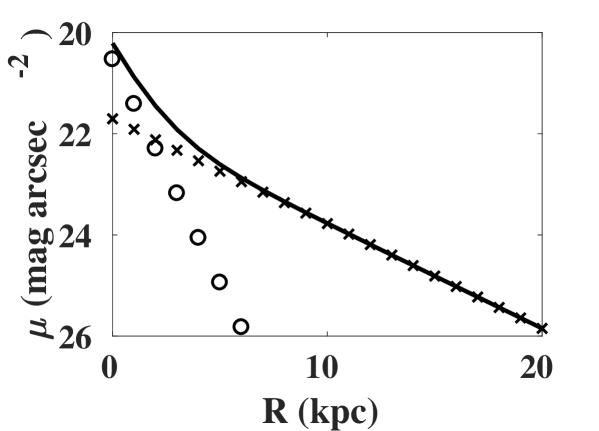
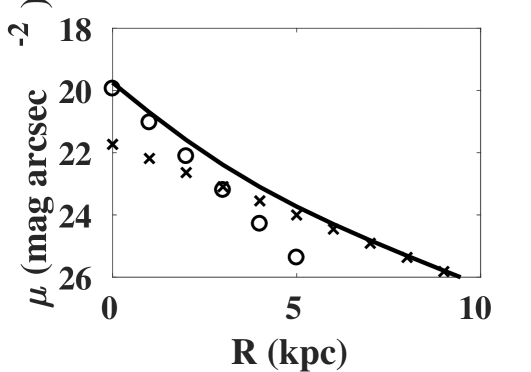
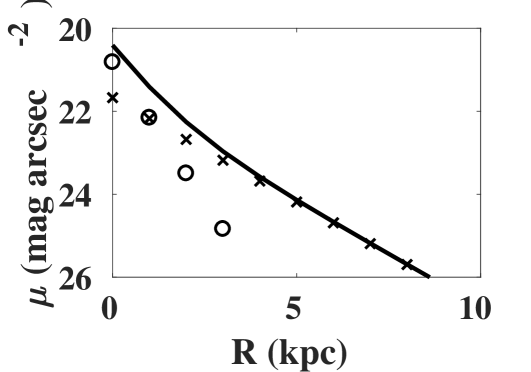
were also included. In Figure 1, we present the inclination-corrected radial surface brightness profiles for our sample galaxies,
obtained from the multi-component decompositions of their 3.6 m surface brightness profiles as given in the above paper.
All three of our sample galaxies were found to be consistent with a model comprising superposition of
two edge-on discs: the outer disc and the inner disc. Henceforth, we will denote the structural parameters of the outer disc
with a suffix 1 ((1), (1), (1)), and those of the inner disc with a suffix 2 ((2), (2), (2)).
Interestingly, unlike in the optical, the stellar discs of our
sample galaxies are not low surface brightness in nature in mid-infrared. Also, the high values of
the vertical-to-planar scale-length ratios 0.1 indicates that the stellar disc is also not superthin either in this band.
In general, the outer discs of our sample galaxies have a relatively lower surface brightness
((2) 21 mag arcsec-2) with a larger radial scale-length ((1) 2-5 kpc).
The inner discs, on the other hand, have a high de-projected disc central surface brightness ((2) 20 mag
arcsec-2) with a smaller radial scale-length ((2) 1 kpc).
The outer disc can therefore be taken to be the main stellar disc component of the galaxy.
Similarly, since the inner disc constitutes only a small fraction of the total model flux, it is
arguable if it can be taken to be the bulge or central spheroidal component of the host galaxy.
(See §5.2 de Blok et al. 2008; §3 of Salo et al. 2015, for discussion).
Finally, as the radial profile of the inner disc is steep and that of the outer one shallow, the stellar discs of
these galaxies are considered to be anti-truncated.
|
|
|
.
Our sample galaxies have almost identical values of the central surface brightness ((2) 21 mag arcsec-2) of their outer
discs. As far as the inner discs are concerned, UGC7321 has the highest central surface brightness
((1) 19 mag arcsec-2), which is an order of magnitude higher than those of IC5249 and IC2233.
((2) 20 mag arcsec-2). Finally,
with regard to the size of the inner disc, IC5249 has the smallest one ( 0.23) while UGC7321 and IC2233 have
relatively bigger inner disc components ( 0.37).
We present the structural
parameters of our sample galaxies at 3.6 m surface brightness profiles in Table 2.
| Galaxy 666Values quoted from Salo et al. (2015) | (1) 777Face-on surface brightness of outer disc in mag arcsec-2 | (1) 888Radial scale-length of outer disc in kpc | (1)999Vertical scale-height of the outer disc in pc | (2)101010Face-on surface brightness of inner disc in mag arcsec-2 | (2)111111Radial scale-length of inner disc in kpc | (2)121212Vertical scale-height of the inner disc in pc |
| IC5249 | 21.70 | 5.24 | 724 | 20.53 | 1.23 | 253 |
| UGC7321 | 21.73 | 2.39 | 436 | 19.94 | 1 | 134 |
| IC2233 | 21.67 | 2.16 | 338 | 20.82 | 0.81 | 81 |
3.2 HI Surface Density and Rotation Curves
Modelling the de-projected surface density profile and the rotation
curve for perfectly edge-on galaxies may be tricky as common techniques of converting kinematics data into a
disc rotation curve (tilted ring modelling, for example) fails in case of edge-on galaxies due to projection effects (See O’Brien et al. 2010b for a review). Like stellar photometry, the HI images for our sample galaxies were available
in the literature, and the surface densities and rotation curves modelled, as discussed below. Our sample galaxies have almost
symmetric rotation curves. In terms of surface density profiles, they are mildly lopsided except for IC2233, which indicates lopsidedness.
The HI disc was assumed to be optically thin in calculating the surface density values, as is indicated by the mildness of self-absorption
near the midplane in case of UGC7321 (Uson & Matthews 2003).
IC5249: The HI rotation curve and HI surface density for IC5249 have been taken from O’Brien, Freeman & van der Kruit (2010c).
The rotation curve could be obtained till 3.5 (1), and the asymptotic rotational speed
is 112 kms-1. The peak HI surface density 8
M⊙pc-2 is the highest among our sample galaxies. It is a gas-rich galaxy as indicated by a high value of 1.4
where is the total mass and the total luminosity in the B-band.
UGC7321: The HI rotation curve and HI surface density for UGC7321 has been taken from Uson & Matthews (2003).
UGC7321 has an asymptotic rotational velocity 110 kms-1, and the rotation curve could be obtained
till 5 (1). The peak HI surface density 3 M⊙pc-2. It is a gas-rich and dark matter-dominated galaxy as indicated by a high value of 1, and a
large value of the dynamical mass-to-light ratio 12, where is the dynamical mass of the galaxy as
estimated from the rotation curve.
IC2233: The HI rotation curve and HI surface density for IC2233 have been taken from Matthews & Uson (2008)
. IC2233 has a 85 kms-1, the smallest among our sample galaxies, the rotation curve being measured till
4 (1). Unlike the other galaxies in the sample, IC2233 has a central hole, and hence the HI surface density peaks in the middle of the
disc at 3 M⊙pc-2. It is not so gas-rich with an 0.62, but seem to be
dark matter dominated ( 12).
Error-Bars on the Rotation Curves: The original error-bars originally quoted on the above rotation curves were just fitting
uncertainties
and were therefore
unreasonably small. We have attempted to use realistic error-bars on the rotational velocities by adding in quadrature the systemic
errors to the fitting uncertainties, the systemic error being one-fourth of the velocity difference between the approaching and receding
sides of the galaxy (See, for example, Uson & Matthews 2003, de Blok et al. 2008).
The HI properties of our sample galaxies are presented in Table 3.
| Galaxy | 131313Peak HI surface density | /141414Ratio of the total HI mass to blue luminosity | /151515Ratio of the total dynamical mass to blue luminisoty | /161616Ratio of the total dynamical mass to total HI mass | |
|---|---|---|---|---|---|
| (M⊙pc-2) | (kms-1) | ||||
| IC5249171717Values quoted from O’Brien et al. 2010d | 8 | 1.4 | - | - | 112 |
| UGC7321181818Values quoted from Uson & Matthews 2003 | 3 | 1 | 12 | 31 | 110 |
| IC2233191919Values quoted from Matthews & Uson 2008 | 3 | 0.62 | - | 14 | 85 |
4 MASS MODELS
4.1 Stellar Component
As discussed in §3.1, two-dimensional structural surface brightness decompositions at Spitzer 3.6 m band have indicated that the stars in our sample galaxies are distributed in two exponential discs with finite thickness, namely the inner and the outer disc. We use the GIPSY (Groningen Image Processing System) task ROTMOD to obtain the rotation curve due to the gravitational potential of each of these disc components. For each disc component, we give the face-on central surface brightness ((1) or (2) in L⊙ pc-2), radial scale-length ((1) or (2) in kpc) and vertical scale -length ((1) or (2) in kpc) as input parameters to ROTMOD, choosing the disc to be anti-truncated (§3.1). ROTMOD calculates the rotation curve of such a disc following the analytical formulations given, for example, in Casertano (1983). The net rotation curve due to the stellar disc is then obtained by adding in quadrature the rotational velocities due to the inner and the outer discs respectively:
4.2 Neutral Gas
The rotation curve due to the gas component is obtained by assuming gas to be present in thin, concentric
rings. The HI surface density values were scaled by a factor of 1.4 to take into account the contribution
from helium and metals. We have not taken into account the presence of molecular gas in our mass models. However, it may not be a
dynamically significant component in superthin galaxies. Matthews et al. (2005) reported that the to mass ratio in late-type LSB
spirals
10-3. Therefore the contribution of can be ignored for the construction of mass models of LSB galaxies like the superthins,
without incurring significant errors.
As with the case of the stellar component, we use the GIPSY task ROTMOD to model the rotation
curve due to the gravitational potential of the neutral gas component.
4.3 Dark Matter Halo
We use the pseudo-Isothermal (PIS) and Navarro-Frank-White (NFW) density profiles to model the dark matter haloes of the superthin galaxies.
4.3.1 Pseudo-Isothermal (PIS) Halo
The density profile for a PIS dark matter halo is given by
Here is the central core density and is the core radius of the halo. The rotational velocity at any radius R due to a PIS dark matter halo is given by
where the asymptotic rotational velocity of the halo is
(Binney & Tremaine 1987)
4.3.2 Navarro-Frenk-White (NFW) Dark Matter Halo
The density profile for an NFW dark matter halo is given by
where is characteristic radius of the halo and is the critical density of the universe and
being the concentration parameter given by
and the radius where the average density of the NFW halo is 200 and is roughly equal to the virial radius . The rotation curve for an NFW dark matter halo is given by
The velocity at is
where is in kpc and
is in kms-1 (Navarro et al. 1996).
Finally, the net rotation velocity at a radius is obtained by adding in quadrature the rotational velocity due to the gravitational potential due to each of the components:
where is the stellar mass-to-light ratio which is discussed in the next subsection.
4.4 Stellar mass-to-light ratio
Constant : In order to convert the observed stellar surface brightness profiles at a given wavelength to their surface density profiles, we require their stellar mass-to-light ratio at that wavelength. Using stellar population synthesis models, Bell & de Jong (2001) obtained empirical relationships between optical colours of galactic discs and stellar mass-to-light ratios at various wavelengths. However, such an empirical relationship for the Spitzer 3.6 m band was lacking in the above study. Oh et al. (2008) derived the following empirical relationship between stellar mass-to-light ratios in the Spitzer 3.6 m band () and in the K-band () by constructing stellar population synthesis models, with various sets of metallicity and star-formation histories:
where = -0.05 and = 0.92. The empirical relation between optical colours and is given by
= -0.67 and = 0.42 for B - R colours with Scaled Salpeter IMF (Bell & de Jong 2001).
We assume to remain constant with radius in our mass models as colour gradients in LSB galaxies have been found to be small
(de Blok et al. 2001).
The optical colours and mass-to-light ratios in the K and the Spitzer 3.6 m band of our sample galaxies as used in the mass
models are summarised in Table 4.
| Galaxy | B-R | 202020Mass-to-light ratio in K band estimated using Bell & Jong (2001) | 212121Mass-to-light ratio at the Spitzer 3.6 band estimated using Bell & Jong (2001) & Oh et al. (2008) |
|---|---|---|---|
| IC5249 | 0.70222222Quoted from Byun (1998) | 0.34 | 0.31 |
| UGC7321 | 0.97232323Quoted from Uson & Matthews (2003) | 0.45 | 0.42 |
| IC2233 | 0.67242424Quoted from Matthews & Uson (2008) | 0.31 | 0.31 |
Free : Here, we do not fix the stellar mass-to-light ratio at any value determined by the population
synthesis models, and allow it to vary along with the dark matter halo parameters (, ).
Maximum Disc: The Maximum Disc model imposes a lower bound on the dark matter density distribution in the galaxy.
In this model, the stellar disc is taken to dominate the underlying gravitational potential. This is realised by fixing
the mass-to-light ratio () at an appropriate value such that a major contribution ( 75 ) to the peak of the rotation
curve (R 2.2 or, 2.2 (1) in our study as the outer disc is the main disc component) is attributed to the
gravitational potential of the stellar disc alone (Sackett 1997).
The free parameters in this case , .
Minimum Disc: Similarly, the Minimum Disc model sets an upper bound on the dark matter density.
In this case, the disc contribution to the underlying gravitational potential is taken to be zero, and the observed rotation curve is
attributed entirely to the potential of the dark matter halo. The free parameters in this case are again , .
4.5 Modified Newtonian Dynamics (MOND)
The rotation curves of low surface brightness galaxies provide a unique data set with which to test
alternative theories of gravitation like the Modified Newtonian Dynamics (MOND).
The net rotational velocity V(R) under MOND is given by
(Milgrom 1983). Here the two free parameters are and A, the mass-to-light ratio and the acceleration per unit length (in units
of kms-1kpc-1) respectively.
Finally, we use these stellar rotation curve () and gas rotation curves () as derived using the GIPSY task ROTMOD and the observed rotation curve task as inputs to the task ROTMAS, an interactive routine to fit different components (stars, gas and dark matter/MOND) for different mass models to the observed rotation curve.
5 Results & Discussion
5.1 PIS and NFW DM Haloes
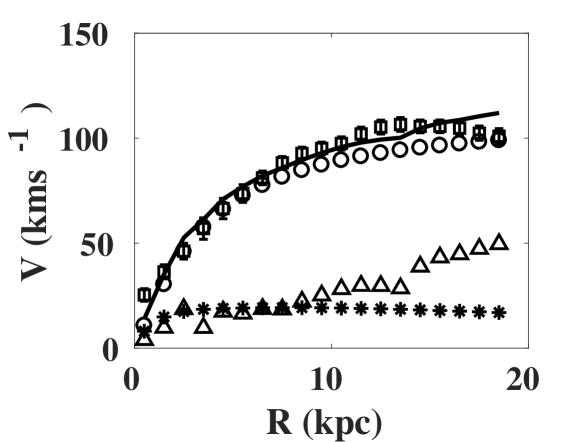
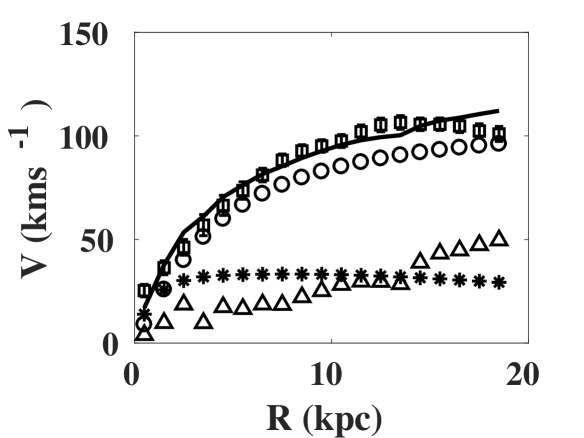
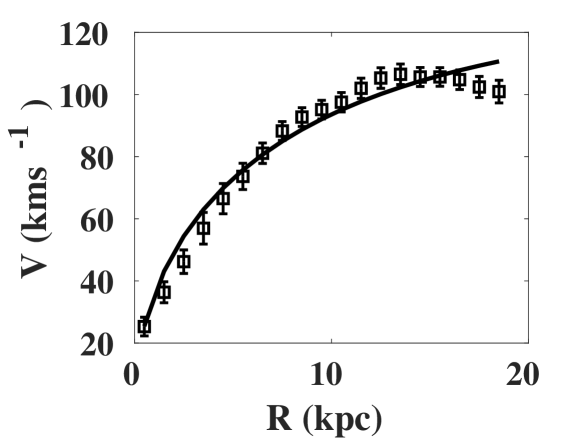
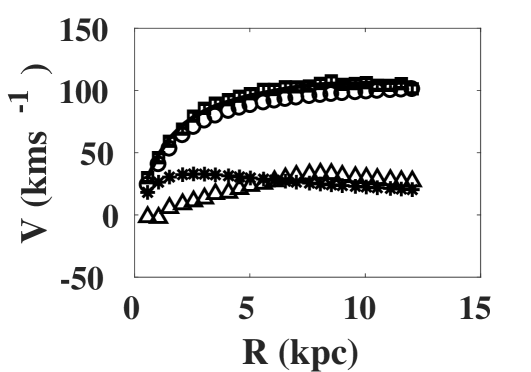
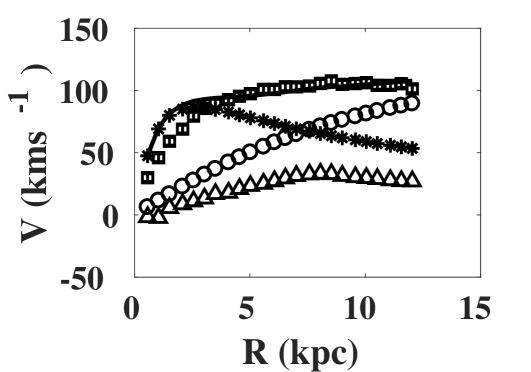
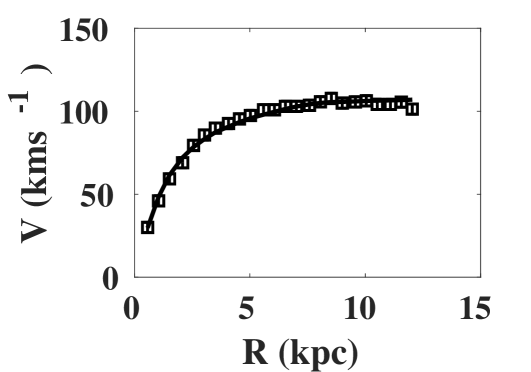
We present here mass models for each of our sample
galaxies using PIS and NFW DM density profiles. We compare our best-fitting model rotation curves with the observed
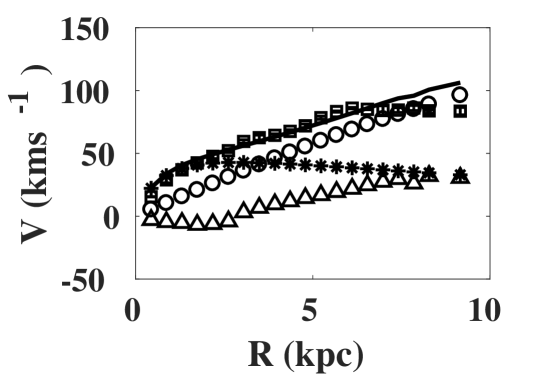
one for different cases as discussed in §4.3: [Panel 1] the
Constant case, [Panel 2] the Free case, [Panel 3] the Maximum Disc, and [Panel 4] the Minimum Disc case
respectively. In each plot, we also indicate the rotation curve decompositions i.e., contribution of the stars, gas and dark matter halo
to the model rotation curve. However, we do not present the cases where the best-fitting mass models are not physically meaningful.
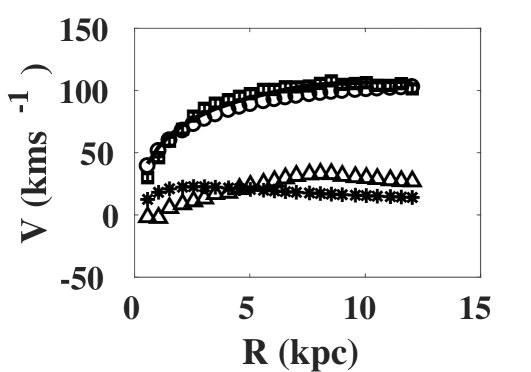
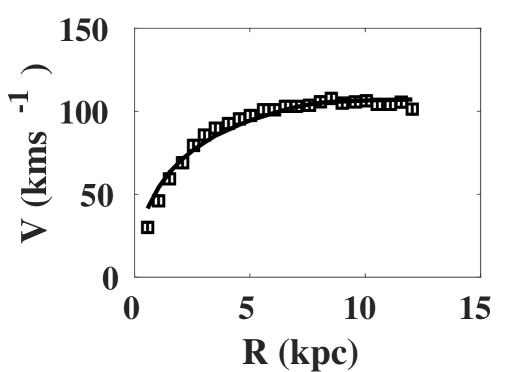
5.1.1 IC5249
We present model rotation curves for IC5249 with a PIS and NFW DM Halo
in Figures 2 and 3 respectively. All models with a PIS DM halo except for the Maximum Disc case,
give good fits to the observed rotation curve except
for slight mismatches at the outermost radii; an underestimation of the observed values at 12.5 kpc, and an
over-estimation at 17 kpc. With respect to the Constant and Minimum Disc cases, IC5249 has the smallest central
core density and the largest core radius among our sample galaxies,
and the most compact dark matter halo after UGC7321.
With the Free case, the best-fitting values of all the parameters including
the value,
closely match those of the Constant case within error-bars, confirming further the viability of the
Constant case with the observed rotation curve.
The poor fit with the Maximum Disc model means that the disc dynamics is not strongly regulated by the gravitational potential of the
stellar disc, which, indirectly implies dark matter dominance at all radii. This is further confirmed by the rotation curve decompositions
which clearly show the dominance of
the rotational velocity due to the gravitational potential of the dark matter halo at all radii.
Similarly, an NFW halo with the Constant and the Minimum Disc cases, give good fits to the rotation curve of UGC7321, the quality of the fits being comparable with those of the PIS DM Halo models. As with the PIS DM Halo, the Maximum Disc case with an NFW Halo does not comply with the observed rotation curve, yielding a negative value and an unusually high for the best-fitting case.
|
|
|
|
|
|
5.1.2 UGC7321
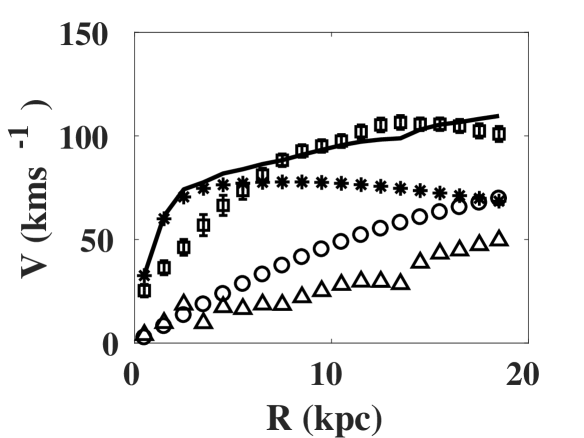
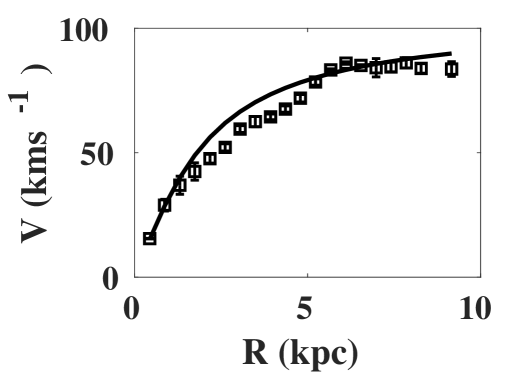
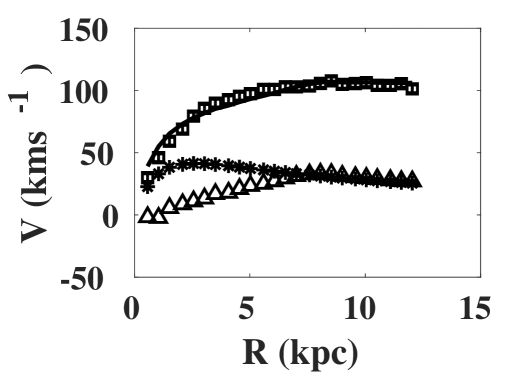
We present model rotation curves for UGC7321 with a PIS and NFW DM Halo in Figures 4 and 5 respectively.
As with IC5249, all models with a PIS DM halo except for the Maximum Disc case,
give good fits to the observed rotation curve, possibly the best among all our sample galaxies.
With respect to both the Constant and the Minimum Disc cases,
UGC7321 has the highest value of , the
smallest and the most compact dark matter halo i.e., the smallest value among our sample galaxies.
In other words, UGC7321 has the densest and the most compact dark matter halo.
Our best-fitting case for a Constant
model predicts 0.14 M⊙pc-3 and 1.27 kpc, which do not match with the results
obtained in earlier studies.
Using the joint constraints of the HI rotation curve and
the HI scale-height data, Banerjee et al. (2010) found that the
UGC 7321 has 0.039 - 0.057 M⊙ pc-2 and 2.5 - 2.9 kpc.
In a similar study, O’Brien et al. (2010d) found a PIS DM halo with a 0.73
M⊙pc-3 and 0.52 kpc for UGC7321.
This mismatch may be possibly explained by the fact that different stellar surface brightness profiles used in these
studies resulted in different dynamical contribution of the stellar disc in the mass models.
While the optical photometry used by Banerjee et al. (2010) and O’Brien et al. (2010d) indicated a low surface brightness single
exponential stellar disc, Spitzer 3.6 m images used in the current work gives a high surface brightness stellar disc, which is
double exponential in nature (§3.1). The presence of this additional central component in the Spitzer
images may be a possible reason behind obtaining a best-fitting mass model having a dark matter halo with a smaller central core density and a larger core radius in the current work, compared to those found in the earlier studies. Besides, Banerjee et al. (2010)
neglected the radial term in the Poisson Equation (under the
assumption of a flat rotation curve) in their calculations, which is, however, a reasonable assumption in the outer galaxy only.
With the NFW halo model, the Constant and the Minimum Disc cases, give good fits to the observed rotation curve, with UGC7321 having the most concentrated and the smallest NFW halo among our sample galaxies. The Free and the Minimum Disc cases, as in IC5249, result in fits which are not physically meaningful.

|
|
|
|
|
|
|
|
|
|
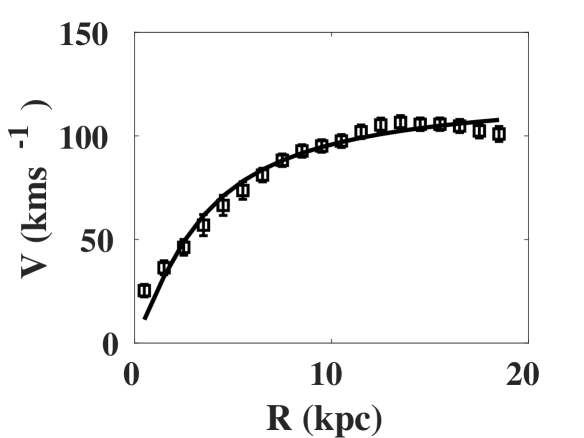
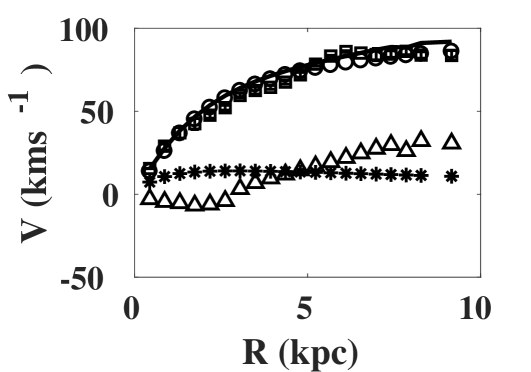
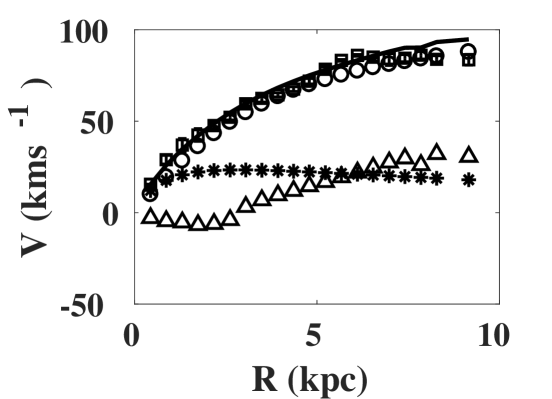
5.1.3 IC2233
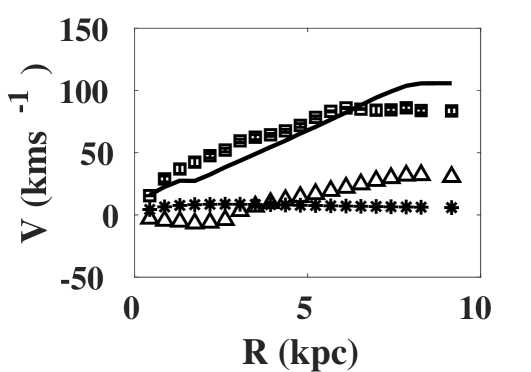
We present mass models for IC2233 with a PIS DM halo in Figure 6.
We note that the modelled gas rotation velocity within the inner disc indicate negative values at some radii.
We emphasise that the negative values of modelled gas rotation velocity within the inner disc simply indicate velocities in the
outward/radial direction, and is characteristic of discs with central depressions as in IC2233 (See §5.1 of de Blok et al. 2008 for a
discussion).
As with the other galaxies in the sample, except for the Maximum disc case, the models with a PIS DM Halo give reasonable fits to the
observed rotation curve, although the high values of the reduced
chi-square indicate worse fits for the same. This may attributed to small, possibly under-estimated values of the error-bars obtained for the
observed rotation curve (See §3.2), which happen to be an order of magnitude smaller than those of the other sample galaxies.
| Galaxy | Model | 252525Central core density of the PIS DM Halo | 262626Core radius of the PIS DM Halo | 272727Ratio of the core radius to the exponential stellar disc scale-length | 282828Stellar mass-to-light ratio | 292929Reduced chi-square corresponding to this best-fitting model |
| () | (kpc) | |||||
| IC5249 | Constant | 26.043.56 | 2.990.27 | 0.570.05 | 0.31 | 2.21 |
| Free | 18.136.56 | 3.580.71 | 0.680.14 | 0.930.50 | 2.12 | |
| Maximum disc | 1.650.91 | 12.789.18 | 2.441.75 | 5.06 | 10.32 | |
| Minimum disc | 28.892.75 | 3.110.19 | 0.590.04 | 0. | 1.59 | |
| UGC7321 | Constant | 140.239.37 | 1.270.05 | 0.530.02 | 0.42 | 0.47 |
| Free | 109.37133.39 | 1.440.9 | 0.600.37 | 0.882.05 | 0.47 | |
| Maximum disc | 6.892.81 | 7.753.78 | 3.241.58 | 6.07 | 10.41 | |
| Minimum disc | 173.6311.7 | 1.150.05 | 0.480.02 | 0 | 0.51 | |
| IC2233 | Constant | 55.833.14 | 1.830.07 | 0.850.03 | 0.31 | 11.8 |
| Free | 29.136.07 | 2.820.44 | 1.310.20 | 0.860.14 | 8.8 | |
| Maximum disc | 8.095.17 | 12.1228.57 | 5.6113.23 | 2.88 | 310 | |
| Minimum disc | 68.733.79 | 1.710.06 | 0.790.03 | 0. | 16.8 |
| Galaxy | Model | c 303030Concentration parameter of the NFW DM Halo | 313131Radius where the average density of the NFW DM Halo is 200 | 323232Rotational velocity at | 333333Ratio of the maximum rotational velocity to the velocity at | 343434Stellar mass-to-light ratio | 353535Reduced chi-square corresponding to this best-fitting model |
| (kpc) | (kms-1) | ||||||
| IC5249 | Constant | 3.480.48 | 78.655.28 | 57.41 3.85 | 1.95 0.13 | 0.31 | 3.26 |
| Free | 8.742.47 | 76.562.06 | 55.891.50 | 2.000.05 | -4.982.63 | 2.13 | |
| Maximum disc | -0.43 - | 244.58 | - | - | 5.06 | 12.56 | |
| Minimum disc | 3.270.31 | 90.684.62 | 66.193.37 | 1.690.08 | 0 | 1.88 | |
| UGC7321 | Constant | 7.800.60 | 66.752.50 | 48.731.83 | 2.260.08 | 0.42 | 1.87 |
| Free | 9.253.68 | 64.565.42 | 47.133.96 | 2.330.19 | -0.321.66 | 1.88 | |
| Maximum disc | -0.43 | 668 - | - | - | 6.07 | 14.87 | |
| Minimum disc | 8.630.59 | 65.382.14 | 47.731.56 | 2.300.07 | 0. | 1.81 | |
| IC2233 | Constant | 0.157.27 | 371.00 - | - | - | 0.31 | 213 |
| Free | 5.434.45 | 81.3330.42 | - | - | -3.963.52 | 20.49 | |
| Maximum disc | -0.43 - | 614.04 - | - | - | 2.88 | 877 | |
| Minimum disc | -0.44 - | 1097.32- | - | - | 0. | 3756 |
| Galaxy | A 363636Acceleration per unit length | 373737Stellar mass-to-light ratio | 383838Reduced chi-square corresponding to this best-fitting model |
| (kms-2kpc-1) | |||
| IC5249 | 1969.26454.57 | 2.150.58 | 5.68 |
| UGC7321 | 7551.75937.48 | 1.390.26 | 1.92 |
| IC2233 | 13951.591244.02 | 0.110.01 | 1239 |
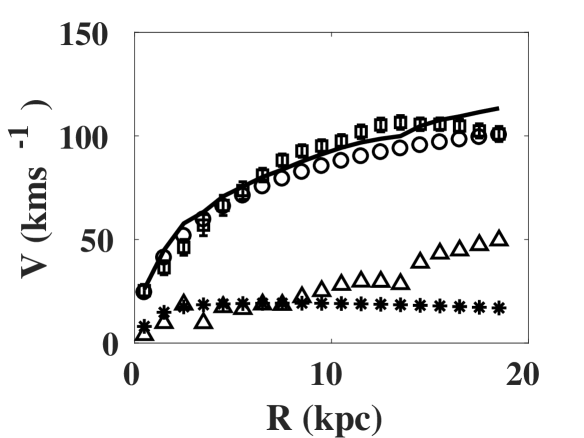
Interestingly, all the mass models with an NFW DM halo give poor fits with unphysical values for the best-fitting parameters.
This may possibly be understood on the basis of the fact that the cuspy
NFW profile fails to fit slowly-rising, dwarf-like rotation curves in general
(See, for instance, Oh et al. 2008).
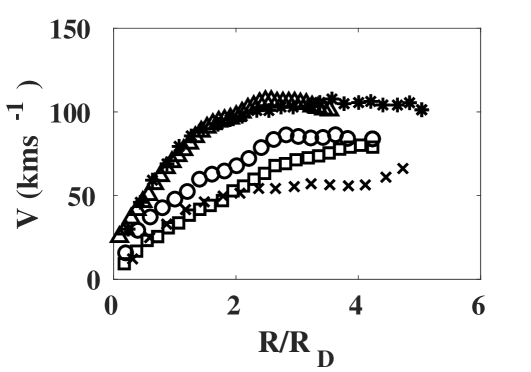
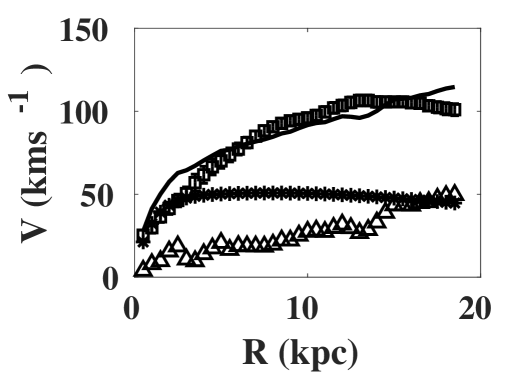
In Figure 7, we plot the observed rotation velocities of our sample galaxies plus those of IC2574 and IC2366 (Oh et al. 2008) as a function of
the galacto-centric radius
normalised with respect to the exponential stellar disc scale-length ((1) for our sample galaxies). It clearly shows that the
rotation curves of IC2233, IC2574 and
IC2366 rise much more slowly with respect to the stellar disc i.e., the rotation curve continues to rise linearly beyond one , in contrast
with those of the IC5249 and UGC7321, for which the linear region of the rotation curve is confined to .
|
.
The results of our best-fitting mass models with PIS and NFW DM halo are summarised in Tables 5 and 6 respectively.
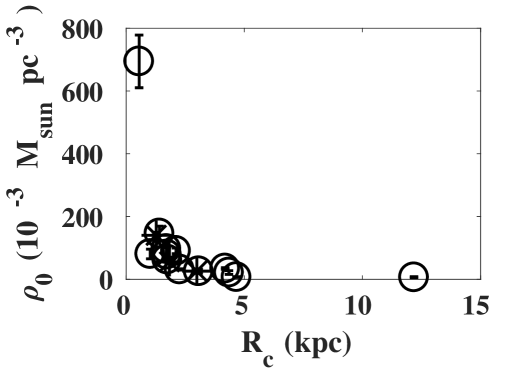
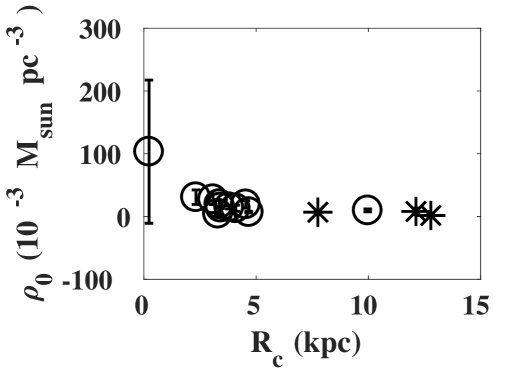
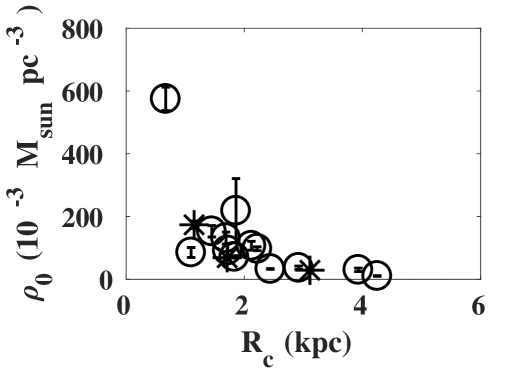
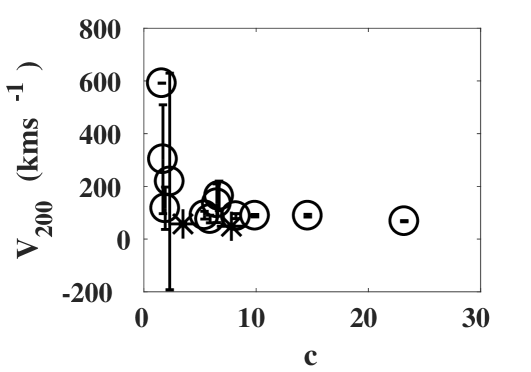
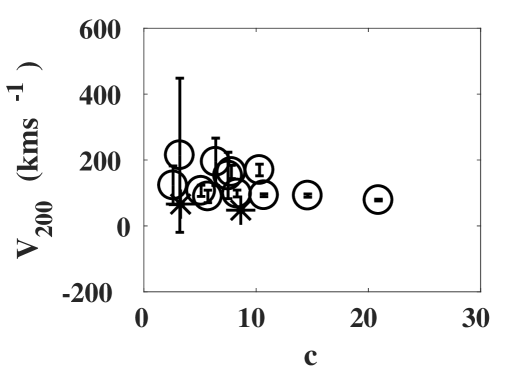
Comparison with the dark matter halo profiles of LSBs: In Figures 8 and 9, we compare our best-fitting model parameters with with PIS and NFW DM halo density profiles for our sample superthins with those for a sample of low surface brightness galaxies with similar dynamical mass and surface brightness from de Blok et al. (2001) for different cases: Constant case, Maximum Disc Case (only for PIS DM haloes) and Minimum Disc Case. For the PIS DM halo case (Figure 8), we find that our best-fitting values lie well within the range values obtained for LSB galaxies except for the Maximum Disc case, for which our values are found to lie beyond the range of values predicted for LSBs. However, the current work has shown that the Maximum Disc case in general gives poor fits to the observed rotation curves of superthins, and therefore may not be quite representative of the actual underlying profile of their DM haloes. For the NFW case (Figure 9), DM halo parameters of our sample superthins compare well with those of the LSBs for the Constant and the Minimum Disc cases. Besides, we do not show the Maximum disc case here as the models were ruled out being physically not meaningful. For similar reasons, the parameters for IC2233 were not included in the plots.
5.2 MOND
In Figure 10, we compare the best-fitting rotation curve using MOND with the observed rotation curves of IC5249, UGC7321 and IC2233. With MOND, we obtain a reasonable best-fitting model to the rotation curve both for IC5249 and UGC7321 with acceptable values of A and , the latter being close to the values dictated by the population synthesis models. For IC2233, however, we obtain physically unrealistic values of the best-fitting parameters A and . However, one may also fits to the observed rotation curve by letting the distance to the galaxy and its inclination as free parameters (McGaugh & de Blok 1998, Gentile et al. 2013, Angus et al. 2015). We defer this analysis to a future paper. The results of our best-fitting mass models with MOND are summarised in Tables 7.
|
|
|
|
|
|
|
|
6 Conclusions
We construct mass models of three superthin galaxies, U7321, IC5249 and IC2233, using high resolution rotation curves and gas surface density distributions obtained from HI 21 cm radio-synthesis observations, in combination with their two-dimensional structural surface brightness decompositions at Spitzer 3.6 m band, all of which were available in the literature. We find that both pseudo-isothermal and NFW-like dark matter density profiles give equally good fits to the observed rotation curves of IC5249 and UGC7321 but the NFW profile fails to comply with the slowly rising rotation curve of IC2233; while the linear regime of the observed rotation curve is confined within two radial disc scale-lengths () for IC5249 and UGC7321, it extends beyond for IC2233. Similarly, mass models with MOND give good fits to the rotation curves of IC5249 and UGC7321 but not with that of IC2233. Interestingly, however, for all of our sample galaxies, the best-fitting mass model with a PIS dark matter density profile indicate a compact dark matter halo i.e., 2 where is the core radius of the dark matter halo which, in turn, may be fundamentally responsible for the existence of superthin stellar discs in these LSB galaxies. Our results may have important implications for the formation and evolution of models of superthin galaxies in the universe.
References
Angus, G. W. et al., 2015, MNRAS, 451, 3551
Banerjee, A. et al., 2010, NA, 15, 89
Banerjee, A., Jog, C. J., 2011, ApJ, 732, L8
Banerjee, A., Jog, C. J., 2013, MNRAS, 431, 582
Bell, E. F., de Jong, R. S., 2001, 550, 212
Binney, J., Tremaine, S., 1987, Galactic Dynamics. Princeton Univ. Press, Princeton, NJ
Bizyaev, D. V. et al., 2014, ApJ, 787, 24
Byun, Y.-I., 1998, ChJPh, 36, 677
Casertano, S., 1983, MNRAS, 203, 735
Comeron, S. et al., 2011, ApJ, 741, 28
Dalcanton, J. J., Bernstein, R. A., 2002, AJ, 124, 1328
de Blok, W. J. G. et al., 2001, AJ, 22, 2396
de Blok, W. J. G. et al., 2008, AJ, 136, 2648
Gentile, G. et al., 2013, A&A, 554, 125
Goad, J.W., Roberts, M.S., 1981, ApJ, 250, 79
Karachentsev, I. D. et al., 1993, AN, 314, 97
Karachentsev, I. D. et al., 1999, BSAO, 47, 5
Kautsch, S. J., et al., 2006, A&A, 445, 765
Kautsch, S. J., 2009, PASP, 121, 1297
Kregel, M. et al., 2005, MNRAS, 358, 503
Matthews, L. D. et al., 1999, ASPC, 182, 223
Matthews, L. D. et al., 1999, AJ, 118, 2751
Matthews, L. D., 2000, AJ, 120, 1764
Matthews, L. D., van Driel, W., 2000, A&AS, 143, 421
Matthews, L. D., Wood, K. 2003, ApJ, 593, 721
Matthews, L. D. et al., 2005, AJ, 129, 1849
Matthews, L. D., Uson, J. M., 2008, AJ, 135, 291
McGaugh, Stacy S., de Blok, W. J. G., 1998, ApJ, 499, 66
Milgrom, M., 1983, ApJ, 270, 365
Navarro, J. F. et al., 1996, ApJ, 462, 563
O’Brien, J. C. et al., 2010a, A&A, 515, 60
O’Brien, J. C. et al., 2010b, A&A, 515, 61
O’Brien, J. C. et al., 2010c, A&A, 515, 62
O’Brien, J. C. et al., 2010d, A&A, 515, 63
Oh, S.-H. et al., 2008, AJ, 136, 2761
Oh, S.-H. et al., 2015, AJ, 149, 180
Sackett, P. D., 1997, ApJ, 483, 103
Salo H., et al., 2015, ApJS, 219, 4
Uson, J. M. & Matthews, L. D., 2003, AJ, 125, 2455
van der Kruit, P. C. et al., 2001, A&A, 379, 374
Yoachim, P., Dalcanton, J. J., 2006, AJ, 131, 226
Acknowledgements
AB would like to thank Kaustubh Waghmare and Jayaram Chengalur for useful discussion and suggestions, Erwin de Blok and Hans Terlouw for help with GIPSY and finally the anonymous referee whose critical comments have greatly helped to improve the quality of the paper.