Warm unstable asymmetric nuclear matter: critical properties and the density dependence of the symmetry energy
Abstract
The spinodal instabilities in hot asymmetric nuclear matter and some important critical parameters derived thereof are studied using six different families of relativistic mean-field (RMF) models. The slopes of the symmetry energy coefficient vary over a wide range within each family. The critical densities and proton fractions are more sensitive to the symmetry energy slope parameter at temperatures much below its critical value (14-16 MeV). The spread in the critical proton fraction at a given symmetry energy slope parameter is noticeably larger near , indicating that the warm equation of state of asymmetric nuclear matter at sub-saturation densities is not sufficiently constrained. The distillation effects are sensitive to the density dependence of the symmetry energy at low temperatures which tend to wash out with increasing temperature.
pacs:
21.65.-f, 21.65.Ef, 26.50.+xI Introduction
Core-collapse supernovae (CCSN) CCSN are one of the most energetic events in the Universe. Matter can reach temperatures up to MeV and the density at bounce of the collapsing core goes up to 1.5 - 2.0 times the nuclear saturation density. During the collapse, matter does not have enough time to reach -equilibrium conditions Stone07 , because the event timescale is believed to be of the order of seconds, and usually a fixed proton fraction of Mezzacappa05 is considered for the calculation of the EoS. The reader can refer to oertel16 and references therein for a recent review on the relevant thermodynamics and composition for the equation of state for CCSN, compact stars and compact stars mergers. At densities below nuclear saturation, light clusters and heavy clusters pasta can form, and they can modify the neutrino transport, which will affect the cooling of the proto-neutron star coolingPNS , as neutrinos play a considerable role in the development of the shock wave during the collapse shock . The determination of the region of densities, proton fractions and temperatures where these instabilities exist is, therefore, very important for core-collapse simulations.
Critical properties of hot asymmetric and symmetric nuclear matter may be studied with heavy ion collisions, in particular, with nuclear reactions that involve the formation of compound nuclei or multifragmentation. These data will be important to constrain the CCSN EoS. As shown in Ref. Buyukcizmeci13 , the expected range of densities and temperatures for CCSN matter just before bounce lie in the typical (,) space, and MeV, for nuclear multifragmentation reactions. In Ref. lourenco16 , a compilation of the critical temperatures determined from experimental data natowitz02 ; karnaukhov03 ; elliott13 ; experimental , and which generally fall above 16 MeV, is compared with theoretically determined ones from RMF models with non-linear sigma models that have an effective mass at saturation in the range 0.58, as obtained from finite nuclei spin-orbit splittings, and the incompressibility in the range 250 MeV, as proposed in stone14 . Under these conditions, it was shown that the critical temperature from RMF models satisfies MeV, far from the value proposed in elliott13 , where the authors have analysed six sets of experimental data, two involving the formation of compound nuclei and four multifragmentation processes, and have determined a critical temperature of MeV. In order to be able to reproduce the experimental critical temperature, and within RMF models that only include non-linear terms, the finite nuclei spin-orbit constraint had to be relaxed in lourenco16 and a larger nuclear effective mass chosen. However, these experimental constraints for the critical temperature, above which matter is stable against clusterization, are for symmetric matter. Constraints for asymmetric hot matter are missing.
In Refs. avanciniPasta , the authors used several methods to determine the crust-core transition, including a Thomas Fermi calculation of the inner crust and the thermodynamical and dynamical spinodals, and they showed that for finite temperature and fixed proton fractions (CCSN conditions), the thermodynamical method gave quite similar results to more demanding calculations, like the Thomas-Fermi calculation.
The thermodynamical spinodal, the boundary of the instability region identified by a negative curvature free energy, is determined by equating the free energy curvature to zero. In Ref. avancini06 , the authors used the thermodynamical approach to analyse the liquid-gas phase transition in warm asymmetric nuclear matter, as well as stellar matter, within RMF models with and without density-dependent couplings. In particular, they discussed the isospin distillation effect, that is, the different isospin content of each phase, with the gas being more neutron-rich and the liquid phase with a proton fraction close to symmetric matter. They showed that this effect is not so strong when considering models with density-dependent couplings. They calculated for each temperature the critical points of the spinodal, that is, the two points where the pressure is maximum, together with the critical temperature of the system, i.e., the temperature at which the instability region melts. The two models with density dependent couplings were shown to have a region of instabilities that extended to smaller proton fractions and similar densities ranges when compared with models with constant couplings, but no discussion was done on the connection of these results with the density dependence of the symmetry energy. In Ref. pais16 , the authors also used this method together with other two to calculate the crust-core transition and pressure at zero temperature, and using two of the families that are also going to be used in this work. They observed that this calculation gives a good estimation of the transition, like the authors of Ref. Ducoin11 also found.
In this work, the critical parameters for hot asymmetric nuclear matter for six different families of RMF models are studied using the thermodynamical method. These six families of models have been built from three different appropriately calibrated base models. An extra term that couples the -meson either to the or -meson is added to each of the base models to yield wide variations in the symmetry energy slope . The effect of on the critical temperature, density and proton fraction is then explored. We also compare our findings with experimental results from references natowitz02 ; karnaukhov03 ; elliott13 ; experimental for the critical temperature, and the theoretical study of Ref. lourenco16 .
II Formalism
We give a brief summary of the RMF formalism in the first subsection, and of the thermodynamical spinodal calculation and respective critical points in the second subsection.
II.1 Extended RMF Lagrangian
We consider a set of families, each one characterized by the same isoscalar properties, which are described by the scalar-isoscalar field with mass , associated to the -meson, and the vector-isoscalar field with mass associated to the -meson. The members of each family differ by their isovector properties which will be determined by the vector-isovector field with mass , associated to the -meson, and the non-linear terms that couple the -meson to the and/or the -mesons. Nucleons, with mass and described by the spinors , interact with and through the , and -mesons, according to the Lagrangian density:
where the nucleon Lagrangian reads
with
The mesonic Lagrangians are:
where , and are the Pauli matrices. The mesonic Lagrangian is supplemented with the following non-linear terms that mix the , and mesons up to quartic order quarticA ; quarticB ; quartic1 ; quartic2 ,
| (2) | |||||
The parameters of RMF models, which in the present case are the couplings , , and of the mesons to the nucleons, the nucleon bare mass , the meson masses, the self-interacting coupling constants, , , and , and the coupling constants of the non-linear mixing terms, , are fixed to nuclear properties obtained experimentally, and to astrophysical constraints quartic1 ; quartic2 .
The free energy density is obtained from the relation
| (3) |
with the energy density given by
| (4) | |||||
where the energies are
| (5) |
with the equilibrium distribution functions defined as
| (6) |
, , and the nucleons effective chemical potential
| (7) |
where is the third component of the isospin operator. The entropy density is calculated considering the nucleons as quasiparticles
| (8) | |||||
II.2 Stability Conditions
In the present study, we determine the region of instability of nuclear matter constituted by protons and neutrons by calculating the spinodal surface in the space. Stability conditions for asymmetric matter impose that the curvature matrix of the free energy density bctl98 ; ms ; avancini06
| (9) |
is positive. Eq. (9) can be rewritten in the form
| (10) |
imposing
| (11) |
| (12) |
to fulfil the stability conditions. This is equivalent to requiring that the two eigenvalues
| (13) |
are positive. The largest eigenvalue is always positive and the instability region is delimited by the surface . Interesting information is given by the associated eigenvectors , defined as
In particular, the eigenvector associated with the eigenvalue that defines the spinodal surface determines the instability direction, i.e. the direction along which the free energy decreases. We will also calculate the critical points for each temperature , which are important to define under which conditions the system is expected to be clusterized. These points satisfy simultaneously reid ; avancini06
| (14) | |||||
| (15) |
with
| (16) |
The thermodynamical spinodals and respective critical points will be calculated for a series of models in the next section.
III Results
In this section, we first briefly describe the different families of the RMF models used for the current study. Next, we present our results for the spinodal instabilities and critical points in hot asymmetric matter at different temperatures. The effect of the symmetry energy slope parameter, , on this quantities will be addressed as well.
III.1 Models
 |
 |
 |
 |
In this work, we are going to consider six different families of RMF models, namely, NL3 Carriere , TM1 paisVlasov , F2ρ frho ; bka22 , NL3 paisVlasov , TM1 paisVlasov , and Fρ frho . The NL3 and NL3 (TM1 and TM1) families are obtained from the base model NL3 nl3 (TM1tm1 ). The Fρ and F2ρ families are obtained from the base model BKA22 bka22 . The families NL3, TM1 and F2ρ include a quartic order cross-coupling term (), whereas the NL3 and TM1 families have a quartic order cross coupling term (). On the other hand, a cubic order cross-coupling term () is included in the Fρ family. The strengths of the cross-couplings ( and ), and that of the coupling of the -mesons to the nucleons (), are appropriately adjusted to vary the slope of symmetry energy over a wide range without compromising the properties of the finite nuclei significantly. The cross-couplings or or is increased (decreased) and accordingly is also increased (decreased) in such a way that either the binding energy of 208Pb nucleus is close the the experimental value or the symmetry energy at density fm-3 is exactly the same as that for the base model. Different combinations of the coupling strengths yield different behaviours for the density dependence of the symmetry energy. The variants of NL3 and TM1 models are obtained by varying or and adjusting in such a way that the symmetry energy at fm-3 is equal to the one obtained for the base models Horowitz ; Carriere . The variants of BKA22 model (i.e. Fρ and F2ρ families) are obtained by varying or and adjusting to reproduce the binding energy of the 208Pb nucleus. All the families of models considered are consistent with the observational constraints imposed by the measured mass () of the pulsars J1614-2230 J1614 and J0348+0432 J0348 , see e.g. Alam16 and references there in. Besides these observational constrains, there are also experimental results and first-principle calculations that can allow to set limits on the stellar matter EoS. In Table 1, we present some bulk properties of 208Pb nucleus as well as the neutron star maximum mass and corresponding radius obtained for the models with extreme values of from each families.
In addition to these six families of models, we also consider as reference two extra models with density dependent couplings: DD2 dd2 and DDME2 ddme2 . In Ref. fortin16 , it was shown that these two models satisfy a well accepted set of laboratorial, theoretical and observational constraints. We are, therefore, interested in comparing the behaviour of these models at finite temperature with the behaviour of the six families of models we are going to analyse.
| Model | ||||||
|---|---|---|---|---|---|---|
| (MeV) | (fm) | (fm) | (fm) | (M⊙) | (km) | |
| 1 | -7.871 | 5.529 | 5.751 | 0.280 | 1.99 | 11.77 |
| 7 | -7.871 | 5.559 | 5.680 | 0.179 | 1.97 | 11.33 |
| 1 | -7.871 | 5.529 | 5.740 | 0.269 | 1.95 | 11.61 |
| 7 | -7.870 | 5.555 | 5.649 | 0.152 | 1.93 | 11.06 |
| NL3 | -7.878 | 5.518 | 5.740 | 0.280 | 2.78 | 13.29 |
| NL36 | -7.913 | 5.535 | 5.662 | 0.185 | 2.77 | 13.14 |
| NL36 | -7.921 | 5.530 | 5.667 | 0.195 | 2.76 | 12.99 |
| TM1 | -7.877 | 5.541 | 5.753 | 0.270 | 2.18 | 12.49 |
| TM16 | -7.923 | 5.558 | 5.686 | 0.186 | 2.15 | 12.02 |
| TM16 | -7.791 | 5.552 | 5.689 | 0.195 | 2.13 | 11.97 |
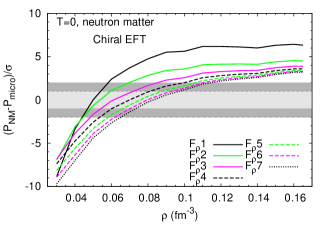
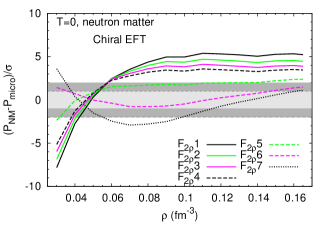
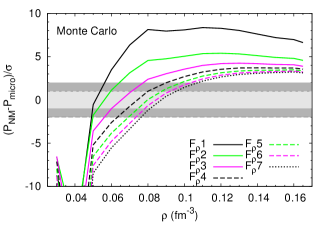
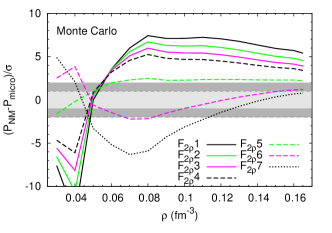
In Fig. 1, we compare the neutron matter pressure of the Fρ and families with microscopic calculations based on nuclear interactions derived from chiral effective field theory (EFT) Hebeler , and quantum Monte Carlo techniques with realistic two- and three-nucleon interactions Gandolfi . We show the difference from the neutron matter pressure of each model to the microscopic results, normalized to the pressure uncertainty of the microscopic calculations, , at each density. These uncertainties are represented by light gray bands, and they indicate that the points that lie inside those bands are within the data limits. Also shown are dark gray bands that denote twice the calculation uncertainties, . We observe that only F and F2ρ6 lie in the bands’ limits. All the other models fail to satisfy these constrains. Similarly, for other families, it was shown in Ref. paisVlasov that only 4 models, NL3, NL3, TM1, and TM1, passed these microscopic constrains.
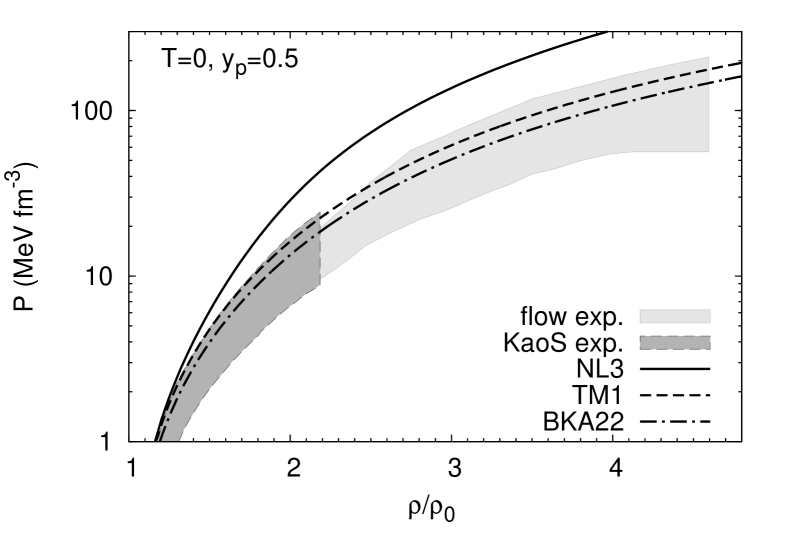
In Fig. 2, we show the EoSs for symmetric nuclear matter for the three base models considered, together with the experimental results from collective flow data in heavy-ion collisions flow , and from the KaoS experiment kaons . The models of the NL3 family do not satisfy these constraints but the EoSs for the other models lie within the experimental bounds. However, the modelling of flow in transport simulations is a complex process and, therefore, these constraints should be considered with care. Consequently, we will also include the models of the NL3 family in the present study.
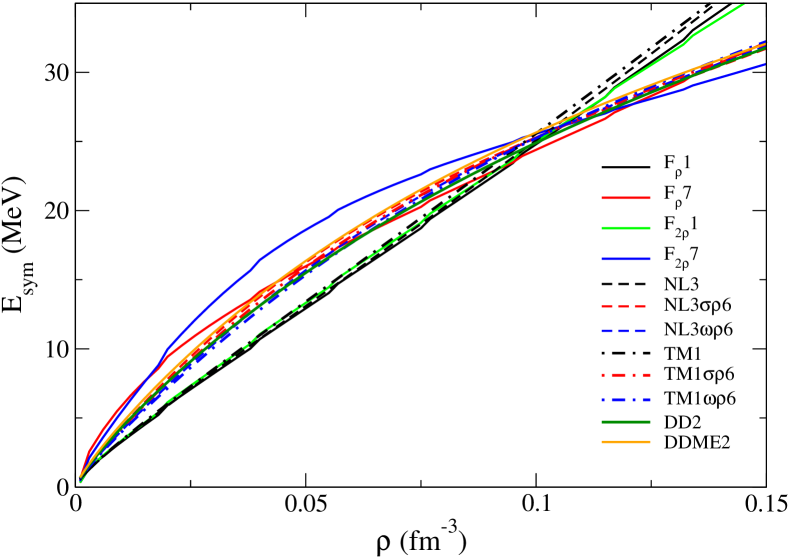
We will be discussing the effect of the density dependence of symmetry energy on the extension of the instability. To facilitate our discussions, we show in Fig. 3 the behaviour of symmetry energy at sub-saturation densities for the models with extreme values of the slope . The models with the largest have all a very similar behavior, showing an almost linear increase of the symmetry energy with the density, typical of models that do not have non-linear terms involving the -meson. With respect to the models with the smallest , the NL3 and TM1 models have a similar behavior and MeV, showing a larger symmetry energy below fm-3 than the models with large . has a more extreme behavior due to its lower , MeV. The symmetry energy curves for the models corresponding to extreme values of cross each other at fm-3, except for the family. The crosses at a smaller density.
III.2 Spinodal sections and critical points
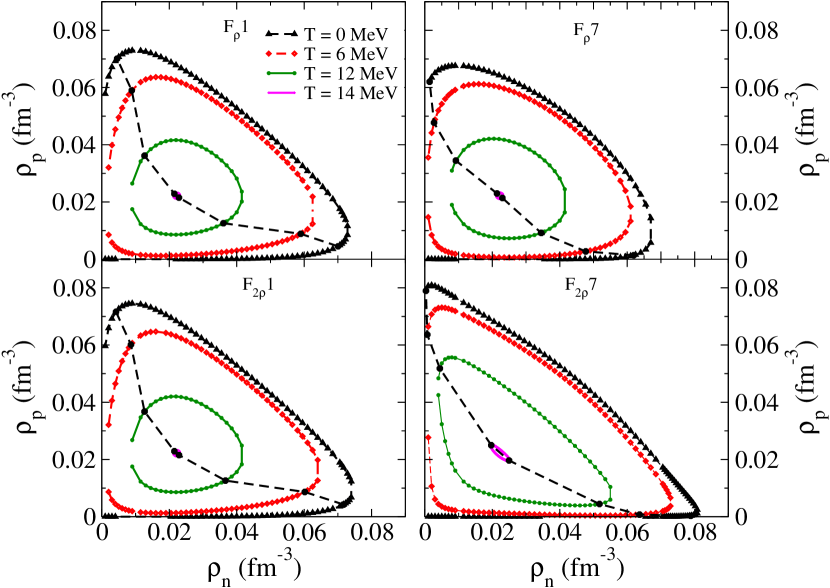
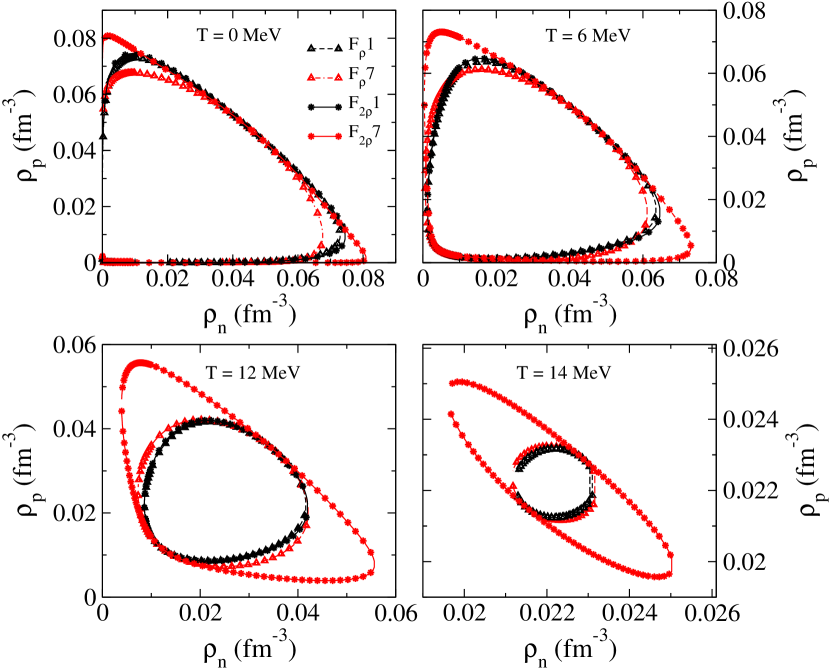
We will start with the analysis of the effects of temperature on the spinodal sections obtained for the models with extreme values of , in particular the largest and the lowest of each family. In Figs. 4 and 5, we plot the spinodal sections of members 1 and 7 of the and families for and 14 MeV, and, in Fig. 4, we also represent the line of critical points by a dashed line. At these points, which are common to both the binodal and the spinodal, the direction of the instability is parallel to the tangent at the spinodal, and the pressure is maximum. Some conclusions are in order: a) the behavior with temperature is similar to the one obtained in avancini06 , the larger the temperature the smaller the spinodal section and matter is more symmetric inside the spinodal. Eventually, at the critical temperature, the section is reduced to a point and, for larger temperatures, homogeneous matter is always stable; b) the spinodal sections of models 1 and , left panels of Fig. 4, are very similar, as expected, because, these two models have very similar properties (see also Fig. 3): they are the models with the largest slope and the strength of the cross-couplings is very small; c) the same is not true for the members with the smallest values of , and . The spinodal of the model becomes larger, extending to larger asymmetries and densities. This same behavior was obtained with the NL3 and TM1 families, and has been discussed in pais2010 ; paisVlasov , but for dynamical spinodals. The family shows a different behavior, and the spinodal of the model with the smallest , , is smaller than . This may be attributed to the different behavior of the symmetry energy for this model, as can be seen from Fig. 3. In Fig. 5, where we compare the four models at different temperatures, it is clear that is the one for which the spinodal section extends to a larger range of densities and asymmetries. This behavior is expected since this is the model with the smallest .
| Model | (MeV) | (fm-3) | (MeVfm-3) |
|---|---|---|---|
| DD2 | 13.73 | 0.0452 | 0.1785 |
| DD-ME2 | 13.12 | 0.0445 | 0.1556 |
| 14.01 | 0.0444 | 0.1802 | |
| NL3 | 14.55 | 0.0463 | 0.1999 |
| TM1 | 15.62 | 0.0486 | 0.2365 |
We now consider the variations of the critical density and proton fraction with the temperature and the symmetry energy slope parameter. Before embarking on this, we would like to discuss briefly the results for the critical temperature.
The critical temperature is totally defined by the isoscalar properties of the model and, therefore, it is the same for models that only differ on the isovector properties: the critical temperatures for NL3 ,TM1 and are the same as those for the corresponding base models NL3, TM1, BKA22, respectively. The values of the critical temperature, density and pressure for the base models, as well as for the DD2 and DDME2 models, are given in Table 2. For the BKA22 model, the critical temperature is very close to 14 MeV, while for the TM1 model, the critical temperature is above 15 MeV, and for NL3, MeV. The TM1 and NL3 values fall inside the interval of temperatures MeV, obtained in lourenco16 from a set of RMF models with non-linear terms that have an effective mass at saturation that reproduces finite nuclei spin-orbit splittings, and an incompressibility in the range 250 MeV, as proposed in stone14 , and the critical temperature for the BKA22 model lies very close to the bottom limit. While the incompressibilities for TM1 and NL3, 281 and 272 MeV, respectively, lie inside the range considered lourenco16 , for the BKA22 models, it is 220 MeV, and, therefore, it is outside that interval. However, the critical temperatures predicted by the models in the present study are far from the value MeV obtained in elliott13 from the analysis of six different sets of experimental data from heavy-ion reactions. Let us stress that three of the models considered (DD2, DDME2 and NL3) went through a set of laboratorial and theoretical constraints for neutron matter, besides predicting star masses above , as identified in fortin16 , and they predict critical temperatures below 14.55 MeV, even below 14 MeV. Besides these three models, also models NL3, TM1, TM1 , satisfy most of these constraints: TM1 models have an incompressibility outside the range considered in fortin16 , but well inside the range proposed in stone14 , and predicts a maximum neutron star mass just below . In elliott13 , the authors have performed a quite complete compilation of theoretical predictions for the critical temperature, and, in fact, the RMF models that predict a critical temperature close to MeV do not satisfy most of the laboratorial constraints at saturation density or below. Thus, one conclusion that can be drawn is that the theoretical critical temperature predicted by the models fitted to the ground state properties of finite nuclei and nuclear matter, and satisfying the constraint, does not agree with the experimentally extracted value of the critical temperature.
 |
 |
 |
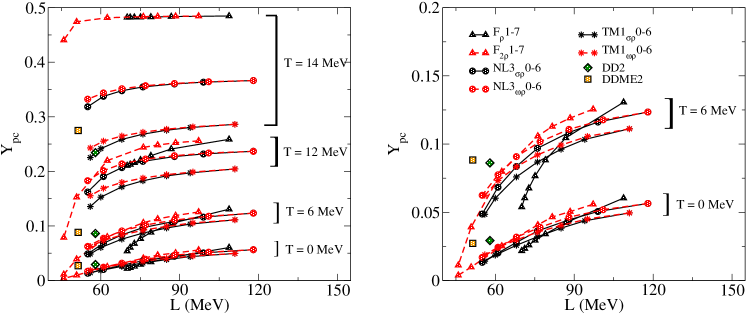
The critical points give us an indication of the phase space region where non-homogeneous matter is expected. The critical densities for neutron rich matter and respective proton fraction for and 14 MeV are given in Table 3, and displayed as a function of in Figs. 6 and 7. The largest temperature considered, 14 MeV, is very close to the critical temperature of the and models. Above the critical temperature, the models do not present instabilities and the formation of clusters is not expected. We first discuss the critical proton fraction. This quantity tells us that matter at the critical density with smaller proton fractions is stable against clusterization at the temperature considered. In the left panel of Fig. 6, the critical proton fractions are given for all the temperatures considered. This allows us to see the dependence of the critical proton fraction on the temperature. The right panel of Fig. 6 shows the same but more extensively for and MeV. There is a clear dependence of the critical proton fraction on the slope (see right panel of Fig. 6 for more details). The critical proton fraction increases when increases: this behavior is valid for all the temperatures considered. However, it should be pointed out that the smaller the , the softer is the increase of the with temperature, for temperatures well below the critical temperature, and this results in a much wider range of critical protons fractions at finite temperature than at . For instance, the critical proton fractions for the associated with smaller (larger) values of are 0.0039 (0.0604), 0.0112 (0.1307), and 0.0788 (0.2587) at temperature T = 0, 6, and 12 MeV, respectively.
We also notice that the spread in the values of the critical proton fraction, at a given , among the various models considered, increases with temperature. For a given , the spread of values is not larger than at MeV. At (12) MeV the critical proton fractions spread over at least (), for a fixed . The largest temperature considered is almost coincident with, or close to, the critical temperature of the models under study. It is striking that there can be a difference of between the proton fractions of these models. Taking as reference MeV, a value within the constraints imposed by experiments, varies between 0.018 and 0.023 for MeV, 0.048 and 0.065 for MeV, 0.136 and 0.186 for MeV, and between 0.225 and 0.478 for MeV. These trends indicate that the models which are calibrated using bulk ground state properties of the finite nuclei do not constrain very well the values of the critical proton fractions at finite temperatures. In fact, it should be pointed out that the large spread on the critical proton fraction close to 14 MeV results from the fact that for some models, BKA22 (base model for and families), this temperature is very close to the critical temperature, while for the TM1 models, the critical temperature is above 15 MeV, and for NL3, MeV. Temperatures of the order 5 - 12 MeV occur in core collapse supernova matter. We may, therefore, expect a different evolution of the supernova when different models are considered as the underlying model of the simulation. In the neutrino trapped phase, a typical proton fraction is 0.3, and we conclude from the left panel of Fig. 6 that while for NL3, , and , matter at MeV is not clusterized, for TM1, nonhomogeneous matter still occurs under these conditions. As a reference we also include the critical proton fractions and the critical densities of the models DD2 and DDME2 in Figs. 6 and 7, since these models satisfy many well established properties. They both have a critical temperature below 14 MeV. At , they show a proton fraction above the predicted one by the model with a similar symmetry energy of the six families studied. This difference grows as the temperature increases, because these models have a lower critical temperature than all the others.
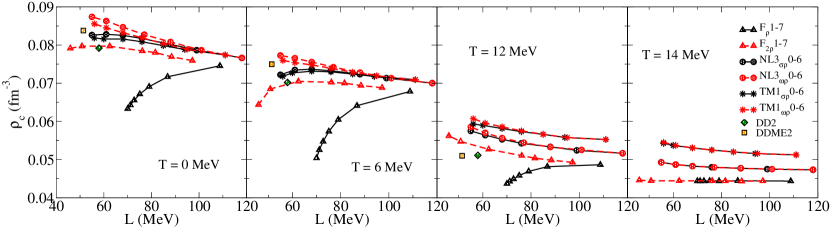
Let us now discuss how the critical density, , changes with and . In Fig. 7, the critical densities are plotted for the different models and temperatures considered. The model stands out because it is the only one that presents a critical density that increases when increases, for all temperatures. The density dependence of the symmetry energy in this model is determined by the term , while all the others have a term or . Models , NL3 and TM1 also show this trend for the lowest temperatures considered, 0 and 6 MeV, and MeV. In all other cases, decreases when increases. The critical densities of models DD2 and DDME2 agree with the other models. Taking again MeV as reference, decreases with , from 0.080-0.087 fm-3 at , to 0.044-0.054 fm-3 at MeV, while the spread of increases slightly with temperature, from 0.006 fm-3 at MeV to 0.01 fm-3 at MeV. This quantity seems, therefore, to be more constrained than the critical proton fraction.
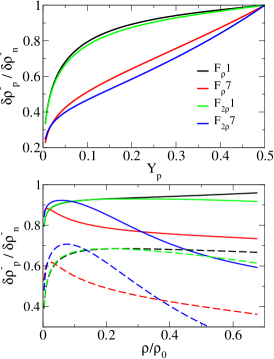
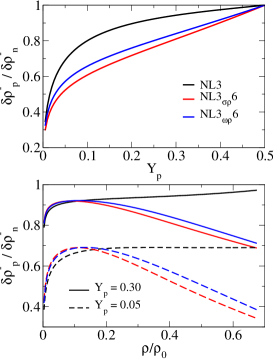
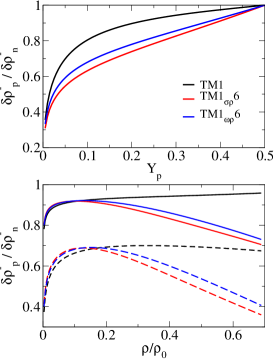
We address next the distillation effect referred in chomaz96 ; avancini06 within the models under discussion. This is possible from the analysis of the instability direction given by . This quantity, calculated at , has been plotted in Fig. 8 as a function of the proton fraction, , for in the top panels, and as a function of the density divided by the nuclear saturation density, , in the bottom panels, and two different values of (0.30 and 0.05) for the models and (left), NL3 and NL3 (middle) and TM1 and TM1 (right panels). The two proton fractions considered are of the order of the proton fractions expected in cold catalyzed stellar matter. It is seen that the distillation effect is present in all models, the direction of instability favors a more isospin symmetric dense matter and a more asymmetric gas phase. However, there is a clear difference between models with a large and a small : the distillation effect is much stronger for the first ones, and for a fixed proton fraction, the distillation effect increases with density, while for the second ones, after a maximum attained at fm-3, the ratio decreases as the density increases. A similar behavior was obtained for density dependent models in avancini06 . While has a behavior very similar to NL3 and TM1 models, with or , once more the shows a particular behavior, showing a smaller (larger) distillation effect for fm-3 than the other models with a similar . Below saturation density, models with a smaller have larger symmetry energies that disfavor a strong distillation effect.
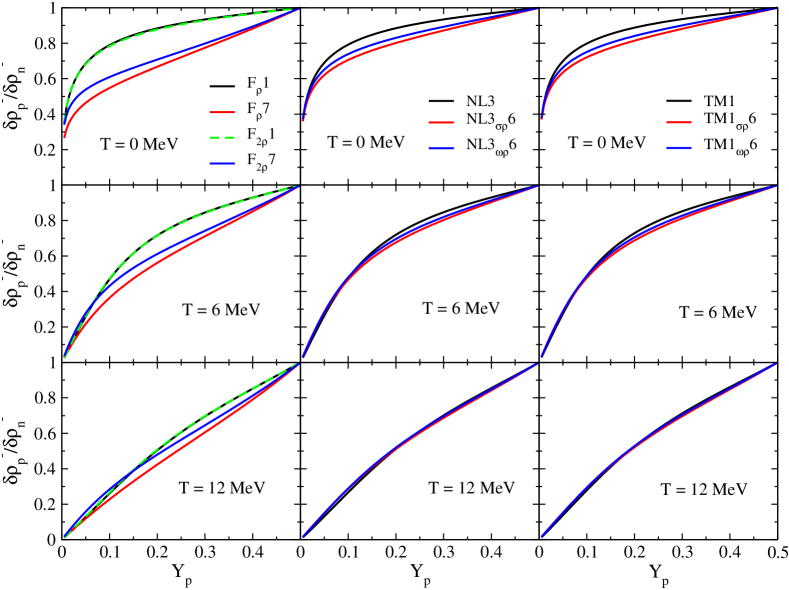
In Figs. 9 and 10, the quantities are plotted for different temperatures. We have considered the density 0.04 fm-3 in the set of plots of Fig. 9 because this is the density that corresponds to clusterized matter at all temperatures. It is evident that the dependence of the distillation effects on the symmetry energy slope parameter gets washed out with the temperature, and for MeV, the differences are already small, although there are still noticeable differences for the families.
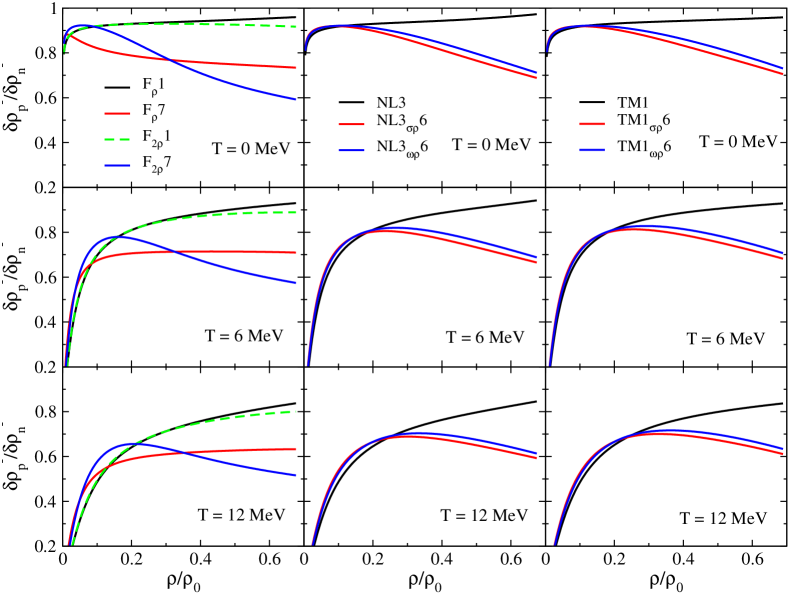
In Fig. 10, the proton fraction has been fixed to a typical value that occurs in trapped neutrino matter, , and the dependence of on the density is shown for different temperatures. Models of the TM1 and NL3 families are different above densities fm-3, with the models with smaller slopes showing a decrease of the ratios, with a larger effect on the models with a non-linear term. Models of the families show larger differences at all temperatures, with the small models having larger values below fm-3. The model differs again from all the other models with a similar , showing a that increases monotonically with at finite .
| Model | ||||||||||||
|---|---|---|---|---|---|---|---|---|---|---|---|---|
| DD2 | 57.94 | 0.0792 | 0.0293 | 0.0702 | 0.0862 | 0.0511 | 0.2343 | - | - | |||
| DD-ME2 | 51.4 | 0.0838 | 0.0272 | 0.0750 | 0.0883 | 0.0510 | 0.2749 | - | - | |||
| 1 | 108.77 | 0.0746 | 0.0604 | 0.0678 | 0.1307 | 0.0486 | 0.2587 | 0.0444 | 0.4848 | |||
| 2 | 86.77 | 0.0717 | 0.0424 | 0.0641 | 0.1046 | 0.0481 | 0.2410 | 0.0444 | 0.4836 | |||
| 3 | 79.02 | 0.0691 | 0.0341 | 0.0605 | 0.0883 | 0.0469 | 0.2287 | 0.0444 | 0.4829 | |||
| 4 | 75.10 | 0.0672 | 0.0294 | 0.0574 | 0.0766 | 0.0458 | 0.2210 | 0.0444 | 0.4825 | |||
| 5 | 72.74 | 0.0656 | 0.0260 | 0.0548 | 0.0676 | 0.0449 | 0.2159 | 0.0444 | 0.4824 | |||
| 6 | 71.16 | 0.0643 | 0.0234 | 0.0526 | 0.0605 | 0.0443 | 0.2127 | 0.0444 | 0.4823 | |||
| 7 | 70.02 | 0.0633 | 0.0217 | 0.0504 | 0.0539 | 0.0437 | 0.2105 | 0.0444 | 0.4823 | |||
| 1 | 97.19 | 0.0759 | 0.0559 | 0.0688 | 0.1256 | 0.0493 | 0.2560 | 0.0444 | 0.4845 | |||
| 2 | 88.44 | 0.0769 | 0.0505 | 0.0694 | 0.1191 | 0.0498 | 0.2525 | 0.0443 | 0.4842 | |||
| 3 | 81.62 | 0.0780 | 0.0466 | 0.0700 | 0.1129 | 0.0504 | 0.2483 | 0.0444 | 0.4839 | |||
| 4 | 76.17 | 0.0785 | 0.0408 | 0.0703 | 0.1059 | 0.0510 | 0.2440 | 0.0444 | 0.4835 | |||
| 5 | 62.45 | 0.0797 | 0.0253 | 0.0705 | 0.0799 | 0.0527 | 0.2198 | 0.0444 | 0.4815 | |||
| 6 | 50.80 | 0.0797 | 0.0098 | 0.0685 | 0.0391 | 0.0547 | 0.1527 | 0.0444 | 0.4741 | |||
| 7 | 45.91 | 0.0791 | 0.0039 | 0.0644 | 0.0112 | 0.0562 | 0.0788 | 0.0446 | 0.4405 | |||
| NL3 | 118.00 | 0.0766 | 0.0565 | 0.0700 | 0.1235 | 0.0517 | 0.2369 | 0.0473 | 0.3664 | |||
| NL31 | 99.00 | 0.0787 | 0.0506 | 0.0713 | 0.1162 | 0.0524 | 0.2319 | 0.0475 | 0.3634 | |||
| NL32 | 88.00 | 0.0802 | 0.0445 | 0.0724 | 0.1085 | 0.0533 | 0.2272 | 0.0477 | 0.3602 | |||
| NL33 | 76.00 | 0.0817 | 0.0363 | 0.0733 | 0.0969 | 0.0543 | 0.2183 | 0.0480 | 0.3548 | |||
| NL34 | 68.00 | 0.0825 | 0.0279 | 0.0737 | 0.0836 | 0.0553 | 0.2069 | 0.0483 | 0.3478 | |||
| NL35 | 61.00 | 0.0828 | 0.0202 | 0.0735 | 0.0683 | 0.0564 | 0.1905 | 0.0487 | 0.3375 | |||
| NL36 | 55.00 | 0.0826 | 0.0133 | 0.0722 | 0.0487 | 0.0575 | 0.1622 | 0.0493 | 0.3184 | |||
| NL31 | 101.00 | 0.0787 | 0.0519 | 0.0713 | 0.1178 | 0.0525 | 0.2337 | 0.0475 | 0.3642 | |||
| NL32 | 88.00 | 0.0808 | 0.0464 | 0.0728 | 0.1108 | 0.0533 | 0.2287 | 0.0477 | 0.3611 | |||
| NL33 | 77.00 | 0.0827 | 0.0390 | 0.0742 | 0.1017 | 0.0544 | 0.2226 | 0.0480 | 0.3570 | |||
| NL34 | 68.00 | 0.0847 | 0.0318 | 0.0756 | 0.0908 | 0.0556 | 0.2138 | 0.0483 | 0.3515 | |||
| NL35 | 61.00 | 0.0863 | 0.0244 | 0.0766 | 0.0775 | 0.0570 | 0.2013 | 0.0487 | 0.3437 | |||
| NL36 | 55.00 | 0.0874 | 0.0170 | 0.0773 | 0.0625 | 0.0585 | 0.1829 | 0.0492 | 0.3323 | |||
| TM1 | 111.00 | 0.0774 | 0.0496 | 0.0709 | 0.1112 | 0.0553 | 0.2044 | 0.0512 | 0.2862 | |||
| TM11 | 94.00 | 0.0788 | 0.0438 | 0.0718 | 0.1034 | 0.0558 | 0.1972 | 0.0516 | 0.2803 | |||
| TM12 | 85.00 | 0.0799 | 0.0384 | 0.0724 | 0.0962 | 0.0566 | 0.1917 | 0.0520 | 0.2754 | |||
| TM13 | 76.00 | 0.0809 | 0.0321 | 0.0730 | 0.0868 | 0.0573 | 0.1828 | 0.0525 | 0.2681 | |||
| TM14 | 68.00 | 0.0815 | 0.0258 | 0.0732 | 0.0759 | 0.0581 | 0.1717 | 0.0530 | 0.2585 | |||
| TM15 | 60.00 | 0.0818 | 0.0186 | 0.0727 | 0.0604 | 0.0590 | 0.1528 | 0.0537 | 0.2417 | |||
| TM16 | 56.00 | 0.0817 | 0.0142 | 0.0718 | 0.0485 | 0.0593 | 0.1356 | 0.0543 | 0.2254 | |||
| TM11 | 95.00 | 0.0789 | 0.0451 | 0.0720 | 0.1056 | 0.0558 | 0.1988 | 0.0516 | 0.2817 | |||
| TM12 | 85.00 | 0.0804 | 0.0404 | 0.0729 | 0.0993 | 0.0566 | 0.1941 | 0.0520 | 0.2773 | |||
| TM13 | 76.00 | 0.0819 | 0.0354 | 0.0739 | 0.0921 | 0.0575 | 0.1878 | 0.0525 | 0.2718 | |||
| TM14 | 68.00 | 0.0832 | 0.0297 | 0.0748 | 0.0834 | 0.0586 | 0.1799 | 0.0531 | 0.2648 | |||
| TM15 | 61.00 | 0.0845 | 0.0243 | 0.0754 | 0.0732 | 0.0595 | 0.1691 | 0.0537 | 0.2554 | |||
| TM16 | 56.00 | 0.0856 | 0.0189 | 0.0760 | 0.0624 | 0.0607 | 0.1555 | 0.0545 | 0.2430 | |||
IV Conclusion
In the present study, we have analysed the extension of the nonhomogeneous nuclear matter in the density, isospin and temperature directions, as predicted by six different families of the RMF models, together with two density-dependent models. The six families of models have been built from three different base models, whose parameters are fitted to the ground state properties of nuclei. An extra term that couples the -meson either to the or -meson is appropriately added to each of the base models to yield the variation in the symmetry energy slope approximately between 50 and 100 MeV Horowitz ; Carriere ; frho . The thermodynamical spinodal sections are determined by the loci in phase space where the curvature matrix of the free energy is zero. These spinodal sections and lines of critical points are obtained for temperatures below the critical temperature above which there is a smooth transition from a gas to a liquid phase. The critical proton fractions and densities for a given temperature give us an indication whether clusterized matter could occur under some particular conditions. In particular, the clusterized matter is not expected at densities larger and proton fractions smaller than the corresponding critical values.
It is shown that for a given symmetry energy slope parameter , the models that include a non-linear cross-coupling predict smaller critical densities and proton fractions. The effect is specially strong for the family, which includes a cross-coupling term. The critical density is more constrained. In fact, considering a slope MeV, the spread on the critical density increases from 0.006 fm-3 at to fm-3 at MeV. The critical proton fraction at zero temperature increases when the slope increases, and for a given value , it is almost independent of the model considered. This is not the case at finite temperature, where a spread on the proton fraction of 0.25 for MeV is found, when all the different models are considered. This large spread on the critical proton fraction close to 14 MeV can be attributed to the different critical temperatures of the models under study. Since the models considered predict different critical temperatures associated with symmetric matter, the critical proton fractions at temperatures above 10 MeV may show a large spread.
We have also analysed the behavior of the distillation effect with temperature. In particular, previous results, concerning a smaller effect within models with a smaller slope , were confirmed. Although the temperature washes out some of the differences between the models, mainly among the models of the same family, some differences remain, the stronger ones among models belonging to the families.
It is observed that the family, which includes a cubic cross-coupling term of the type , behaves differently as compared to the other families of models in which quartic cross-coupling terms of the type or are considered. Five of the six the families contain at least one model that satisfies the constrains coming from microscopic calculations for pure neutron matter at sub-saturation densities (see Fig. 1 and Ref. paisVlasov ), the family being the only one that does not satisfy this constrain.
Seemingly, these results favour the inclusion of quartic order cross-coupling terms over the cubic order term, though a cubic term should also be included from “naturalness” arguments mueller96 . Therefore, a more careful calibration should be undertaken, which takes into account constrains from nuclear ground state properties, as well as constraints coming from microscopic calculations for neutron matter.
ACKNOWLEDGMENTS
Partial support comes from Fundação para a Ciência e Tecnologia (FCT), Portugal, under the project No. UID/FIS/04564/2016 and from “NewCompStar”, COST Action MP130. H.P. is supported by FCT (Portugal) under Project No. SFRH/BPD/95566/2013. N.A. would like to thankfully acknowledge the useful discussions and the nice hospitality extended to him during his visit to University of Coimbra, when this work started.
References
- (1) A. Mezzacappa, Annu. Rev. Nucl. Part. Sci. 55, 467 (2005); H.-T. Janka, K. Langanke, A. Marek, G. Martinez-Pinedo, and B. Mueller, Phys. Rept.442, 38 (2007); H.-T. Janka, Ann. Rev. Nucl. Part. Sci. 62, 407 (2012); A. Burrows, Rev. Mod. Phys. 85, 245 (2013).
- (2) J. R. Stone, and P.-G. Reinhard, Prog. Part. Nucl. Phys. 58, 587 (2007).
- (3) A. Mezzacappa, Annu. Rev. Nucl. Part. Sci. 55, 467 (2005).
- (4) M. Oertel, M. Hempel, T. Klähn, and S. Typel, arXiv:1610.03361.
- (5) S. Typel, G. Röpke, T. Klähn, D. Blaschke, and H. H. Wolter, Phys. Rev. C 81, 015803 (2010); C. J. Horowitz and A. Schwenk, Nuclear Physics A 776, 55 (2006); S. Heckel, P. P. Schneider, and A. Sedrakian, Phys. Rev. C 80, 015805 (2009); M. Ferreira and C. Providência, Phys. Rev. C 85, 055811 (2012); S. S. Avancini, C. C. Barros Jr., D. P. Menezes, and C. Providência, Phys. Rev. C 82, 025808 (2010); S. S. Avancini, C. C. Barros Jr., L. Brito, S. Chiacchiera, D. P. Menezes, and C. Providência, Phys. Rev. C 85, 035806 (2012).
- (6) D. G. Ravenhall, C. J. Pethick, and J. R. Wilson, Phys. Rev. Lett. 50, 2066 (1983); C. J. Horowitz, M. A. Pérez-García, and J. Piekarewicz, Phys. Rev. C 69, 045804 (2004); T. Maruyama, T. Tatsumi, D. N. Voskresensky, T. Tanigawa, and S. Chiba, Phys. Rev. C 72, 015802 (2005); G. Watanabe, T. Maruyama, K. Sato, K. Yasuoka, and T. Ebisuzaki, Phys. Rev. Lett. 94, 031101 (2005); H. Pais and J. R. Stone, Phys. Rev. Lett. 109, 151101 (2012); F. Grill, H. Pais, C. Providência, I. Vidaña, and S. S. Avancini, Phys. Rev. C 90, 045803 (2014); H. Pais, S. Chiacchiera, and C. Providência, Phys. Rev. C 91, 055801 (2015).
- (7) P. Haensel, Acta Phys.Polon. B25, 373 (1994); D. Page and S. Reddy, Phys. Rev. Lett. 111, 241102 (2013).
- (8) R. D. Williams and S. E. Koonin, Nucl. Phys. A 435, 844 (1985); S. Furusawa, H. Nagakura, K. Sumiyoshi, and S. Yamada, Astrophys. J. 774, 78 (2013).
- (9) N. Buyukcizmeci, A. Botvina, I. Mishustin, R. Ogul, M. Hempel, J. Schaffner-Bielich, F.-K. Thielemann, S. Furusawa, K. Sumiyoshi, S. Yamada, and H. Suzuki, Nucl.Phys. A 907, 13 (2013).
- (10) O. Lourenço, B. M. Santos, M. Dutra, and A. Delfino, Phys. Rev. C 94, 045207 (2016).
- (11) V. A. Karnaukhov, Phys. At. Nucl. 60, 1625 (1997); Nucl. Phys. A 734, 520 (2004); V. A. Karnaukhov et al., Nucl. Phys. A 780, 91 (2006); V. A. Karnaukhov, Phys. At. Nucl. 71, 2067 (2008).
- (12) J. B. Natowitz, K. Hagel, Y. Ma, M. Murray, L. Qin, R. Wada, and J. Wang, Phys. Rev. Lett. 89, 212701 (2002).
- (13) V. A. Karnaukhov, et al., Phys. Rev. C 67, 011601(R) (2003).
- (14) J. B. Elliott, P. T. Lake, L. G. Moretto, and L. Phair, Phys. Rev. C 87, 054622 (2013).
- (15) J. R. Stone, N. J. Stone, and S. A. Moszkowski, Phys. Rev. C 89, 044316 (2014).
- (16) S. S. Avancini, S. Chiacchiera, D. P. Menezes, and C. Providência, Phys. Rev. C 82, 055807 (2010); Phys. Rev. C 85, 059904(E) (2012).
- (17) S. S. Avancini, L. Brito, Ph. Chomaz, D. P. Menezes, and C. Providência, Phys. Rev. C 74, 024317 (2006).
- (18) H. Pais, A. Sulaksono, B. K. Agrawal, and C. Providência, Phys. Rev. C 93, 045802 (2016).
- (19) C. Ducoin, J. Margueron, C. Providência, and I. Vidaña, Phys. Rev. C 83, 045810 (2011).
- (20) R. J. Furnstahl, B. D. Serot, and H. B. Tang, Nucl. Phys. A 598, 539 (1996).
- (21) R. J. Furnstahl, B. D. Serot, and H. B. Tang, Nucl. Phys. A 615, 441 (1997).
- (22) A. Sulaksono and Kasmudin, Phys. Rev. C 80, 054317 (2009).
- (23) B. K. Agrawal, Phys. Rev. C 81, 034323 (2010).
- (24) V. Baran, M. Colonna, M. Di Toro, and A. B. Larionov, Nucl. Phys. A 632, 287 (1998).
- (25) H. Müller and B. D. Serot, Phys. Rev. C 52, 2072 (1995).
- (26) M. Modell and R. C. Reid, Thermodynamics and Its Applications, 2nd edition (Prentice-Hall, Englewood Cliffs, NJ, 1983).
- (27) J. Carriere, C. J. Horowitz, and J. Piekarewicz, Astrophys. J. 593, 463 (2003).
- (28) H. Pais, C. Providência, Phys. Rev. C 94, 015808 (2016).
- (29) N. Alam, A. Sulaksono, and B. K. Agrawal, Phys. Rev. C 92, 015804 (2015).
- (30) B. K. Agrawal, Phys. Rev. C 81, 034323 (2010).
- (31) G. A. Lalazissis, J. König, and P. Ring, Phys. Rev. C 55, 540 (1997).
- (32) Y. Sugahara and H. Toki, Nucl. Phys. A 579, 557 (1994); K. Sumiyoshi, H. Kuwabara, and H. Toki, Nucl. Phys. A 581, 725 (1995).
- (33) C. J. Horowitz and J. Piekarewicz, Phys. Rev. Lett. 86, 5647 (2001).
- (34) P. B. Demorest, T. Pennucci, S. M. Ransom, M. S. E. Roberts, and J. W. T. Hessels, Nature (London) 467, 1081 (2010); E. Fonseca, T. T. Pennucci, J. A. Ellis, I. H. Stairs, D. J. Nice, S. M. Ransom, P. B. Demorest, Z. Arzoumanian, K. Crowter, T. Dolch, R. D. Ferdman, M. E. Gonzalez, G. Jones, M. L. Jones, M. T. Lam, L. Levin, M. A. McLaughlin, K. Stovall, J. K. Swiggum, and W. Zhu, arXiv:1603.00545.
- (35) J. Antoniadis, P. C. C. Freire, N. Wex, T. M. Tauris, R. S. Lynch, M. H. van Kerkwijk, M. Kramer, C. Bassa, V. S. Dhillon, T. Driebe, J. W. T. Hessels, V. M. Kaspi, V. I. Kondratiev, N. Langer, T. R. Marsh, M. A. McLaughlin, T. T. Pennucci, S. M. Ransom, I. H. Stairs, J. van Leeuwen, J. P. W. Verbiest, and D. G. Whelan, Science 340, 448 (2013).
- (36) N. Alam, B. K. Agrawal, M. Fortin, H. Pais, C. Providência, Ad. R. Raduta, and A. Sulaksono, Phys. Rev. C 94, 052801(R) (2016).
- (37) S. Typel, G. Röpke, T. Klähn, D. Blaschke, and H. H. Wolter, Phys. Rev. C 81, 015803 (2010).
- (38) G. A. Lalazissis, T. Niksić, D. Vretenar, and P. Ring, Phys. Rev. C 71, 024312 (2005).
- (39) M. Fortin, C. Providência, Ad. R. Raduta, F. Gulminelli, J. L. Zdunik, P. Haensel, and M. Bejger, Phys. Rev. C 94, 035804 (2016).
- (40) K. Hebeler, J. M. Lattimer, C. J. Pethick, and A. Schwenk, Astrophys. J. 773, 11 (2013).
- (41) S. Gandolfi, J. Carlson, and S. Reddy, Phys. Rev. C 85, 032801 (2012).
- (42) P. Danielewicz, R. Lacey, and W. G. Lynch, Science 298, 1592 (2002).
- (43) W. G. Lynch, M. B. Tsang, Y. Zhang, P. Danielewicz, M. Famiano, Z. Li, and A. W. Steiner, Prog. Part. Nucl. Phys. 62, 427 (2009); C. Fuchs, Prog. Part. Nucl. Phys. 56, 1 (2006).
- (44) H. Pais, A. Santos, L. Brito, C. Providência, Phys. Rev. C 82, 025801 (2010).
- (45) B. Jacquot, S. Ayik, Ph. Chomaz, and M. Colonna, Phys. Lett. B 383, 247 (1996).
- (46) H. Müller, B. D. Serot, Nucl.Phys. A 606, 508 (1996); R. J. Furnstahl, B. D. Serot, and H.-B. Tang, Nucl. Phys. A 615, 441 (1997); Nucl. Phys. A 640, 505 (E) (1998).