Quantum gas microscopy of an attractive Fermi-Hubbard system
Abstract
The attractive Fermi-Hubbard model is the simplest theoretical model for studying pairing and superconductivity of fermions on a lattice Micnas et al. (1990). Although its -wave pairing symmetry excludes it as a microscopic model for high-temperature superconductivity, it exhibits much of the relevant phenomenology, including a short-coherence length at intermediate coupling and a pseudogap regime with anomalous properties Randeria et al. (1992); Trivedi and Randeria (1995); Singer et al. (1996); Kyung et al. (2001). Here we study an experimental realization of this model using a two-dimensional (2D) atomic Fermi gas in an optical lattice. Our site-resolved measurements on the normal state reveal checkerboard charge-density-wave correlations close to half-filling. A “hidden” SU(2) pseudo-spin symmetry of the Hubbard model at half-filling guarantees superfluid correlations in our system Yang and Zhang (1990), the first evidence for such correlations in a single-band Hubbard system of ultracold fermions. Compared to the paired atom fraction, we find the charge-density-wave correlations to be a much more sensitive thermometer, useful for optimizing cooling into superfluid phases in future experiments.
The Fermi-Hubbard model is a fundamental condensed matter model for studying strongly-correlated fermions on a lattice Hubbard (1963); Auerbach . The numerical intractability of the model at low temperatures has spurred much experimental work on quantum simulations using repulsively interacting cold atoms in optical lattices Jördens et al. (2008); Schneider et al. (2008); Greif et al. (2013); Hart et al. (2015); Parsons et al. (2016); Cheuk et al. (2016); Boll et al. (2016); Brown et al. (2016); Cocchi et al. (2016). In contrast, the attractive model has received much less attention from the cold atom community Strohmaier et al. (2007); Hackermüller et al. (2010); Schneider et al. (2012), despite being an ideal playground for exploring short coherence-length superconductivity on a lattice. In the continuum, strongly-interacting attractive fermions have been studied using Feshbach resonances, resulting in the observation of superfluid gases across the crossover from molecular Bose-Einstein condensates (BEC) to Bardeen-Cooper-Schrieffer superfluids (BCS) Ing (2008). Fermionic superfluids have also been prepared in optical lattices close to a Feshbach resonance Chin et al. (2006). However, these systems are not described by a simple Hubbard model due to multi-band couplings and off-site interactions Duan (2005); Carr and Holland (2005); Zhou (2005); Diener and Ho (2006).
In this work, we focus on the 2D attractive Fermi-Hubbard model which has been theoretically studied in detail Hirsch (1985); Scalettar et al. (1989); Micnas et al. (1990); Moreo and Scalapino (1991); Paiva et al. (2004). Our experiments are performed at an interaction energy small compared to the bandgap, where the single-band Hubbard description is applicable. In a grand-canonical ensemble, the Hamiltonian of the system is given by . Here is the creation operator for a fermion with spin on site r, , is the tunneling matrix element between nearest-neighbor lattice sites, is the strength of the on-site interaction and is a spin-independent chemical potential. At low temperatures, the fermions undergo a Berezinskii-Kosterlitz-Thouless (BKT) transition to a superfluid phase. As is increased, the superfluid crosses over from a BCS-type superfluid to BEC of hardcore bosons, with the critical temperature reaching a maximum in the intermediate coupling regime. Near this maximum and in the BEC regime, numerical calculations indicate a clear separation between a temperature scale at which pairing correlations appear and the BKT transition temperature Scalettar et al. (1989).
The phase diagram of the attractive Hubbard model versus filling is shown in Fig. 1a. At half-filling, the model has a “hidden” SU(2) pseudo-spin symmetry, in addition to the ordinary SU(2) spin symmetry Yang and Zhang (1990). Pseudo-spin rotations on site are generated by the charge-density fluctuation operator and the pairing operators and . The local pseudo-spin vector is defined by , where . The Hubbard Hamiltonian is rotationally invariant under global pseudo-spin rotation at half-filling, leading to checkerboard charge-density-wave (CDW) and superfluid correlations of equal strength. The SU(2) symmetry drives the critical temperature to zero. Away from half-filling, the degeneracy is lifted, and superfluid correlations exhibit quasi-long-range order below a non-zero BKT critical temperature while the charge-density-wave correlations remain short-range.
Here we perform a site-resolved study of the attractive Hubbard model with a fermionic quantum gas microscope Haller et al. (2015); Edge et al. (2015); Omran et al. (2015); Parsons et al. (2015); Cheuk et al. (2015); Yamamoto et al. (2016); Brown et al. (2016) at temperatures above the BKT transition temperature. We measure the in-trap distributions of single and double occupancies and observe charge density wave (CDW) correlations near half-filling. This observation allows us to put a lower bound on superfluid correlations in the system. Furthermore, the CDW correlations enable us to perform accurate thermometry on the attractive lattice gas at the superexchange scale. Thermometry at this scale will be important for future work aimed at observing lattice superfluid phases, including homogeneous superfluids in spin-balanced gases and superfluids with spatially-modulated gaps in spin-imbalanced gases Fulde and Ferrell (1964).
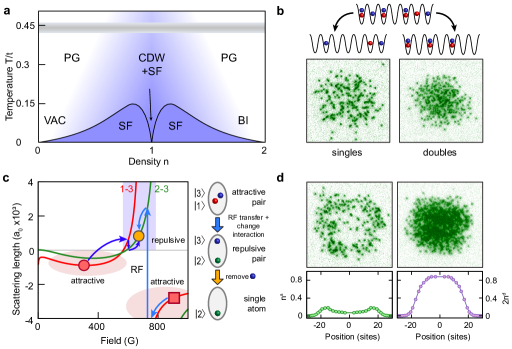
We realize the 2D Fermi-Hubbard model using a degenerate mixture of two hyperfine ground states, and , of 6Li in an optical lattice, where labels the th lowest hyperfine ground state. A spin-balanced mixture is obtained by optical evaporation in the vicinity of a broad Feshbach resonance centered at 690 G. After the evaporation, the scattering length is set to , where is the Bohr radius, obtained by adjusting a bias magnetic field to 305.4(1) G. The mixture is prepared in a single layer of an accordion lattice (for details see Mitra et al. (2016)) and subsequently loaded adiabatically into a 2D square lattice of depth , where Hz. The lattice depth is chosen experimentally to maximize the observed CDW correlations at half filling (see Supplementary Information). Here, kHz is the recoil energy, where is the lattice constant. For these parameters, we obtain from a bandstructure calculation and a spectroscopic determination of the interaction energy.
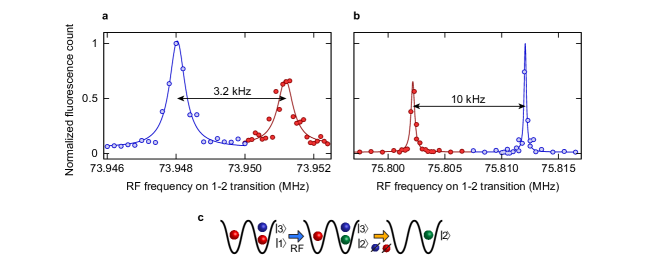
We extract the density profiles and correlations in the cloud from site-resolved fluorescence images obtained using quantum gas microscopy techniques (Fig. 1b). After freezing the density distribution in a deep lattice, we shine near-resonant light on the atoms in a Raman-cooling configuration. Light-assisted collisions eliminate atoms on doubly occupied sites, and we measure the singles density . To gain the full density information, one needs to measure the doubly occupied sites as well. But they are not directly accessible, so we developed a procedure to selectively image doubly occupied sites (Fig. 1c). After freezing the dynamics, we tag doubly occupied sites using a radiofrequency pulse to transfer atoms in state to state only on these sites, relying on the interaction energy for spectroscopic addressing. We then push atoms in states and out of the lattice with a resonant light pulse. We avoid the loss of state atoms during the resonant light pulse due to light-assisted collisions by an appropriate choice of a positive scattering length for this step. This procedure gives us access to the doublon density . We have measured our doublon detection efficiency to be by analyzing the imaging fidelity of band insulating regions in the cloud (Fig. 1d, see Supplementary Information). The average singles and doubles density profiles obtained from clouds prepared under identical conditions allow us to extract the total density profile . For most of our measurements, we adjust the atom number to obtain a total density slightly above at the center of the trap to obtain a large region in the cloud near half filling.
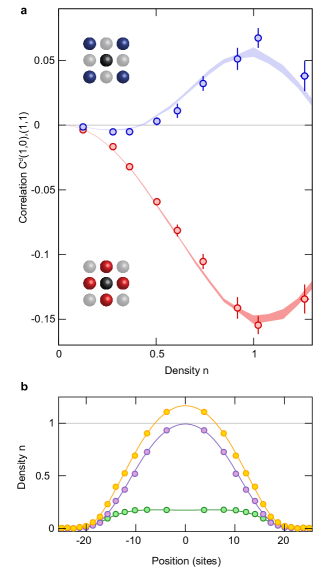
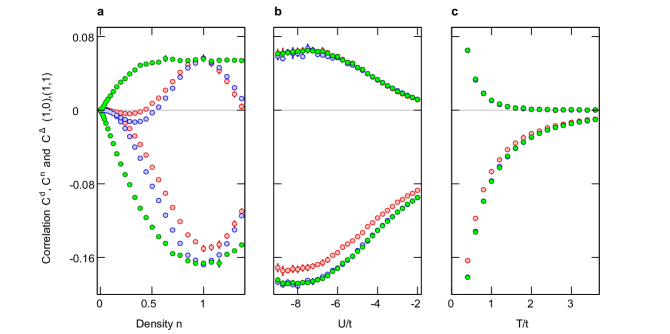
Spatial correlations of the -component of the pseudo-spin near half-filling correspond to CDW correlations, characterized by where a is the displacement vector between two lattice sites. We extract a closely related quantity, the doublon-doublon correlator , which also exhibits checkerboard order since most of the atoms in the gas are paired. As the attractive gas is compressible for any filling below unit filling, the local density varies across the harmonic trap. Fig. 2a shows the doublon-doublon correlator versus density for the nearest-neighbor and the next-nearest-neighbor, obtained by azimuthally averaging the correlations over the trap. The corresponding trap density profile of the gas is depicted in Fig. 2b. The nearest-neighbor doublon-doublon correlator measured at half-filling is Since for any filling (see Supplementary Information), our measurements constitute a lower bound for superfluid correlations in the system. Here, the -wave superfluid gap operator on site r is defined by .
An interesting feature of the next-nearest-neighbor correlator is that it becomes negative as the average density falls below . This can be understood in the large limit, where the system can be treated as a gas of hardcore bosons with repulsive nearest-neighbor interactions, leading to negative correlations at distances less than the interparticle spacing. In a recent experiment, a closely related behavior has been observed in the next-nearest-neighbor antiferromagnetic correlations of the -projection of the spin in a spin-imbalanced repulsive Hubbard model Brown et al. (2016). A particle-hole transformation on operators of fermions in the Hubbard Hamiltonian, , changes the sign of the interaction and exchanges the roles of spin-imbalance and doping Ho et al. (2009), leading to this symmetry of the correlators between the two experiments.
We theoretically model our system using determinantal Quantum Monte Carlo (DQMC) Varney et al. (2009) in a local density approximation (LDA) and see very good agreement between theory and experiment for the doublon-doublon correlators and density (Fig. 2). The fits give and . The measured temperature is comparable to our recent measurements in a repulsive gas Brown et al. (2016). We have also compared to DQMC in the presence of a spatially varying potential to reproduce the largest experimentally observed density gradients to verify that the LDA holds in our system.
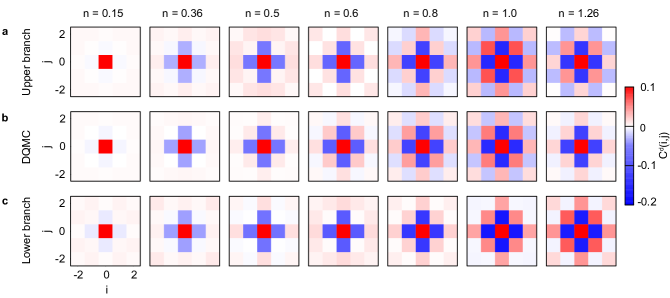
Single-site imaging of doublons allows us to also measure longer range correlations (Fig. 3). We see doublon-doublon correlations up to two sites on a diagonal shown in the correlation matrices . We find good agreement with DQMC calculations corresponding to the experimental fillings, calculated using the same parameters as above. The range of the correlation becomes maximal at half filling as expected from theory.
The previous discussion focused on the upper branch of the Feshbach resonance, used for repulsive Hubbard experiments with lithium Hart et al. (2015); Parsons et al. (2016); Boll et al. (2016); Brown et al. (2016). Since we are studying an attractive model, we also have the choice of using the lower branch of the resonance, previously used in continuum BEC-BCS crossover experiments Ing (2008). It is not clear a priori how the temperature of gases prepared on the two branches would compare. We have explored this question by measuring doublon-doublon correlations in lower-branch gases (Fig. 3c). The least negative scattering length we can access on this branch is , so we use a lower lattice depth of 4.1(1) to reach the same value of as on the upper branch. We obtain nearest-neighbor doublon-doublon correlations of -0.172(5) at half filling, suggesting that we reach similar temperatures for this branch. The correlation matrices for the upper and lower branch do not agree very well, especially for larger site separations, which is expected since the on-site interaction energy is comparable to the vertical lattice confinement, leading to higher-band effects which modify the Hamiltonian. A precise determination of the temperature on the upper branch requires taking these effects into account, an endeavor that is outside the scope of this work.
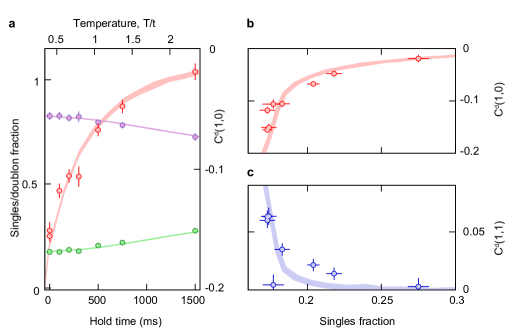
Both pairing and CDW correlations may be used as thermometers in an attractive Hubbard gas. To investigate their sensitivity as thermometers, we heated the upper branch system in a controlled fashion by holding it for variable times in the lattice before imaging. Technical noise leads to a linear increase in the temperature of the system. We observe a slight reduction in doublon fraction in a region of half filling for long hold times (Fig. 4a), while the doublon-doublon correlators and show a significant change during the same time. These observations illustrate that the doublon fraction is a good thermometer for temperatures on the order of , where CDW correlations are small, while the doublon-doublon correlator is a more sensitive thermometer for temperatures on the order of the exchange . Fig. 4b,c shows the nearest-neighbor and next-nearest-neighbor doublon-doublon correlators versus the singles fraction at half-filling. Plotting the data this way allows a temperature-independent comparison to DQMC with a single free-parameter (), and we see good agreement for .
In conclusion, we have performed quantum gas microscopy on an attractive atomic Fermi-Hubbard system. We observed CDW correlations and studied their dependence on the lattice filling and temperature. We have shown that these correlations serve as an excellent thermometer in the low temperature regime that will be useful in the quest to reduce the temperature of attractive lattice systems to observe long-range Hubbard superfluids. Above the critical temperature, attractive Hubbard systems will allow experimental exploration of the physics of the pseudogap regime, while at lower temperatures, they will enable studies of the BKT transition in a lattice system. The superfluid correlations inferred in this experiment may be probed more directly using collective excitations of the superfluid order parameter that couple to the conjugate CDW order parameter Demler et al. (1996). Another interesting direction for future work is the study of the spin-imbalanced attractive Hubbard model in 2D, where Fermi surface nesting due to the lattice increases the stability of Fulde-Ferrell-Larkin-Ovchinnikov (FFLO) superfluids Moreo and Scalapino (2007); Loh and Trivedi (2010); Kim and Törmä (2012); Gukelberger et al. (2016). Unlike spin-balanced gases investigated in this work, DQMC suffers a fermion “sign” problem in simulating the spin-imbalanced attractive Hubbard model, making theoretical predictions difficult at low temperatures.
Acknowledgements.
This work was supported by the NSF (grant no. DMR-1607277), the David and Lucile Packard Foundation (grant no. 2016-65128), and the AFOSR Young Investigator Research Program (grant no. FA9550-16-1-0269). W.S.B. was supported by an Alfred P. Sloan Foundation fellowship. P.T.B. was supported by the DoD through the NDSEG Fellowship Program.References
- Micnas et al. (1990) R. Micnas, J. Ranninger, and S. Robaszkiewicz, Rev. Mod. Phys. 62, 113 (1990).
- Randeria et al. (1992) M. Randeria, N. Trivedi, A. Moreo, and R. T. Scalettar, Phys. Rev. Lett. 69, 2001 (1992).
- Trivedi and Randeria (1995) N. Trivedi and M. Randeria, Phys. Rev. Lett. 75, 312 (1995).
- Singer et al. (1996) J. M. Singer, M. H. Pedersen, T. Schneider, H. Beck, and H.-G. Matuttis, Phys. Rev. B 54, 1286 (1996).
- Kyung et al. (2001) B. Kyung, S. Allen, and A.-M. S. Tremblay, Phys. Rev. B 64, 075116 (2001).
- Yang and Zhang (1990) C. N. Yang and S. C. Zhang, Mod. Phys. Lett. B 04, 759 (1990).
- Hubbard (1963) J. Hubbard, Proc. Roy. Soc. A 276, 238 (1963).
- (8) A. Auerbach, Interacting Electrons and Quantum Magnetism (Springer, New York, 1994).
- Jördens et al. (2008) R. Jördens, N. Strohmaier, K. Günter, H. Moritz, and T. Esslinger, Nature 455, 204 (2008).
- Schneider et al. (2008) U. Schneider, L. Hackermüller, S. Will, T. Best, I. Bloch, T. A. Costi, R. W. Helmes, D. Rasch, and A. Rosch, Science 322, 1520 (2008).
- Greif et al. (2013) D. Greif, T. Uehlinger, G. Jotzu, L. Tarruell, and T. Esslinger, Science 340, 1307 (2013).
- Hart et al. (2015) R. A. Hart, P. M. Duarte, T.-L. Yang, X. Liu, T. Paiva, E. Khatami, R. T. Scalettar, N. Trivedi, D. A. Huse, and R. G. Hulet, Nature 519, 211 (2015).
- Parsons et al. (2016) M. F. Parsons, A. Mazurenko, C. S. Chiu, G. Ji, D. Greif, and M. Greiner, Science 353, 1253 (2016).
- Cheuk et al. (2016) L. W. Cheuk, M. A. Nichols, K. R. Lawrence, M. Okan, H. Zhang, E. Khatami, N. Trivedi, T. Paiva, M. Rigol, and M. W. Zwierlein, Science 353, 1260 (2016).
- Boll et al. (2016) M. Boll, T. A. Hilker, G. Salomon, A. Omran, J. Nespolo, L. Pollet, I. Bloch, and C. Gross, Science 353, 1257 (2016).
- Brown et al. (2016) P. T. Brown, D. Mitra, E. Guardado-Sanchez, P. Schauß, S. S. Kondov, E. Khatami, T. Paiva, N. Trivedi, D. A. Huse, and W. S. Bakr, arXiv:1612.07746 (2016).
- Cocchi et al. (2016) E. Cocchi, L. A. Miller, J. H. Drewes, M. Koschorreck, D. Pertot, F. Brennecke, and M. Köhl, Phys. Rev. Lett. 116, 175301 (2016).
- Strohmaier et al. (2007) N. Strohmaier, Y. Takasu, K. Günter, R. Jördens, M. Köhl, H. Moritz, and T. Esslinger, Phys. Rev. Lett. 99, 220601 (2007).
- Hackermüller et al. (2010) L. Hackermüller, U. Schneider, M. Moreno-Cardoner, T. Kitagawa, T. Best, S. Will, E. Demler, E. Altman, I. Bloch, and B. Paredes, Science 327, 1621 (2010).
- Schneider et al. (2012) U. Schneider, L. Hackermüller, J. P. Ronzheimer, S. Will, S. Braun, T. Best, I. Bloch, E. Demler, S. Mandt, D. Rasch, and A. Rosch, Nat Phys 8, 213 (2012).
- Ing (2008) Proceedings of the International School of Physics “Enrico Fermi”, Course CLXIV (IOS Press, Amsterdam, 2008).
- Chin et al. (2006) J. K. Chin, D. E. Miller, Y. Liu, C. Stan, W. Setiawan, C. Sanner, K. Xu, and W. Ketterle, Nature 443, 961 (2006).
- Duan (2005) L.-M. Duan, Phys. Rev. Lett. 95, 243202 (2005).
- Carr and Holland (2005) L. D. Carr and M. J. Holland, Phys. Rev. A 72, 031604 (2005).
- Zhou (2005) F. Zhou, Phys. Rev. B 72, 220501 (2005).
- Diener and Ho (2006) R. B. Diener and T.-L. Ho, Phys. Rev. Lett. 96, 010402 (2006).
- Hirsch (1985) J. E. Hirsch, Phys. Rev. B 31, 4403 (1985).
- Scalettar et al. (1989) R. T. Scalettar, E. Y. Loh, J. E. Gubernatis, A. Moreo, S. R. White, D. J. Scalapino, R. L. Sugar, and E. Dagotto, Phys. Rev. Lett. 62, 1407 (1989).
- Moreo and Scalapino (1991) A. Moreo and D. J. Scalapino, Phys. Rev. Lett. 66, 946 (1991).
- Paiva et al. (2004) T. Paiva, R. R. dos Santos, R. T. Scalettar, and P. J. H. Denteneer, Phys. Rev. B 69, 184501 (2004).
- Haller et al. (2015) E. Haller, J. Hudson, A. Kelly, D. A. Cotta, B. Peaudecerf, G. D. Bruce, and S. Kuhr, Nat. Phys. 11, 738 (2015).
- Edge et al. (2015) G. J. A. Edge, R. Anderson, D. Jervis, D. C. McKay, R. Day, S. Trotzky, and J. H. Thywissen, Phys. Rev. A 92, 063406 (2015).
- Omran et al. (2015) A. Omran, M. Boll, T. A. Hilker, K. Kleinlein, G. Salomon, I. Bloch, and C. Gross, Phys. Rev. Lett. 115, 263001 (2015).
- Parsons et al. (2015) M. F. Parsons, F. Huber, A. Mazurenko, C. S. Chiu, W. Setiawan, K. Wooley-Brown, S. Blatt, and M. Greiner, Phys. Rev. Lett. 114, 213002 (2015).
- Cheuk et al. (2015) L. W. Cheuk, M. A. Nichols, M. Okan, T. Gersdorf, V. V. Ramasesh, W. S. Bakr, T. Lompe, and M. W. Zwierlein, Phys. Rev. Lett. 114, 193001 (2015).
- Yamamoto et al. (2016) R. Yamamoto, J. Kobayashi, T. Kuno, K. K., and Y. Takahashi, New J. Phys. 18, 023016 (2016).
- Fulde and Ferrell (1964) P. Fulde and R. A. Ferrell, Phys. Rev. 135, A550 (1964).
- Zürn et al. (2013) G. Zürn, T. Lompe, A. N. Wenz, S. Jochim, P. S. Julienne, and J. M. Hutson, Phys. Rev. Lett. 110, 135301 (2013).
- Mitra et al. (2016) D. Mitra, P. T. Brown, P. Schauß, S. S. Kondov, and W. S. Bakr, Phys. Rev. Lett. 117, 093601 (2016).
- Ho et al. (2009) A. F. Ho, M. A. Cazalilla, and T. Giamarchi, Phys. Rev. A 79, 033620 (2009).
- Varney et al. (2009) C. N. Varney, C.-R. Lee, Z. J. Bai, S. Chiesa, M. Jarrell, and R. T. Scalettar, Phys. Rev. B 80, 075116 (2009).
- Demler et al. (1996) E. Demler, S.-C. Zhang, N. Bulut, and D. J. Scalapino, Int. J. Mod. Phys. B 10, 2137 (1996).
- Moreo and Scalapino (2007) A. Moreo and D. J. Scalapino, Phys. Rev. Lett. 98, 216402 (2007).
- Loh and Trivedi (2010) Y. L. Loh and N. Trivedi, Phys. Rev. Lett. 104, 165302 (2010).
- Kim and Törmä (2012) D.-H. Kim and P. Törmä, Phys. Rev. B 85, 180508 (2012).
- Gukelberger et al. (2016) J. Gukelberger, S. Lienert, E. Kozik, L. Pollet, and M. Troyer, Phys. Rev. B 94, 075157 (2016).
- Mitra et al. (2016) D. Mitra, P. T. Brown, P. Schauß, S. S. Kondov, and W. S. Bakr, Phys. Rev. Lett. 117, 093601 (2016).
- Idziaszek and Calarco (2005) Z. Idziaszek and T. Calarco, Phys. Rev. A 71, 050701 (2005).
- Zhang (1990) S. Zhang, Phys. Rev. Lett. 65, 120 (1990).
- Ho et al. (2009) A. F. Ho, M. A. Cazalilla, and T. Giamarchi, Phys. Rev. A 79, 033620 (2009).
- Jürgensen et al. (2014) O. Jürgensen, F. Meinert, M. J. Mark, H.-C. Nägerl, and D.-S. Lühmann, Phys. Rev. Lett. 113, 193003 (2014).
- Varney et al. (2009) C. N. Varney, C.-R. Lee, Z. J. Bai, S. Chiesa, M. Jarrell, and R. T. Scalettar, Phys. Rev. B 80, 075116 (2009).
- Assmann et al. (2012) E. Assmann, S. Chiesa, G. G. Batrouni, H. G. Evertz, and R. T. Scalettar, Phys. Rev. B 85, 014509 (2012).
I Methods
Preparation of an attractive Fermi gas in an optical lattice The experimental setup is described in detail in the supplement of ref. Brown et al. (2016). We realize the Fermi-Hubbard model using a spin-balanced degenerate mixture of two Zeeman states ( and , numbered up from the lowest energy) in the ground state hyperfine manifold of 6Li in an optical lattice.
To create the sample we load a magneto-optical trap (MOT) from a Zeeman slower, then use a compressed MOT stage before loading into a deep optical trap and evaporating near the Feshbach resonance. For preparing a gas on the upper branch of the resonance, we stop the evaporation before Feshbach molecules form and transfer the atoms to a highly anisotropic ‘light sheet’ trap where the gas undergoes further evaporation to degeneracy at . At this field, the scattering length is . Next we transfer the gas into the final trapping geometry where a beam provides radial confinement and a accordion lattice with trapping frequency provides axial confinement (for further details see Mitra et al. (2016)). The spin populations are balanced to within . We then load the gas into a 2D square lattice with a long ramp to varying depths from .
For experiments on the lower branch of the resonance, we perform the entire evaporation at the Feshbach resonance. Three-body collisions lead to population of the molecular branch. Before loading into the lattice, the bias field is ramped to 907 G where the scattering length is -2800 .
Calibration of Hubbard parameters We use a non-separable 2D square lattice with a spacing formed by four interfering passes of a single vertically polarized beam Brown et al. (2016). We calibrate our lattice depth by measuring the frequencies of the three bands in a deep lattice using lattice depth modulation, and compare these with a 2D band structure calculation. The inferred depth of the lattice at which our measurements are performed is , where . From that we obtain nearest-neighbor tunneling values Hz, Hz (). The reduction of the lattice depth across the cloud due to the gaussian profile of the lattice beams leads to an increase in the tunneling by at the edge of the cloud compared to the central value. We also calculate a non-zero but negligible diagonal tunneling , due to the non-separability of the lattice.
We measure the interaction energy at the lattice loading field of 305 G using radio frequency spectroscopy. We transfer atoms from state to and resolve the frequency shift between singly and doubly occupied sites. We determine , where is the measured difference between the singles and doublon peaks and () is the scattering length at the spectroscopy field for a 1-3 (2-3) mixture. Taking into account a correction due to a significant final state interaction, we obtain kHz. The experimentally measured value agrees with the value determined from band structure calculations of 5.9(1) kHz including higher band corrections to within 10% Idziaszek and Calarco (2005).
Imaging of doublons In the usual scheme of Raman imaging, a singly occupied lattice site produces a fluorescence signal while atoms in a doubly occupied site are lost due to light-assisted collisions. To measure density correlations between doubly-occupied sites, we have developed a new detection scheme. After the gas is loaded adiabatically into the optical lattice, we pin the atoms by increasing the lattice depth to 55(1) in 100 where tunnelling dynamics get frozen. For gases on the upper branch, we adiabatically ramp the field to 594 G where we perform an interaction resolved Landau-Zener sweep (Fig. S1) to selectively transfer 1-3 doublons to 2-3 doublons while not effecting the singles. Finally we ramp to a field of 641 G where the 2-3 scattering length is 414 . We apply resonant pushing pulses of 30 durations to remove and atoms, leaving behind with only atoms on sites that originally had doublons. The large relative wavefunction of the atoms on a site due to repulsive interactions and a relatively weak vertical confinement significantly reduces the probability of light-assisted collisions during the resonant pulse. On the other hand, in order to get the singles images, we apply no RF or resonant pushing pulses.
For gases on the lower branch, after pinning the atoms, we ramp the field to 725 G where we perform a Landau-Zener sweep on an interaction-resolved transition to the 2-3 upper branch. In order to convert the 2-3 doubles to -singles with high efficiency, we ramp to 641 G where we apply the resonant pulses to remove and atoms. This ramp is done quickly (within 800 ) to avoid atom losses due to the crossing of a narrow 2-3 Feshbach resonance around 714 G.
We image the final atom distribution by increasing the lattice depth to 2500 within s, ramping up the light sheet to provide axial confinement, and then collecting fluorescence photons during Raman cooling.
To measure the efficiency of imaging doublons, we prepare a band insulator where the filling in the trap center is saturated at two atoms per site. We perform the above-mentioned process to image only the doublons. We measure a combined fidelity (including RF-transfer efficiency and pushing efficiency) of of imaging doublons, leading to an underestimation of our doublon-doublon correlator by which we correct for. We have also performed the same detection procedure on a Mott insulator, where we expect unit occupancy on the lattice sites. This allows us to extract the probability that a single atom in state would get transferred to and give a false positive signal of the presence of a doublon. We measure the probability of this process to be only 2.3(3).
Raman imaging and reconstruction We perform Raman imaging for and collect approximately photons per atom. For more details, see Brown et al. (2016). We estimate fidelity errors due to Raman imaging imperfections by taking 40 consecutive images of the same atom cloud and determine the shot-to-shot differences. This leads to a hopping rate during one picture of and a loss rate of . In addition, while holding the atoms in a deep lattice for doublon detection, we lose of the atoms, leading to a net detection efficiency of . The densities that we obtain are corrected for the above detection efficiency.
Lower bound on superfluid correlations The full Hubbard Hamiltonian can be written as
| (S1) |
where is the creation operator for a fermion with spin on site r, , is the matrix element for tunneling between lattice sites, is the strength of the on-site interaction ( for the attractive model), is a spin-independent chemical potential and is an effective Zeeman field in the presence of spin-imbalance. For the purpose of this paper, , since we only work with a spin-balanced system. Consider first the SU(2) spin symmetry of the problem for . The vector spin operator on site is given by . In terms of fermionic creation and annihilation operators, the generators of spin rotations are
| (S2) |
These operators obey the usual commutation relations
| (S3) |
In the absence of an effective Zeeman field, the operators and satisfy
| (S4) |
implying the SU(2) spin-symmetry of the Hubbard model. In other words, the Hamiltonian is invariant under a global rotation of the spin degree of freedom. To demonstrate the other “hidden” symmetry of the Hubbard model, we define a new set of generators for rotations of the “pseudo-spin” on a site given by
| (S5) |
It can be easily verified Zhang (1990) that they obey the following commutation relations
| (S6) |
The operators and satisfy
| (S7) |
regardless of the sign of the interaction . Exactly at half-filling, and all the pseudospin generators in Eq. S7 commute with similar to the spin generators in Eq. S4, meaning that the Hamiltonian is invariant under global rotations of the pseudo-spin.
The pseudo-spin on a site can be visualized on the Bloch sphere like a regular spin. If it points up (down) the site contains a doublon (hole), while if it lies in the equatorial plane, the site contains an equal superposition of a doublon and hole with a complex relative phase determined by the azimuthal angle. In the limit of large attractive interactions, the spin-balanced Hubbard Hamiltonian can be approximated as a Heisenberg Hamiltonian with antiferromagnetic interactions between the pseudo-spins, leading to charge-density-wave and superfluid correlations corresponding to and antiferromagnetic pseudo-spin correlations respectively. At half-filling, the pseudo-spin rotational symmetry implies
| (S8) |
where . Defining the s-wave pairing operator in the direction as
| (S9) |
one concludes that the density correlations and pairing correlations are equal in magnitude at half-filling.
Deviation from half-filling introduces an effective Zeeman field along that couples to the pseudo-spin. This leads to canted antiferromagnetic pseudo-spin correlations, with stronger correlations in the direction orthogonal to the field, i.e. the superfluid correlations become stronger than the density correlations. Therefore, measurement of charge-density-wave density correlations in the attractive Hubbard model provides a lower bound on the superfluid correlations at any filling. In our experiment we measure a more accessible quantity, the doublon correlator . The doublon and density correlators become equal in the limit of low temperatures and large interactions. However, the doublon correlator still provides a bound on the superfluid correlator as we have verified numerically for the entire range of interactions, temperatures and fillings studied in the experiment (Fig. S2).
Relationship to earlier work on repulsive spin-imbalanced Hubbard systems On a bipartite lattice, one can define a particle-hole transformation given by following mapping of the annihilation operators
| (S10) |
Under this transformation, and and the Hubbard Hamiltonian (S1) transforms to (up to a constant energy offset)
| (S11) |
where, and . In addition, the pseudo-spin rotation generators map on to the regular spin rotation generators under this transformation
| (S12) |
In other words, this transformation provides a mapping between the attractive and the repulsive Hubbard models, with the roles of doping and spin-imbalance interchanged Ho et al. (2009). The doped attractive Hubbard system studied in this work maps onto a spin-imbalanced repulsive Hubbard system. Therefore, the -spin correlations measured in our previous work Brown et al. (2016) are closely related to the CDW correlations measured in this work.
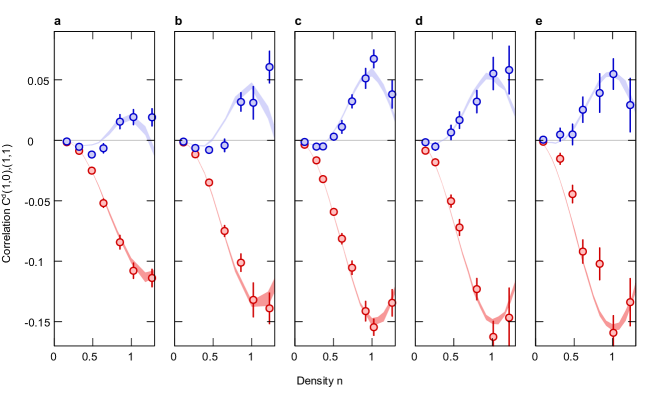
Dependence of CDW correlations on the interactions We studied the dependence of the CDW correlations on . The system was prepared on the upper branch at a scattering length of and was varied by changing the lattice depth. Fig. S3 shows the nearest-neighbor and next-nearest-neighbor correlator vs. density for different lattice depths. The data is compared to DQMC results with and used as fit parameters. A slight increase in the temperature is observed for larger lattice depths. The measured correlations initially increase as the lattice depth is increased, but do not show significant variation for lattice depths between and . At larger depths, it is experimentally difficult to obtain a half-filling condition near the center of the trap because of the increasing radial confinement from the lattice beams.
Corrections to the Hubbard model We investigated the importance of corrections to the Hubbard model in our analysis of the experimental data. For this purpose, two effects were taken into account:
-
•
Effects of next-nearest-neighbor tunneling From a tight-binding calculation, we obtain for a lattice depth of (used for upper branch experiments) tunnel couplings and , where is the tunneling matrix element to the (1,1) and (2,0) neighboring site, respectively. We studied the effect of including these terms in the Hamiltonian on the CDW correlations (Fig. S4) and found it to be negligible within our experimental errors.
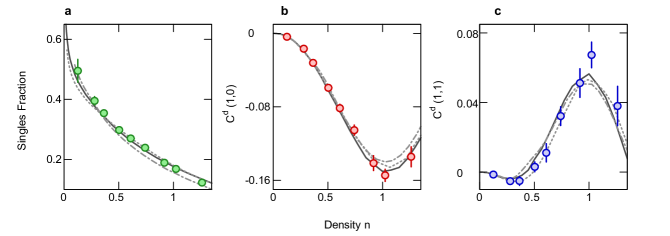
Figure S4: Corrections to the Hubbard Model Numerical study of effect of corrections to the Hubbard model. a. Experimental singles fraction (green circles) as a function of filling for a 6.2(2) lattice. b. Experimental nearest neighbor doublon-doublon correlator (red circles) versus filling. c. Experimental next-nearest neighbor doublon-doublon correlator (blue circles) versus filling. In all of the above, black line represents DQMC Hubbard model simulation results for and . Gray dotted line represents DQMC simulation results for the above and but including longer-range tunneling terms with and . Gray dashed line represents NLCE simulation results with density-dependent hopping at the same and for . -
•
Density-dependent tunneling The simple Hubbard model we use in this paper assumes that the tunneling matrix element for an atom is independent of the occupancy of the site it is tunneling to. This approximation starts to break down as the scattering length becomes large, and it may be expected that this effect is important in our system since most of the atoms are in pairs. The density-dependent hopping can be expressed in a tight-binding model as Jürgensen et al. (2014)
(S13) where is the Wannier function of an atom on a site and d is the displacement vector to a neighboring site. For the upper branch experiments, and for the lower branch experiments . To study the effect of the density-dependent tunneling on the measured CDW correlations and singles fraction, we performed Numerical Linked Cluster Expansion (NLCE) simulations where the tunneling was replaced by , where if =, = and vice versa. In other words, the tunneling of a spin from site r to depends on the total density of the opposite spin at the two sites between which the tunneling process is taking place. The strongest effect was about on the singles fraction and that would change the fit value of the data in Fig. 4b,c to and . Both this value of and the one obtained without corrections to the Hubbard model fall within our experimental uncertainties.
Determinantal Quantum Monte Carlo calculations The DQMC simulations shown in the paper were all performed using a Fortran 90/95 package called QUantum Electron Simulation Toolbox (QUEST) developed and maintained by R. T. Scalettar et. al. Varney et al. (2009). For a spin-balanced system with attractive interactions () the calculations do not suffer from a fermion sign problem.
Simulations for Fig. 2 and Fig. 3 of the main text were performed on a square lattice of 88 sites with and a chemical potential () varying from -3 to 1.5 with representing half filling. The inverse temperature was split into imaginary time slices, with an interval . To obtain higher statistics, the simulations were run over 100,000 passes. For Fig. 4 of the main text, was fixed at -5.7 and to zero. The temperature was scanned by varying from 0.0046 to 0.083 for a fixed and each point was averaged over 100,000 passes.
The DQMC simulations in the paper are performed using homogeneous systems. We rely on the local density approximation (LDA) for comparison to the experiment where the density varies slowly due to the harmonic trapping potential. For data shown in Fig. S3, the density gradient at varied from 0.07 atoms/(site)2 for a depth of to 0.14 atoms/(site)2 for a depth of . To verify that the LDA holds for our system, we have performed DQMC simulations in the presence of a linearly varying chemical potential along one direction of the 2D Hubbard lattice to reproduce the maximal density gradients observed in the experiment. The results of this calculation showed that the LDA holds to excellent approximation for our experimental parameters. However, we note that violation of the LDA had been predicted for such a system at much lower temperatures and higher gradients Assmann et al. (2012).