Spread of the dust temperature distribution in circumstellar disks
Abstract
Context. Accurate temperature calculations for circumstellar disks are particularly important for their chemical evolution. Their temperature distribution is determined by the optical properties of the dust grains, which, among other parameters, depend on their radius. However, in most disk studies, only average optical properties and thus an average temperature is assumed to account for an ensemble of grains with different radii.
Aims. We investigate the impact of subdividing the grain radius distribution into multiple sub-intervals on the resulting dust temperature distribution and spectral energy distribution (SED).
Methods. The temperature distribution, the relative grain surface below a certain temperature, the freeze-out radius, and the SED were computed for two different scenarios: (1) Radius distribution represented by 16 logarithmically distributed radius intervals, and (2) radius distribution represented by a single grain species with averaged optical properties (reference).
Results. Within the considered parameter range, i.e., of grain radii between and and an optically thin and thick disk with a parameterized density distribution, we obtain the following results: In optically thin disk regions, the temperature spread can be as large as and the relative grain surface below a certain temperature is lower than in the reference disk. With increasing optical depth, the difference in the midplane temperature and the relative grain surface below a certain temperature decreases. Furthermore, below , this fraction is higher for the reference disk than for the case of multiple grain radii, while it shows the opposite behavior for temperatures above this threshold.
The thermal emission in the case of multiple grain radii at short wavelengths is stronger than for the reference disk. The freeze-out radius (snowline) is a function of grain radius, spanning a radial range between the coldest and warmest grain species of .
1 Introduction
The dust phase of the interstellar matter (ISM) shows a broad range of grains with different radii. In circumstellar disks around young stellar objects, which form during the collapse of the densest parts of the ISM, this dust phase is modified by various processes (Gräfe et al. 2013); this results in a potentially even larger spread of grain radii, which is due to the process of dust grain growth. Even though the dust amounts to only of the disk mass, it dominates the extinction of the disk. Consequently, understanding its properties including the impact of the existence of grains with various radii is fundamental for understanding circumstellar disk physics.
Constraints on the properties of the dust phase can be derived from multiwavelength observations of circumstellar disks and subsequent radiative transfer modeling (e.g., Madlener et al. 2012; Gräfe et al. 2013). Because of computational constraints, usually only a single dust phase is assumed that represents average optical properties, resulting in an average dust temperature. Whether this simplification is justified was first investigated by Wolf (2003). It was found that the temperature dispersion at the inner boundary of a dust shell can amount to and has to be considered in, for example, chemical networks. However, in the same study the difference between SEDs based on a real dust grain distribution and mean dust grain parameters was found to be below 10 % if radius bins are considered. Since this early study the level of constraints provided by disk observations has increased significantly over the past decade. As the accuracy of the observations increases, the demand in accuracy of the numerical models increases as well. Also, because the computing power has increased, a more correct treatment of the grain radius distribution becomes feasible.
The aim of our study is to assess the effects of a correct treatment of the grain radius distribution. This study is motivated by the fact that an accurate calculation of dust and gas temperatures is of particular importance for the astrochemical evolution of circumstellar disks. For example, below , CO freezes out, water below (Öberg et al. 2010). Chapillon et al. (2008) suggested that in the CQ Tau disk, where an important depletion of CO is observed despite a warm temperature, CO may remain trapped onto large grains that are cold enough to prevent thermal CO desorption. When CO is frozen out, deuterium fractionation is very efficient (Punanova et al. 2015) and the depletion of CO and similar molecules affect the cooling and therefore the evolution of star-forming clouds (Hocuk et al. 2016). Likewise, the dominant carbon bearing entity depends on the temperature structure and age of the disk. According to Reboussin et al. (2015), CO trapped on grain surfaces is the most abundant C-bearing species between and .
Furthermore, Guilloteau et al. (2016) proposed the difference in temperature between larger and smaller grains as a possible explanation for the low dust temperature of the Flying saucer, derived from measurements of the velocity gradients due to Keplerian rotation and variations in the CO background as a function of velocity.
Using a dust distribution consisting of astronomical silicate and graphite, the difference between a more precise treatment of the grain radius distribution, considering individual grains of different radii, taking their relative abundances into account, and using average optical properties for the whole radius range is assessed for the following quantities: (1) The spatial temperature distribution, (2) the relative dust grain surface below a certain temperature, (3) the freeze-out radius and (4) the spectral energy distribution (SED).
In , we briefly introduce the applied radiative transfer (RT) code, the disk model, and dust grain model. In , we discuss the results for an optically thin disk. Subsequently, we extend the discussions to the peculiarities of disks with an optically thick midplane (). In 3.3, we discuss the influence of more realistic disk masses, an inner cavity (3.4), and having larger disks (3.5). Finally, we apply our results to the special case of the Flying Saucer in 3.6.
2 Setup
In this section, we briefly describe the applied Monte Carlo (MC) radiative transfer code and the disk model.
2.1 Monte Carlo radiative transfer code and disk setup
The simulations presented in this article are performed with the 3D dust radiative transfer code Mol3D (Ober et al. 2015). This program calculates the dust temperature based on the assumption of local thermal equilibrium. The calculation of the spatial dust temperature distribution combines the continuous absorption method proposed by Lucy (1999) and immediate temperature correction by Bjorkman & Wood (2001).
We apply a parameterized density distribution according to Shakura & Sunyaev (1973), successfully used in earlier studies of young circumstellar disks (e.g., Wolf et al. 2003; Madlener et al. 2012; Gräfe et al. 2013) as follows:
| (1) | |||
| (2) |
, and . The condition of hydrostatic equilibrium is not considered in this approach. For the inner and outer radius, we use and , respectively. We set the inner radius () outside the dust sublimation radius mainly because the dust sublimation radius depends on the dust grain radius. Thus, calculate the dust sublimation radius self-consistently would require an iterative approach. Furthermore, a grain-radius dependent sublimation radius would unnecessarily complicate the comparison with the reference disk.
For the dust mass, we assess two extreme cases: An optically thin disk, which is optically thin even for the shortest wavelength, and a disk with an optically thick midplane, where the midplane is optically thick even for the longest wavelength of our calculations. In the optically thin case, the mass is irrelevant as long as the optical depth for the shortest wavelength is much smaller than 0.1. For the optically thick case, we use a dust mass of . Together with the gas, the total mass of the disk amounts to . As the central radiation source we use a T Tauri star with , and . To calculate the observational quantities, we assume a distance of and a disk inclination of .
2.2 Dust
The dust in our model consists of a homogeneous mixture of graphite and astronomical silicate adapted from Weingartner & Draine (2001). The dust mixture has a density of and consists of silicate and graphite. Because of the anisotropic optical properties of graphite, we use the - approximation by Draine & Malhotra (1993), where the extinction coefficient is calculated as follows:
| (3) |
We apply a grain radius distribution following with a lower and upper grain radius of and , respectively. The lower limit is motivated by the constraints derived for the dust in the ISM (Mathis et al. 1977), which is also consistent with the analysis of dust in protoplanetary disks. The upper limit is consistent with the evidence of grains of millimeter-to-centimeter radii in the inner dense regions of these disks (e.g., Gräfe et al. 2013). This range of radii is subdivided into 16 logarithmically distributed intervals. In each of these intervals weighted mean dust grain parameters are computed (for the procedure see below). A list of the intervals is shown in Tab. 2. This dust setup is referred to as MGS (multiple grain size) in the following.
As reference, we compute the weighted mean dust grain parameters taking the optical properties of the entire range of grain radii into account. The weighted mean values are derived as follows (Martin 1978; S̆olc 1980):
| (4) | ||||
| (5) | ||||
| (6) | ||||
| (7) |
where is the weight of the th component of the dust grain mixture, is the number of dust species, and and are the absorption and extinction cross sections. Furthermore, is the Mueller matrix, which is used to describe the modification of the Stokes vector of the photon due to the interaction of a photon with the absorbing and scattering medium. The weight of each component results from its abundance with respect to its dust grain number density and the radius distribution of the respective material (Wolf 2003),
| (8) |
2.3 Absorption cross section
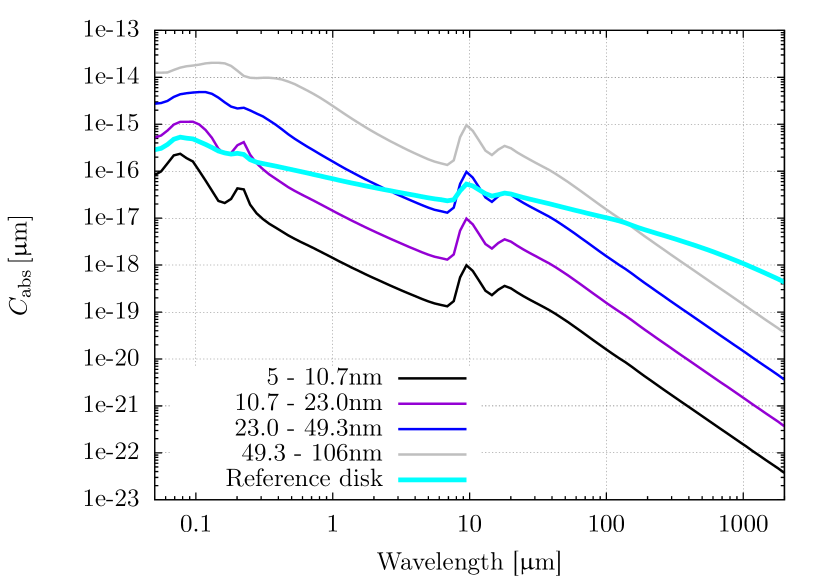
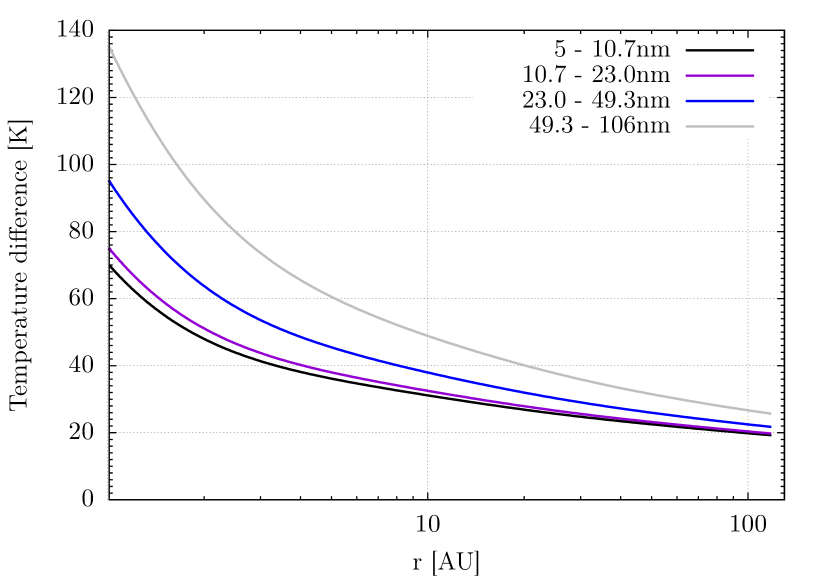
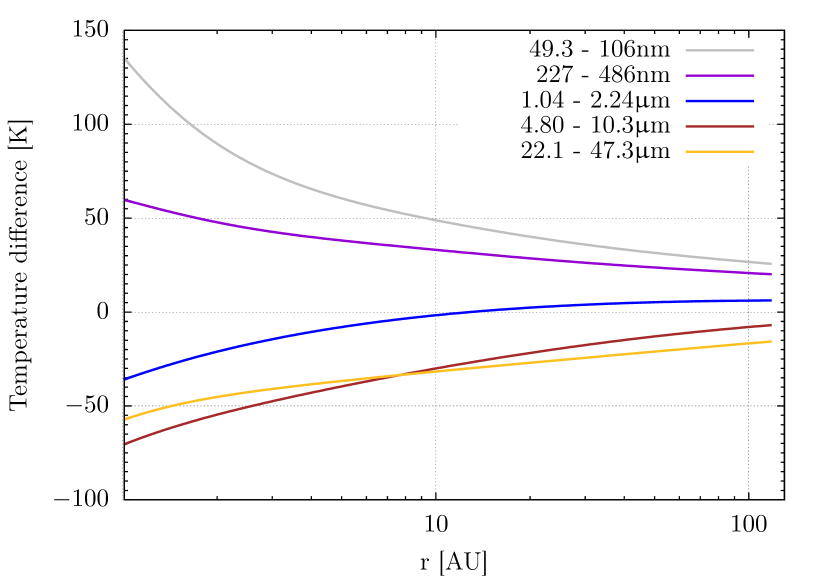
The temperature distribution of the grains depends on their absorption cross sections. The star emits its maximum radiation at , while the grains radiate between and , derived using Wien’s displacement law from the calculated temperatures ( to ). Thus, a large absorption cross section around increases the efficiency of heating of the grains, while a large absorption cross section between and increases the efficiency of cooling. In the following, the expected temperature differences for grains in different radius bins are discussed in more detail:
-
•
The absorption cross sections for small grains ( to ) increase faster for shorter than for longer wavelengths (see Fig. 1, top). Consequently, the grain temperature should increase with increasing grain radius.
-
•
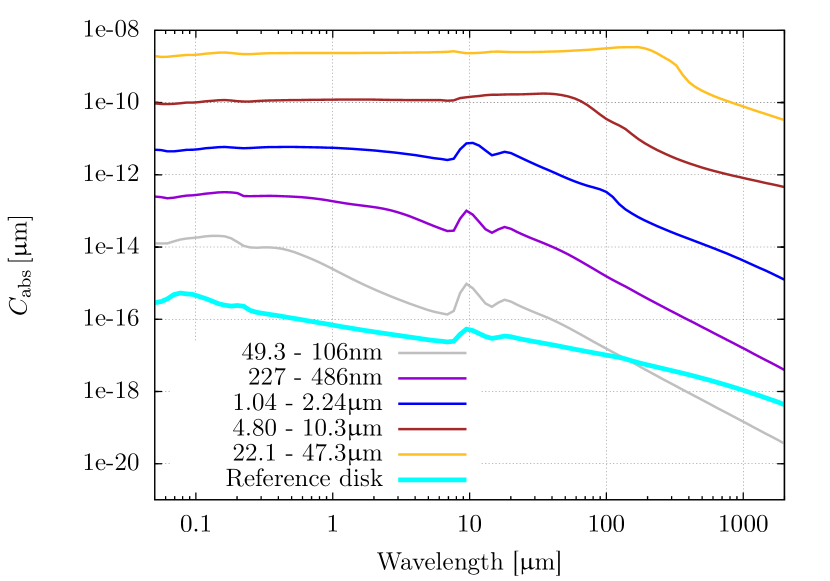
The absorption cross sections for intermediate sized grains ( to ) are shown in Fig. 1, middle. The difference in the cross sections for short and long wavelengths decreases. Consequently, the grain temperature should decrease with increasing grain radius. However, for the grain species with radii between and , the absorption cross section has a maximum between and , which does not exist for larger grains. Thus, for grain temperatures between and , the grain species with radii between and has the most efficient cooling.
-
•
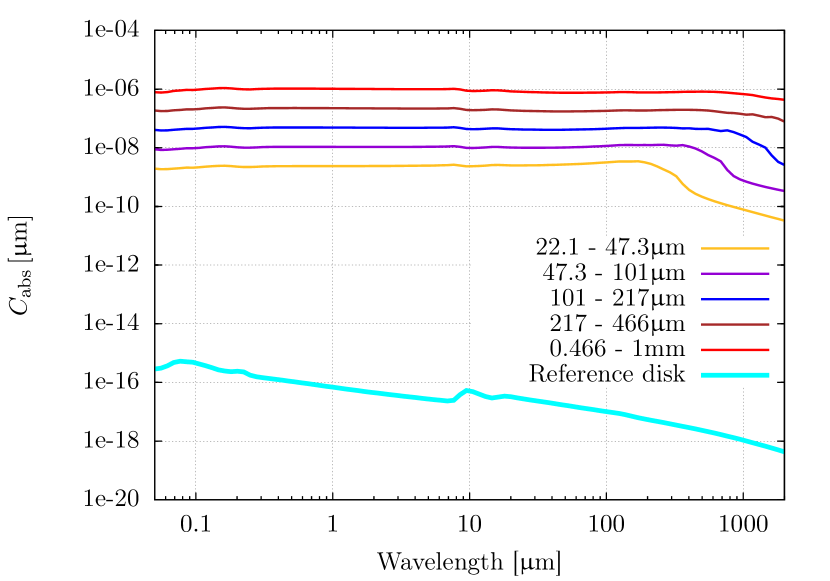
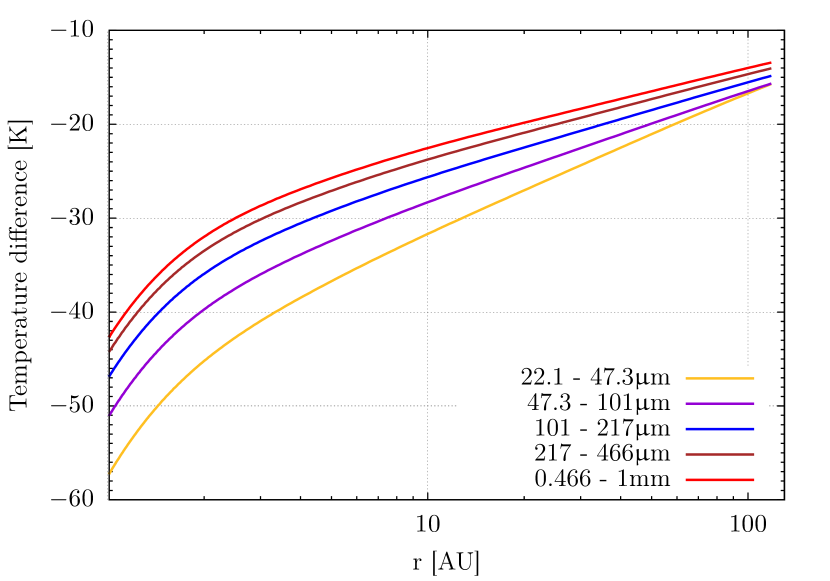
The absorption cross sections for the largest grains ( to ) slightly increase with wavelengths for grains with radii between and (see Fig. 1, bottom). For larger grains, this increase becomes weaker and changes into a decrease for grains larger than . Thus, the grain temperature should increase again with increasing grain radius.
For comparison, the absorption cross section of the reference grains is shown in the same figures.
3 Results
Because of the wide range of optical depths and different heating processes involved, such as direct stellar radiation, scattered light, and thermal re-emitted radiation, the temperature structure in protoplanetary disks shows a complex structure. In , we present results for an optically thin disk, which are applicable for the upper layers of protoplanetary disks, while the results for a disk with an optically thick midplane () are applicable in the midplane of these disks. In to we extend our study to more realistic disks with different masses, inner cavities of different sizes and various outer radii. In , we apply the MGS grain radius distribution to the special case of the Flying Saucer.
3.1 Optically thin case
In this case, all dust grains are directly heated by the central star. The contribution by scattered and re-emitted radiation on the spatial dust temperature distribution is negligible.
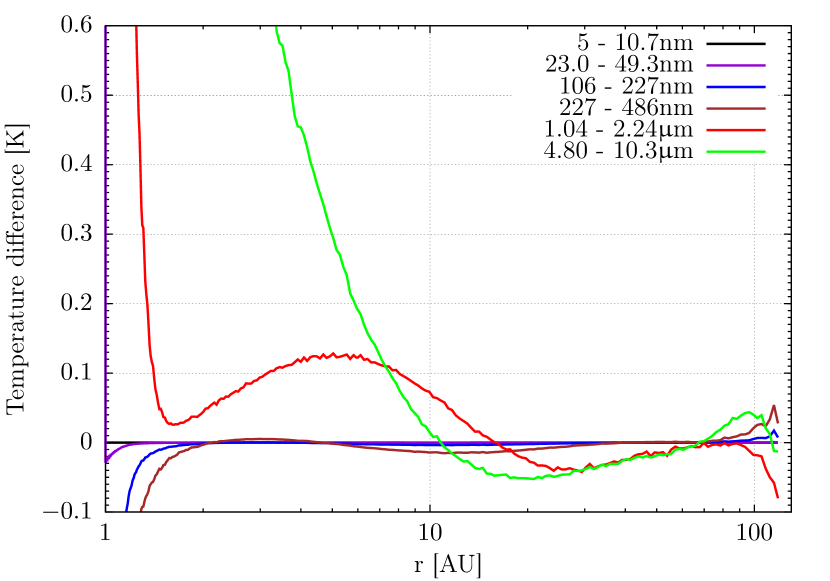
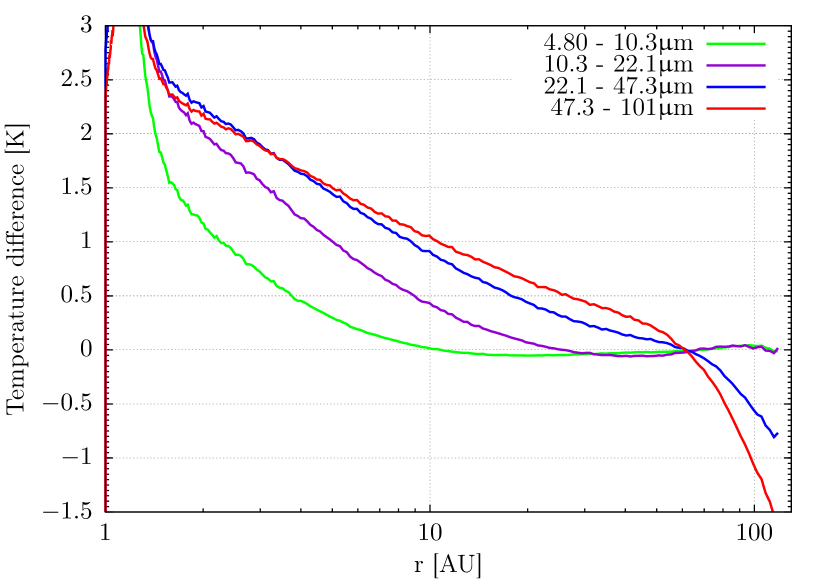
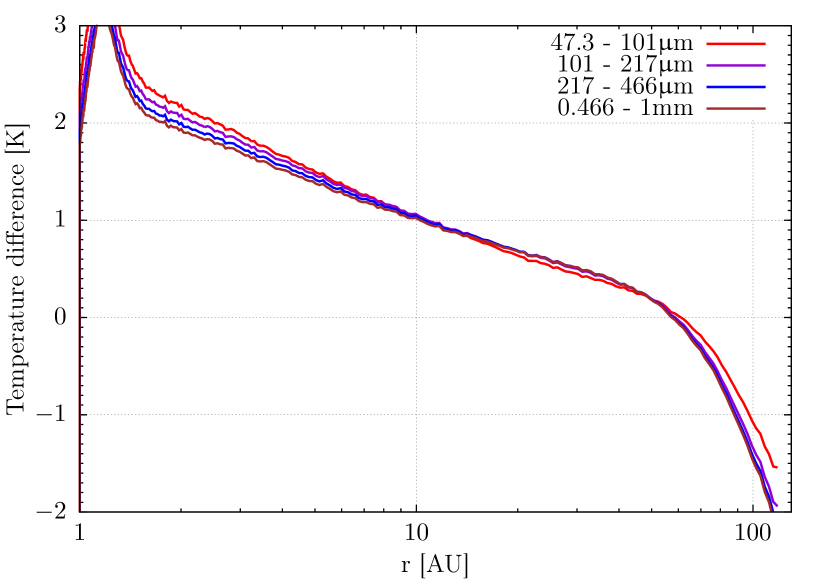
3.1.1 Temperature distribution
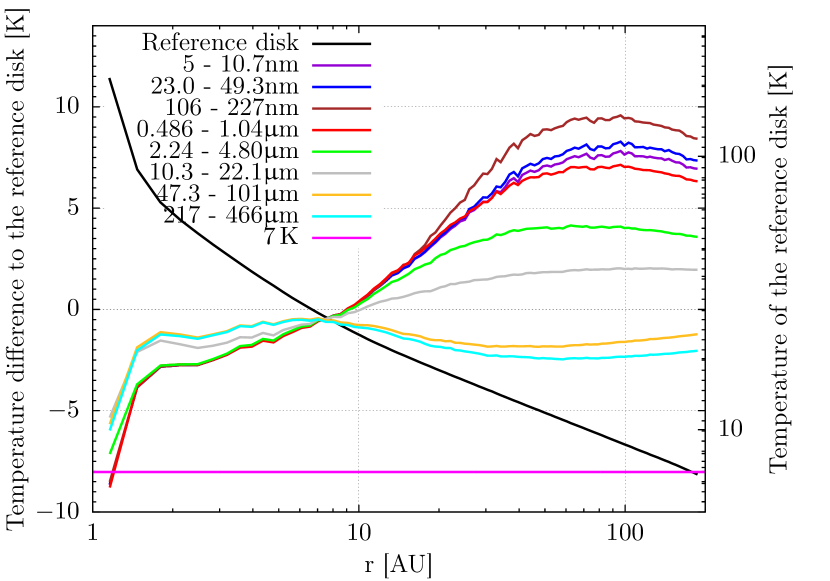
Here, we investigate the temperature distribution to see if the predictions based on the absorption cross sections hold (see Fig. 2). To study the details of the spread, the differences from the reference disk are shown in Fig. 3. The differences between grains of different radii reach values of up to , which correspond to of the temperature value of the hottest grains. For lower temperatures further away from the star, the differences can even reach of the temperature value of the hottest grains.
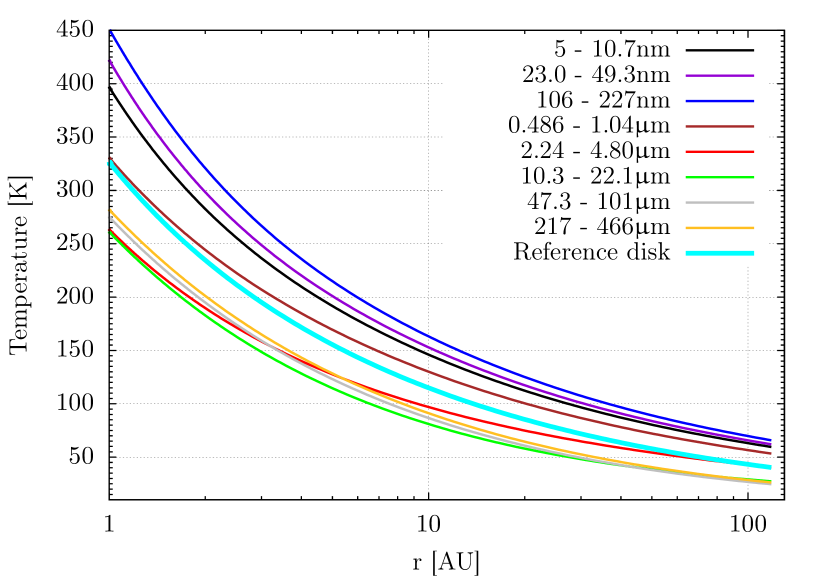
The temperature first increases with increasing grain radii up to a radius of , then decreases with further increasing radii up to a radius between and before the temperature increases again. This behavior is directly related to the wavelength dependence of the absorption cross sections shown in Fig. 1.
3.1.2 Grain surface
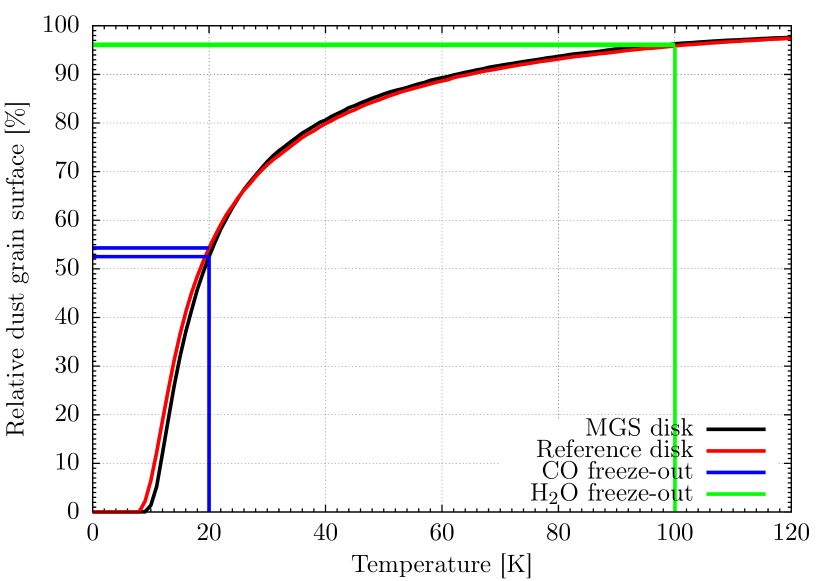
Besides the temperature, the net surface of the dust grains is an important quantity that determines the rate of chemical reactions. For this reason, the relative dust grain surface below a certain temperature is now compared to the results for the reference disk (Fig. 4).
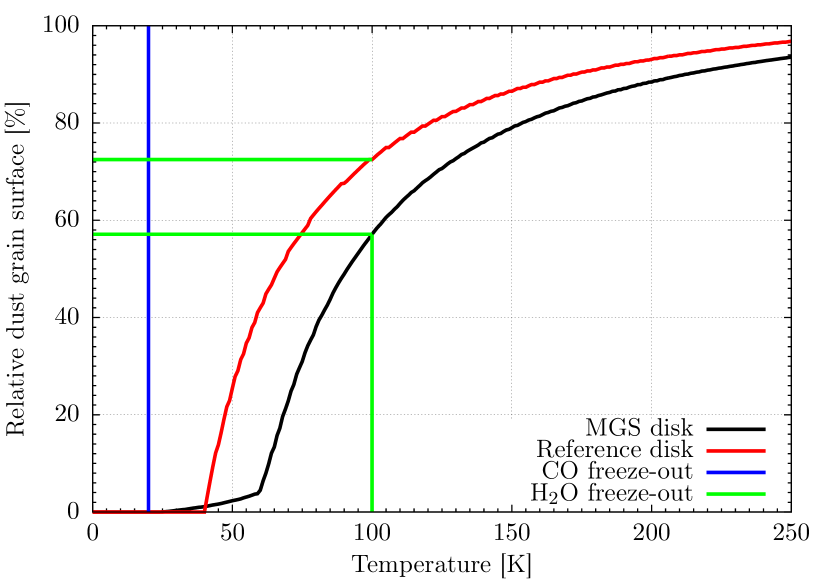
We find that this surface fraction grows faster for the reference disk than it does for the MGS disk. However, because the grains with radii larger than have temperatures between and at the outer parts of the disk, there is dust grain surface available below for the MGS disk. As the large dust grains do not contribute significantly to the total dust grain surface and as the small dust grains have higher temperatures (over for grains with radii below ), the relative dust grain surface begins to grow fast only above these higher temperatures.
For the reference disk, the relative dust grain surface below (freeze-out temperature of water; Öberg et al. 2010) amounts to , while it only amounts to for the MGS disk, and the relative dust grain surface between and amounts to for the MGS disk and for the reference disk. Therefore, the relative fraction of dust grain surface below a certain temperature (and thus available for certain reactions) is significantly lower in the case of a correct treatment of the distribution of grain radii and calculation of the corresponding temperature distribution.

Bottom: Relative dust grain surface below the freeze-out temperature of water as a function of radial distance from the star in the optically thin case. For details, see Sect. 3.1.2.
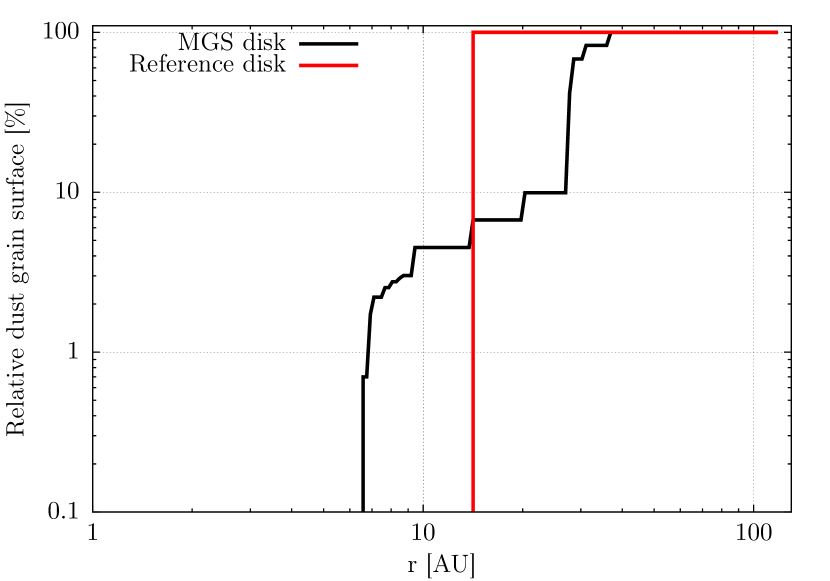
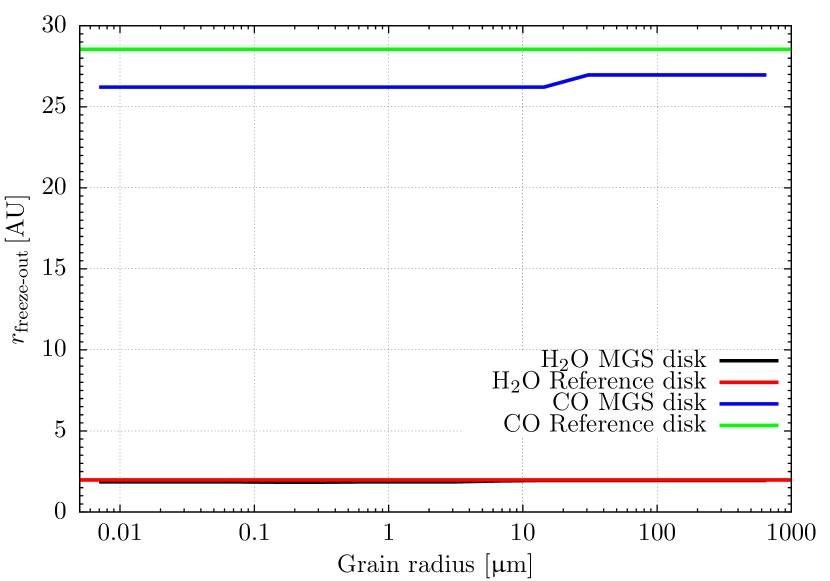
A different perspective on this problem is to investigate the radial distance from the star, outside of which all grains of a certain radius have temperatures below the freeze-out temperature of a given volatile species, the so-called freeze-out radius . In Fig. 5, top this quantity is shown for the case of water. It first grows with increasing grain radius up to a grain radius of , then decreases but increases again for grains above . This behavior is directly related to the temperatures of the different dust grains (see Fig. 2) where the temperature first grows up to a grain radius of , but decreases to a grain radius between and , before the temperature increases again.
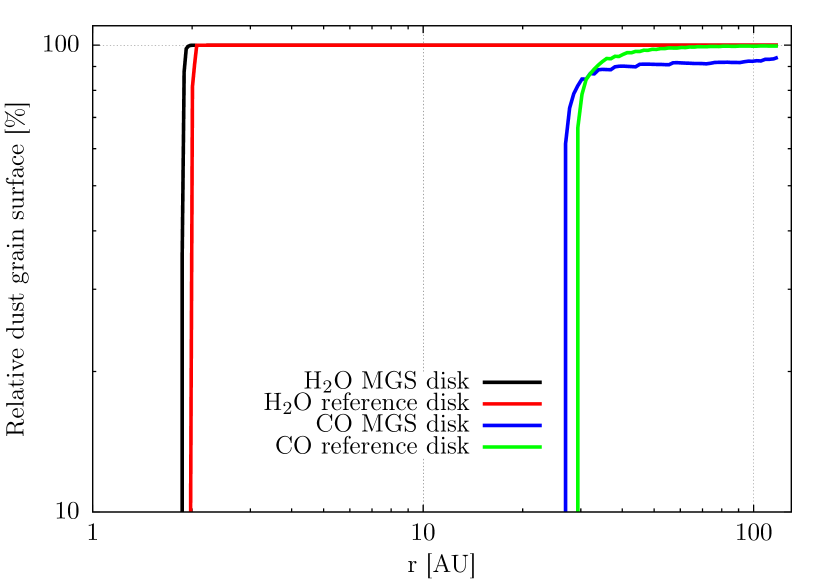
An associated quantity is the relative dust grain surface with a temperature below or equal to the freeze-out temperature for all grains at a given radial distance from the star (see Fig. 5, bottom). Here again, only the fraction below the freeze-out temperature of water is shown as there are no grains with temperatures below the freeze-out of CO. The result indicates that for the reference disk, the dust has a temperature below outside of , while for the MGS disk the transition is a bit smoother because the grains with different radii have different temperatures. However, owing to the low optical depth, all grains in a certain radius bin and at a certain distance from the star have the same temperature. Thus, the freeze-out on all of them happens at the same distance, resulting in the various steps of this graph.
3.1.3 Thermal emission of the disk
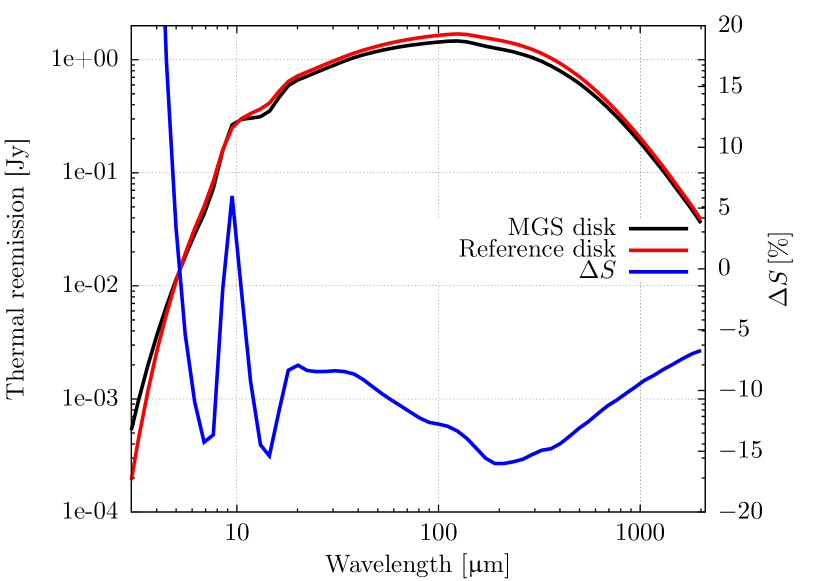
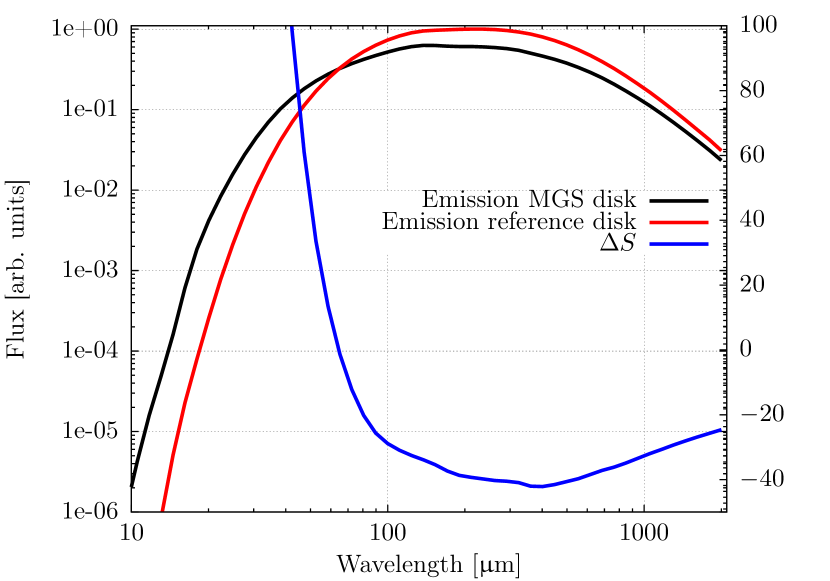
We now discuss whether there is a significant difference in the SED that would have an impact on the analysis of disk observations. For this purpose, the thermal emission of the disk is shown in Fig. 6, together with the relative difference between the cases of the MGS disk and the reference disk
| (9) |
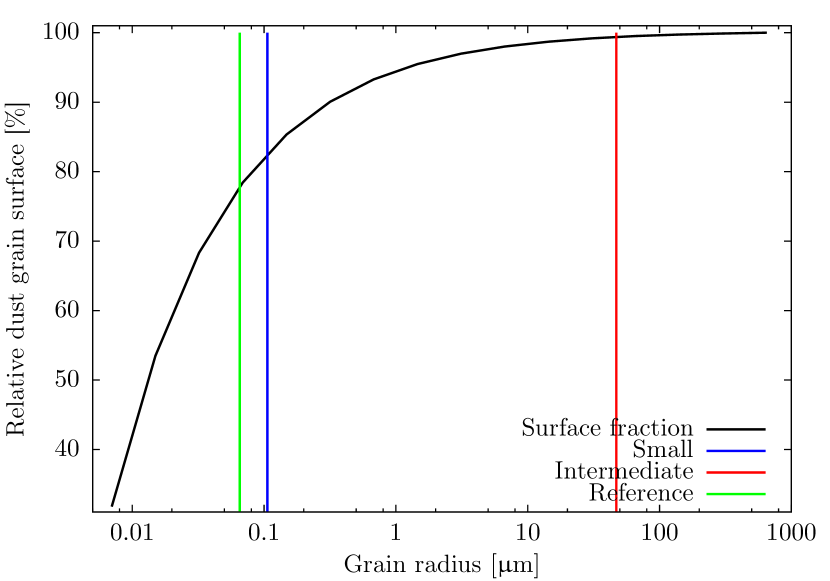
The radiation of the MGS disk is found to be stronger at short wavelengths () because of the influence of the small grains, which contribute most to the grain surface, radiate efficiently at short wavelengths, and are warmer than the average grains in the reference disk. To illustrate the contribution of the different grains to the total dust grain surface, the relative dust grain surface below a certain grain radius is shown in Fig. 7. In the MGS disk, dust grains smaller than the average grains in the reference account for more than of the total dust grain surface.
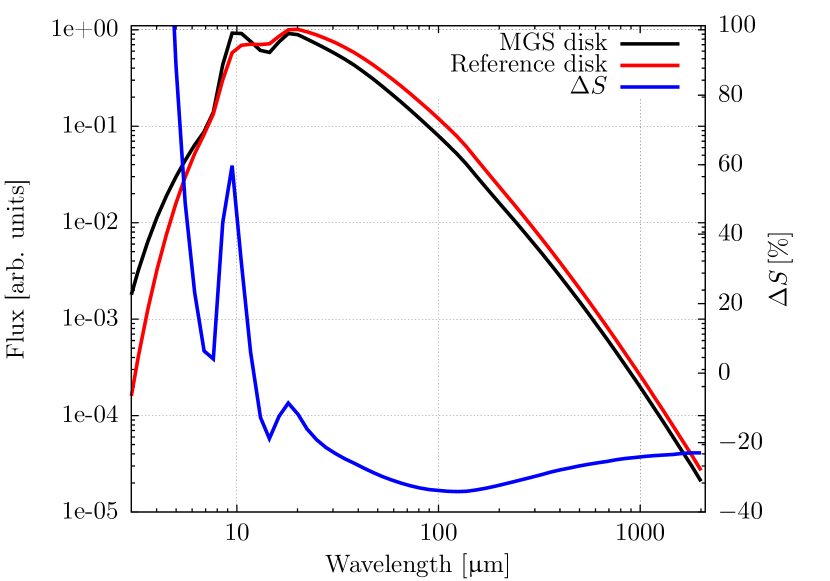
However, the relative difference has a local minimum at wavelengths of , afterward the relative difference decreases again. This is because the absorption cross section of the average grains also decreases with longer wavelengths. Thus, the influence of the large grains, which also have a high absorption cross section at long wavelengths, but a small abundance, reduces the relative difference again. The feature around is caused by the silicate emission, which is more pronounced in the thermal emission of the MGS disk. Thus, the wavelength dependency of the thermal emission at long wavelengths is affected. Therefore, using a more correct grain radius distribution also affects the dust emissivity index.
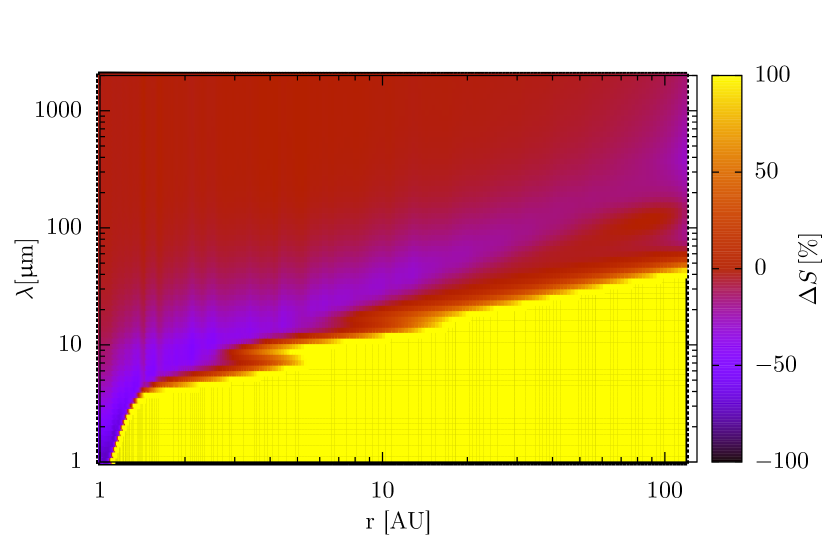
To further assess the differences in the thermal emission, its relative difference between the MGS disk and reference disk is computed spatially resolved throughout the disk. For this purpose, we compute the flux as a function of the radial distance to the central star. Here, is the radial distance, is the Planck function, is the absorption efficiency, and is the total surface of all grains with radius in the considered volume. The radially resolved relative difference between the thermal emission of the MGS disk and the reference disk is shown in Fig. 8.
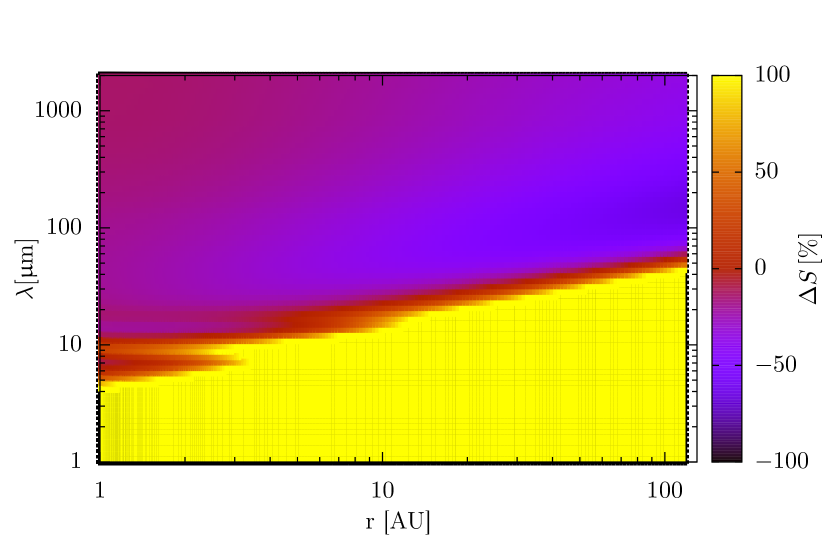
The results are similar to those presented in Fig. 6, but the position of the minimum of the relative difference depends on the radial distance and therefore on the temperature of the grains. For cooler grains further out, this minimum is shifted toward longer wavelengths and getting steeper. This is caused by the increasing relative temperature spread toward the outer edge.
3.2 Optically thick case
While the above results (Sects. 3.1.1 to 3.1.3) are applicable to the upper, optically thin layers of protoplanetary disks, the inner dust-depleted regions of transition disks as well as debris disks, we now explore the effect of an increase of the optical depth. Scattering and re-emission (see Sect. 3.2.4) and also shielding of the midplane by dust above the midplane are essential in this case. Furthermore, owing to the resulting better thermal coupling, the temperature spread is much smaller.
3.2.1 Midplane temperature distribution
Both the temperature further away from the star and the temperature spread are much smaller than in the optically thin disk (maximum temperature spread ). Close to the star (within a radial distance of ), the midplane temperature is increased by the back warming of the dust in the inner disk regions. This back warming happens at longer wavelengths than the heating by the star, for which the heating of the large grains is more efficient than for the smaller grains. This leads to a partly reversed order of radial temperature profiles.
Because of the small temperature spread, the difference in the temperature distribution from the smallest dust grains rather than the difference from the reference disk is drawn in Fig. 9.
Here, the temperature first decreases with increasing grain radii up to a radius between and . Then, the temperature increases with increasing grain radii up to a radius between and before the temperature decreases again.
3.2.2 Vertical temperature structure
In the upper layers of the disk, the optical depth is much smaller than in the midplane. Consequently, the temperature distribution should be similar to the optically thin case. To verify this assumption, the temperature distribution in z-direction, from the star, is drawn in Fig. 10.
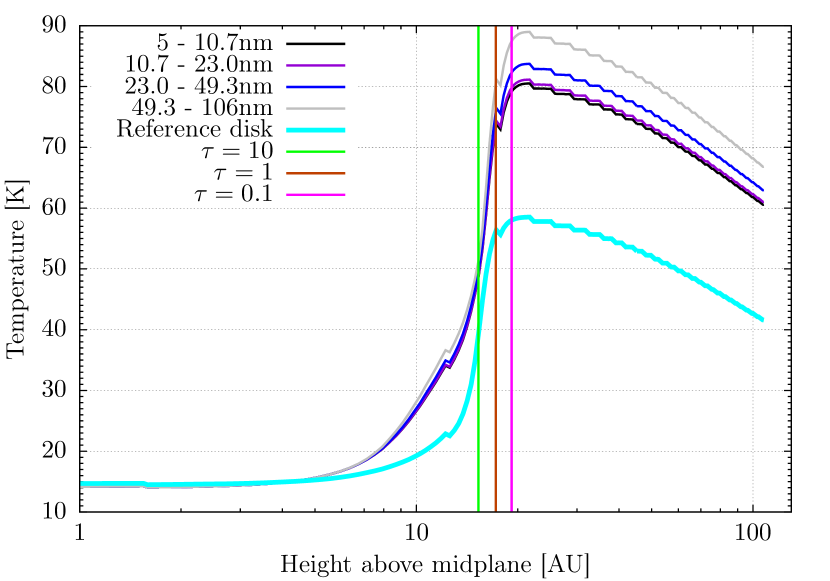
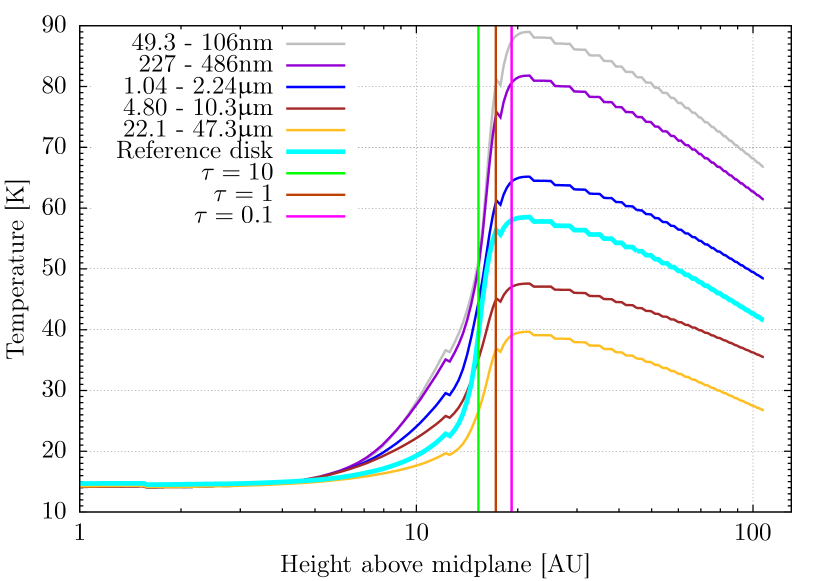
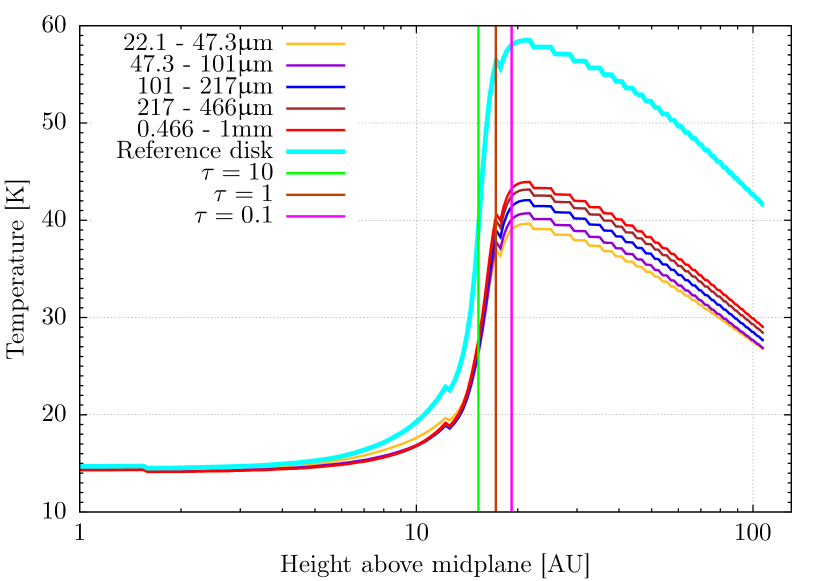
Above the plane, the temperature first increases up to a grain radius of , then it decreases with increasing grain radii up to a radius of before the temperature increases again. The spread reaches of the temperature value of the hottest grains, so it is a bit lower than in the midplane of the optically thin disk, but the order of magnitude is similar. Qualitatively, the explanations given in Sect. 3.1.1 are still valid. In contrast to the optically thin case, however, the grains here are not only heated by the central star, but also by the radiation of the disk. As this radiation is at longer wavelengths, where heating is most efficient for grains with radii between and (which are the coldest grains), the temperature spread is slightly reduced.
3.2.3 Grain surface
Although the temperature spread is much smaller, the relative dust grain surface below a certain temperature can still be altered and therefore this quantity needs to be reinvestigated (Fig. 11).
We find that the dust grain surface below a given temperature is higher for the reference disk than for the MGS disk. However, for the latter it is growing faster, so that above , the fraction is higher for the MGS disk. Also, the better thermal coupling decreases the difference in this fraction. At (freeze-out temperature of CO; Öberg et al. 2010), the relative fraction for the reference disk amounts to , while it amounts to for the MGS disk, and at (freeze-out temperature of water; Öberg et al. 2010), it amounts to for the reference disk and for the MGS disk. Between and , the relative dust grain surface amounts to for the reference disk and for the MGS disk.
As the temperature distribution and relative dust grain surface are altered, the two related properties, the freeze-out radius (Fig. 12, top) and the relative dust grain surface below the freeze-out temperature of CO and water (Fig. 12, bottom), also need to be reanalyzed.
Bottom: Relative dust grain surface below the freeze-out temperature of water and CO, as a function of radial distance from the star (optically thick case). For details, see Sect. 3.2.3.
Owing to better thermal coupling, the freeze-out radii for a volatile species on grains of different radii are almost the same. For the largest grains alone (above ), the freeze-out radius is larger than for the smaller grains. Also, because the midplane temperature is smaller outside of than in the optically thin case, the water snowline moves further inside and even CO can freeze out. In addition, the freeze-out radius of the MGS disk is smaller than that of the reference disk, indicating a smaller midplane temperature.
The relative dust grain surface below or equal to the freeze-out temperature of water () and CO () shows that outside of the grains below the freeze-out temperature of water constitute almost all the surface at that radius. CO cannot freeze out inside . There are three reasons for the differences between the optically thick and the optically thin case (Fig. 5, bottom):
-
1.
The midplane temperature spread is much smaller, so that the fraction of surface below the freeze-out temperature increases faster with radial distance from the star for the MGS disk than in the optically thin case.
-
2.
The upper layers of the disk are optically thin and warmer than the midplane, resulting in a smoother transition both for the MGS disk and reference disk.
-
3.
The midplane is colder outside of than in the optically thin case.
3.2.4 Thermal emission of the disk
To illustrate how the thermal emission differs from the optically thin case and between the two disks, the relative difference is drawn together with the absolute flux values in Fig. 13. This plot shows qualitatively the same results as in the optically thin case. However, the maximum of the thermal emission at longer wavelengths is due to the smaller midplane temperature outside the innermost region. Also, the relative difference is smaller because the temperature difference in the disk midplane is smaller.
To further investigate the differences in thermal emission, the spatially resolved relative difference is shown in Fig. 14. As in the case of the optically thin disk (Fig. 8), the minimum in the relative difference moves to longer wavelengths with increasing radial distance. However, because of the reducing temperature spread the minimum is getting shallower.
3.3 Influence of different disk masses
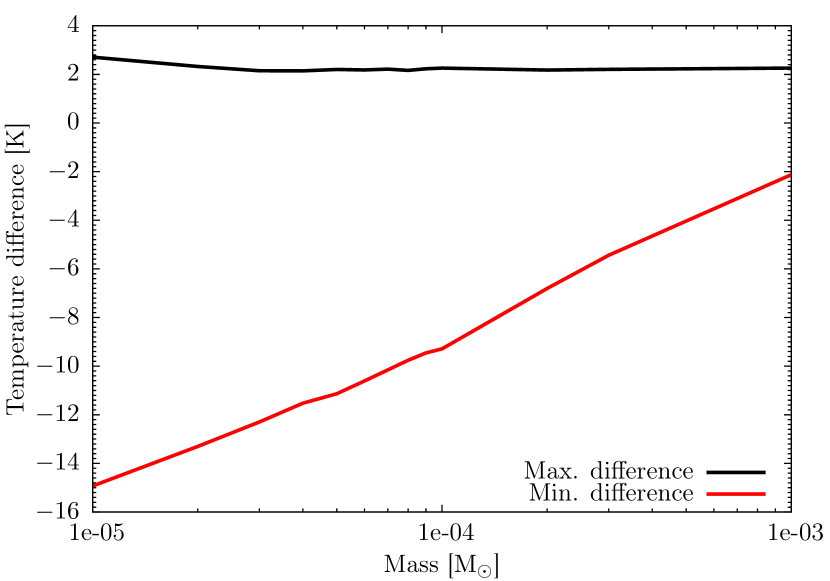
To emphasize the impact of the different treatments of dust grain radius distributions on the temperature distribution and thermal re-emitted radiation of a circumstellar disk, in the preceding sections we considered two extreme cases: an optically thin (i.e., very low mass) disk and a rather massive disk. To evaluate the consequences of more realistic masses on the results, we calculate the temperature distribution for disks with dust masses between and .
We find that while the results are similar to those for the optically thick case, the temperature spread increases with decreasing disk mass. This is due to the weaker thermal coupling. A plot of the maximum and minimum midplane temperature difference of the different dust species to the dust species with the smallest grains (radius ) is shown in Fig. 15. For the maximum and minimum spread, the cells with a radial distance of more than to the inner edge of the disk are considered. The maximum temperature difference only changes by , but the minimum difference changes by from the disk with the lowest to the highest mass considered.
A different perspective on this problem is to investigate the relative dust grain surface with a temperature below or equal to the freeze-out temperature for all grains at a given radial distance from the central star (see Fig. 16). With decreasing mass, the radial distance where the freeze-out of CO happens increases due to the higher midplane temperature. Also, the increase of the dust grain surface below the freeze-out temperature of CO becomes shallower, i.e., the transition region from no freeze-out to complete freeze-out is spread over an increasingly large radial range. The dust grain surface below the freeze-out temperature of water shows the opposite trend. This is due to the higher midplane temperature of higher mass disks. This effect can be explained by the back warming in the inner disk regions, which increases with increasing optical depth or disk mass. However, at the same time the temperature decrease is steeper for higher mass disks, so that outside of the midplane temperature is higher for lower mass disks.
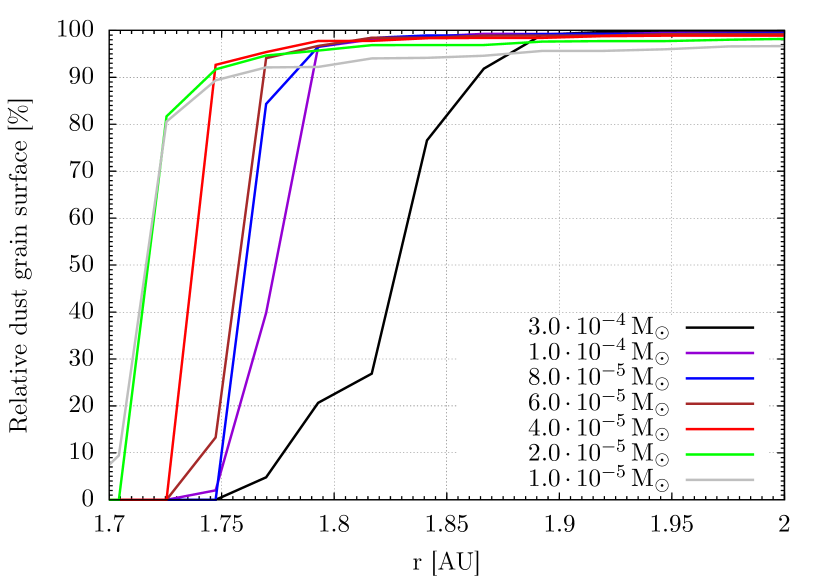
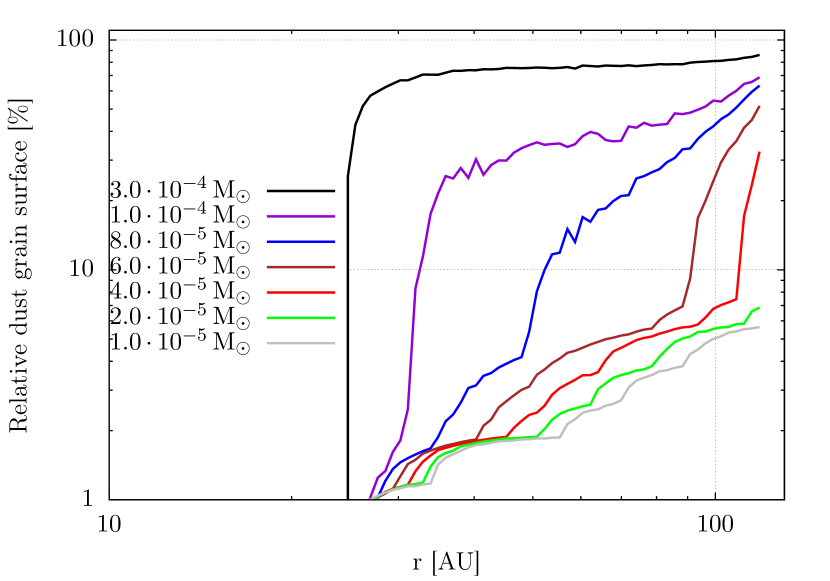
3.4 Inner cavity
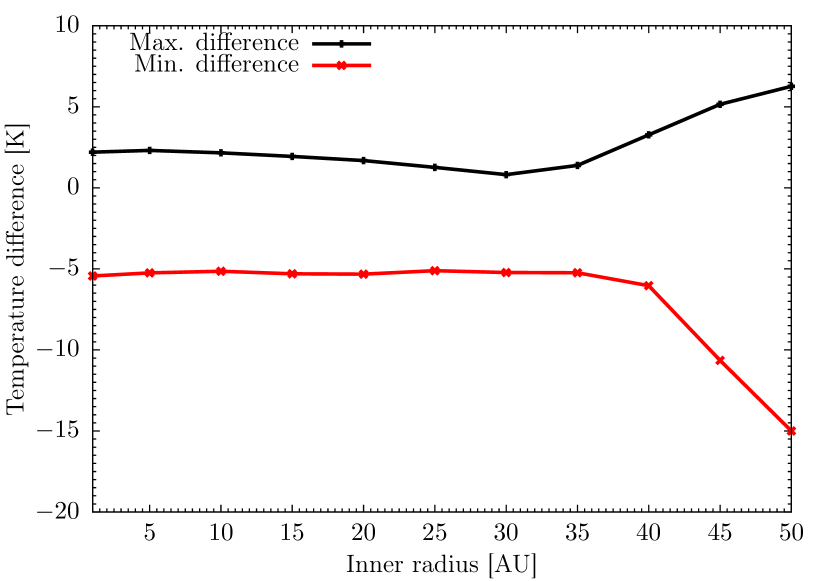
In this section, we explore the impact of the inner inner disk radius on the resulting temperature spread. In addition to disks with an inner radius determined close to the sublimation temperature of the dust we now consider inner cavities with sizes between and (outer radius ). The assumed disk mass is scaled to keep the density in the remaining disk unchanged corresponding to a dust mass of extending from to .
The maximum and minimum temperature difference of the different grain species to the smallest dust grains (radius ) is shown in Fig. 17. The maximum temperature difference has a minimum at , while the minimum temperature difference begins to decrease for cavity sizes of more than . The decreasing spread is due to the weaker radiation at larger radii. This leads to a lower temperature and thus to a smaller temperature spread. The increase of the spread is caused by the decreasing density in the disk, which leads to a weaker shielding of the dust grains by those further in and to a weaker thermal coupling.
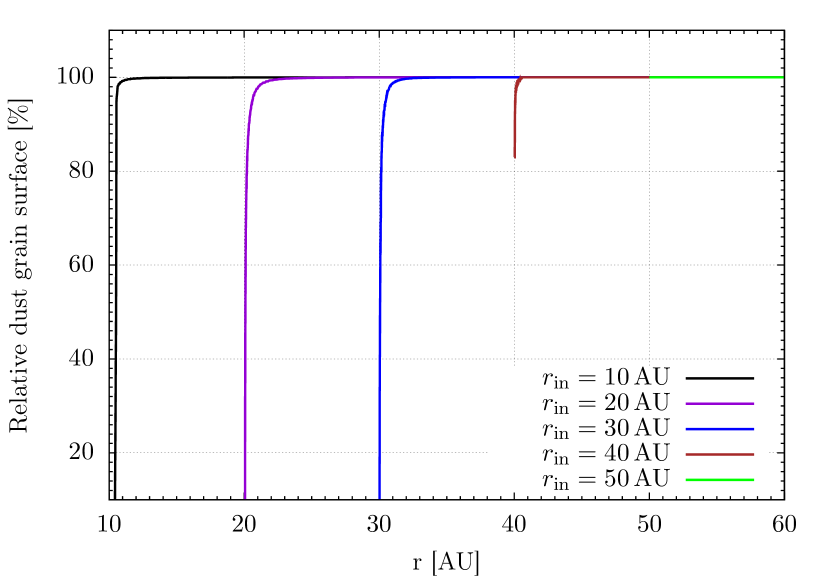
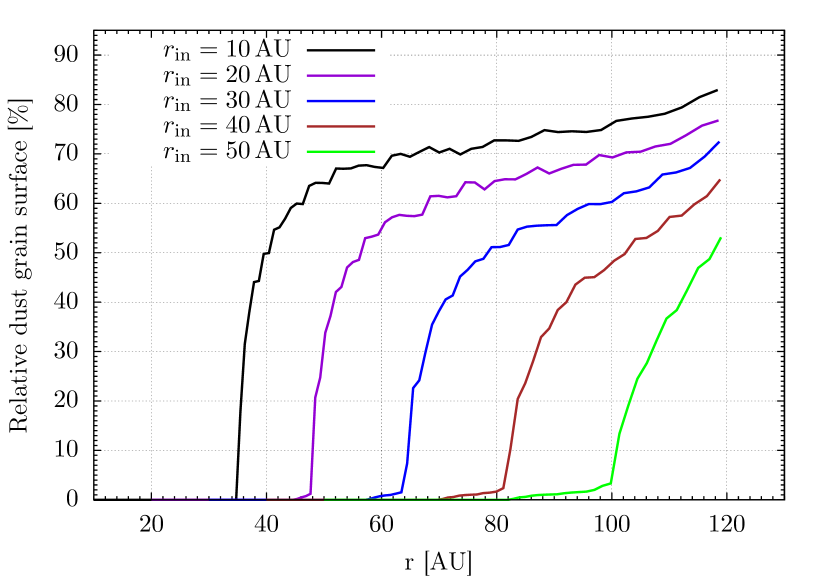
The relative dust grain surface below the freeze-out temperature of water and CO is shown in Fig. 18. Owing to the larger inner void region, the stellar radiation can penetrate into outer disk regions more efficiently. Thus, the freeze-out happens at a larger radial distance for larger inner radii. However, for the largest inner radii water already freezes out at the inner edge of the disk, even on the smallest grains.
3.5 Effects of different outer radii
In this chapter, we explore the effects of varying the outer radius of the disk from to . The inner disk radius is fixed at and the assumed disk mass is .
An increase of the outer disk radius results in a decrease of the mass density and thus the optical depth of the disk. This should increase the temperature spread and the freeze-out radius of CO should move further out, while the freeze-out radius for water should move further in. However, as the dust density decreases with radial distance to the star, the optical depth at the inner parts of the disk only differs by when the outer radius of the disk is doubled (see Tab. 1).
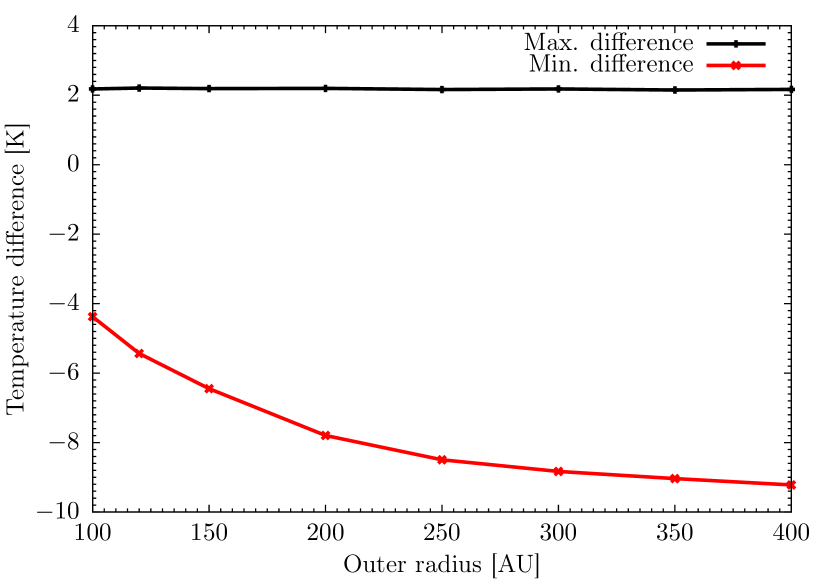
The maximum and minimum temperature difference from the smallest dust grains (radius ) is shown in Fig. 19. Only the minimum temperature difference grows considerably, the maximum difference changes by less than .
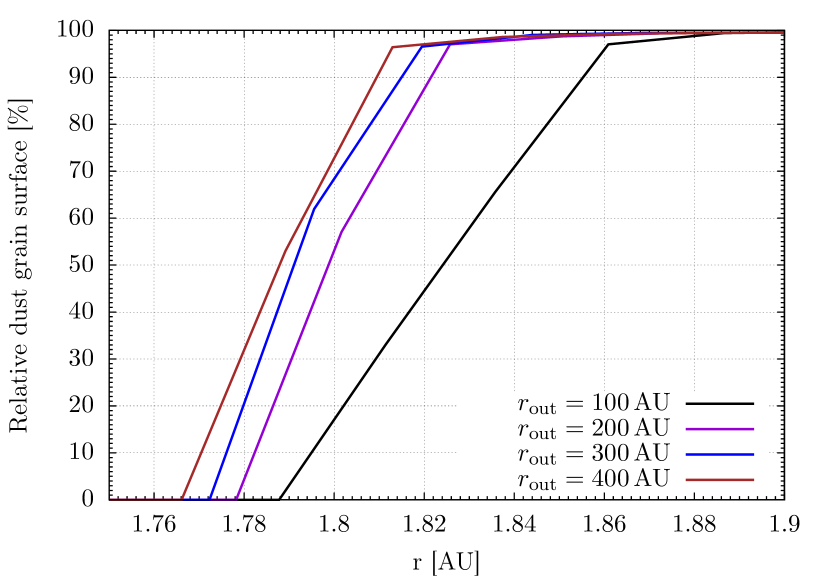
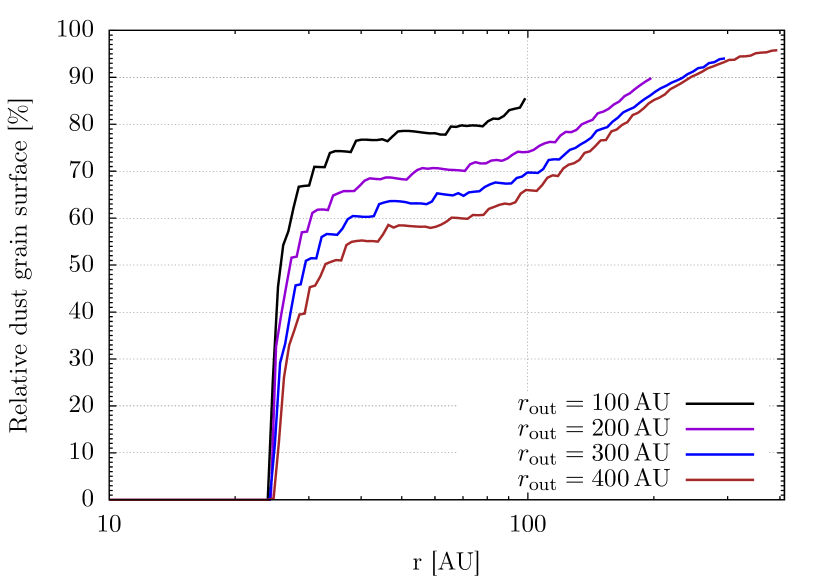
As the optical depth decreases with increasing outer radius, the increase of the dust grain surface below freeze-out temperature becomes shallower, i.e., the transition region from no freeze-out to complete freeze-out is spread over an increasingly large radial range (Fig. 20). However, the water snowline is closer to the star in the case of larger disks. This behavior can be explained by the impact of the disk mass and optical depth on the radial temperature profile that is outlined in Sect. 3.3.
3.6 Flying Saucer
In Guilloteau et al. (2016), dust temperatures of at radial distances of were derived for the Flying Saucer using measurements of the velocity gradients due to the Keplerian rotation of the disk and intensity variations in the CO background as a function of velocity. However, this finding does not agree well with the results obtained for similar disks. In particular, Isella et al. (2009) derived a dust temperature of at for the disk of DM Tau, which has a similar mass. One possible explanation for the low temperatures of the Flying Saucer from Guilloteau et al. (2016) is a temperature difference between larger grains, which dominate the SED at long wavelengths, and small grains, which dominate the SED in the near-infrared (NIR). Here, we apply the MGS grain radius distribution to the Flying Saucer to verify this explanation.
The disk has an outer radius of (Guilloteau et al. 2016). We derive the mass from the constraint that the optical depth at amounts to . This optical depth is measured from the star and averaged over one scale height (). The resulting dust mass amounts to . The central star has a mass of , a luminosity of , and an effective temperature of . The disk is seen in perfect edge-on orientation.
The midplane temperature distribution of the reference disk and its temperature differences from the MGS disk are shown in Fig. 21. Inside of , this temperature difference is negative for all grain radii, i.e., the dust in the MGS disk is colder. Further out, only grains with radii of more than are colder than the reference grains. This finding supports the explanation given by Guilloteau et al. (2016). Also, outside of , the grains with radii between and have temperatures below , while the larger grains reach below that temperature further in.
A comparison of the thermal emission of the MGS disk and the reference disk is shown in Fig. 22.
The thermal emission is stronger for the MGS disk at small wavelengths, while it shows the opposite behavior at longer wavelengths. The larger relative difference is due to the different inclination (edge-on) of the disk.
4 Discussion
4.1 Effects of the disk mass, inner disk radius, and outer disk radius
In the optically thin case, the temperature spread can be as high as in the considered model and the order of radial grain temperature profiles is directly given by the distribution of the absorption cross sections (Sect. 2.3). For disks with an optically thick midplane, the midplane temperature is higher close to the star and lower further out and the better thermal coupling decreases the midplane temperature spread. Here, the dust grains are also heated by the additional thermal emission of the surrounding dust. This dust radiates at longer wavelengths than the star. As the slopes of the absorption cross sections are lower for larger grains, the temperature order is at least partly reversed. The results obtained for the optically thin case are relevant for the upper, directly heated disk layers, while the results for the optically thick disk are applicable in the disk interior.
Having an inner cavity means that the radiation at the inner edge of the disk is weaker. Also, because the density in the remaining disk is kept fix, the mass of the disk decreases. With less mass further in, the shielding of the disk midplane is reduced. These effects make the temperature spread first decrease before it increases again toward larger radii. The freeze-out of water and CO happens at a larger radial distance from the star than without an inner cavity.
With a larger outer radius, the disk gets larger, reducing the dust density and thus the optical depth at any point of the disk. This increases the midplane temperature spread and spreads the transition between no freeze-out and complete freeze-out of water and CO over an increasingly large radial range. Also, the water snowline moves further inside with larger outer radii. However, owing to the decrease of the dust density to the outer parts of the disk, doubling the outer radius only leads to a decrease of the optical depth calculated perpendicular to the disk midplane at a radial distance of .
For the Flying Saucer (Sec. 3.6) we find that in the inner parts of the disk (inside ), the dust temperature distribution is similar to the optically thick case, where the temperatures are highest for dust grains with radii between and . Outside, the dust temperature distribution is more similar to the optically thin case with a higher temperature spread and where the grains with radii between and are warmest. However, the order of radial grain temperature profiles is not identical to the optically thin case because the dust grains are influenced by the re-emitted radiation from further in.
4.2 Effects of different dust distributions
It has been confirmed observationally that mm-sized particles tend to settle toward the midplane (e.g., Gräfe et al. 2013). To investigate the consequences of dust settling, we use a disk model where we deplete the upper layers completely from large dust grains. To keep the grain radius distribution constant globally, we increase the concentration of the large grains in and close to the midplane.
This leads to two different effects: First, the grain number density and thus the opacity in the midplane increase, thus reducing the midplane temperature in the outer disk region, but increasing it further in (see Sect. 3.3). However, as the upper layers are depleted from large dust grains, their temperature and temperature spread increases. Furthermore, the decreased optical depth in these layers results in a more efficient heating of the disk midplane. Depending on the specific parameters, the midplane may become either cooler (due to the larger optical depth in the midplane) or warmer, if the more efficient heating by the upper layers dominates.
A further question is related to the assumption of the surface density profile. In particular, Equations 1 and 2 imply a surface density distribution . Adopting a shallower surface density distribution (e.g., Guilloteau et al. 2011) would result in a shallower radial gradient of the optical depth per unit length. Consequently, the dust density and thus the optical depth close to the star would be reduced, while it would be increased futher out. Thus, the maximum midplane temperature spread would be reduced.
However, owing to the weaker back-warming effect, resulting from the lower optical depth close to the star, the water snowline would move further in. Furthermore, the transition between no freeze-out and complete freeze-out for water would be spread over a larger radial range. As the shielding of the midplane by the dust further inside would also be weaker, the CO snowline would move further out. Besides, the larger optical depth per unit length in that region would decrease the radial range of the transition from no freeze-out to complete freeze-out for CO.
4.3 Implications for the molecular layer
The chemistry of protoplanetary disks is heavily dependent on the dust grain temperature, in particular the gas phase carbon content because of CO freezing and conversion to CO2 at temperatures below 35-40 K onto grain surfaces (see Reboussin et al. 2015). Quantifying the impact of the dust temperature spread would require detailed chemical modeling. We illustrate the differences from the reference model by evaluating the change in the available surface of grains at temperatures below 20 K (about the CO freezing temperature) and 30 K at 50 AU.
In the optically thin case, there are dust grains with temperatures below only in the MGS disk. However, they only amount to of the total dust grain surface.
In the more realistic optically thick case, Fig. 11 shows that there are dust grains with temperatures below for both disks. For the MGS disk, the relative dust grain surface between and amounts to . For the reference disk, the relative dust grain surface between and is on the same order (). However, Fig. 10 reveals that the spread of grain temperatures is large around an altitude of 5 to 20 AU, which at 50 AU corresponds to about 1 - 4 scale heights, i.e. the location of the molecular layer. The temperature difference between grains of 1 and 47 can be as large as 30 K.
We also observe that in the disk atmosphere, small grains (with radius ) can have a temperature about larger than that of the reference disk (90 K versus 60 K). This shows that a real grain radius distribution implies a larger vertical temperature gradient than usually determined by models where a single equivalent radius is used (our reference model). This should affect the behavior of the PDR layer located at the disk surface.
5 Conclusion
The objective of this study was to investigate selected consequences of using a more precise treatment of the grain radius distribution on the dust temperature distribution and the SED in circumstellar disks.
In the optically thin case, the temperature spread can be as large as . Also, the relative fraction of dust grain surface below a certain temperature is smaller in the reference disk than in the MGS disk. As the freeze-out of CO alters the efficiency of deuterium fractionation (Punanova et al. 2015), this temperature spread alters the efficiency of chemical reactions as well. Furthermore, the freeze-out radius depends on the grain radius with the same trends observed as in the temperature distribution, while the relative dust grain surface below the freeze-out temperature as a function of radial distance to the star shows several steps for the MGS disk and just one step for the reference disk.
If the dust distribution in the midplane is optically thick, the temperature spread becomes much smaller. Also, the order of radial temperature profiles is at least partly reversed. The relative fraction of dust grain surface below a certain temperature is changed too. The difference between them decreases, and, below , the fraction is higher for the reference than for the MGS disk, while it shows the opposite behavior for higher temperatures. The freeze-out radius changes to smaller radii because the midplane temperature is lower further away from the star and the freeze-out radii of the different grains are closer together. The relative fraction of dust grain surface below the freeze-out temperature of water grows faster than for the optically thin disk. Also, CO can freeze out outside of .
For the thermal re-emission we find that it is stronger at short wavelengths in the MGS disk, while it shows the opposite behavior at longer wavelengths. This finding can be explored by the very efficient radiation of the small grains at short wavelengths. These grains constitute the largest percentage of the relative dust grain surface of the MGS disk. Furthermore, these grains are warmer than those used in the reference disk. At the longest wavelengths (), the relative difference decreases because the absorption cross section of the average grains decreases faster than that of the largest grains in the MGS disk. These differences also change the dust emissivity index derived in many simple observational analyses (see, e.g., Schnee et al. 2010).
In Sec. 3.6, the MGS grain radius distribution model is applied for the analysis of the disk of the Flying Saucer. Here, the larger grains (with radii above ) are colder than the average grains of the reference disk, which explains the observational findings of Guilloteau et al. (2016).
Acknowledgments. AD and SG thank the French program “Physique et Chimie du Milieu Interstellaire” (PCMI), funded by the Conseil National de la Recherche Scientifique (CNRS) and Centre National d’Études Spatiales (CNES), which supports this work.
References
- Bjorkman & Wood (2001) Bjorkman, J. E. & Wood, K. 2001, ApJ, 554, 615
- Chapillon et al. (2008) Chapillon, E., Guilloteau, S., Dutrey, A., & Piétu, V. 2008, A&A, 488, 565
- Draine & Malhotra (1993) Draine, B. T. & Malhotra, S. 1993, ApJ, 414, 632
- Gräfe et al. (2013) Gräfe, C., Wolf, S., Guilloteau, S., et al. 2013, A&A, 553, A69
- Guilloteau et al. (2011) Guilloteau, S., Dutrey, A., Piétu, V., & Boehler, Y. 2011, A&A, 529, A105
- Guilloteau et al. (2016) Guilloteau, S., Piétu, V., Chapillon, E., et al. 2016, A&A, 586, L1
- Hocuk et al. (2016) Hocuk, S., Cazaux, S., Spaans, M., & Caselli, P. 2016, MNRAS, 456, 2586
- Isella et al. (2009) Isella, A., Carpenter, J. M., & Sargent, A. I. 2009, ApJ, 701, 260
- Lucy (1999) Lucy, L. B. 1999, A&A, 344, 282
- Madlener et al. (2012) Madlener, D., Wolf, S., Dutrey, A., & Guilloteau, S. 2012, A&A, 543, A81
- Martin (1978) Martin, P. G. 1978, Cosmic dust. Its impact on astronomy
- Mathis et al. (1977) Mathis, J. S., Rumpl, W., & Nordsieck, K. H. 1977, ApJ, 217, 425
- Ober et al. (2015) Ober, F., Wolf, S., Uribe, A. L., & Klahr, H. H. 2015, A&A, 579, A105
- Öberg et al. (2010) Öberg, K. I., Bottinelli, S., Jørgensen, J. K., & van Dishoeck, E. F. 2010, ApJ, 716, 825
- Punanova et al. (2015) Punanova, A., Caselli, P., Pon, A., Belloche, A., & André, P. 2015, ArXiv e-prints [arXiv:1512.02986]
- Reboussin et al. (2015) Reboussin, L., Wakelam, V., Guilloteau, S., Hersant, F., & Dutrey, A. 2015, A&A, 579, A82
- Schnee et al. (2010) Schnee, S., Enoch, M., Noriega-Crespo, A., et al. 2010, The Astrophysical Journal, 708, 127
- Shakura & Sunyaev (1973) Shakura, N. I. & Sunyaev, R. A. 1973, A&A, 24, 337
- S̆olc (1980) S̆olc, M. 1980, Acta Universitatis Caroliae. Mathematica et Physica, 21, 19
- Weingartner & Draine (2001) Weingartner, J. C. & Draine, B. T. 2001, ApJ, 548, 296
- Wolf (2003) Wolf, S. 2003, ApJ, 582, 859
- Wolf et al. (2003) Wolf, S., Padgett, D. L., & Stapelfeldt, K. R. 2003, ApJ, 588, 373
Appendix A Optical depth
Here, we provide an overview of the optical depth vertical through the disk at a radial distance of 10 AU from the central star. This is done for a wavelength of . The results are in Table 1. The optical depths mentioned are for the MGS disk. For the reference disk, the optical depths are smaller. This can be explained by numerical inaccuracies resulting from the limited number of grain radius intervals used in the computation of the cross sections of the dust. The disks with an inner cavity are skipped because there is no dust for a radial distance of to the star.
| Setup | Optical depth at |
|---|---|
| Opt. thick () | |
| Out. radius | |
| Out. radius | |
| Out. radius | |
| Out. radius | |
| Flying Saucer |
Appendix B Grain radii
The 16 intervals, used in the simulation with a correct treatment of the grain radius distribution, are mentioned in Table 2.
| Dust bin number | Minimum radius | Maximum radius | Mass ratio |
|---|---|---|---|
| [] | [] | [%] | |
| 1 | 0.005 | 0.0107 | 0.104 |
| 2 | 0.0107 | 0.0230 | 0.152 |
| 3 | 0.0230 | 0.0493 | 0.223 |
| 4 | 0.0493 | 0.106 | 0.327 |
| 5 | 0.106 | 0.227 | 0.479 |
| 6 | 0.227 | 0.486 | 0.701 |
| 7 | 0.486 | 1.04 | 1.03 |
| 8 | 1.04 | 2.24 | 1.50 |
| 9 | 2.24 | 4.80 | 2.20 |
| 10 | 4.80 | 10.3 | 3.22 |
| 11 | 10.3 | 22.1 | 4.72 |
| 12 | 22.1 | 47.3 | 6.91 |
| 13 | 47.3 | 101 | 10.1 |
| 14 | 101 | 217 | 14.8 |
| 15 | 217 | 466 | 21.7 |
| 16 | 466 | 1000 | 31.8 |