Search for Hydrogenated C60 (fulleranes) in Circumstellar Envelopes
Abstract
The recent detection of fullerene (C60) in space and the positive assignment of five diffuse interstellar bands to C reinforce the notion that fullerene-related compounds can be efficiently formed in circumstellar envelopes and be present in significant quantities in the interstellar medium. Experimental studies have shown that C60 can be readily hydrogenated, raising the possibility that hydrogenated fullerenes (or fulleranes, C60Hm, ) may be abundant in space. In this paper, we present theoretical studies of the vibrational modes of isomers of C60Hm. Our results show that the four mid-infrared bands from the C60 skeletal vibrations remain prominent in slightly hydrogenated C60, but their strengths diminish in different degrees with increasing hydrogenation. It is therefore possible that the observed infrared bands assigned to C60 could be due to a mixture of fullerenes and fulleranes. This provides a potential explanation for the observed scatter of the C60 band ratios. Our calculations suggest that a feature around 15 m due to the breathing mode of heavily hydrogenated C60 may be detectable astronomically. A preliminary search for this feature in 35 C60 sources is reported.
1 Introduction
It is now well established that circumstellar envelopes are major sources of molecules and solids in the Galaxy. Recent infrared and millimeter-wave observations have shown that complex molecules can be efficiently synthesized in circumstellar envelopes of evolved stars, ejected into the interstellar medium, and distributed throughout the Galaxy (Kwok, 2004). The discovery of pre-solar grains carrying isotopic signatures of asymptotic giant branch stars offers proof that products of circumstellar chemical synthesis did survive journey across the Galaxy and be embedded in the early solar system (Zinner, 1998). Among the molecules synthesized in the circumstellar environment is the pure carbon molecule fullerene (C60). Circumstellar C60 was first discovered through its four vibrational bands in the young planetary nebula Tc1 (Cami et al., 2010). Subsequently, the C60 vibrational bands have been detected in a variety of circumstellar environments (Sellgren et al., 2010; García-Hernández et al., 2010, 2011a, 2011b; Gielen et al., 2011; Zhang & Kwok, 2011; Roberts et al., 2012; Evans et al., 2012; Otsuka et al., 2013), although the excitation and formation mechanisms of circumstellar C60 remain unclear (e.g. Zhang & Kwok, 2013, and references therein). Specifically, C60 has been detected in 11, 4, and 7 planetary nebulae in the Galaxy, the Large Magellanic Cloud (LMC), and Small Magellanic Cloud (SMC), respectively, and the detection rate is highest among the SMC planetary nebulae, followed by LMC and Galactic planetary nebulae (García-Hernández et al., 2012; Otsuka et al., 2016). Some of the C60 sources also exhibit vibrational bands from C (Berné et al., 2013; Zhang & Kwok, 2013; Strelnikov et al., 2015).
Since its first synthesis in the laboratory, C60 or its derivatives have been speculated to be abundant in the interstellar medium and may serve as the carrier of the diffuse interstellar bands (DIBs) (Kroto et al., 1985). However, the search for electronic transitions of C60 in space has not been successful (Snow & Seab, 1989; Herbig, 2000), suggesting that interstellar C60 (if any) might have been converted into other molecular forms. Based on the laboratory spectra recorded in a neon matrix (Fulara et al., 1993), Foing & Ehrenfreund (1994) ascribed two strong DIBs at 9632 and 9577 Å to C. This identification has remained uncertain due to a lack of gas-phase experimental data and the non-detection of other DIBs coinciding with weaker C bands. Recently, Campbell et al. (2015) reported the cold gas-phase spectrum of C, which exhibits features remarkably consistent with the two DIBs not only for the wavelengths but also for the band widths and relative intensities (see also Campbell et al., 2016a). The weaker C bands at 9348.4, 9365.2, and 9427.8 Å were soon thereafter discovered in diffuse clouds (Walker et al., 2015; Campbell et al., 2016b). Thus far five DIBs have been convincingly assigned to C.
The same C absorption bands at 9632 and 9577 Å have been detected with remarkably large equivalent widths towards a C60-containing proto-planetary nebula IRAS + by Iglesias-Groth & Esposito (2013), suggesting that these two bands are primarily of circumstellar origin. Two DIBs at 4428 and 5780 Å were found to be unusually strong in C60-containing planetary nebulae (Díaz-Luis et al., 2015). These results strengthen the notion that there is a relationship between some DIB carriers and the fullerene-related compounds synthesized in circumstellar envelopes.
DIBs are likely to originate from molecules or radicals possessing strong oscillator strengths. Given the high stability of the carbon cage, C60 is able to survive in rather harsh environments (see Cataldo et al., 2009, and references therein). The atomic and electronic structures of C60 make it possible to form a great diversity of stable derivatives, including C60Hm (fulleranes), C60 adducts, XC60 (endofullerenes; X represents one or more atoms or molecules), heterofullerenes, buckyonions, and so on. This is consistent with the general property of DIBs as DIBs can be divided into different groups according to the correlations of intensities. The possibility of various fullerene compounds as the carries of DIBs was recently discussed by Omont (2016).
In the laboratory, C60 can be readily hydrogenated into C60H36 by atomic hydrogen (see e.g., Cataldo & Iglesias-Groth, 2009; Iglesias-Groth et al., 2012). Since hydrogen is the most abundant element in the universe and fullerene has been discovered in H-rich circumstellar envelopes (García-Hernández et al., 2010), it is reasonable to expect that C60Hm might exist in space. Most of the experimental synthesis procedures of C60Hm are performed on condensed samples (Goldshleger & Moravsky, 1997) and it is difficult to say whether the radiative association reaction of gas-phase C60 and H can efficiently produce C60Hm. However, chemistry in astronomical environments can be quite different from that in laboratory and it is possible that circumstellar C60 exists in either or both solid-state and gas-phase forms (Zhang & Kwok, 2013). Therefore, we cannot rule out the possibility that in space C60Hm can be formed on solid surfaces.
Experimental studies suggest that C60Hm would be quickly dehydrogenated to C60 in an inert gas atmosphere when the temperature approaches 550 K (Rüchardt et al., 1993). If astronomical fulleranes are free-flying gaseous species, temperatures well above 550 K can be readily reached through stochastic heating by absorption of a single UV photon. If this is the case, significantly hydrogenated fullerenes would presumably only be present in the environments which are rich in atomic H and devoid of UV radiation. While these two conditions have a relatively narrow intersection, they are satisfied by the circumstellar environment of reflection nebulae and proto-planetary nebulae.
Experimental data show that the CH stretching bands of C60Hm at 3.4–3.6 m have molar extinction coefficients similar to those of four major vibrational bands of C60 (Iglesias-Groth et al., 2012). These features were tentatively detected in the proto-planetary nebula IRAS 010057910, and the relative intensities suggest a large value (Zhang & Kwok, 2013). However, Díaz-Luis et al. (2016) did not detect fulleranes in two planetary nebulae exhibiting strong C60 emission, and concluded that they might have been destroyed by UV radiation. Indeed, the experimental study of Cataldo & Iglesias-Groth (2009) shows that molecular hydrogen can be released from C60Hm by UV radiation and the C60Hm/C60 abundance ratio depends on the equilibrium between the hydrogenation of C60 and the emission of molecular hydrogen.
Since spectral information on fulleranes from laboratory data is limited, it would be useful to perform theoretical studies to explore the vibrational signatures of C60Hm. Recent advances in computational chemistry methods and computing facilities enable theoretical investigation of the vibrational properties of large molecules like fulleranes. In this paper, we present theoretical calculations of the infrared spectra of C60Hm, which then are compared with observational data. Specifically, we investigate the effects of hydrogenation on the spectral behavior of C60 and whether the spectral signatures can be detected by astronomical observations.
2 C60Hm Isomers and Computational Methods
Under laboratory conditions, C60H36 is the most common product to be synthesized although other fulleranes can also be produced. Thermal annealing can partly eliminate hydrogen from C60H36 to form C60H18 (Iglesias-Groth et al., 2012). The laboratory methods to synthesize fulleranes are summarized by Goldshleger & Moravsky (1997) and Cataldo & Iglesias-Groth (2010). Experimentally, CH bonds are found to form through the addition of hydrogen across CC double bonds, resulting in the numbers of hydrogen atoms in neutral fulleranes being always even. Guided by these experimental results, we have chosen to theoretically study eleven types of C60Hm, where …,20 and 36. Larger fulleranes () are highly unstable due to significant structural strain.
Nevertheless, we cannot rule out the presence of fullerane radicals with odd hydrogen atoms in astronomical environments. In laboratory conditions where there are plenty of H atoms available, C60 is hydrogenated in the condensed phase, which is not necessarily the case in space. It is not unambiguously clear whether the dehydrogenation of fulleranes is accompanied by the release of H atoms or H2 molecules. The calculations of Zerenturk & Berber (2012) show that the migration hydrogen on fulleranes have high barriers, unless the presence of a neighbouring H atom lowers the migration barrier. If this is the case, the desorption of H2 molecules would be more likely. Assuming that the formation route mimics the lab experiment, in which the most highly hydrogenated stable fullerane C60H36 is formed from C60 and then the lower hydrogenation species are created by losing H2, one will have only fulleranes with an even number of attached H atoms. Considering the relative difficulty of studying fulleranes with an odd number of H atoms (see below), it is desirable to begin with fulleranes with an even number of H atoms. Nevertheless, it would be useful to include fulleranes with an odd number of H atoms in future studies of association reactions of C60Hm with H atoms, dissociation paths, and their rates under space conditions.
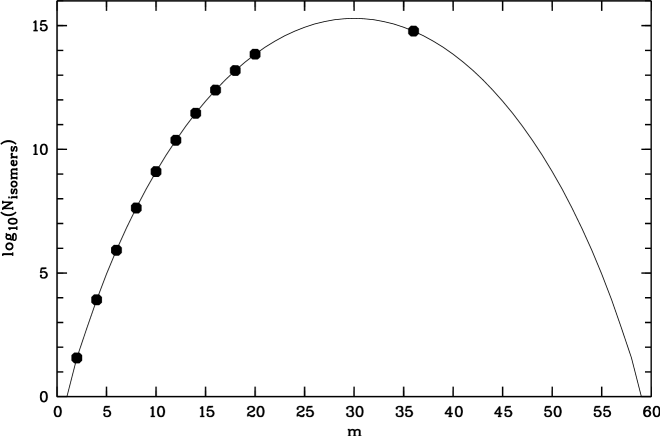
Mathematically, the number of fullerane isomers can be obtained using a combinatorial approach. In Figure 1, we show the isomer numbers with increasing hydrogenation levels based on numbers in Table 2.5 of Bonchev & Rouvray (1995). As we can see from Figure 1, the number of structural isomers for each C60Hm is enormous ( for ). It would be computationally virtually impossible to explore all possible geometries. We therefore limit ourselves to study only 5 isomers for each species (except for C60H18, for which 20 isomers are included). While 5 is a very small fraction of the total isomer number, we note that the calculations of Bonchev & Rouvray (1995) do not take chemical stability into consideration. In the present calculations, we focus on those isomers that are likely to be the most stable, and an investigation of the effect of limited isomer numbers will follow in Section 3.3.
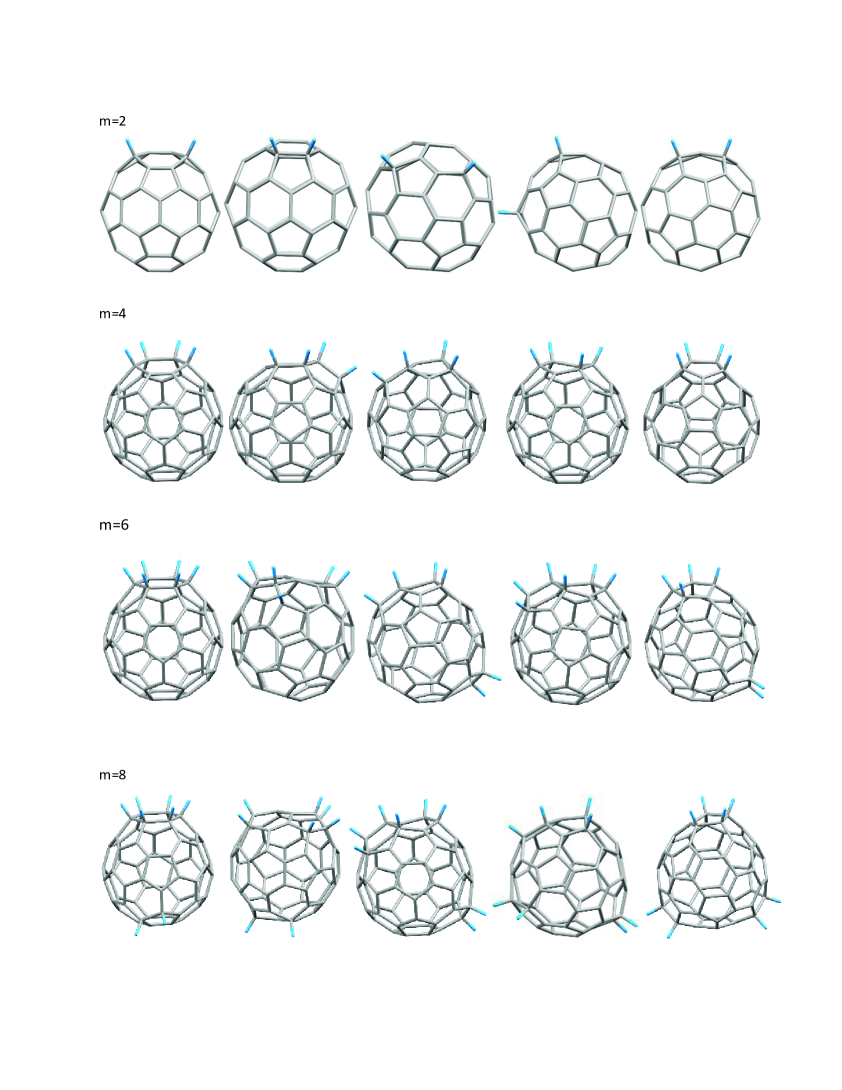
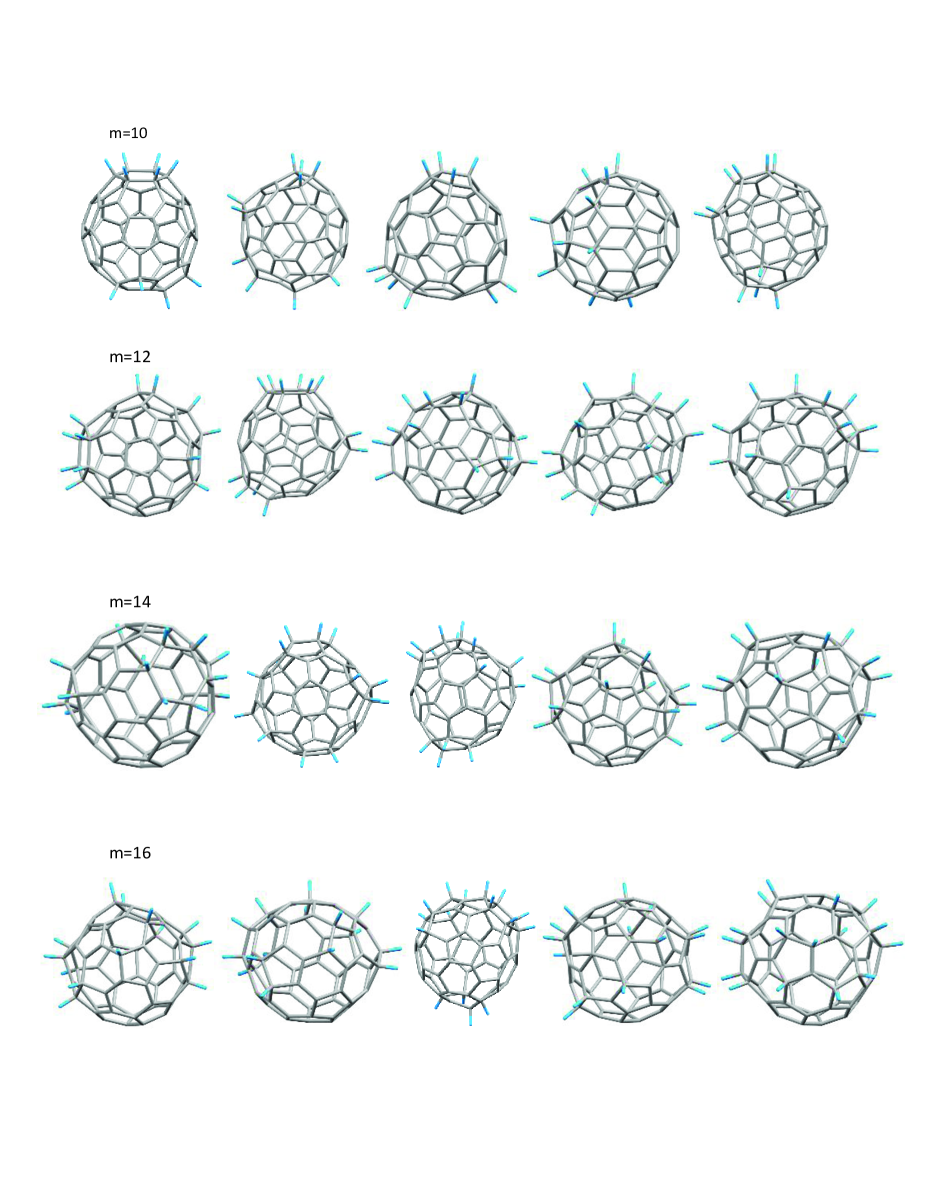
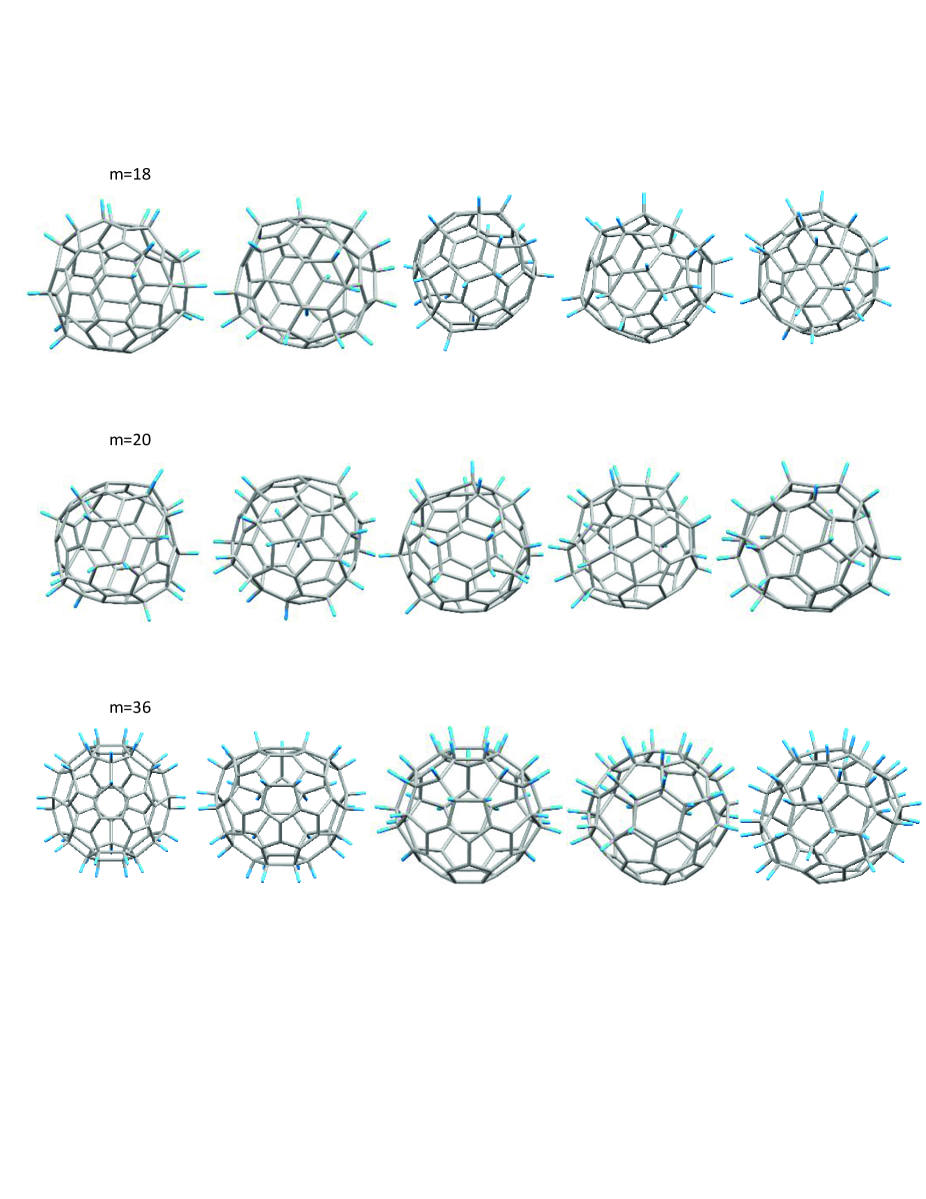
The initial geometries of the isomers were generated based on the most stable isomers reported in the experimental and theoretical works of Cataldo & Iglesias-Groth (2010). In general, we start from C60H2 isomer and hydrogen atoms were added sequentially to generate the other fulleranes isomers. The initial structures were visualized using the Chemcraft graphical program111Available at http://www.chemcraftprog.com to avoid similar geometries among isomers. For highly hydrogenated C60, H atoms are distributed as uniformly as possible over the C60 cage to minimize the effect of the repulsive forces between H atoms.
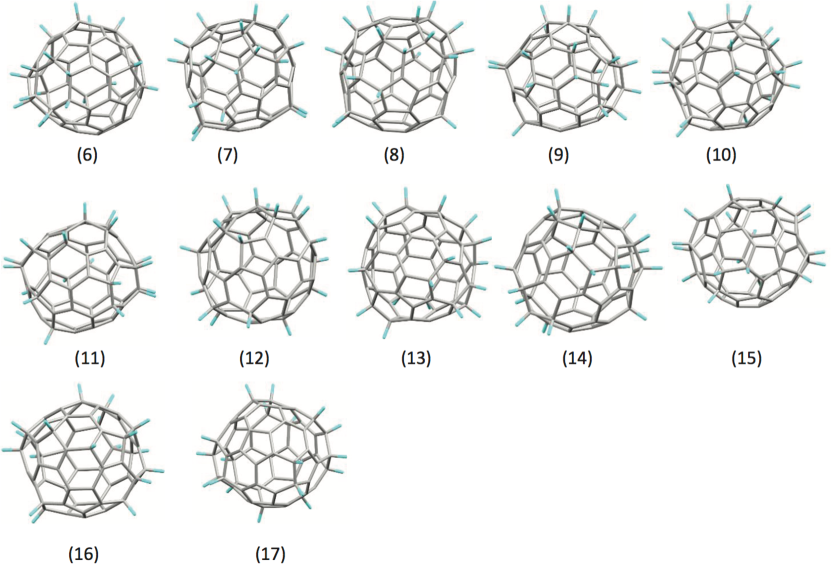
The computational procedures of C60Hm vibrational spectra are similar to those described in Sadjadi et al. (2015). Density functional theory (DFT) calculations were conducted with the Gaussian 09 (Frisch et al., 2009), PQS222Parallel Quantum Solutions version 4.0, 2013 Green Acres Road, Fayetteville, Arkansas 72703; URL: http://www.pqs-chem.com and Firefly333Firefly version 8.2.0, http://classic.chem.msu.su/gran/firefly/index.html packages, running on the HKU supercomputer grid-point facility and QS128-2300C-OA16 QuantumCubeTM machine separately. We used the B3LYP and BH&HLYP hybrid functionals in combination with polarization consistent basis set PC1 (Jensen, 2001, 2002) to obtain the harmonic frequencies of fundamental vibrations of the molecules. Under the default criteria, all the optimized geometries were characterized as local minima, established by the positive values of all harmonic frequencies and their associated eigenvalues of the second derivative matrix. Figure 2 shows the optimized structures of C60Hm isomers included in this study. The isomers are arranged from left to right in order of increasing relative total energy.
The scheme of double scaling factors (Laury, 2012) was then applied to the DFT vibrational frequencies. In this scheme, the vibrational frequencies of cm-1 and cm-1 are scaled by 0.9311 and 0.9352 for BH&HLYP and by 0.9654 and 0.9808 for B3LYP, respectively. In order to compare the computed absorption spectra with the observed emission spectra, we assumed a thermal excitation model at a temperature of 400 K, and applied a Drude broadening function to the theoretical spectra of C60Hm isomers. The width is assumed to be about 0.3 m, in accordance with the observed widths of C60 features. The assumed temperature is comparable to those determined from astronomical spectra. Finally, the theoretical spectrum of each C60Hm was obtained by averaging its five isomer spectra.
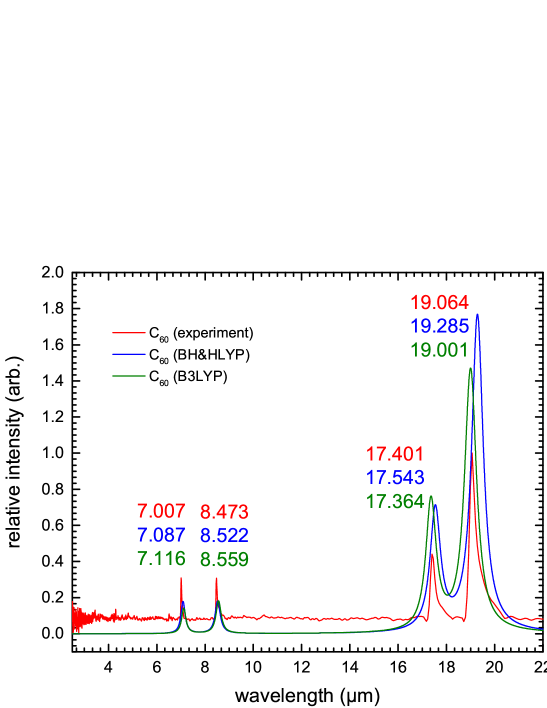
The accuracy of such combination of DFT functionals, basis set and scaling factors were estimated as 0.12–0.13 m in reproducing experimental wavelengths (Sadjadi et al., 2015). The uncertainties of the band strengths are difficult to estimate. Inconsistent band strengths of C60 have been reported in the literature, and there are large discrepancies between the theoretical and experimental values (see Zhang & Kwok, 2013; Brieva et al., 2016, and references therein). Nevertheless, DFT has been evaluated as having an excellent performance in predicting the relative infrared intensities and Raman activities (Zvereva et al., 2011). From our calculations, we obtain the relative intrinsic strengths 444 In this paper, if not mentioning ‘intrinsic strengths’, all the band intensities or intensity ratios refer to those modelled. of the C60 bands at 18.9, 17.4, 8.5, and 7.0 m to be 100, 37, 31, and 71, lying well within the range of the previously reported values. The computed spectra of C60 are compared with the Fourier-transform infrared data from Cataldo (priv. comm.) in Figure 3. The reasonable agreement between theory and experiment gives us confidence in the theoretical results.
Modeling the electronic ground states of the open-shell systems such as fullerane radical cations via DFT formalisms requires additional efforts. In order to eliminate the spin contamination from the wave function occurring in unrestricted DFT formalism such as UB3LYP, we set our model to the restricted open-shell formalism. The second derivative energy matrix is calculated by numerical methods in the latter method rather than analytical methods in the former, which need more computational time. We tested the reliability of our chosen restricted open-shell approach in predicting the correct electronic structure by calculating the first ionization potential of C60 from the energy difference of C60 and C. The geometry optimization and frequency calculations on C were performed with ROB3LYP/PC1. The calculated ionization energy is 7.85 eV, which is in excellent agreement with the experimental value of 7.650.20 eV reported in Pogulay et al. (2004). Results of a limited study of cations are presented in Section 3.4.
3 Results
From Figure 2 we can see that the geometry of the carbon cages is distorted by to hybridization change of carbon atoms undergo hydrogenation in different part of the C60 cage. In the classical view of interacting hard-sphere atoms, the repulsion between H atoms is expected to increase the strain energy in cage, which may cause the instability and further decomposition of very heavily hydrogenated C60. As results of hydrogenation and rearrangement of bonds, different kinds of CC bonds such as conjugated, olefinic and aromatic bonds are formed. The resultant breaking of the symmetry of C60 cage leads to the activation of more CC modes and changes the relative strengths of the four skeletal vibrational bands of C60, as well as forming new bands. The addition of H atoms to the C60 molecule is also expected to introduce new CH stretching and bending modes, with corresponding increase in intensities with the number of H atoms. These effects will be quantitatively examined here.
3.1 The CH stretching mode at 3.4 m
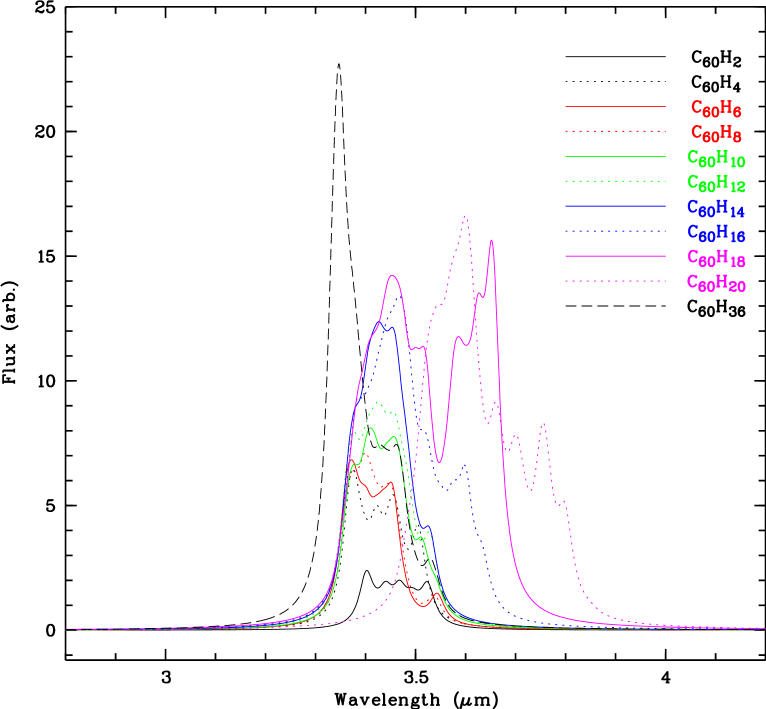
Figure 4 shows the calculated profiles of the CH stretching bands near 3.4 m. These stretching modes result in multiple peaks ranging from 3.3 to 3.9 m, and there is a general tendency of increasing band widths with increasing values. This may be attributed to the influence of neighboring environments of CH groups. For a given CH bond, the vibrational frequencies change depending on the number and distance of adjacent carbon atoms that are bonded to hydrogen (Webster, 1992). When the value is small, increasing hydrogenation leads to more complexity, and thus more complex band profiles. Beyond a certain value, further hydrogenation results in less numbers of vacant sites and decreases the complexity. Therefore, the 3.4 m band profile is a reflection of the symmetry of the molecule and can be taken as a probe of the structures of C60Hm.
The 3.4 m band arising from less symmetric C60Hm might be very broad and may be difficult to detect in astronomical spectra. A mixture of C60Hm isomers may produce a broad plateau around 3.4 m, a feature that has been commonly observed in astronomical sources.
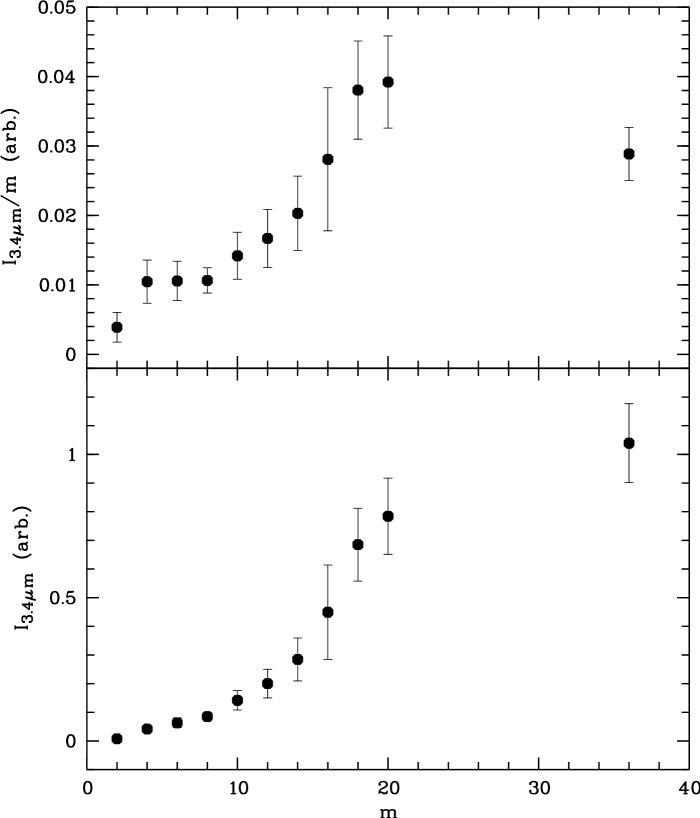
The strengths of the 3.4 m band are positively correlated with the degree of hydrogenation, as illustrated in Figure 4. If C60 is only slightly hydrogenated, the 3.4 m band may be too weak to be detectable in astronomical spectra. In Figure 5, we examine the variations of the intensities with the values. A positive correlation can be seen although the relation is clearly non-linear. When , the band intensities per hydrogen atom increase with increasing values. This shows that the C–H oscillators do not remain isolated from one another. The presence of additional H atoms affects the distribution of electrons, which respond to the distortion along C–H stretches and yield larger variations of the electric dipole moment.
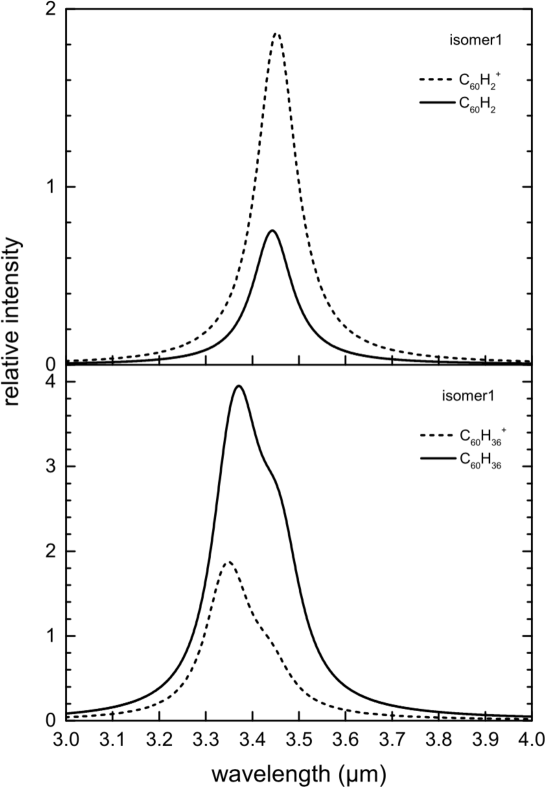
Experimental data suggest that the CH stretching bands of C60H36 and C60H18 have molar extinction coefficients (normalized with the number of CH groups) larger than those of aliphatic molecules (Iglesias-Groth et al., 2012). Therefore, if fullerenes with high hydrogenation have an abundance comparable to aliphatic species, they should be easily detected in astronomical spectra through the 3.4 m band. Four bands around 3.4 m in the spectrum of IRAS 010057910 have been tentatively assigned to fulleranes, and their relative intensities might suggest that there exist species with different degrees of hydrogenation (Zhang & Kwok, 2013). An inspection of Figure 4 clearly suggests that it is possible to qualitatively reproduce the observed features by weighted sums of these computed spectra, while a quantitative comparison between theoretical and observational spectra requires more extensive computations of C60Hm isomers.
As C60Hm has a rather low ionization potential, C60H may be present in diffuse interstellar medium and contribute to the DIB phenomenon. Theoretical computations and experimental data of polycyclic aromatic hydrocarbons (PAHs) show that the C–H stretching mode is greatly suppressed in cations (Pauzat et al., 1995). Topological analysis of Pauzat et al. (2010) shows that a hole in the shell created by ionization may be responsible for the suppression of C–H modes in PAH cations. It is therefore worthwhile to investigate whether such a suppression also occurs for fulleranes. A detailed study of the vibrational spectrum of C60H is beyond the scope of this paper, but should be pursued in the future. A preliminary study of two ionized species of fulleranes is given in Section 3.4.
3.2 C–H bending and carbon skeleton motions in the 5–24 m spectral region
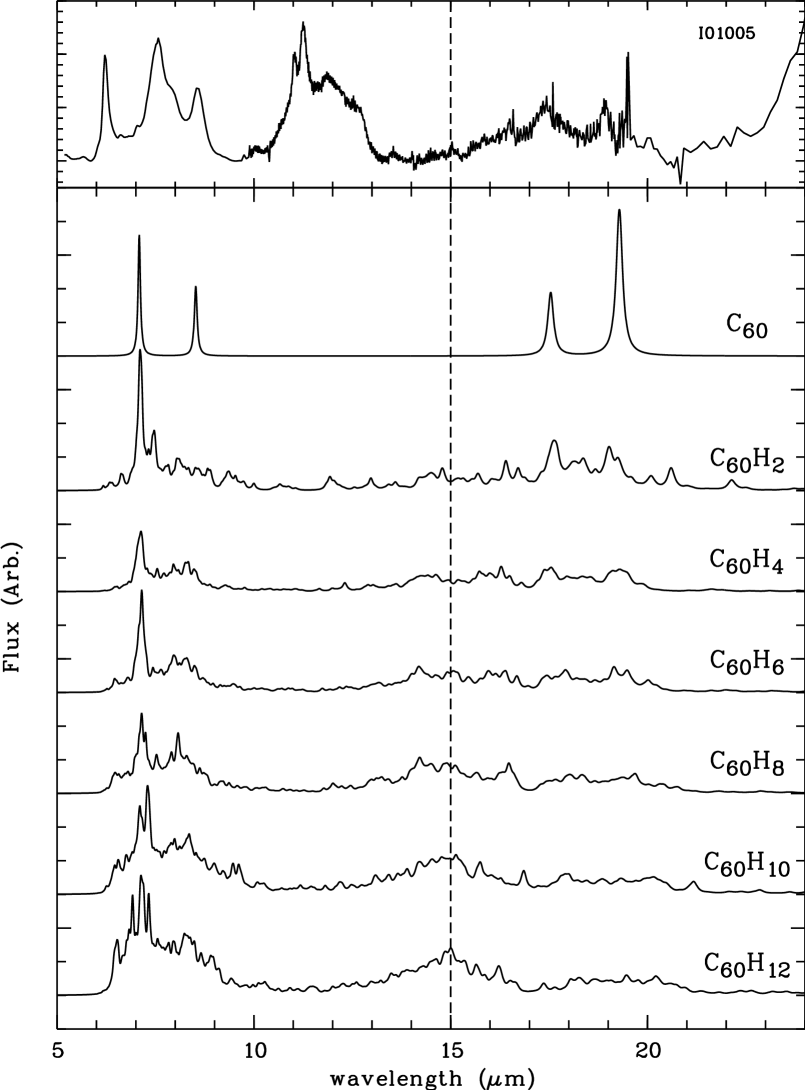
Due to the intrinsic weakness in C–H stretching intensities of the fulleranes with low hydrogen content, the non-detection of the 3.4 m in two C60 sources (Díaz-Luis et al., 2016) cannot be used to infer their absence, and the search should be focused on the spectral range at longer wavelengths. Figure 6 shows the theoretical spectra of C60 and C60Hm in the 5–24 m region. For comparison, we have also plotted the continuum-subtracted Spitzer spectrum of IRAS 010057910 (see Zhang & Kwok, 2011, for details). Because of its high degree of symmetry, C60 has only four infrared-active and ten Raman-active vibrational modes. All the infrared-active bands, except the one badly blended with the Unidentified Infrared Emission (UIE) band at 8.6 m, are clearly detected in IRAS 010057910. With hydrogenation, the symmetry of C60 backbone is broken, and thus some Raman-active modes become infrared-active. It is expected that CH bending coupled with C60 skeletal vibrational modes could produce a large number of bands in this spectral region.
From Figure 6, we can see broad emission features around 8, 15, and 20 m in most of the fulleranes, which are qualitatively consistent with the experimental spectra of Iglesias-Groth et al. (2012). Indeed, these broad features are also present in the spectrum of IRAS 010057910. However, since plateau features, especially those at 8 and 12 m, can also be manifestation of aliphatic CH bending modes (Kwok et al., 2001) or the effects of anharmonicity and Fermi resonance in hot ordinary PAH (see Maltseva et al., 2015, for a study of the plateau in the 3 m region), we cannot uniquely attribute the plateau features in IRAS 010057910 to C60Hm. Below, we will discuss the origin of all three features.
The 8 m feature: vibrations around 8 m are generally due to C–H bending modes, along directions parallel to the tangential plane of the carbon sphere. A broad 6–9 m feature is generally apparent in the spectra of fullerene-rich planetary nebulae in the Magellanic Clouds (García-Hernández et al., 2012), which seems to resemble the theoretical spectra of fulleranes.
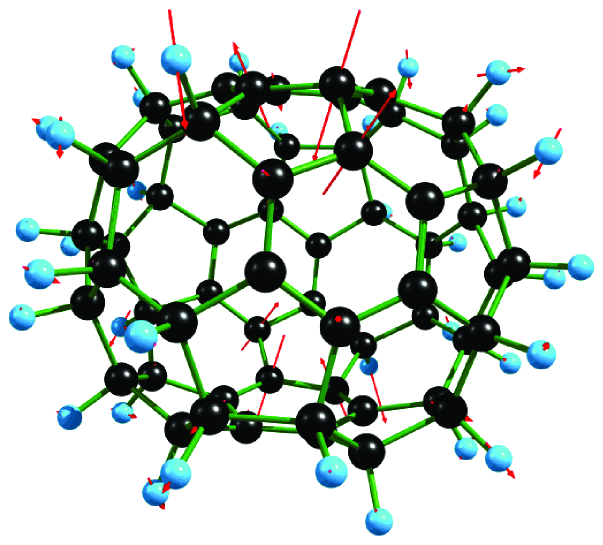
The 15 m feature: this feature arises from the breathing mode (sometimes referred to as radial mode) of carbon atoms where the skeleton inflate and deflate, coupled with peripheral CH bending motion. A schematic illustration of this mode for C60H36 is shown in Figure 7.
The 20 m feature: vibrational modes in the 20 m region are generally carbon skeleton deformation modes, where the angular and length separations between carbon atoms change with vibration. There is a well-known unidentified broad emission feature – known in the literature as the 21-m feature – in this region (Kwok et al., 1989). The feature has been attributed to fulleranes by Webster (1995) based on force-field and elastic-shell models. Our calculations show that fulleranes can indeed produce broad features spanning the wavelength range 17–23 m. However, the profiles and peak positions of fulleranes vary greatly from one species to another, in contrast to the consistant peak wavelength and feature profiles of the observed 21 m feature (Volk et al., 1999). We are unable to reproduce the observed 21-m feature profiles with one, or the sum of more, theoretical fullerane spectra. This, together with the fact that there is no correlation between the 21 m feature and C60 (Zhang et al., 2010; Zhang & Kwok, 2011), lead us to conclude that fulleranes are not the carrier of the 21 m feature.
3.3 Spectral variation among isomers of C60H18
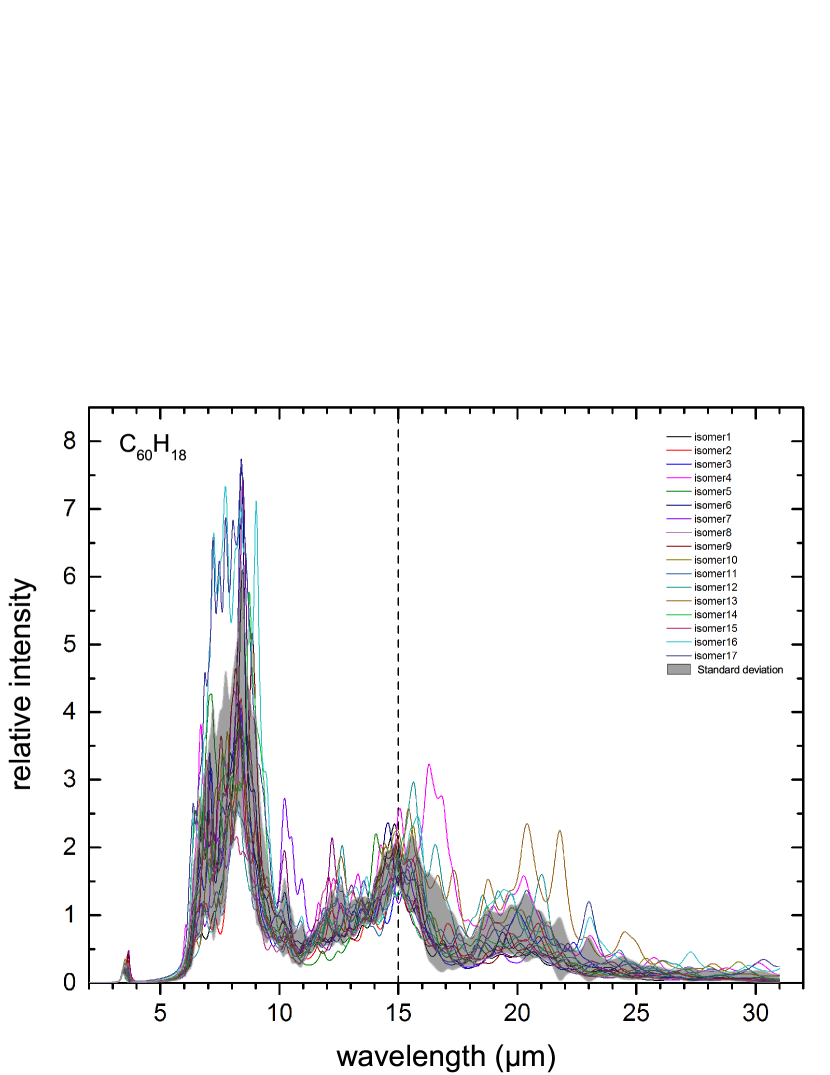
In order to assess the degree of spectral variation in different fullerane isomers, we have expanded the number of isomer from 5 to 20 for C60H18 (Figure 8). The relative energy values of these twenty isomers expand a range of 80 kcal/mol (corrected for zero point energy). Together with direct comparison of molecular geometries parameters, this ensures the acceptable structural diversity of among these isomers. The theoretical spectra of these 20 isomers are shown in Figure 9. Also plotted is the area (shown in grey) covered by one-standard-deviation of the 20 spectra. All four dominant features around 3, 8, 15, and 20 m are present, regardless of the variation in values. These results suggest that the existence of the features is not specific to a particular isomer. Specifically, the broad feature around 8 m is the strongest one, followed by the feature that peaks around 15 m. Unlike the 15 m feature, the features around 20 m vary greatly in intensities and peak positions among the isomers. The intensities of the 3.4 m feature are not sensitive to the specific isomer.
3.4 Spectra of fullerane cations
In order to test the possible effect of ionization on the spectral behavior of fulleranes, we have computed the spectra of two ionized species with low and high degree of hydrogenation : C60H and C60H starting from the geometries of their lowest energy neutral isomers (isomer1). It is well known that due to theoretical limitations in dealing with the electronic energy states close to the ground one that arise in fullerenes and fulleranes when they have an open-shell electronic structure, the wavelengths and intensities of the C–C vibrations are not accurate (Pauzat, 2011). Consequently, we focus only on the C–H stretching bands in the 3–4 m wavelength range. From results of DFT calculations, we obtain co-added intensities of 8.4305, 21.0465, 1265.5103, and 533.8743 km mol-1 for the 3–4 m features of C60H2, C60H, C60H36, and C60H, respectively. The theoretical spectra of these molecules are shown in Figure 10. We can see from the figure that the peak positions and profiles appear to be invariant between neutral and ionized fulleranes, which could be attributed to the same geometries and symmetries. However, the change in intensity of the 3–4 m features upon ionization is not simple. C60H shows a decrease in intensity of its C–H stretching bands, while the opposite is true for C60H. Such a spectral behavior is different from that of PAH molecules where the C–H stretching modes are suppressed in ions. Such suppression is not a direct result of ionization, but rather the result of changes of electronic structures upon ionization (Pauzat et al., 2010). Specifically, band intensities reflect the distortion of electronic density with internal displacements of the nuclei. More thorough studies of fullerane cations are required to determine the effects of ionization and how such changes depend on specific isomers and hydrogen contents.
4 Discussions
4.1 Origin of the scatter of observed band ratios in C60 sources
The fullerene (C60) molecule was detected through their four infrared-active bands due carbon skeletal modes. These four bands are still visible for slightly hydrogenated C60, but gradually fade with increasing hydrogenation (Figure 6). It is therefore possible that the astronomical C60 bands reported in the literature could actually arise in part from slightly hydrogenated C60. This suggests that C60 and its hydrogenated derivatives may be more prevalent than previously believed as progressive hydrogenation would make the four infrared bands more difficult to detect.
In Figure 11, we quantitatively compare the variations of the intrinsic strengths of the four bands as functions of the values. It is shown that the total intrinsic strengths decrease with increasing hydrogenation, and the intrinsic strengths of individual bands have different dependencies. The bands at longer wavelengths appear to weaken more rapidly compared to the 7.0 m feature. With increasing hydrogenation, the intensity of the 7.0 m band decreases by a factor of about 1.5 and then remains nearly constant until , while the intensities of the 18.9 and 17.4 m bands continually decrease by more than one order of magnitude. Therefore, the relative strengths of the four skeletal bands are different for C60 and C60Hm.
The observed relative strengths of the four C60 bands have been used to infer excitation mechanisms of the molecule (Bernard-Salas et al., 2012; García-Hernández et al., 2012; Roberts et al., 2012; Zhang & Kwok, 2013). However, it is difficult to distinguish between fluorescence and thermal excitation mechanisms because of the uncertainties in the intrinsic band strengths. This problem was recently re-examined by Brieva et al. (2016), who presented new laboratory measurements of the intrinsic strengths. Even using the latest data, the observed band ratios are too dispersed to be assigned to either fluorescence or thermal excitation models. Brieva et al. (2016) attributed this inconsistency to contamination of the band strengths from UIE or other emissions, which if true would severely limit the utility of C60 infrared bands as a probe of physical conditions in circumstellar environments.
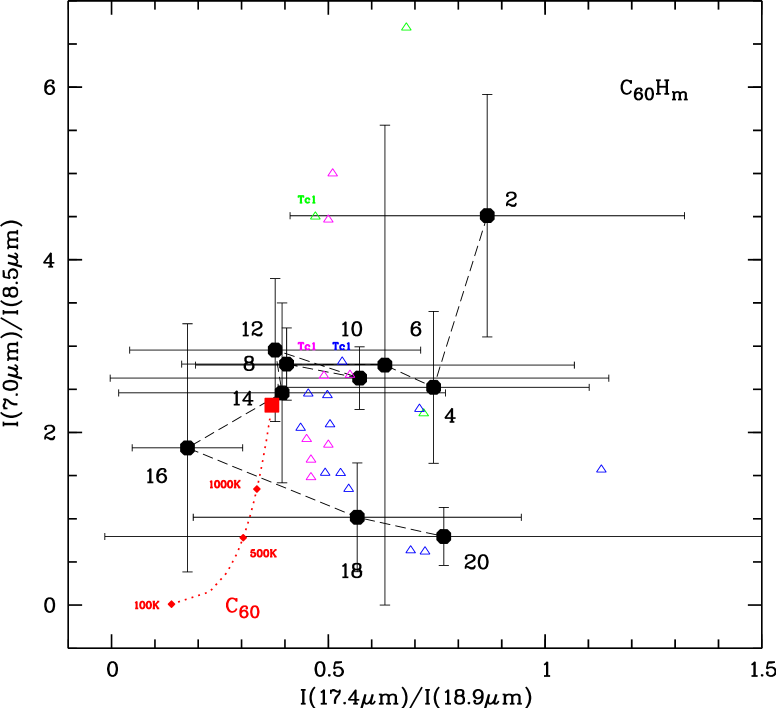
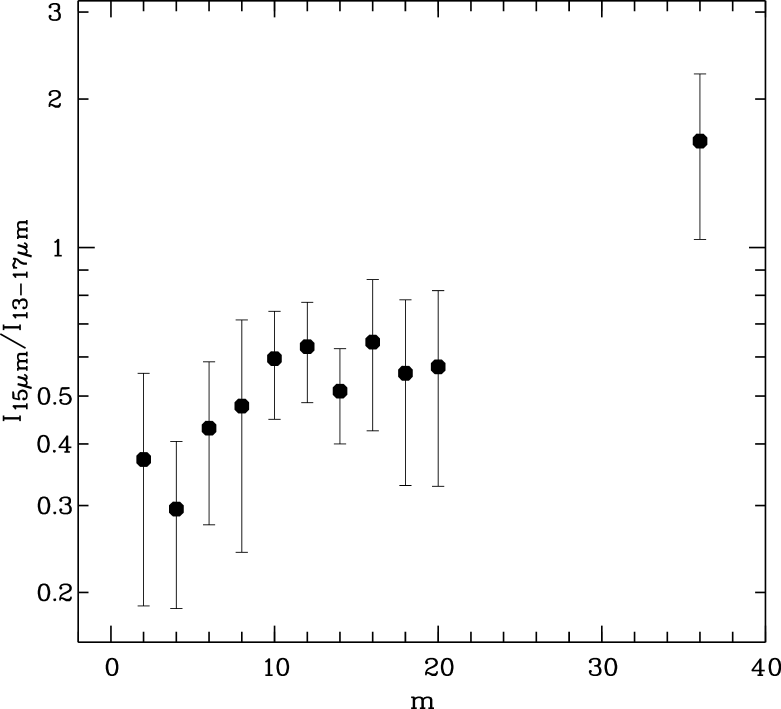
In Figure 12 we investigate the possibility of whether the hydrogenation of C60 may play a role in the wide scatter of the observed band ratios. The observed band ratios are taken from Bernard-Salas et al. (2012), García-Hernández et al. (2012), and Otsuka et al. (2014). We should note that even for the strong C60-source Tc 1, different authors report different 7.0 m/8.5 m band ratios partly due to different ways of subtracting other line contributions. The variation of the band ratios as a function of temperature under the thermal excitation model is plotted. We note that the predicted band ratios by fluorescence model are very close to those by thermal model (Brieva et al., 2016). Figure 12 shows that the large scatter of the observed 17.4 m/18.9 m band ratios cannot be accounted by the model characterized by single parameter (i.e. average photon energy and temperature for fluorescence and thermal model, respectively). However, the inconsistency can be explained by hydrogenation effects. First, different hydrogenation degrees and diverse isomers of C60Hm can contribute to the scatter of the observed band ratios. Secondly, most of C60Hm show larger theoretical 17.4 m/18.9 m band ratios than C60. The fact that the observed data lie within the range covered by the theoretical values of C60Hm in Figure 12 suggests that hydrogenated C60 may be present in these sources and contribute to the observed infrared bands.
4.2 Search for circumstellar C60Hm
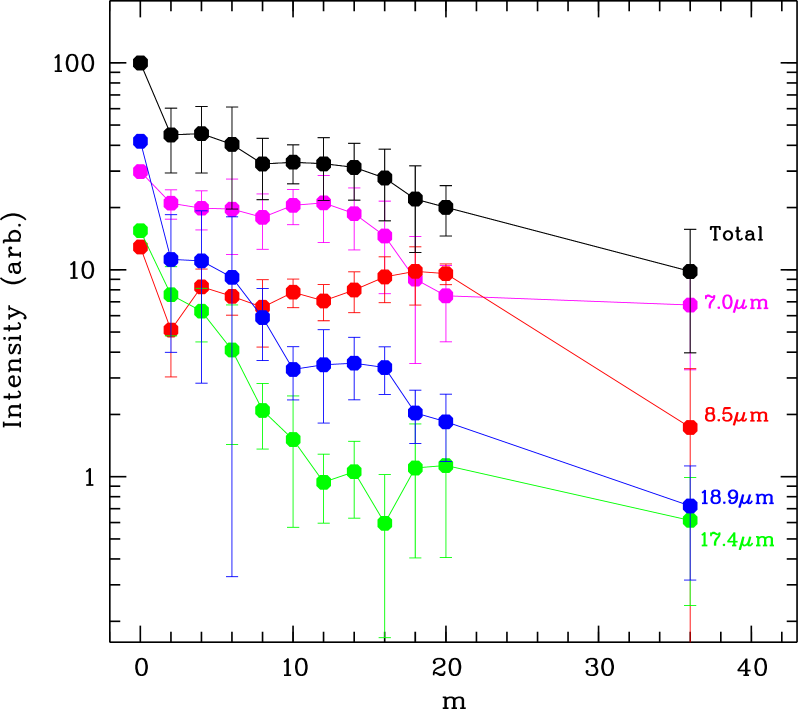
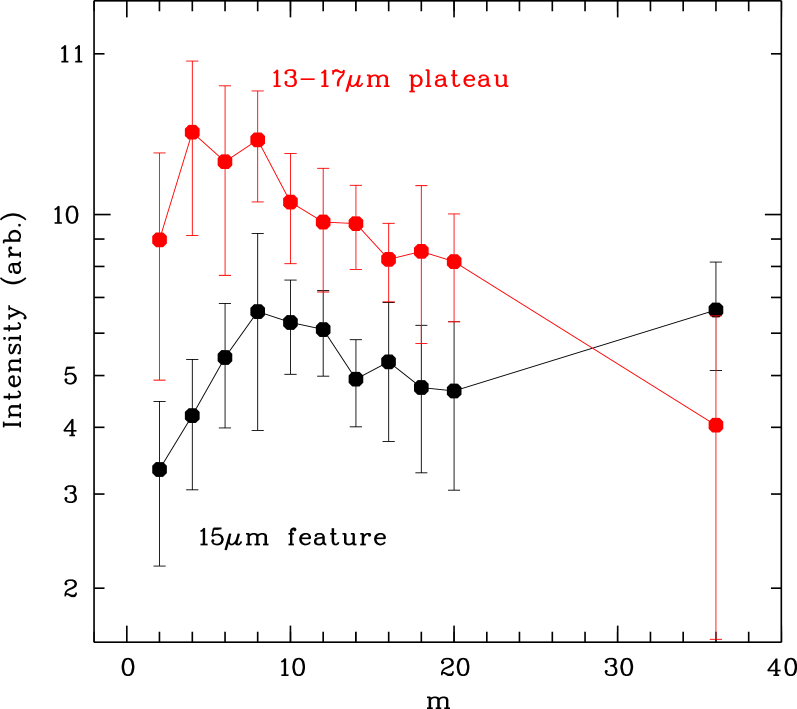
One of the major challenges in searching for circumstellar C60Hm is the large number of isomers. Although C60H36 and C60H18 are the dominant products of the experiments of C60 exposed to hydrogen atoms, the physical conditions of circumstellar envelopes are very different from those in a terrestrial laboratory. Given the very low densities in circumstellar envelopes, the less stable fulleranes are likely to be present. Through averaging the theoretical spectra of different isomers (Figure 6), the bands that are commonly present in all the isomers can serve as guides for the search of circumstellar C60Hm. One of the distinctive features of the fullerane spectra is the emergence of a 13–17 m plateau (Figure 6). As the number of H atoms increases, a band at 15 m becomes more prominent. The variation of strengths of the 15 m and the 13–17 m plateau features with the values are illustrated in Figures 13 and 14. We can see that the plateau feature is generally stronger than the 15 m band except for C60H36. For heavily hydrogenated C60, the 15 m band clearly stands out from the plateau.
The 15 m feature is unique to fulleranes. There is no known aromatic molecules having strong bands at 15 m. The bending modes of aliphatic compounds are concentrated around 8 and 12 m. CO2 has a band at this wavelength, but it is not expected in carbon-rich environments. Thus the 15 m band might serve as a useful probe of heavily hydrogenated C60 in circumstellar envelopes.
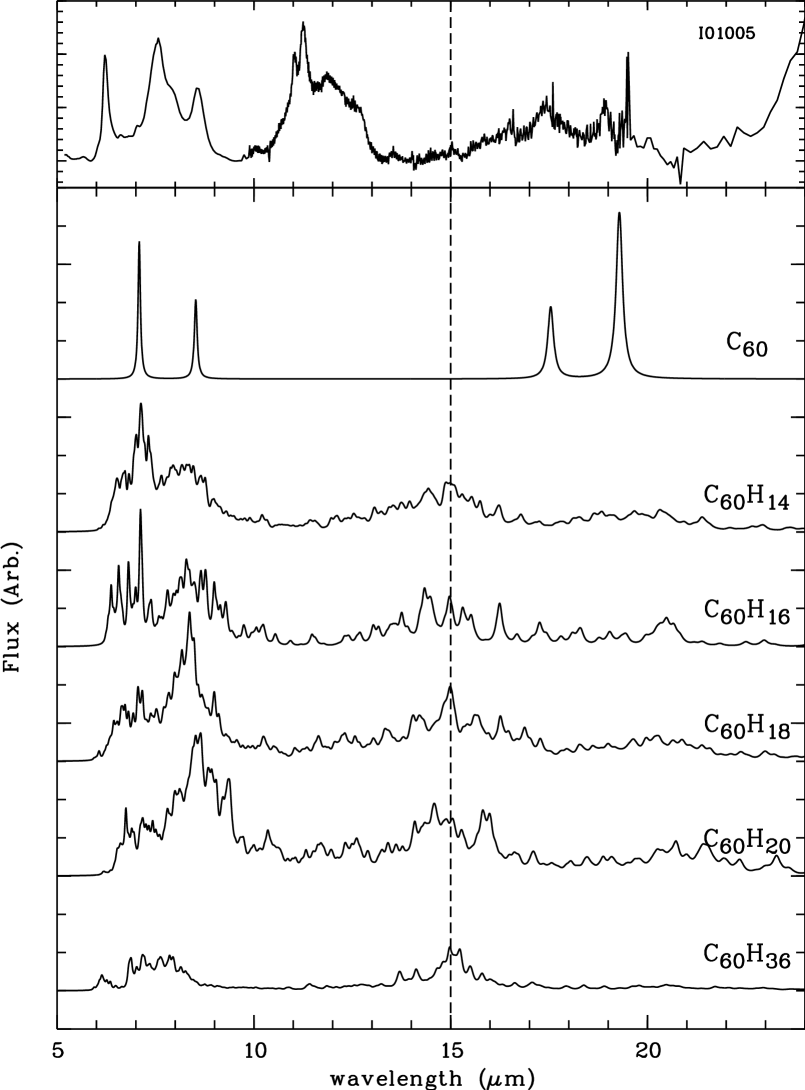
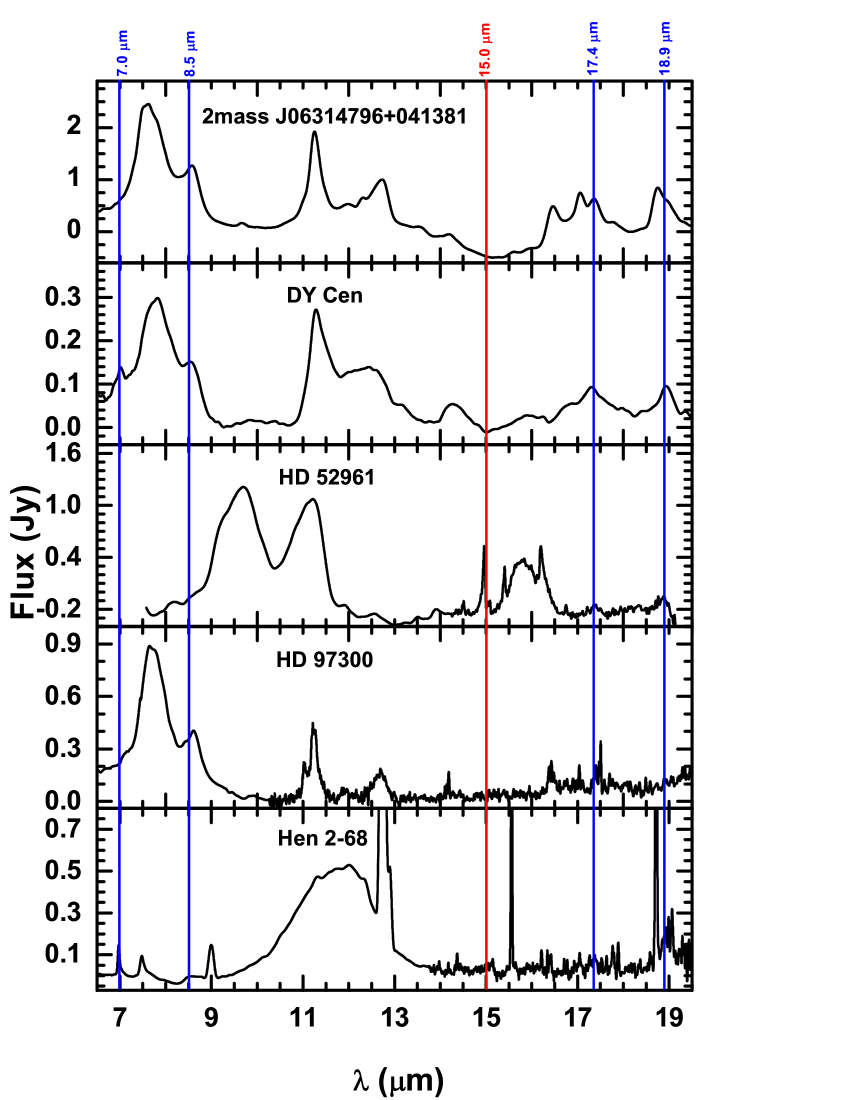
We have undertaken a search for the 15 m band in known C60 sources (Appendix A). The exact positions of the vibrational bands in theoretical spectra are affected by the scaling factor applied (section 2) and this is evident in the slight wavelength differences seen in the theoretical and experimental wavelengths spectra of C60 (Figure 3). Consequently, we cannot take the peak wavelength of 15 m as the definitive signature of fullerane . Nevertheless, we note that several objects display features with wavelengths close to 15 m. Three C60-containing objects (IRAS 01005+7910, IRAS 06338+5333, NGC 7023) display a feature at 15 m. 555 We note that the 8.5 m features in the three sources are badly blended with at 8.6 m UIE band and the 7 m features are also blended with H2 S(5) at 6.91 m line and thus the three sources are not included in Fig. 12. We note that none of these three objects have a hot central star, which is consistent with the suggestion of Díaz-Luis et al. (2016) that fulleranes are quickly destroyed by increasing UV radiation. Given the weakness of the features, we must regard the detections in the three sources as tentative.
Since hydrogenation can greatly suppress the four C60 skeletal bands, the search for fullerane should not be limited to sources showing the four C60 bands. A more extensive search for the 15 m band should be conducted for a wider range of objects.
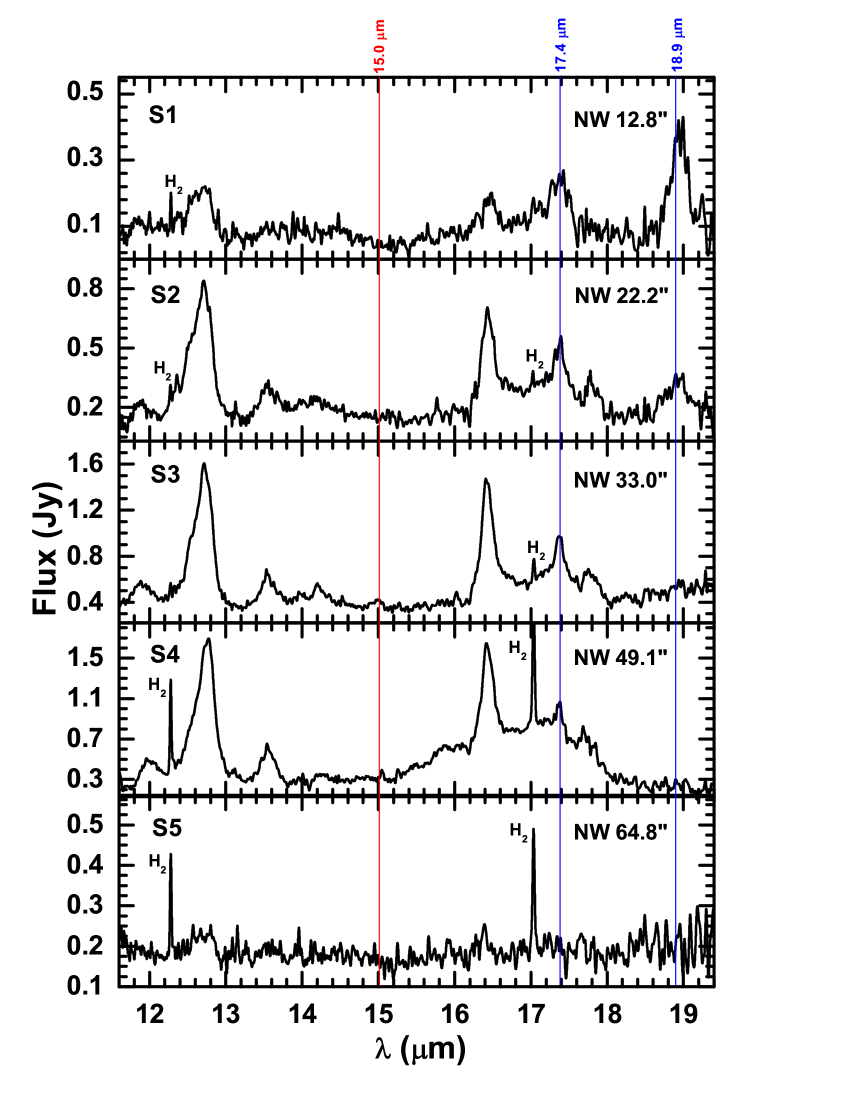
In the case of NGC 7023, spatially resolved spectra are available (Appendix B). Figure 15 shows 5 spectra of NGC 7023, from closest to the central star (‘S1’, top panel) to farthest from the central star (‘S5’, bottom panel). We can see that the 15 m feature appears in positions ‘S3’ and ‘S4’, where the C60 emission is becoming weak and H2 emission is appearing. Sellgren et al. (2010) have shown that, compared to H2 emission, the 18.9 m C60 feature lies closer to the central star where UV radiation is more intense, while the UIE bands peak between the C60 and H2 emission. Figure 15 indicates that the 15 m feature and UIE are roughly co-spatial, supporting the idea that the preferential conditions for the presence of fulleranes are H atom rich and void of intense UV radiation. The observed feature is relative narrow, suggesting that C60Hm isomers, if exist, are not very diverse, and the physical conditions favor the formation of specific chemical structures.
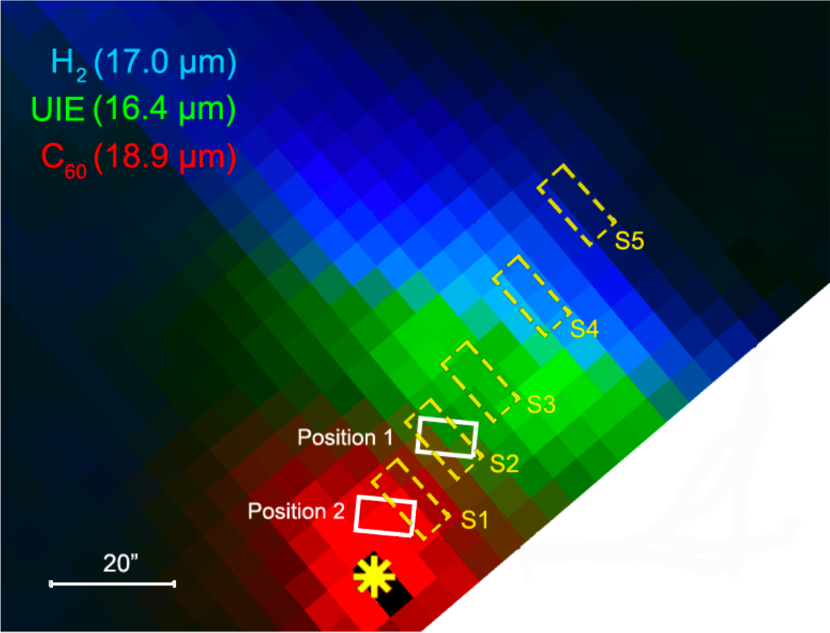
We note that Berné et al. (2013) detected C in the spectrum at 7.5 north-west from the central star of NGC 7023 (position 2 of their Figure 1). Figure 16 shows that the C, C60, UIE, and H2 emission regions are spatially segregated in NGC 7023, suggesting that photochemsitry plays a role in the formation of fullerenes. In the hypothesis of PAH being the carrier of UIE bands, fullerenes are formed in a top-down process where large PAHs are dehydrogenated by UV radiation, followed by carbon atom ejection and isomerisation (Berné & Tielens, 2012). If our detection and identification of the 15 m feature is correct, this scenario is contradicted by our observations of the 15 m fullerane feature being coincident with the distribution of the UIE bands. Alternatively, fullerenes/fulleranes are formed by the photochemical effects on mixed amorphous aromatic/aliphatic compounds (García-Hernández et al., 2010; Micelotta et al., 2012; Zhang & Kwok, 2013). More theoretical work is needed to further pursue this idea.
5 Summary
Fulleranes are potentially an important constituents of the interstellar medium for their possible role in the formation of molecular hydrogen and their relationships to the carriers of the UIE and DIB phenomena (Cataldo & Iglesias-Groth, 2010). There are also strong theoretical and experimental reasons to believe that fulleranes are widely present in the circumstellar and interstellar environments. However, the search for circumstellar fulleranes has so far been hindered by the lack of detailed knowledge of their spectra. In this paper we performed a theoretical investigation of the vibrational spectra of fulleranes using quantum chemistry methods. The results show that hydrogenation can have a significant effect on the determinations of abundance and excitation mechanism of C60. The inconsistent C60 band ratios between observations and model predictions might be an indirect proof for the existence of slightly hydrogenated C60.
A feature at 3.4 m due to C–H stretching modes is generally present in the spectra of all fulleranes. Also noticeable are broad features around 8, 15, and 20 m, which arise from C–H bending modes, carbon skeleton radial modes, and carbon skeleton deformation modes, respectively. The strength of the 15 m increases with increasing hydrogenation might possibly be a tracer of fulleranes. A spectral search suggests that this feature is present in three C60-containing nebulae with no strong UV radiation background.
One of the major challenges in the study of astronomical fulleranes is the large (up to as shown in Figure 1) number of isomers, making theoretical calculations on all isomers impossible. In this paper, we have limited our study to isomers of lowest energies. Our results show definite spectral trends with progressive hydrogenation. The astronomical implications on the C60 skeletal bands are therefore likely to be independent on the selection of specific isomers. We plan to extend our computation to more fulleranes including different numbers of carbon and hydrogen atoms as well as different bond arrangements.
Appendix A A search for the 15 m feature in C60 sources
We examined the infrared spectra of 35 sources that have been reported to contain C60 emission to search for the fullerane 15 m feature. The C60 source list (Table 1) includes young stellar objects (YSOs), Herbig Ae/Be star (HAe/Be), planetary nebulae (PNs), post-asymptotic giant branch stars (PAGBs), proto planetary nebula (PPN), R Coronae Borealis star (RCB), binary, and reflection nebula (RN). The objects are classified as carbon-rich (C) or mixed chemistry (M) (column 4 of Table 1) based on other spectral features in the infrared spectra. The spectra were extracted from the Infrared Space Observatory (ISO) and Spitzer archives.
Three objects (IC 418, HR 4049, and NGC 7023) in our sample were observed between 1996 June and 1998 February using ISO Short-Wavelength Spectrometer (SWS). The observations were performed using the Astronomical Observation Template (AOT) 01 mode at various speeds with spectral resolving power (/) ranging from 500 to 1600, covering a wavelength range from 2.4–45.2 . The aperture sizes are 14 20 for 2.4–12 region and 14 27 for 11–28 band in SWS module, respectively, and the exposures on sources of the measurements varied between 1834 s and 6538 s, depending on the source brightnesses. The observations for all objects are centered on the core positions. The data reduction and calibration were performed through the standard procedure.
The mid-infrared spectra of the other 32 objects in Table 1 are obtained with the Infrared Spectrograph (IRS) on board the Spitzer Space Telescope. All of these objects were observed using the Short-Low (SL) and Short-High (SH) modules, covering the wavelength coverage 5.2–19.6 with spectral dispersion of 64–600. The aperture sizes are 36 57 and 47 113 in SL and SH modules, respectively, and the total integration times of IRS observations range from 39 s to 2462 s, depending on the sources’ expected mid-infrared fluxes. Data were reduced starting with basic calibrated data from the Spitzer Science Center’s pipeline version s18.7 and were run through the IRSCLEAN program to remove rogue pixels. Then we employed point-source spectral extractions to extract spectra using the Spectral Modeling, Analysis and Reduction Tool. A final spectrum was produced using the combined IRS observations to improve the S/N.
Figure 17 shows the spectra of the 35 objects. The continua were fitted with a third-order polynomial and subtracted from the spectra. The positions of the four C60 bands and the 15 m feature are marked with vertical lines. The search results are given in column 3 of Table Search for Hydrogenated C60 (fulleranes) in Circumstellar Envelopes, where ticks indicate tentative detections and colons indicate marginal or uncertain detections.
Appendix B The spatially resolved spectra of NGC 7023
Infrared spectroscopic observations of NGC 7023 were carried out by the IRS onboard the Spitzer Space Telescope in the spectral mapping mode on 2004 August (AOR 3871232). We extracted five high-resolution spectra at different positions, which were taken with the SH module covering the wavelength range 9.9–19.6 m. The slit sizes are and the exposure time of each spectrum is 20 s. Data were reduced using basic calibrated data from the Spitzer Science Center’s pipeline version s18.8 and the IRSCLEAN program for removing rogue pixels was performed. A low-order polynomial fit was applied to subtract the continuum. These spatially resolved spectra are shown in Figure 15.
Appendix C Online database
A database of infrared spectra of fulleranes is presented as online supplementary material.
References
- Berné et al. (2013) Berné, O., Mulas, G., & Joblin, C. 2013, A&A, 550, L4
- Berné & Tielens (2012) Berné, O., & Tielens, A. G. G. M. 2012, PNAS, 109, 401
- Bernard-Salas et al. (2012) Bernard-Salas, J., Cami, J., Peeters, E., et al. 2012, ApJ, 757, 41
- Bonchev & Rouvray (1995) Bonchev, D., & Rouvray D. H. 1995, Chemical Group Theory: Techniques and Applications, Gordon and Breach Science Publishers
- Brieva et al. (2016) Brieva, A. C., Gredel, R., Jäger, C., Huisken, F., & Henning, T. 2016, ApJ, 826, 122
- Cami et al. (2010) Cami, J., Bernard-Salas, J., Peeters, E., & Malek, S. E. 2010, Science, 329, 1180
- Campbell et al. (2015) Campbell, E. K., Holz, M., Gerlich, D., & Maier, J. P. 2015, Nature, 523, 322
- Campbell et al. (2016a) Campbell, E. K., Holz, M., & Maier, J. P. 2016a, ApJ, 826, L4
- Campbell et al. (2016b) Campbell, E. K., Holz, M., Maier, J. P., et al. 2016b, ApJ, 822, 17
- Cataldo & Iglesias-Groth (2009) Cataldo, F., & Iglesias-Groth, S. 2009, MNRAS, 400, 291
- Cataldo & Iglesias-Groth (2010) Cataldo, F., & Iglesias-Groth, S., 2010, Fulleranes: The Hydrogenated Fullerenes. Springer, Berlin
- Cataldo et al. (2009) Cataldo, F., Strazzulla, G., & Iglesias-Groth, S. 2009, MNRAS, 394, 615
- Díaz-Luis et al. (2015) Díaz-Luis, J. J., García-Hernández, D. A., Kameswara Rao, N., Manchado, A., & Cataldo, F. 2015, A&A, 573, A97
- Díaz-Luis et al. (2016) Díaz-Luis, J. J., García-Hernández, D. A., Manchado, A., & Cataldo, F. 2016, A&A, 589, A5
- Evans et al. (2012) Evans, A., van Loon, J. T., Woodward, C. E., et al. 2012, MNRAS, 421, L92
- Foing & Ehrenfreund (1994) Foing, B. H., & Ehrenfreund, P. 1994, Nature, 369, 296
- Frisch et al. (2009) Frisch, M. J., Trucks, G. W., Schlegel, J. B., et al. 2009, Gaussian 09, Revision C.01 (Wallingford, CT: Gaussian, Inc.)
- Fulara et al. (1993) Fulara, J., Jakobi, M., & Maier, J. P. 1993, CPL, 211, 227
- García-Hernández et al. (2011a) García-Hernández, D. A., Iglesias-Groth, S., Acosta-Pulido, J. A., et al. 2011a, ApJ, 737, L30
- García-Hernández et al. (2011b) García-Hernández, D. A., Kameswara Rao. N., & Lambert, D. L., 2011b, ApJ, 729, 126
- García-Hernández et al. (2010) García-Hernández, D. A., Manchado, A., García-Lario, P., et al. 2010, ApJ, 724, L39
- García-Hernández et al. (2012) García-Hernández, D. A., Villaver, E., García-Lario, P., et al. 2012, ApJ, 760, 107
- Goldshleger & Moravsky (1997) Goldshleger, N. F., & Moravsky, A. P. 1997, Russian Chemical Reviews, 66, 323
- Gielen et al. (2011) Gielen, C., Cami, J., Bouwman, J., Peeters, E., & Min, M. 2011, A&A, 536, A54
- Herbig (2000) Herbig, G. H. 2000, ApJ, 542, 334
- Iglesias-Groth (2007) Iglesias-Groth, S. 2007, ApJ, 661, L167
- Iglesias-Groth et al. (2012) Iglesias-Groth, S., García-Hernández, D. A., Cataldo, F., & Manchado, A. 2012, MNRAS, 423, 2868
- Iglesias-Groth & Esposito (2013) Iglesias-Groth, S., & Esposito, M. 2013, ApJ, 776, L2
- Jensen (2001) Jensen, F. 2001, JChPh, 115, 9113
- Jensen (2002) Jensen, F. 2002, JChPh, 116, 7372
- Kroto et al. (1985) Kroto, H. W., Heath, J. R., Obrien, S. C., Curl, R. F., & Smalley, R. E. 1985, Nature, 318, 162
- Kwok et al. (1989) Kwok, S., Volk, K., & Hrivnak, B. J. 1989, ApJ, 345, L51
- Kwok et al. (2001) Kwok, S., Volk, K., & Bernath, P. 2001, ApJ, 554, L87
- Kwok (2004) Kwok, S. 2004, Nature, 430, 985
- Laury (2012) Laury, M. L., Carlson, M. J., & Wilson, A. K. 2012, JCoCh, 33, 2380
- Maltseva et al. (2015) Maltseva, E., Petrignani, A., Candian, A., et al. 2015, ApJ, 814, 23
- Micelotta et al. (2012) Micelotta, E. R., Jones, A. P., Cami, J., et al. 2012, ApJ, 761, 35
- Omont (2016) Omont, A. 2016, A&A, 590, A52
- Otsuka et al. (2013) Otsuka, M., Kemper, F., Hyung, S., et al. 2013, ApJ, 764, 77
- Otsuka et al. (2014) Otsuka, M., Kemper, F., Cami, J., Peeters, E., & Bernard-Salas, J. 2014, MNRAS, 437, 2577
- Otsuka et al. (2016) Otsuka, M., Kemper, F., Leal-Ferreira, M. L., et al. 2016, MNRAS, 462, 12
- Pauzat (2011) Pauzat, F. 2011, EAS Publications Series, 46, 75
- Pauzat et al. (1995) Pauzat, F., Talbi, D., & Ellinger, Y. 1995, A&A, 293, 263
- Pauzat et al. (2010) Pauzat, F., Pilmé, J., Toulouse, J., & Ellinger, Y. 2010, J. Chem. Phys., 133, 054301
- Pogulay et al. (2004) Pogulay, A. V., Abzalimov, R. R., Nasibullaev, S. K. et al. 2004 International Journal of Mass Spectrometry 233, 165
- Roberts et al. (2012) Roberts, K. R. G., Smith, K. T., & Sarre, P. J. 2012, MNRAS, 421, 3277
- Rüchardt et al. (1993) Rüchardt C., Gerst, M., Ebenhoch, J. et al. 1993, Agnew. Chem. Int. Ed. Engl., 32, 584
- Sadjadi et al. (2015) Sadjadi, S., Zhang, Y., & Kwok, S. 2015, ApJ, 801, 34
- Sellgren et al. (2010) Sellgren, K., Werner, M. W., Ingalls, J. G., Smith, J. D. T., Carleton, T. M., & Joblin, C. 2010, ApJ, 722, L54
- Snow & Seab (1989) Snow, T. P., & Seab, C. G. 1989, A&A, 213, 291
- Strelnikov et al. (2015) Strelnikov, D., Kern, B., & Kappes, M. M. 2015, A&A, 584, A55
- Volk et al. (1999) Volk, K., Kwok, S., & Hrivnak, B. J. 1999, ApJ, 516, L99
- Walker et al. (2015) Walker, G. A. H., Bohlender, D. A., Maier, J. P., & Campbell, E. K. 2015, ApJ, 812, L8
- Webster (1992) Webster, A. 1992, MNRAS, 257, 463
- Webster (1995) Webster, A. 1995, MNRAS, 277, 1555
- Zhang & Kwok (2011) Zhang, Y., & Kwok, S. 2011, ApJ, 730, 126
- Zhang & Kwok (2013) Zhang, Y., & Kwok, S. 2013, EP&S, 65, 1069
- Zhang et al. (2010) Zhang, Y., Kwok, S., & Hrivnak, B. J. 2010, ApJ, 725, 990
- Zerenturk & Berber (2012) Zerenturk, A., & Berber, S. 2012, Solid State Communications, 152, 1522
- Zinner (1998) Zinner, E. 1998, Annual Review of Earth and Planetary Sciences, 26, 147
- Zvereva et al. (2011) Zvereva, E. E., Shagidullin, A. R., & Katsyuba, S. A. 2011, J. Phys. Chem. A , 115, 63
| Name | Instrument | 15.0 | Classa | Object Type | Reference |
|---|---|---|---|---|---|
| 2MASS J06314796+0419381 | Spitzer IRS | … | M | YSO | (1) |
| DY Cen | Spitzer IRS | … | C | RCB | (2) |
| HD 52961 | Spitzer IRS | M | PAGB | (3) | |
| HD 97300 | Spitzer IRS | … | C | HAe/Be | (1) |
| Hen 2-68 | Spitzer IRS | C | PN | (4) | |
| HR 4049 | ISO SWS | M | PAGB | (1) | |
| IC 418 | ISO SWS | C | PN | (4) | |
| IRAS 01005+7910 | Spitzer IRS | d | C | PPN | (5) |
| IRAS 06338+5333 | Spitzer IRS | d | M | PAGB | (3) |
| ISOGAL-P J174639.6-284126 | Spitzer IRS | M | YSO | (1) | |
| K 3-54 | Spitzer IRS | … | C | PN | (6) |
| K 3-62 | Spitzer IRS | … | C | PN | (4) |
| Lin 49 | Spitzer IRS | … | C | PN | (7) |
| LMC 02 | Spitzer IRS | … | C | PN | (6) |
| LMC 25 | Spitzer IRS | … | C | PN | (6) |
| LMC 48 | Spitzer IRS | … | C | PN | (6) |
| LMC 99 | Spitzer IRS | … | C | PN | (6) |
| M 1-6 | Spitzer IRS | … | C | PN | (4) |
| M 1-9 | Spitzer IRS | … | C | PN | (4) |
| M 1-11 | Spitzer IRS | C | PN | (4) | |
| M 1-12 | Spitzer IRS | … | C | PN | (4) |
| M 1-20 | Spitzer IRS | … | C | PN | (4) |
| M 1-60 | Spitzer IRS | … | C | PN | (6) |
| NGC 7023 | ISO SWS | d | C | RN | (8) |
| Spitzer IRS | d | C | RN | (8) | |
| SaSt 2-3 | Spitzer IRS | … | C | PN | (4) |
| SMC 13 | Spitzer IRS | … | C | PN | (6) |
| SMC 15 | Spitzer IRS | … | C | PN | (6) |
| SMC 16 | Spitzer IRS | … | C | PN | (6) |
| SMC 18 | Spitzer IRS | … | C | PN | (6) |
| SMC 20 | Spitzer IRS | … | C | PN | (6) |
| SMC 24 | Spitzer IRS | … | C | PN | (6) |
| SMC 27 | Spitzer IRS | … | C | PN | (6) |
| SSTGC 372630 | Spitzer IRS | … | M | YSO | (1) |
| Tc 1 | Spitzer IRS | C | PN | (9) | |
| XX Oph | Spitzer IRS | … | M | Binary | (10) |
References. — (1) Roberts et al. (2012); (2) García-Hernández et al. (2011); (3) Gielen et al. (2011); (4) Otsuka et al. (2014); (5) Zhang & Kwok (2011); (6) García-Hernández et al. (2012); (7) Otsuka et al. (2016); (8) Sellgren et al. (2010); (9) Cami et al. (2010); (10) Evans et al. (2012).
|
|