11email: wiseman@mpe.mpg.de 22institutetext: Astrophysics Research Institute, Liverpool John Moores University, IC2, Liverpool Science Park, 146 Brownlow Hill, Liverpool L3 5RF, UK 33institutetext: Department of Astronomy and Astrophysics, UCO/Lick Observatory, University of California, 1156 High Street, Santa Cruz, CA 95064, USA 44institutetext: Instituto de Astrofísica de Andalucía (IAA-CSIC), Glorieta de la Astronomía s/n, 18008 Granada, Spain 55institutetext: Dark Cosmology Centre, Niels Bohr Institute, University of Copenhagen, Juliane Maries Vej 30, 2100 Copenhagen, Denmark
Gas inflow and outflow in an interacting high-redshift galaxy
We reveal multiple components of an interacting galaxy system at through a detailed analysis of the exquisite high-resolution Keck/HIRES spectrum of the afterglow of a gamma-ray burst (GRB). Through Voigt-profile fitting of absorption lines from the Lyman-series, we constrain the neutral hydrogen column density to cm-2 for the densest of four distinct systems at the host redshift of GRB 080810, among the lowest ever observed in a GRB host, despite the line of sight passing within a projected 5 kpc of the galaxy centres. By detailed analysis of the corresponding metal absorption lines, we derive chemical, ionic and kinematic properties of the individual absorbing systems, and thus build a picture of the host as a whole. Striking differences between the systems imply that the line of sight passes through several phases of gas: the star-forming regions of the GRB host; enriched material in the form of a galactic outflow; the hot and ionised halo of a second, interacting galaxy falling towards the host at a line-of-sight velocity of 700 km s-1; and a cool, metal-poor cloud which may represent one of the best candidates yet for the inflow of metal-poor gas from the intergalactic medium.
Key Words.:
galaxies: evolution – galaxies: interactions – gamma-ray burst: individual: 0808101 Introduction
Far from their historical description as ‘island Universes’, galaxies interact continuously with their immediate surroundings and their broader environments, known as the circumgalactic medium (CGM) and intergalactic medium (IGM). Over the past 40 years it has been established that continued accretion of fresh, metal-poor gas is required to fuel ongoing star formation in galaxies over cosmological timescales (Rees & Ostriker 1977; White & Rees 1978; White & Frenk 1991; Dekel et al. 2006). This star formation can be quenched and regulated by gaseous outflows and fountains which enrich the IGM and CGM with metals, via regulatory winds powered by supernovae (SNe), stellar winds and active galactic nuclei (e.g. Mathews & Baker 1971; Larson & B. 1974; Martin 1999; Dalla Vecchia & Schaye 2008, 2012). While observations of outflows have been made out to high redshifts (Shapley et al. 2003; Martin 2005; Weiner et al. 2009; Rubin et al. 2014; Finley et al. 2017), it is much harder to detect emission from infalling streams due to their lower surface brightness as a result of lower metallicity and volume filling factor, although it has been possible to identify infalling gas through absorption lines in individual galaxy spectra (Rubin et al. 2012).
Rather than observe galaxies and their CGM by their emission, it is possible to measure their properties by absorption if they line up with a bright, background point source such as a quasar (QSO) or gamma-ray burst (GRB). At sufficiently high redshift111Due to the large optical depth of the Earth’s atmosphere to wavelengths bluer than , Ly- is only visible from the ground at , some quasar spectra show the imprint of a dense column of neutral hydrogen in the form of a damped Lyman-alpha absorber (DLA), defined as a system with neutral hydrogen column density (Wolfe et al. 2005)222Throughout the paper, column densities are given in units of cm-2.
DLAs are associated with intervening galaxies between the observer and the QSO (Wolfe et al. 1986; Prochaska & Wolfe 1998), and are one of the most prominent tools used to study the properties of cold gas at high redshift (Dessauges-Zavadsky et al. 2006; Rafelski et al. 2012, 2014; De Cia et al. 2016). GRBs are produced during the deaths of very massive stars (Woosley & Bloom 2006), as proven by their association with type Ic supernovae (SNe; Galama et al. 1998; Hjorth et al. 2003; Greiner et al. 2015b; Cano et al. 2017). While QSO-DLAs tend to probe dense pockets in the outskirts of galaxies, the DLAs commonly seen in the afterglow spectra of GRBs represent the dense ISM and star-forming regions of their host galaxies (Fynbo et al. 2006; Prochaska et al. 2007b; Ledoux et al. 2009; Krühler et al. 2013). Along with detections of metal absorption lines redward of the Lyman-alpha (Ly-) feature, these absorption spectra can be used to calculate the metallicity (e.g. Savaglio et al. 2012; Cucchiara et al. 2015; Wiseman et al. 2017) and study the kinematics of the absorbing material (e.g. Prochaska et al. 2008).
Because QSO lines of sight (LOS) are random, there is no preference for the occurrence of DLAs. There are thus large samples of QSO-sub-DLAs, which are also known as super Lyman limit systems (SLLS; ; e.g. Peroux et al. 2007; Quiret et al. 2016). Similar studies extend to Lyman limit systems (LLS; ; e.g. Prochaska et al. 2015; Fumagalli et al. 2016; Lehner & Nicolas 2016), and partial Lyman limit systems (pLLS) and the Ly- forest (; e.g. Aguirre et al. 2003; Pieri et al. 2013), all of which tend to be representative of different phases of the ISM, CGM and IGM respectively. LLSs have been the subject of particular interest recently as they are likely to represent absorption through dense, cool pockets of the predominantly hot and ionised CGM. Simulations and observations suggest that they may trace the fresh gas that fuels star formation (Fumagalli et al. 2011a, b; Glidden et al. 2016; Lehner et al. 2016), as well as outflowing, metal-rich gas (Lehner et al. 2013), or indeed a combination of both (Fumagalli et al. 2013).
While the physical conditions of GRB-DLAs and sub-DLAs have been extensively studied (e.g. Prochaska et al. 2007a; D’Elia et al. 2011; Schady et al. 2011; Sparre et al. 2014; Friis et al. 2015; Wiseman et al. 2017), there is much less known about the systems hosting GRBs with a much lower hydrogen column density. Typically, they are left out of studies based on metals and dust due to the complicated effects of ionisation, which at higher column densities is rendered negligible (Viegas 1995; Wolfe et al. 2005; Peroux et al. 2007). They are also much rarer. Of the 75 GRBs identified by Cucchiara et al. (2015) as having measurable and at least one metal line, only 5 () qualify as LLSs. Of these, GRB 060124 (; Fynbo et al. 2009) and GRB 060605 (; Ferrero et al. 2009) were observed with only low-resolution spectrographs and provide little information regarding their hosts. GRB 060607A () and GRB 080310 () have high-resolution spectra from VLT/UVES, and have been studied in Fox et al. (2008), focusing on high-ion absorption, particularly the prominence of blue-shifted absorption tails of those species.
In this paper, we present a detailed study of GRB 080810, whose spectrum shows a very small total distributed along several absorption components at the host redshift which show dramatically different chemical and physical properties. Throughout the manuscript we use solar abundances from Asplund et al. (2009). We assume a flat CDM cosmology with Planck parameters: km s-1 Mpc-1, , and (Planck Collaboration 2014). Errors are given at the 1 confidence level.
2 Observations and Data Reduction
On 2008-08-10 at =13:10:12 UT, the Burst Alert Telescope (BAT; Barthelmy et al. 2005) on board Swift (Gehrels et al. 2004) triggered on GRB 080810 (Page et al. 2008), which at s was detected as a bright source in Swift’s X-ray Telescope (XRT; Burrows et al. 2005) and Ultra-violet and Optical Telescope (UVOT; Roming et al. 2005). The burst was localised to RA = 23:47:10.48, Dec. =+00:19:11.3 (J2000+/- 0.6”), and Page et al. (2009) provide an overview of the prompt and subsequent follow-up observations carried out by numerous ground- and space-based observatories, and we refer the reader to that paper for a detailed analysis of the broadband spectral evolution of the GRB.
2.1 Keck/HIRES afterglow spectrum
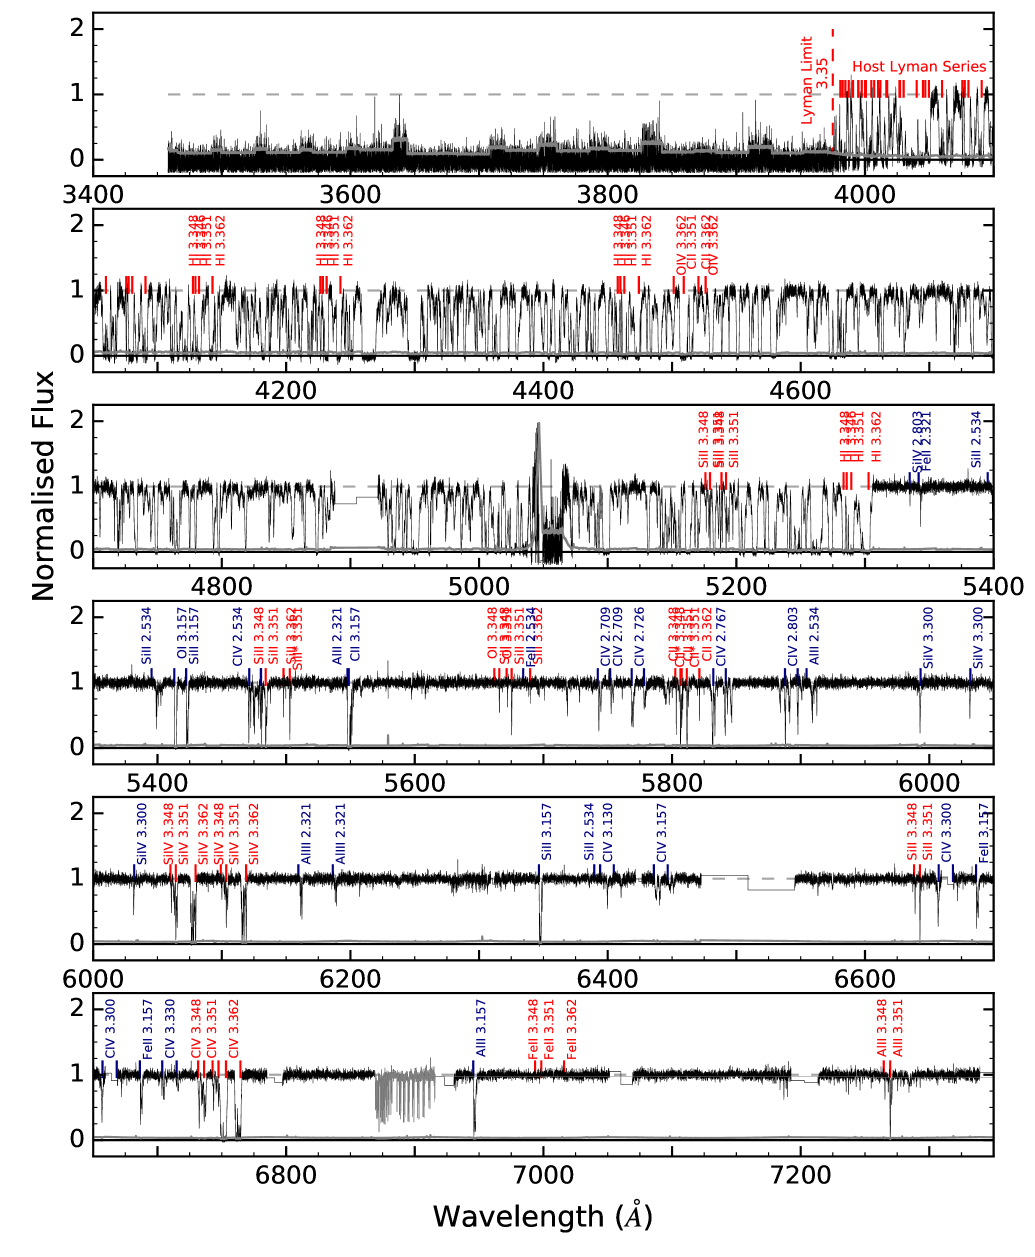
Starting 37.6 minutes after the trigger at 13:47:50 UT, GRB 080810 was observed with the High Resolution Echelle Spectrometer (HIRES; Vogt et al. 1994) mounted on the 10-metre Keck I telescope of the W. M Keck Observatory located at the summit of Mauna Kea, Hawaii. A series of two exposures of 1000 s each were taken using the C5 decker, providing a FWHM spectral resolution of km s-1. The data were reduced with the HIRedux data reduction pipeline bundled within the XIDL software package333https://github.com/profxj/xidl. Full details on the data reduction algorithms are given in Bernstein et al. (2015). The data were coadded optimally and normalized with low-order polynomial fits to individual echelle orders. The extracted 1D spectrum is shown in Fig. 1.
2.2 Late time imaging and spectral observations
We observed the host galaxy of GRB 080810 on several occasions. On 2014-07-22 we acquired s of imaging in the -band with the Optical System for Imaging and low-Intermediate-Resolution Integrated Spectroscopy (OSIRIS; Cepa et al. 2000) on the 10.4 m Gran Telescopio Canarias (GTC). We acquired imaging with the Low-Resolution Imaging Spectrograph (LRIS; Oke et al. 1995) mounted at Keck, in the , , , and 850 (similar to SDSS-) filters on the nights of 2014-08-30 and 2014-08-31 (three exposures in each filter totaling between six and nine minutes total on-source). A longslit spectrum was also acquired at a position angle of 35 degrees, with a total exposure time of 2400 s in the blue arm and 2200 s in the red arm. We also acquired near-infrared imaging using the Multi-Object Spectrograph For Infrared Exploration (MOSFIRE; McLean et al. 2012) on 2014-10-01 using the same telescope, in the and bands. In addition, on 2015-07-23 we acquired a further 600 s of imaging with GTC/OSIRIS in the -band, and we obtained deep FOcal Reducer/low dispersion Spectrograph 2 (FORS2) -band imaging from the VLT archive (originally published in Greiner et al. 2015a). Finally, we have obtained Spitzer 3.6 m data as part of the SHOALS survey (Perley et al. 2016b).
3 Analysis of the afterglow spectrum
The normalised spectrum of GRB 080810 (Fig. 1) shows negligible flux bluewards of a cut-off at 3795 , corresponding to the Lyman-limit at . Redwards of this is a dense Ly- forest, which terminates with two deep Ly- absorption troughs around 5300 , assumed in Page et al. (2009) to correspond to the GRB host system at an approximate redshift of 3.35. Further redwards, the spectrum is populated by mild metal absorption from the host systems, as well as various metal lines associated with lower redshift systems.
3.1 Defining the host complex at
The large column densities in GRB-DLAs and sub-DLAs cause, through quantum mechanical effects, the Ly- absorption feature to be saturated and often to span regions over 15 wide about its central rest-frame wavelength of 1215.8 . A fit to the damping of the red wing is then used to measure the for the entire host. The deep, wide trough from the DLA means that any further Ly- absorption only becomes evident at much shorter wavelengths, shifted significantly in redshift space (and thus much closer to Earth) or corresponding to a shift of several thousands of km s-1 in velocity space at the redshift of the DLA. This blueshifted Ly- absorption is thus totally unrelated to the GRB or its host galaxy and surrounding environment. The spectrum of GRB 080810 shows no such DLA, and therefore there is no clear distinction between the absorption components which are related to the host and those which are Ly- forest absorption from the IGM.

The reddest Ly- absorption is centered around , which we denote system A. Roughly 700 km s-1 bluer at lies system B. These two objects are also detected in the late-time imaging and low-resolution spectroscopy, as detailed in Sect. 4.5. Furthermore, based on our subsequent analysis (Sect. 5.1), there is strong evidence to show that system B is in fact the host of the GRB. This means that A is in the foreground, and implies a positive relative velocity between A and B of km s-1. To simplify the analysis, we henceforth denote B as being at rest in relation to the Hubble Flow, and thus define it as the point where peculiar velocity km s-1.
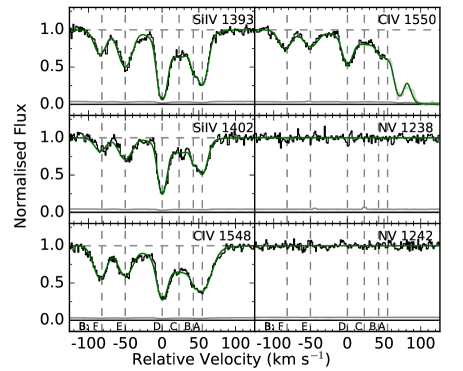
Further bluewards, systems C and D are centred at and , a shift of km s-1 and km s-1 respectively with respect to B. These velocities satisfy the (observationally motivated) condition used by Prochaska et al. (2015) to define an LLS, in that they lie within 500 km s-1 of the point of deepest absorption and are thus treated as part of the same system. However, if we assume that C and D have no local velocity relative to B, they are 0.6 Mpc and 1 Mpc displaced from B respectively, while if instead we take A and B to be systems falling at equal and opposite peculiar velocities towards each other, the respective separation to C and D increases to 1.6 and 2 Mpc. These values lie significantly outside the average virial radius of 105 kpc for a dark matter halo containing a galaxy of the mass (Henriques et al. 2015), a similar stellar mass to that which we derive for this host in Sect. 4.5. Since we are unable to break the degeneracy between local velocities and cosmological redshift, it is not possible to determine for certain, based on redshift arguments alone, whether these two systems are also bound to the A-B system, but include them in our analysis in an attempt to determine their nature. We return to this topic in the discussion section, where we use chemical and physical arguments to locate the systems in space. Lyman-series absorption from the components A-D is shown in Figs. 3 and 4.
The next absorption systems, E and F, are found at and respectively. Assuming they are bound to the host system, they have relative velocities of and km s-1 with respect to B, and thus fall outside the aforementioned criterion to be assumed as part of the same LLS. Assuming on the other hand that they are static relative to the expansion of the Universe, the separation between E (F) and the mean redshift of A and B is 3.6 Mpc (5.2 Mpc). Finally, there is no apparent low- or high-ionisation metal absorption associated with these redshifts, reducing the possibility that they are high velocity outflows from the GRB progenitor or the host galaxy system. We conclude that E and F are very unlikely to be part of the host system and are probably located in the IGM. We therefore define the host complex as being comprised of systems A, B, C and D.
3.1.1 column densities
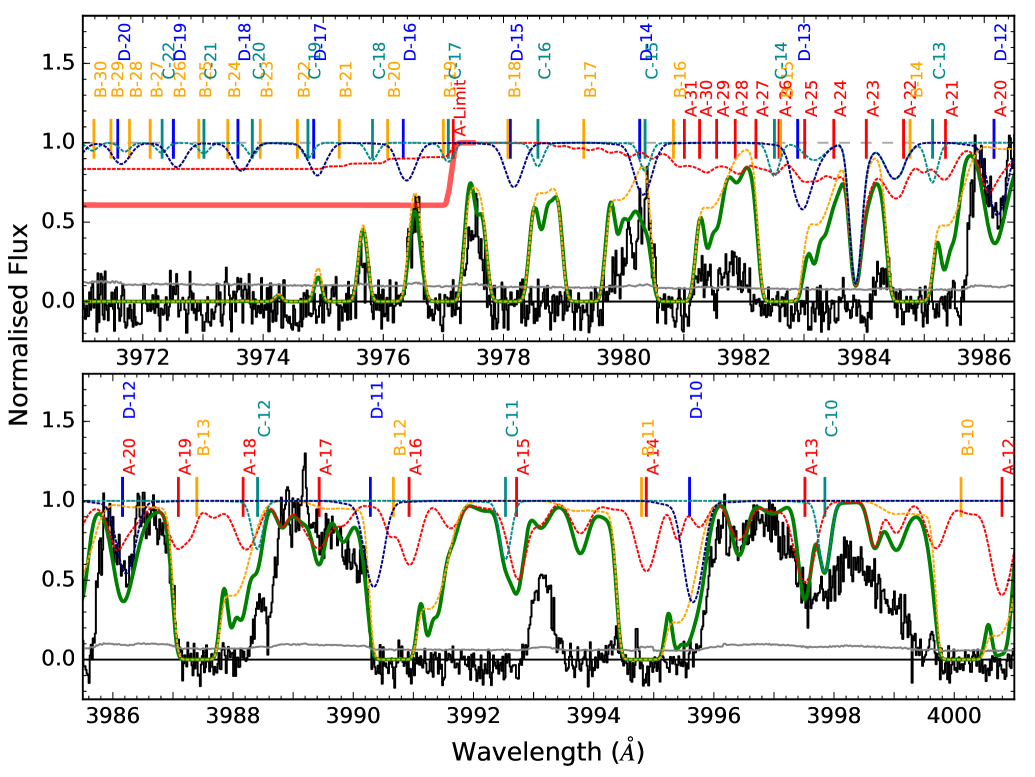
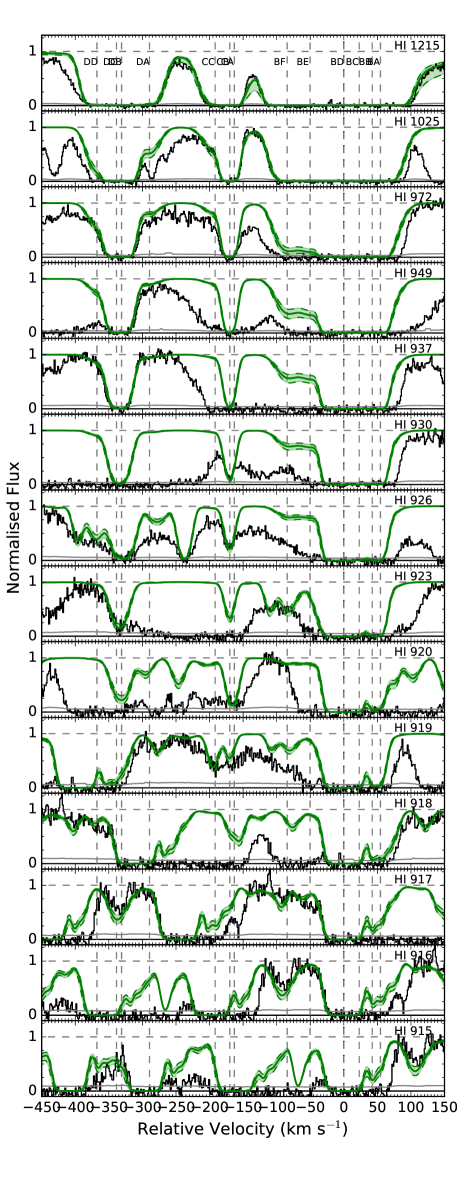
Unusually for a GRB host galaxy, there is no damping of the Ly- lines in the presumed host of GRB 080810, which places an initial upper limit of for each of the systems. As was the case in Page et al. (2009), a lower limit of may be imposed due to 100% absorption below the Lyman limit. With Ly- being saturated but not damped, a Voigt-profile fit to this line alone does not constrain much further. However, due to the excellent signal-to-noise ratio (S/N) and high resolution of the spectrum, we are able to use higher order Lyman series lines to place much tighter constraints on the . A selection of these transitions is shown in Fig 3 for system B, C and D, and in Fig. 4 for system A. A more detailed view of the highest order Lyman series absorption and the Lyman limit is presented in Fig. 2.
The flux drops to zero around 3975 , which is consistent with the Lyman limit at a redshift of 3.3598. However, the higher orders of the Lyman series of system A are unsaturated, and there is also non-zero flux blueward of 3977 , which corresponds to the Lyman Limit of the strongest metal absorber in system A at . This implies that system A is a pLLS. The thick red line in in Fig. 2 corresponds to the flux drop caused by a column density of at the redshift of system A, thus placing this value as a strict upper limit. We deduce that the zero-flux at 3975 is due to the saturated Ly-21 and 22 transitions from system B, which has a significantly larger column density.
Each of the four host systems are split up further into components at slightly different redshifts and with different column densities and other physical parameters. In order to measure column densities more accurately, it is necessary to define these velocity components. Usually, absorption lines from species with similar ionisation potentials show very similar profiles, defined by their redshift and broadening parameter . The only remaining free parameter is then , which can be varied to find the best fit for all of the available lines of the species in question. However, determining and for is non-trivial. lines are strong and saturate up to the highest orders even for low column densities. Because it is so abundant, the stronger lines (Ly-, , ) often show absorption at large velocities from their central redshift, where there is no corresponding metal absorption. Additionally, the Lyman series is strongly contaminated by the Ly- forest, so there is a degree of uncertainty created by not knowing whether absorption is coming from the host or from intervening systems.
While is expected to follow components seen in the neutral and singly-ionised metals (which are labelled with Greek letters), this is clearly not the case in system A: and are only detected in one component, A, while covers over 250 km s-1 in velocity space. The typical -parameter of absorption systems in GRB hosts is km s-1(de Ugarte Postigo et al. 2012), so in A is clearly formed of several components. Due to its low column density relative to most GRBs, many of the transitions from 949 to the Ly-limit show sections of non-zero flux, so some velocity structure can be determined. It is apparent in Fig. 4 that the deeper absorption is matched to the central redshifts of the high-ionisation metals (high-ions; Sect. 3.1.2), whose absorption components spread across the entire velocity range traced by .
Proceeding with caution, we use the Voigt-profile fitting software VPFit (v.10.2) 444VPFit, R. F. Carswell & J. K. Webb, 2014: http://www.ast.cam.ac.uk/ rfc/vpfit.htm, with initial guesses for absorption lines at redshifts and parameters taken from the high-ions, and given by the upper limit measured from the Ly-limit. The fits to the entire available Lyman series (some lines such as 926 are totally saturated and thus not used, since the amount of contamination from one or several Ly- forest lines is unknown) are then simultaneously adjusted by eye until a satisfactory fit is found (this technique is commonly used for fitting of , e.g. Prochter et al. 2010; Rafelski et al. 2012; Jorgenson et al. 2013; Prochaska et al. 2015). This is necessary because of Lyman-alpha forest contamination, which is impossible to account for in the fitting routine. The simultaneous fit is possible as the components are relatively narrow and thus independent of each other. The best fit becomes apparent when the green, modelled line in Figs. 3, 4 best matches the data. While VPFit provides a statistical uncertainty for each fit, this is often unrealistic given the blending of most of the Lyman series transitions. We thus adopt a minimum uncertainty of 0.1 dex for those lines, although in the end only a limit is given.
Following this procedure, fits to 937, 930, 923, 920, 919, and 918 result in a total column density of , which is consistent with the upper bound placed by the Lyman limit. Given the probability that all of the lines used in the fit are also to some degree contaminated by unrelated absorption, the values from individual components (given in Table LABEL:table:all) as well as the total are strictly upper limits. In reality, the is distributed in more sub-components than can be modelled (as the extra ones do not have corresponding metal absorption), which makes the fits appear inconsistent with the data. However, these extra components must not add much extra column, or else they would contradict the strict upper limit placed by the Lyman limit.
In contrast to system A, there are no unsaturated Lyman transitions corresponding to system B, causing difficulty in placing tight constraints on . Due to this saturation, it is not possible to determine whether the appears to follow better the high-ions or low-ions. Nevertheless, we place upper limits on both BE ( 917, 916) and BF ( 920, 917), at , with the parameter not well constrained (and largely unimportant). These values are over 2 dex lower than the main component and thus have negligible impact on the result. By far the strongest component is BD/B. The saturation of the Ly-20 and Ly-21 lines as well as a total lack of flux below the corresponding Lyman limit (accounting for the flux error of 0.1 in this part of the spectrum) place a lower limit of . Assuming the -parameter from the high-ions of 7 km s-1, the lack of damping in the red wing of Ly- as well as the flux peak between systems B and C place a constraint of , traced by the solid green line in Fig. 3. The shaded region corresponds to column densities up to 0.3 dex away from this value, and it is clear that a value of does not fit the data well. Varying the - parameter as high as 20 km s-1 does not change this limit. The blue wing of component BD in 918, 917, 916, and 915 fits the observed flux best with a -parameter of 20 km s-1, which is significantly larger than that of both the corresponding low- and high-ions. While it is likely that in reality BD is formed of a number of smaller components with smaller -parameters, and again allowing for contribution to the absorption from unrelated systems, it is with some confidence that we report the upper limit of . The components BA, BB and BC are unresolved and either contaminated or saturated throughout most of the Lyman series. Assuming the same -parameters as the high-ions and using the constraining red wing of 918, we estimate a conservative combined limit of . Component BD greatly dominates the and, given the lower limit from the Lyman limit as well as the upper limits from the rest of the series, we estimate the total as , where the probability distribution function is more likely flat than Gaussian, such that the true value is equally likely to lie anywhere within the uncertainty (Prochaska et al. 2015).
Systems C and D can be much more easily constrained by their unsaturated high-order Lyman transitions. For the central component of C we find the definite , fixed predominantly by 930 and 926 (Ly-6, 7). We note that the best fit results when km s-1, which is lower than typically seen in . However, this value is a true convergence of the program, rather than a fit by eye, and as such we assume it to be true. It also matches that of the metal lines. The high-ion component CB is mirrored by the low-ion C, but for consistency with systems A and B we use the capital letter notation for the in system C and D. The blended peripheral components are constrained to limits in the same transitions as well as Ly-, - and -. For system D we again apply the restriction of fits to 937, 926, 923, and 917 (Ly-, 7, 8, and 12) which combine to give . The red wing of Ly- and the blue wing of 972, 937, 923, and 918 return values of and . Final measurement are presented in Table LABEL:table:all, and summed column densities for each system are given in Table 1.
3.1.2 Metal column densities
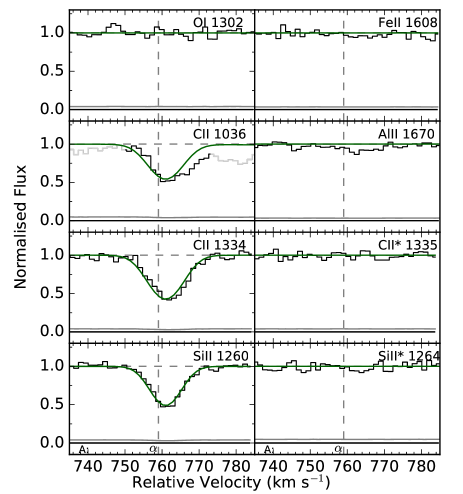
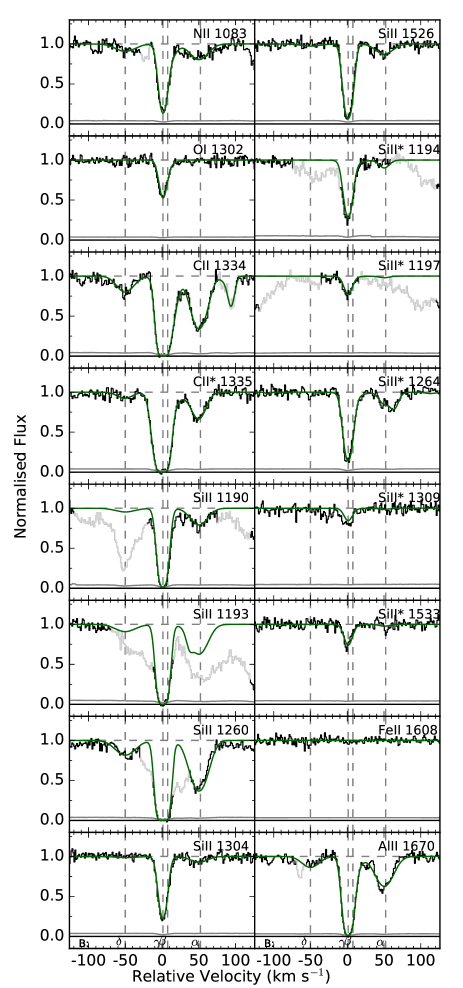
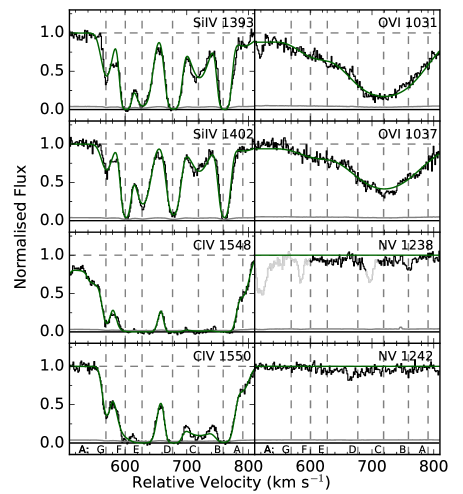
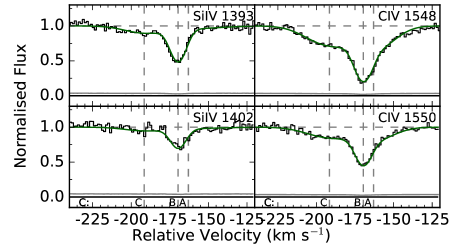
Systems A, B and C show significant absorption from both low- and high-ionisation states of various metal elements, including C, Si, and O, while system D shows a possible detection of weak absorption from and . These systems are further broken up into a subset of velocity components, some of which are resolved while others are blended with one another. Systems B and C also exhibit significant absorption from excited states of and . As it has a much larger column density and the largest corresponding columns of excited gas, we assign component Bγ as that of zero relative velocity, which we keep consistent throughout the paper. We assume the instrument resolution of FWHM = 8km s-1, which we verify by measuring the width of the single telluric lines. To fit Voigt-profiles to the absorption lines, we use the same method as described in Wiseman et al. (2017). To determine the number of components and their exact redshifts, we use unsaturated lines in high S/N regions of the spectrum, unaffected by blending from unrelated absorption. Following the criteria imposed on HIRES data by Prochaska et al. (2015), we define an unsaturated line as one whose minimum flux is greater that 0.1 times that of the continuum, so as to avoid the limited hidden saturation that may occur. We select these initial lines separately for the singly and higher ionised species as the properties of the absorbing systems are significantly different. For each ionisation level, we fit the above-defined lines with VPFit and measure the broadening parameter, , and redshift, . We let the programme add components until the parameter is minimised. In some cases, such as B, this results in strongly blended components separated by only a few km s-1, but this does not have a significant effect on the results. Once determined from these ideal lines, and are then fixed, and Voigt-profiles are fit to all of the other lines in that component and ionisation level in order to measure the column density . An exception to this is the detected in system A, which displays a unique absorption profile (Fig. 9). We show the low-ionisation fits in Figs. 5, 6, and 7, and those for the high-ionisation states in Figs. 9, 10, and 11. Those of system D are combined and shown in Fig. 8.
3.2 Intervening Systems
Along with the absorption from the complex host galaxy system, the spectrum is populated with a vast number of intervening systems forming the Ly- forest between Ly- at the host redshift and its associated Lyman limit, corresponding to a redshift range of . A number of these show corresponding metal absorption, mostly in and , which suggests pockets of IGM gas that have been enriched with metals. The absorbers at , 2.53, 3.157 and 3.300 also show significant absorption from singly-ionized species.
4 Results
The column densities measured by Voigt-profile fitting of each individual component are presented in Table LABEL:table:all of the Appendix, and a summary for each system is given in Table 1. The four main systems are strikingly different in their absorption characteristics, and in the following section we present their physical properties revealed by the analysis.
4.1 System A
System A, with , is classed as a partial-Lyman limit system (pLLS). Its Lyman absorption is shown in Fig. 4, and low and high ionisation metals in Figs. 5 and 9 respectively. All and transitions are affected by saturation in some or all of the seven main velocity components, which combine to give lower limits of and . The singly-ionised lines on the other hand are much weaker at and , and are detected only in component A. The ratios of singly-to-triply ionised absorption are presented in Table 2, and are both around -2 dex, which indicates a very high degree of ionisation in the system. This assertion is reflected in oxygen, with the values of and . For all other ions we report non-detections, including both and despite good coverage in their respective wavelength regions.
The aforementioned ionic ratios are an average calculated over the whole of system A. In reality the highly-ionised gas appears as a series of clouds located at different relative velocities along the line of sight while singly-ionised absorption is only detected in one component. In this component (A/AB) the ratios are less extreme although the difference between singly- and triply-ionised systems is still over 1 dex. In the other components, there is evidence that the ionisation is even stronger. The physical interpretation is that A is a denser, slightly less-ionised pocket along a sightline of highly ionised gas covering over 300 km s-1 in relative velocity. In general though, the fact that traces well the high-ions while the low-ions are only found in one narrow component suggests that the system is highly ionised, and that is simply tracing a much more dominant component. This implies that the metals too are mostly in the more highly ionised state, leaving too few to be detected in the singly ionised state.
4.2 System B
With , system B has the largest column density of neutral hydrogen in the complex by nearly 2 orders of magnitude, yet the absence of evident damping of Ly- (Fig. 3) means it is also classed as a LLS. The singly-ionised species show one strong and three weaker components ranging over 100 km s-1 (Fig. 6). The strongest, B, is effectively coincident with the high-ionisation component BD and is saturated in 1334 and 1190, 1193. High-ionisation lines, on the other hand, are much weaker than system A, and are unsaturated (Fig. 10), allowing for tight constraints to be placed on their column density, and a comparison to the low-ions to be made. The doublet is located in the Ly- forest, and strong blending prevents an unambiguous detection. The ionic ratios and are around 2 dex larger than system A, which implies that the ionisation is not as strong in system B. Similarly to system A, the ionic ratios vary substantially across system B: the gas associated with low-ion components B, and high-ion BD has a higher ratio of singly- to triply-ionised gas, while B/BE appears much more strongly ionised. BA and BF appear to be wings of highly-ionised gas not detected in the low ions. Given that the low- and high-ion components do not trace each other exactly, it is not possible to calculate ratios for all individual components. Instead, we note that even within relatively small velocity ranges, ionic ratios appear to change on the order of a few tenths of a decade, which indicates a highly inhomogeneous ISM. Unfortunately, further analysis of the ionisation state of the system is limited due to the contamination by unrelated absorption in areas of the spectrum containing useful species such as and . Along with the large uncertainty on , this restricts our ability to constrain the metallicity of the system. With an unsaturated detection of , however, we can at least place some constraints that are independent of ionisation. This is because the neutral states of O and H are coupled by charge-exchange reactions (Prochaska et al. 2015), so they are likely to have similar ionisation fractions such that the relative abundance of the neutral state, , represents the overall relative abundance, [O/H]. Following this methodology results in -1.3 ¡ [O/H]B¡ -0.8. We note, however, that this assumption may break down at the low of this absorber, as well as at the high X-ray fluxes observed in GRB 080810 (Page et al. 2009).
| A | B | C | D | |
| Ion | ||||
| 16.9 | a𝑎aa𝑎aRelative velocity compared to component B at | |||
| * | ||||
| 14.03 | ¡12.05 | |||
| - | - | - | ||
| * | ||||
| 12.86 | ||||
| ¡12.75 | ||||
System B shows strong absorption from the unstable fine structure transitions * and *. Both the and * absorption is saturated, preventing us from calculating the ratio of excited to ground state . This saturation is very mild, and at such high resolution and S/N it does not significantly affect the values obtained from the Voigt-profile fit. We conclude the excited fraction is around 50%. and *, on the other hand, are not saturated in some transitions, allowing an exact ratio to be calculated at , or 10%. Interestingly, * 1304 and ** 1306 are not detected unlike e.g. GRB 050730 (Prochaska et al. 2006) where * and * are also seen.
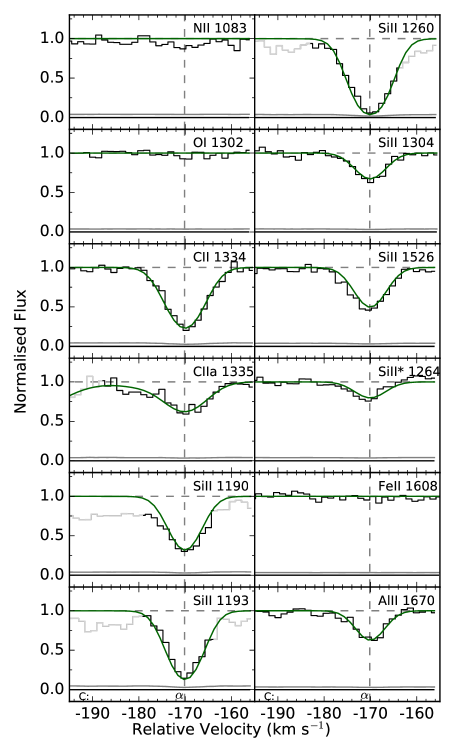
4.3 System C
System C has the lowest column density of the host complex with (Fig. 3), yet shows strong metal absorption (Fig. 7), even from the low-ionisation lines of C, Si and Al, suggesting that it has also been significantly enriched with metals. We compare the relative abundances of and : is over 1.5 dex more than that of system B, which is constrained to . This could be explained if the metal content was the same but system C was much more ionised than system B, such that , a hypothesis supported by the lack of an detection in C. However, the high-ionisation lines in system C are weaker than system B (Fig. 11), such that the ionisation strength appears not to be particularly high. We make qualitative inferences on the nature of systems B and C in Sect. 5.1.
Fine structure lines of * and * are also detected in system C, albeit significantly weaker than in B. All but two * transitions are contaminated by unrelated absorption: * is detected, but with a small column density, such that the non-detection of * is consistent. Ratios of and indicate less excitation than in B.
| A | B | C | D | |
|---|---|---|---|---|
| Ratio | ||||
| 0.8 | -0.05 0.1 | |||
| 0.22 | - | |||
| ¡0.11 | ||||
| - | ||||
| - | - | - | ||
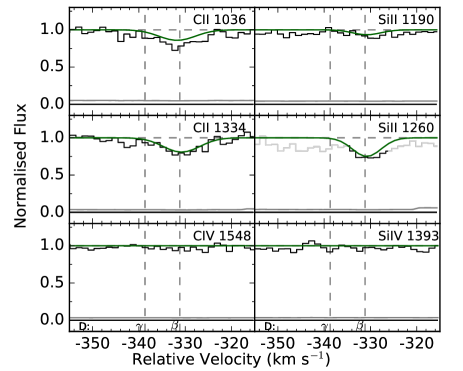
4.4 System D
System D has an that is 0.4 dex larger than system C, yet there is an almost total dearth of metal absorption apart from a marginal (3 ) detection of . Standout measurements include the lack of any highly-ionised metal lines, with upper limits of and . This places a limit of dex, which points towards a similar or lower ionisation fraction compared to system C. The relative abundance, on the other hand, is much lower: compared to . is very weak, but may be evident in the transition at . This part of the spectrum, at in the observer frame, is contaminated by 1550 absorption at , and no absorption from the other available Si lines is detected above the level of the noise. If we assume the null hypothesis that there is no absorption, the upper limit we measure at the position of the , and transitions is consistent with the column density measured from the tentative feature, . We thus estimate a conservative upper limit of , consistent with that of . The wavelength region around 1206 ( in the observed frame) is contaminated by a Ly- line at . Based on the loose assumption of a similar ionisation level to that in C, we infer a difference in metallicity of around 1.5 dex, which is vast when taking into account the small (160 km s-1) difference in relative velocity.
4.5 Imaging and emission spectrum
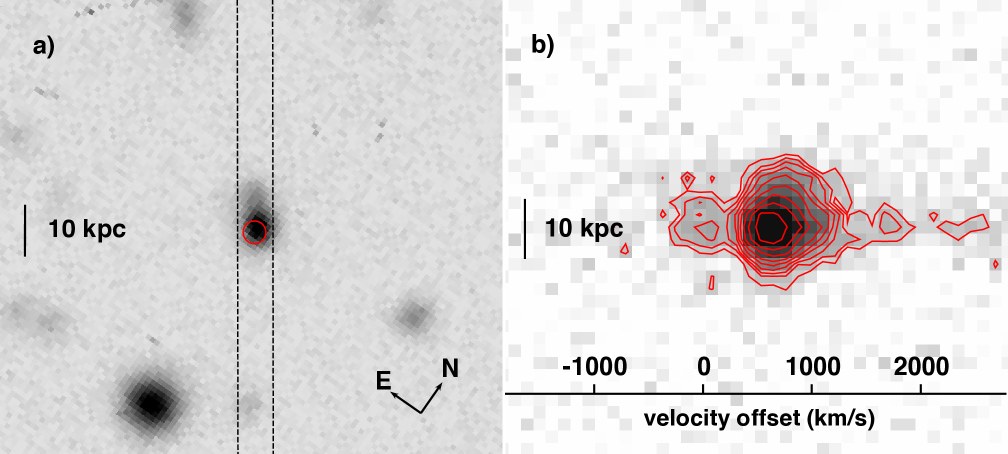
A galaxy is detected at the GRB afterglow location in all of the images we took of the GRB field. The deep VLT image is shown in the left panel of Fig. 12; the host exhibits an extended morphology with a bright compact region accompanied by a a fainter secondary component offset 0.8 to the northeast. A strong drop in the flux in the - and -bands suggests that this source is indeed the host galaxy system. Our spectroscopy confirms this, revealing a strong detection of redshifted Ly- centered at 5305 Å ().
The host is marginally resolved in both position and velocity space. An extraction of the spectrum at the position of the primary component seen in the imaging shows two marginally-resolved peaks in wavelength space separated by 13 Å (observer-frame): one at our defined central redshift of , and a second dominant peak redshifted by 700 km s-1. There is no spatial offset evident between these components in the 2D spectrum. Our LRIS longslit was oriented to include both the “primary” component of the host system and the secondary source to the NE, so this secondary source is also visible on the trace although it is partially blended with emission from the “primary”. It shows bright Ly- emission redshifted by approximately +250 km s-1 relative to the strongest emitter, placing it at +1000 km s-1 redder than our systemic redshift.
Given the equivalent redshifts, it is natural to associate the strongest emitter in the host spectrum with component A in the afterglow absorption spectrum; and associate the blueshifted (spatially-coincident) emission with component B (Fig. 12b). The spatially-offset source and its red tail have no counterpart in absorption, while sources C and D have no distinct counterparts in emission (however, the low resolution of the host spectrum means that any such counterpart would likely be hopelessly blended with emission from B). If the GRB occurred in component B, then component A must be in the foreground and therefore must be infalling towards the host given its higher redshift—most likely due to an active merger (the lack of a detectable spatial offset puts them within a distance of 5 kpc in projection, so unless they are an improbable line-of-sight projection the merger must be actively ongoing.)
| Band | Magnitude a𝑎aa𝑎aRelative velocity compared to component B at | Telescope/Instrument |
|---|---|---|
| Keck-I/LRISb | ||
| Keck-I/LRISb | ||
| GTC/OSIRIS | ||
| VLT/FORS2 | ||
| Keck-I/LRISr | ||
| GTC/OSIRIS | ||
| Keck-I/LRISr | ||
| Keck-I/MOSFIRE | ||
| Keck-I/MOSFIRE | ||
| 3.6 | Spitzer/IRAC |
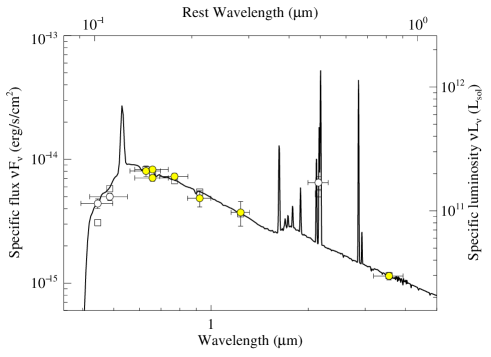
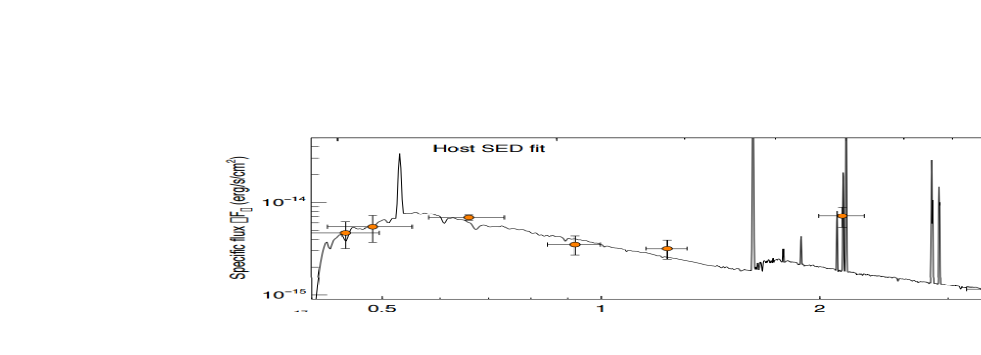
We fitted all of our existing broadband photometry (presented in Table 3) with the Galaxy Builder photometric SED analysis software (first described in Perley et al. 2012, 2013). All of the data points except for those in the K-band and Spitzer 3.6 m are located at redshifts blueward of the redshifted Balmer break and the -band is strongly contaminated by nebular emission from [OIII] and H, so it is difficult to constrain the presence of older stars in the population. However, it is clear that the star-formation rate must be very large ( yr-1) in order to explain the luminous UV emission and -band nebular excess. Extinction is modest ( mag) and the inferred stellar mass (approximately 310) is moderate, similar to the median for GRB hosts generally (Perley et al. 2016b).
5 Characterising the absorbing systems
Using the chemical, ionic and kinematic properties presented in the previous section, we now classify the four distinct systems at the highest redshift along the extremely rich line of sight to GRB 080810 and build a picture of the entire complex, which we summarise in the cartoon Fig. 15.
5.1 Systems B & C
There are several factors that lead us to believe that system B is the one nearest to the explosion site of GRB 080810. The most compelling is that it is by far the largest reservoir of neutral hydrogen of the four systems studied, a characteristic trait of the LOS probed by GRBs through their host galaxies. GRBs are associated with massive stars, and while they typically fully ionise their immediate surroundings, one expects the LOS to probe other regions of cool, dense and predominantly neutral gas necessary for star formation inside the host galaxy. Although system B falls well below the average for a GRB (in Cucchiara et al. 2015 the median is ), its value is nearly two orders of magnitude larger than systems A, C, and D combined.
Secondly, we refer to the strong absorption by the fine-structure transitions of and , often used as strong evidence that the physical location of the cloud is near to the GRB (Prochaska et al. 2006; Vreeswijk et al. 2013; D’Elia et al. 2014; Friis et al. 2015), as the intense UV radiation from the burst excites these unstable transitions. System C however also exhibits strong fine-structure absorption, and as such could also be close to the GRB. This observation is similar to the results of Savaglio et al. (2012) on the pair of interacting galaxies forming the host of GRB 090323, which both exhibit absorption from excited lines. It is known that lines may also be excited by UV radiation from a strong starburst (Pettini et al. 2002; Christensen et al. 2011), and the interpretation presented for GRB 090323 is that substantially increased star-formation caused by the interaction caused the excitation. Systems B and C may similarly be affected by intense background UV flux from the highly star-forming environment, but they would have to both be very close to the young, hot stars. It is more likely that the majority of the excitation is caused by the GRB in both cases, as this can occur at distances up to a few kiloparsecs from the burst. We note that the relative fraction of in the excited state is 0.3 dex higher in system B, and a similar pattern is evident in . Assuming that both systems are exposed to the same background radiation field, we suggest that the extra excitation seen in B could be down to a higher influence of UV pumping from the GRB itself, and thus that it is located closer to the site of the burst.
System C is 170 km s-1 blueshifted from the central velocity component of B. However, it shows a fairly similar chemical composition. The similarities in the ionisation and excitation characteristics of B and C suggest that they are irradiated by a similar source, namely the GRB plus some UV background from nearby OB stars. Typically it is expected that of two clouds exposed to similar ionising fields, the one with lower will be more strongly ionised, as self-shielding is less efficient. For its very low , the ionisation in C appears remarkably weak, based upon and measurements (Table 2) which suggest it could be similar to that in B. With comparable ionisation but much less , we infer that the total hydrogen content of system C is much lower than B. Thus, given that the metal detections are still strong, we assume metallicity is likely similar or even higher. Along with the negative relative velocity of nearly 200 km s-1, we are led to propose that system C may trace an outflow driven by the intense star formation and associated supernovae in the galaxy in which the GRB exploded. Although the ionisation is relatively weak compared to system B, the system is still strongly ionised, with the tracing the high-ion components CA and CC that are not seen in low-ions. This observation is consistent with other observations of strong ionisation in galactic outflows (Pettini et al. 2002; Grimes et al. 2009; Heckman et al. 2015; Chisholm et al. 2016).
5.1.1 The lack of an Fe detection
In dense regions of the ISM, metals are often found to condense out of the gas phase and be locked into dust grains, an effect known as dust depletion (e.g. Savage & Sembach 1996; Vladilo 1998; Savaglio et al. 2003; De Cia et al. 2013). Furthermore, certain refractory elements such as Fe, Ni and Ti are known to be much more heavily depleted than volatile elements such as Zn, S and P. The relative depletion strengths of many elements have been well characterised by Jenkins (2009) and most recently De Cia et al. (2016), such that with a combination of measurements for volatile and refractory elements it is possible to constrain the dust content of an absorbing system, which has been done for a sample of GRB host galaxies by Wiseman et al. (2017). In that work, column density measurements for a minimum of four elements were required to constrain the depletion, but it is in practice possible to gain an insight into the dust content from just one volatile and one refractory element (e.g. Vladilo et al. 2011; De Cia et al. 2013). In the case of system B of GRB 080810, we do not detect any strongly refractory elements. Furthermore, due to ionisation the measurements of certain states cannot be treated as fully representative of the elements as a whole, meaning it is not possible to measure the dust depletion directly. However, iron and silicon have very similar ionisation potentials as well as solar abundances, so given the strong detection of () we would expect a similar amount of . Instead, we measure only an upper limit of . Assuming that iron follows a similar ionisation pattern to silicon, we can place a tentative constraint of [Si/Fe]B¿0.9. If this value is due exclusively to dust, it means that system B shows stronger dust depletion than any of the 19 GRB-DLAs analysed in Wiseman et al. (2017), at a level similar to that of the average Milky Way sight-line (Jenkins 2009; De Cia et al. 2016). There are many caveats to this analysis. It requires that the nucleosynthesis history of this galaxy, at , is similar to that in the solar neighbourhood, as well as that our assumptions about ionisation fractions are correct. We note that three separate studies have detected little or no dust in the afterglow SED: by Page et al. (2009); by Kann et al. (2010), and by Schady et al. (2012). We also find the SED of the host gives an of only mag. Such a small amount of extinction is not expected for such a large amount of depletion, although these two measures of dust are indeed often inconsistent with each other (Watson et al. 2006; Friis et al. 2015; Wiseman et al. 2017). Although there are many uncertainties in play, it is possible that some of this Fe/Si discrepancy could be due to dust. Such a detection could suggest that the gas has been ionised only recently, the cores of dust grains remaining intact.
Another possible reason for the lack of Fe is that at this redshift we expect a strong enhancement of the abundance of the alpha elements (usually denoted [/Fe]), such that the relative abundances of of Si, O, C compared to Fe are positive. However, typically these enhancements are of a maximum of 0.3 dex in high redshift absorption systems (Dessauges-Zavadsky et al. 2006; Rafelski et al. 2012; De Cia et al. 2016). Furthermore, we take a look at the relative abundance of another non-alpha element with similar ionisation potential to Fe: Aluminium. The potentials for the first two ionisation states of Al are similar to those for Fe and Si, so the value suggests there is very little enhancement.
The depletion characteristics of Al are poorly understood, but is usually described as a refractory element (Phillips et al. 1982; Prochaska & Wolfe 2002). The similarity with the Si abundance thus suggests that the depletion is likely small, in contrast to the inference from the Si/Fe ratio. This could be explained by an abnormally large Al/Fe ratio, as seen in other GRBs (D’Elia et al. 2014; Hartoog et al. 2015), for which proton capture processes were highlighted as a possible cause. Were this the case in GRB 080810, then this would prevent the Al/Si ratio from ruling out enhancement being prominent.
While we cannot discount the possibility that all of these deviations from expected abundance patterns are primarily caused by the effects of strong ionisation, it remains that the non-detection of iron is particularly puzzling.
5.2 System A
The absorption system A has a mean velocity of km s-1 relative to system B, consistent with the relative velocity seen in Ly- emission. The implication is that system A lies in the foreground and is falling towards, and likely merging with, the host (including systems B and C). System A shows drastically different chemical and kinematic properties to system B. It is almost totally ionised, and shows absorption from higher ionisation states over a 320 km s-1 range in relative velocity, which is traced by relatively weak neutral hydrogen. This velocity range is consistent with that seen at intermediate impact parameters ( 30 kpc) in the CGM of a sample of Lyman break galaxies (LBGs) at a similar redshift by Steidel et al. (2010). The presence of such highly ionised gas, including strong absorption, points to system A being a sight line through the CGM of the foreground galaxy. Indeed, the high ionisation and wide velocity structure is similar to that observed in the CGM of star-forming galaxies in the COS-Halos sample at (Werk et al. 2016; Prochaska et al. 2017). However, the imaging data presented in Sect. 4.5 imply that the LOS from the GRB passes within 5 kpc of the centre of this foreground galaxy. This is over an order of magnitude smaller than the impact parameters for the Steidel et al. (2010) sample, as well as the COS-Halos sample and the LLSs by Lehner et al. (2013). The fact that the LOS passes so close to the galaxy centre yet incurs such little neutral gas is unprecedented, and implies a very compact system — whereas in the aforementioned samples one would expect at least a sub-DLA for such a sight line, here we see the typical signature of the CGM.
5.3 System D
There is only a 150 km s-1 difference in relative velocity between systems C and D, yet they have strikingly different chemical properties. The near-total lack of metal absorption in D contrasts starkly with the comparatively metal-rich system C, and the lack of and suggest a small ionised fraction. Together, these characteristics point to D being a cooler, metal poor cloud that is part of an inflow from the IGM. Although the marginal detection of carbon means that this is likely not primordial gas, it is much less enriched than that in the other systems, which have been processed in stars. The metals present could originate from mixing with more metal rich gas ejected during previous epochs of intense star formation from nearby galaxies (see Fraternali & Filippo 2016 for a review).
6 Discussion
6.1 Conditions in the interacting galaxies
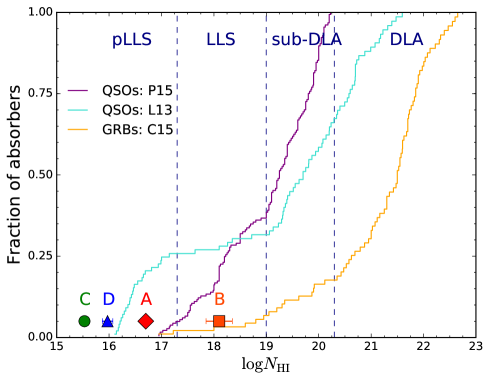
The analysis of the four main components paints a picture of a complex, compact environment that plays host to GRB 080810. Typically, denser gas is expected to be found at smaller impact parameters (), a trend seen in Werk et al. (2012), Lehner et al. (2013) and Prochaska et al. (2017). In the sample of LBGs presented in Steidel et al. (2010), there is also a strong decrease of absorption line strengths of Ly- and metals with increasing impact parameter. As shown in Fig. 14, systems A, C and D have some of the smallest column densities of neutral hydrogen ever observed at the host redshift of a GRB (compared to objects in the sample of GRB-DLAs by Cucchiara et al. 2015), with B also at the very low end of the distribution. We also contrast these column densities with two samples of QSO absorption line systems that probe the CGM, namely Prochaska et al. (2015) and Lehner et al. (2013). Whereas the QSO absorber samples typically probe gas at impact parameters of kpc, the sight line to GRB 080810 passes within 5 kpc, yet it is evident that the is at the lower end of these populations as well. To find such a low in a system that is both a GRB host and lies at a small radius is highly unusual.
Systems A and B display comparable total metal column densities, yet the fractions of C and Si in higher ionisation states are over two orders of magnitude larger in A than in B. This is reflected in the observed neutral hydrogen column density, which is 1.4 dex smaller in A. This result is consistent with that from Prochaska et al. (2015), who found that the ionised fraction is higher in LLSs with lower (their Figure 9). We note that the sample presented in that paper has a lower cut-off of 17.3, and that trends evident there may not apply at the much lower column densities probed by A, C and D. The vast difference in ionisation fractions and large velocity widths of systems A, B, C, and D imply highly turbulent media, reminiscent of that found in CGM at larger (100 kpc) radii (e.g. Crighton et al. 2013). We emphasise that in star-forming galaxies at high redshift there is a dynamic interplay between the the ISM and CGM (see e.g. Steidel et al. 2010), and the boundaries are largely undefined. What is clear is that these are compact galaxies, with relatively small amounts of gas being probed. The gas observed is much more diffuse than expected for lines of sight passing so close to centres of star-forming galaxies.
While low column densities are rare in GRBs, a common trait exists among the small number of such objects, namely that multiple absorbing components separated by large (500 - 5000 km s-1) velocities are often detected, as presented for GRB 080810 in this work. GRB 021004 (), GRB 060607A (), and GRB 080310 () were all analysed in Fox et al. (2008), and GRB 060605 () by Ferrero et al. (2009). Those papers discuss the nature of the observed high-velocity components: whether they are winds originating from the GRB progenitor, are outflows on galactic scales, or are unrelated intervening systems. However, our analysis of the imaging and late-time spectroscopy of the host of GRB 080810 strongly suggests that the two largest absorbing systems correspond to two very compact, interacting galaxies.
6.2 GRBs and SNe in interacting systems
The link between mergers and intense star-formation has been studied for decades (e.g. Sanders et al. 1988; Bell et al. 2006; Robaina et al. 2009; see Bournaud 2011 for a review), and such events are a key ingredient in the theory of galaxy evolution (White & Rees 1978). Given that core collapse SNe and GRBs are associated with massive stars, it is reasonable to expect a link between systems where mergers have caused starburst activity and thus a young and massive stellar population, and GRBs (Lopez-Sanchez & Esteban 2009; Chen 2011), and we propose that GRB 080810 could be one such system. There are other examples of potentially merging systems hosting cosmic explosions, detected in absorption line profiles such as GRB 090323 (Savaglio et al. 2012) and GRB 100219A (Thöne et al. 2013), and in imaging of the hosts (GRB 051022; Castro-Tirado et al. 2007; Rol et al. 2007, and GRB060814; Perley et al. 2013). Similarly, interacting systems have also been detected in the host systems of superluminous supernovae (Chen et al. 2017; Perley et al. 2016a). However, the detection of mergers in GRB and SN hosts could be coincidental, especially at high redshift where mergers are much more frequent (e.g. Callegari et al. 2009). Both simulations and observations show that at more than one in ten galaxies of stellar mass have experienced a major merger in the preceding 1 Gyr (Rodriguez-Gomez et al. 2015). It remains to be clarified whether such GRBs are actually a result of the merger, or simply coincident.
6.3 Inflows and outflows
The energetic, turbulent medium present in system A, the strong ionisation, and the mixing of different gaseous phases all point towards inhomogeneous motion throughout the ISM and CGM of the galaxy system forming the host of GRB 080810, on small and large scales. While there is already evidence for the presence of large scale outflows in GRB host galaxies (e.g. Schaefer et al. 2003; Chen et al. 2009), system C is one of the most convincing yet. It has been strongly enriched with metals, and its ionisation and excitation properties suggest an origin in the star-forming regions of its galaxy, near where the GRB occurred. In contrast to system A which is highly-ionised and likely representative of a hot, wind-enriched galaxy halo, system C appears not yet to have reached its galaxy’s CGM. Instead, it has maintained similar conditions to those where it was launched.
A likely scenario for the geometry of the entire system is presented in Fig 15. The locations of systems A, B, and C are fairly well constrained by their metal absorption. System D is harder to place, as there is little to be learned from its negligible metal content. It is highly improbable that it is an outflow similar to C but with a higher velocity, or indeed that it has originated inside the galaxy at all. Instead we believe it to trace the metal-poor gas that acts as a replenishment mechanism of galaxies throughout the universe. It has indeed been suggested that GRB hosts in general are fuelled by recent metal-poor gas inflow (Michałowski et al. 2015, 2016). The km s-1 blueshift implies that it is not accreting onto galaxy B — if B hosted the GRB then D must be in front of it, moving away at that velocity. The degeneracy between local velocities and cosmological redshift allows for a range of locations of system D. One possibility is that it is located between the two galaxies and is currently falling towards galaxy A, or has fallen from behind galaxy B and is being slowed by its gravity. Another is that it has fallen from a large distance into the potential well of the complex, and is now in the foreground having initially passed both galaxies without being accreted, having joined in a disk-like structure (e.g. Bouché et al. 2013). For any of these scenarios, system D represents a rare detection of such a metal-poor inflow in a GRB galaxy, or indeed in absorption at such a small projected distance to any galaxy. Systems with positive velocities relative to the gas local to GRBs, and thus inferred to be falling in towards the star-forming regions of their hosts, have been detected previously (e.g. Prochaska et al. 2008), but these have tended to be richer in metals than the gas observed here, and may represent recycled gas that has previously been expelled from the galaxy. Ly- emitters are thought to trace accretion in large halos around quasars (Cantalupo et al. 2014; Hennawi et al. 2015), and have been detected at impact parameters of kpc from an LLS (Fumagalli et al. 2016). If system D is indeed bound to the host system, then it could be much closer to the galaxies than that. Finally, as discussed when defining the host complex in Section 3.1, it could in fact be a foreground system located 1.5 Mpc from the interacting complex. While this would exclude it from being a direct accretion flow onto the complex, it represents at the very least a reservoir of cool, metal-poor gas residing in the IGM near the dark matter halo, available for star-formation at some future epoch.
7 Summary and Conclusions
The rapid follow-up observations of the extremely bright GRB 080810 with a high resolution spectrograph at a 10-m class telescope have provided us with an extremely rich window into the Universe at high redshift. Populated by numerous absorption systems from redshifts of upward of 2.3, the line of sight to the afterglow reveals a myriad of absorbing clouds in the IGM, sporadic denser systems with associated metal absorption, and a complex, extreme environment playing host to the GRB itself, dominated by an interacting, star-forming, Lyman-break galaxy system at .
In this paper, we have examined the properties of each of the four main systems at this redshift based on their absorption properties, through which we have provided one of the most detailed analyses of the multiple component nature of a galaxy at high redshift. The emerging picture is one of a complex environment, the standout results of which are summarised below.
() GRB 080810 exploded in the more distant partner of an interacting system. This component is hidden behind the compact foreground companion (which has the brightest Ly- emission), and in total the system is forming stars at a rate of yr-1. The two systems are closing with a relative velocity of km s-1.
() The column density of neutral hydrogen measured throughout the entire complex is very low: even the strongest absorption is limited to , one of the lowest ever measured in a GRB host system, despite the LOS to the burst passing within kiloparsecs of the centres of both galaxies. These are unprecedented scales for such a low level of neutral absorption.
() Near the GRB site there is more neutral gas. The sight line through the interacting galaxy reveals a similar metal content but in a much higher ionisation state, representative of gas which has been expelled from the ISM into the hot, turbulent halo. The implication that this is the CGM at a galactic radius of kpc is remarkable.
() The mechanism by which such metals are expelled into the CGM is likely seen in the form of an outflowing cloud in the GRB host, which has a velocity of km s-1 relative to the denser gas nearest to the GRB.
() The ongoing, intense star formation is likely fueled by metal-poor, inflowing gas. A candidate counterpart for this gas is seen in the spectrum, containing only marginal detections of heavy elements. Due to the degeneracy between cosmological redshift and local peculiar velocity, we cannot confirm that this gas is spatially coincident with the host galaxies. If it indeed belongs to the host complex, then it is one of the first detections to date of metal-poor gas in such close vicinity to star-forming galaxies.
Acknowledgements.
We thank the referee for their detailed and helpful comments in improving this manuscript. We are grateful for the support of the GROND GRB team. We thank in particular Julia Bodensteiner, Ting-Wan Chen, and Sandra Savaglio for interesting and useful discussions. Some of the data presented in this manuscript were obtained at the W. M. Keck Observatory, which is operated as a scientific partnership among the California Institute of Technology, the University of California, and NASA; the Observatory was made possible by the generous financial support of the W. M. Keck Foundation. We wish to extend special thanks to those of Hawaiian ancestry on whose sacred mountain those from the astronomical community are privileged to be guests. We thank C. Ledoux and P. Vreeswijk for providing a compilation of oscillator strengths. PW, PS, TK, and R.M.Y acknowledge support through the Sofja Kovalevskaja Award to PS from the Alexander von Humboldt Foundation of Germany. AdUP acknowledges support from the Spanish research project AYA 2014-58381-P, from a Ramón y Cajal fellowship, and from a 2016 BBVA Foundation Grant for Researchers and Cultural Creators. We recognise the extensive use of the NumPy, SciPy (van der Walt et al. 2011), and matplotlib (Hunter 2007) packages throughout the preparation of this manuscript.References
- Aguirre et al. (2003) Aguirre, A., Schaye, J., Kim, T.-S., et al. 2003, ApJ, 602, 38
- Asplund et al. (2009) Asplund, M., Grevesse, N., Sauval, A. J., & Scott, P. 2009, Astrophys. Space Sci., 47, 481
- Barthelmy et al. (2005) Barthelmy, S. D., Barbier, L. M., Cummings, J. R., et al. 2005, Sp. Sci. Rev. Vol. 120, Issue 3-4, pp. 143-164, 120, 143
- Bell et al. (2006) Bell, E. F., Phleps, S., Somerville, R. S., et al. 2006, ApJ, 652, 270
- Bernstein et al. (2015) Bernstein, R. A., Burles, S. M., & Prochaska, J. X. 2015, Publ. Astron. Soc. Pacific, 127, 911
- Bouché et al. (2013) Bouché, N., Murphy, M. T., Kacprzak, G. G., et al. 2013, Science, 341, 50
- Bournaud (2011) Bournaud, F. 2011, EAS Publ. Ser., 51, 107
- Burrows et al. (2005) Burrows, D. N., Hill, J. E., Nousek, J. a., et al. 2005, Space Sci. Rev., 120, 165
- Callegari et al. (2009) Callegari, S., Mayer, L., Kazantzidis, S., et al. 2009, ApJL, 696, L89
- Cano et al. (2017) Cano, Z., Wang, S.-Q., Dai, Z.-G., & Wu, X.-F. 2017, in Adv. Astron. GRB Swift/Fermi Era Beyond, Accepted Review in
- Cantalupo et al. (2014) Cantalupo, S., Arrigoni-Battaia, F., Prochaska, J. X., Hennawi, J. F., & Madau, P. 2014, Nature, 506, 63
- Castro-Tirado et al. (2007) Castro-Tirado, A. J., Bremer, M., McBreen, S., et al. 2007, A&A, 475, 101
- Cepa et al. (2000) Cepa, J., Aguiar-Gonzalez, M., Gonzalez-Escalera, V., et al. 2000, in Soc. Photo-Optical Instrum. Eng. Conf. Ser., ed. M. Iye & A. F. M. Moorwood, Vol. 4008, 623
- Chen (2011) Chen, H.-W. 2011, arXiv: 1110.0487
- Chen et al. (2009) Chen, H.-W., Perley, D. A., Pollack, L. K., et al. 2009, ApJ, 691, 152
- Chen et al. (2017) Chen, T. W., Nicholl, M., Smartt, S. J., et al. 2017, A&A, 602, A9
- Chisholm et al. (2016) Chisholm, J., Tremonti, C. A., Leitherer, C., Chen, Y., & Wofford, A. 2016, MNRAS, 457, 3133
- Christensen et al. (2011) Christensen, L., Fynbo, J. P. U., Prochaska, J. X., et al. 2011, ApJ, 727, 73
- Crighton et al. (2013) Crighton, N. H. M., Hennawi, J. F., & Prochaska, J. X. 2013, ApJL, 776, 18
- Cucchiara et al. (2015) Cucchiara, A., Fumagalli, M., Rafelski, M., et al. 2015, ApJ, 804, 51
- Dalla Vecchia & Schaye (2008) Dalla Vecchia, C. & Schaye, J. 2008, MNRAS, 387, 1431
- Dalla Vecchia & Schaye (2012) Dalla Vecchia, C. & Schaye, J. 2012, MNRAS, 426, 140
- De Cia et al. (2016) De Cia, A., Ledoux, C., Mattsson, L., et al. 2016, A&A, 97, 1
- De Cia et al. (2013) De Cia, A., Ledoux, C., Savaglio, S., Schady, P., & Vreeswijk, P. M. 2013, A&A, 560, A88
- de Ugarte Postigo et al. (2012) de Ugarte Postigo, A., Fynbo, J. P. U., Thöne, C. C., et al. 2012, A&A, 548, A11
- Dekel et al. (2006) Dekel, A., Birnboim, Y., K., A., et al. 2006, MNRAS, 368, 2
- D’Elia et al. (2011) D’Elia, V., Campana, S., Covino, S., et al. 2011, MNRAS, 418, 680
- D’Elia et al. (2014) D’Elia, V., Fynbo, J. P. U., Goldoni, P., et al. 2014, A&A, 564, A38
- Dessauges-Zavadsky et al. (2006) Dessauges-Zavadsky, M., Prochaska, J. X., D’Odorico, S., Calura, F., & Matteucci, F. 2006, A&A, 445, 93
- Ferrero et al. (2009) Ferrero, P., Klose, S., Kann, D. A., et al. 2009, A&A, 497, 729
- Finley et al. (2017) Finley, H., Bouché, N., Contini, T., et al. 2017, arXiv: 1701.07843
- Fox et al. (2008) Fox, A. J., Ledoux, C., Vreeswijk, P. M., Smette, A., & Jaunsen, A. O. 2008, A&A, 491, 189
- Fraternali & Filippo (2016) Fraternali, F. & Filippo. 2016, in Gas Accretion onto Galaxies, Astrophys. Sp. Sci. Libr. eds. A. J. Fox R. Dave, 2017, Publ. by Springer
- Friis et al. (2015) Friis, M., De Cia, A., Krühler, T., et al. 2015, MNRAS, 451, 167
- Fumagalli et al. (2016) Fumagalli, M., Cantalupo, S., Dekel, A., et al. 2016, MNRAS, 462, 1978
- Fumagalli et al. (2011a) Fumagalli, M., O’Meara, J. M., & Prochaska, J. X. 2011a, Science, 334, 1245
- Fumagalli et al. (2013) Fumagalli, M., O’Meara, J. M., Prochaska, J. X., & Worseck, G. 2013, ApJ, 775, 78
- Fumagalli et al. (2011b) Fumagalli, M., Prochaska, J. X., Kasen, D., et al. 2011b, MNRAS, 418, 1796
- Fynbo et al. (2009) Fynbo, J. P. U., Jakobsson, P., Prochaska, J. X., et al. 2009, ApJS, 185, 526
- Fynbo et al. (2006) Fynbo, J. P. U., Starling, R. L. C., Ledoux, C., et al. 2006, A&A, 451, L47
- Galama et al. (1998) Galama, T. J., Vreeswijk, P. M., van Paradijs, J., et al. 1998, Nature, 395, 670
- Gehrels et al. (2004) Gehrels, N., Chincarini, G., Giommi, P., et al. 2004, ApJ, 611, 1005
- Glidden et al. (2016) Glidden, A., Cooper, T. J., Cooksey, K. L., et al. 2016, ApJ, 833, 270
- Greiner et al. (2015a) Greiner, J., Fox, D. B., Schady, P., et al. 2015a, ApJ, 809, 76
- Greiner et al. (2015b) Greiner, J., Mazzali, P. a., Kann, D. A., et al. 2015b, Nature, 523, 189
- Grimes et al. (2009) Grimes, J. P., Heckman, T., Aloisi, A., et al. 2009, ApJS, 181, 272
- Hartoog et al. (2015) Hartoog, O. E., Malesani, D., Fynbo, J. P. U., et al. 2015, A&A, 139, 1
- Heckman et al. (2015) Heckman, T. M., Alexandroff, R. M., Borthakur, S., Overzier, R., & Leitherer, C. 2015, ApJ, 809, 147
- Hennawi et al. (2015) Hennawi, J. F., Prochaska, J. X., Cantalupo, S., & Arrigoni-Battaia, F. 2015, Science, 348, 779
- Henriques et al. (2015) Henriques, B., White, S., Thomas, P., et al. 2015, MNRAS, 451, 2663
- Hjorth et al. (2003) Hjorth, J., Sollerman, J., Møller, P., et al. 2003, Nature, 423, 847
- Hunter (2007) Hunter, J. D. 2007, Comput. Sci. Eng., 9, 90
- Jenkins (2009) Jenkins, E. B. 2009, ApJ, 700, 1299
- Jorgenson et al. (2013) Jorgenson, R. A., Murphy, M. T., & Thompson, R. 2013, MNRAS, 435, 482
- Kann et al. (2010) Kann, D. A., Klose, S., Zhang, B., et al. 2010, ApJ, 720, 1513
- Krühler et al. (2013) Krühler, T., Ledoux, C., Fynbo, J. P. U., et al. 2013, A&A, 557, A18
- Larson & B. (1974) Larson, R. B. & B., R. 1974, MNRAS, 169, 229
- Ledoux et al. (2009) Ledoux, C., Vreeswijk, P. M., Smette, A., et al. 2009, A&A, 506, 661
- Lehner et al. (2013) Lehner, N., Howk, J. C., Tripp, T. M., et al. 2013, ApJ, 770, 138
- Lehner & Nicolas (2016) Lehner, N. & Nicolas. 2016, in Gas Accretion onto Galaxies, Astrophys. Sp. Sci. Libr. eds. A. J. Fox R. Dave, 2017, Publ. by Springer
- Lehner et al. (2016) Lehner, N., O’Meara, J. M., Howk, J. C., Prochaska, J. X., & Fumagalli, M. 2016, ApJ, 833, 283
- Lopez-Sanchez & Esteban (2009) Lopez-Sanchez, A. R. & Esteban, C. 2009, A&A, 508, 615
- Martin (1999) Martin, C. L. 1999, ApJ, 513, 156
- Martin (2005) Martin, C. L. 2005, ApJ, 621, 227
- Mathews & Baker (1971) Mathews, W. G. & Baker, J. C. 1971, ApJ, 170, 241
- McLean et al. (2012) McLean, I., Steidel, C., Epps, H., et al. 2012, in Soc. Photo-Optical Instrum. Eng. Conf. Ser., Vol. 8446
- Michałowski et al. (2016) Michałowski, M. J., Ceron, J. M. C., Wardlow, J. L., et al. 2016, A&A, 595, A72
- Michałowski et al. (2015) Michałowski, M. J., Gentile, G., Hjorth, J., et al. 2015, A&A, 582, A78
- Oke et al. (1995) Oke, J., Cohen, J., Carr, M., et al. 1995, PASP, 107, 375
- Page et al. (2008) Page, K. L., Barthelmy, S. D., Burrows, D. N., et al. 2008, GRB Coord. Netw., 8080
- Page et al. (2009) Page, K. L., Willingale, R., Bissaldi, E., et al. 2009, MNRAS, 400, 134
- Perley et al. (2013) Perley, D. A., Levan, A. J., Tanvir, N. R., et al. 2013, ApJ, 778, 128
- Perley et al. (2012) Perley, D. A., Modjaz, M., Morgan, A. N., et al. 2012, ApJ, 758
- Perley et al. (2016a) Perley, D. A., Quimby, R. M., Yan, L., et al. 2016a, ApJ, 830, 13
- Perley et al. (2016b) Perley, D. A., Tanvir, N. R., Hjorth, J., et al. 2016b, ApJ, 817, 8
- Peroux et al. (2007) Peroux, C., Dessauges-Zavadsky, M., D’Odorico, S., Kim, T.-S., & McMahon, R. G. 2007, MNRAS, 382, 177
- Pettini et al. (2002) Pettini, M., Rix, S. A., Steidel, C. C., et al. 2002, ApJ, 569, 742
- Phillips et al. (1982) Phillips, A. P., Gondhalekar, P. M., & Pettini, M. 1982, MNRAS, 200, 687
- Pieri et al. (2013) Pieri, M. M., Mortonson, M. J., Frank, S., et al. 2013, MNRAS, 441, 1718
- Planck Collaboration (2014) Planck Collaboration. 2014, A&A, 571, A16
- Prochaska et al. (2006) Prochaska, J. X., Chen, H., & Bloom, J. S. 2006, ApJ, 648, 95
- Prochaska et al. (2007a) Prochaska, J. X., Chen, H., Bloom, J. S., et al. 2007a, ApJS, 168, 231
- Prochaska et al. (2007b) Prochaska, J. X., Chen, H., Dessauges-Zavadsky, M., & Bloom, J. S. 2007b, ApJ, 666, 267
- Prochaska et al. (2008) Prochaska, J. X., Chen, H., Wolfe, A. M., Dessauges-Zavadsky, M., & Bloom, J. S. 2008, ApJ, 672, 59
- Prochaska et al. (2015) Prochaska, J. X., O’Meara, J. M., Fumagalli, M., Bernstein, R. A., & Burles, S. M. 2015, ApJS, 221, 2
- Prochaska et al. (2017) Prochaska, J. X., Werk, J. K., Worseck, G., et al. 2017, ApJ, 837, 169
- Prochaska & Wolfe (1998) Prochaska, J. X. & Wolfe, A. M. 1998, ApJS, 121, 369
- Prochaska & Wolfe (2002) Prochaska, J. X. & Wolfe, A. M. 2002, ApJ, 566, 68
- Prochter et al. (2010) Prochter, G. E., Prochaska, J. X., O’Meara, J. M., Burles, S., & Bernstein, R. A. 2010, ApJ, 708, 1221
- Quiret et al. (2016) Quiret, S., Péroux, C., Zafar, T., et al. 2016, MNRAS, 458, 4074
- Rafelski et al. (2014) Rafelski, M., Neeleman, M., Fumagalli, M., Wolfe, A. M., & Prochaska, J. X. 2014, ApJL, 782, L29
- Rafelski et al. (2012) Rafelski, M., Wolfe, A. M., Prochaska, J. X., Neeleman, M., & Mendez, A. J. 2012, ApJ, 755, 89
- Rees & Ostriker (1977) Rees, M. J. & Ostriker, J. P. 1977, MNRAS, 179, 541
- Robaina et al. (2009) Robaina, A. R., Bell, E. F., Skelton, R. E., et al. 2009, ApJ, 704, 324
- Rodriguez-Gomez et al. (2015) Rodriguez-Gomez, V., Genel, S., Vogelsberger, M., et al. 2015, MNRAS, 449, 49
- Rol et al. (2007) Rol, E., van der Horst, A., Wiersema, K., et al. 2007, ApJ, 669, 1098
- Roming et al. (2005) Roming, P. W. A., Kennedy, T. E., Mason, K. O., et al. 2005, Space Sci. Rev., 120, 95
- Rubin et al. (2012) Rubin, K. H. R., Prochaska, J. X., Koo, D. C., & Phillips, A. C. 2012, ApJL, 747, 26
- Rubin et al. (2014) Rubin, K. H. R., Prochaska, J. X., Koo, D. C., et al. 2014, ApJ, 794, 156
- Sanders et al. (1988) Sanders, D. B., Soifer, B. T., Elias, J. H., et al. 1988, ApJ, 325, 74
- Savage & Sembach (1996) Savage, B. D. B. & Sembach, K. R. K. 1996, ARA&A, 34, 279
- Savaglio et al. (2003) Savaglio, S., Fall, S. M., & Fiore, F. 2003, ApJ, 585, 638
- Savaglio et al. (2012) Savaglio, S., Rau, A., Greiner, J., et al. 2012, MNRAS, 420, 627
- Schady et al. (2012) Schady, P., Dwelly, T., Page, M. J., et al. 2012, A&A, 536, A15
- Schady et al. (2011) Schady, P., Savaglio, S., Krühler, T., Greiner, J., & Rau, A. 2011, A&A, 525, 1
- Schaefer et al. (2003) Schaefer, B. E., Gerardy, C. L., Hoflich, P., et al. 2003, ApJ, 588, 387
- Shapley et al. (2003) Shapley, A. E., Steidel, C. C., Pettini, M., & Adelberger, K. L. 2003, ApJ, 588, 65
- Sparre et al. (2014) Sparre, M., Hartoog, O. E., Krühler, T., et al. 2014, ApJ, 785, 150
- Steidel et al. (2010) Steidel, C. C., Erb, D. K., Shapley, A. E., et al. 2010, ApJ, 717, 289
- Thöne et al. (2013) Thöne, C. C., Fynbo, J. P. U., Goldoni, P., et al. 2013, MNRAS, 428, 3590
- van der Walt et al. (2011) van der Walt, S., Colbert, S. C., & Varoquaux, G. 2011, Comput. Sci. Eng., 13, 22
- Viegas (1995) Viegas, S. M. 1995, MNRAS, 276, 268
- Vladilo (1998) Vladilo, G. 1998, ApJ, 493, 583
- Vladilo et al. (2011) Vladilo, G., Abate, C., Yin, J., Cescutti, G., & Matteucci, F. 2011, A&A, 530, A33
- Vogt et al. (1994) Vogt, S. S., Allen, S. L., Bigelow, B. C., et al. 1994, Soc. Photo-Optical Instrum. Eng. Conf. Ser., 2198, 362
- Vreeswijk et al. (2013) Vreeswijk, P. M., Ledoux, C., Raassen, A. J. J., et al. 2013, A&A, 549, A22
- Watson et al. (2006) Watson, D. J., Fynbo, J. P. U., Ledoux, C., et al. 2006, ApJ, 652, 1011
- Weiner et al. (2009) Weiner, B. J., Coil, A. L., Prochaska, J. X., et al. 2009, ApJ, 692, 187
- Werk et al. (2016) Werk, J. K., Prochaska, J. X., Cantalupo, S., et al. 2016, ApJ, 833, 54
- Werk et al. (2012) Werk, J. K., Prochaska, J. X., Thom, C., et al. 2012, ApJS, 198, 3
- White & Frenk (1991) White, S. D. M. & Frenk, C. S. 1991, ApJ, 379, 52
- White & Rees (1978) White, S. D. M. & Rees, M. J. 1978, MNRAS, 183, 341
- Wiseman et al. (2017) Wiseman, P., Schady, P., Bolmer, J., et al. 2017, A&A, 599, A24
- Wolfe et al. (2005) Wolfe, A. M., Gawiser, E., & Prochaska, J. X. 2005, ARA&A, 43, 861
- Wolfe et al. (1986) Wolfe, A. M., Turnshek, D. A., Smith, H. E., & Cohen, R. D. 1986, ApJS, 61, 249
- Woosley & Bloom (2006) Woosley, S. E. & Bloom, J. S. 2006, Annu. Rev. Astron. Astrophys, 44, 507
| System A | ||||||||
| Component | A | |||||||
| 3.362057 | ||||||||
| km s-1a𝑎aa𝑎aRelative velocity compared to component B at | +760 | |||||||
| km s-1b𝑏bb𝑏b is the broadening parameter for the component determined from the fit to the highest S/N, unsaturated and unblended lines | 5.0 | |||||||
| Ion | Transitions Observedc𝑐cc𝑐cOnly transitions in bold have been used in the determining of column densities or upper limits | |||||||
| 1036, 1334 | 13.32 0.02 | |||||||
| * | 1335 | ¡ 12.35 | ||||||
| 1302 | ¡12.05 | |||||||
| 1670 | ||||||||
| 1260 | 12.26 0.03 | |||||||
| * | 1265 | ¡ 12.25 | ||||||
| 1608 | ¡ 12.65 | |||||||
| Component | AG | AF | AE | AD | AC | AB | AA | |
| 3.359289 | 3.359745 | 3.360141 | 3.360861 | 3.361471 | 3.362057 | 3.362520 | ||
| km s-1a𝑎aa𝑎aRelative velocity compared to component B at | +570 | +601 | +628 | +678 | +720 | +760 | +792 | |
| km s-1b𝑏bb𝑏b is the broadening parameter for the component determined from the fit to the highest S/N, unsaturated and unblended lines | 11 | 8 | 13 | 11 | 18 | 9 | 23 | |
| Ion | Transitions observedc𝑐cc𝑐cOnly transitions in bold have been used in the determining of column densities or upper limits | |||||||
| Lyman series d𝑑dd𝑑dsee Section 3.1.1 and Figs 3,4 | ||||||||
| 1548, 1550 | 13.56 0.01 | ¿14.2 (S) | ¿14.7 (S) | ¿ 14.7 (S) | 14.6 0.02 | ¿14.4 (S) | 13.12 0.07 | |
| 1238, 1242 | ¡12.0 | |||||||
| 1031, 1037 | 13.6 0.7e𝑒ee𝑒efootnotemark: | 13.7 0.3f𝑓ff𝑓ffootnotemark: | - | - | 14.75 0.01g𝑔gg𝑔gfootnotemark: | - | - | |
| 1393 ,1402 | 12.92 0.02 | ¿ 13.7 (S) | 13.58 0.01 | 13.720.01 | 13.18 0.02 | ¿13.7 (S) | 12.61 0.05 | |
| System B | |||||||
| Component | B | B | B | B | |||
| 3.350286 | 3.351030 | 3.351123 | 3.351743 | ||||
| km s-1a𝑎aa𝑎aRelative velocity compared to component B at | -51 | 0 | +6 | +49 | |||
| km s-1b𝑏bb𝑏b is the broadening parameter for the component determined from the fit to the highest S/N, unsaturated and unblended lines | 15 | 7 | 12 | 15 | |||
| Ion | Transitions Observedc𝑐cc𝑐cOnly transitions in bold have been used in the determining of column densities or upper limits | ||||||
| 1334 | 13.140.04 | ¿14.5 (S) | ¿13.7 (S) | 13.78 0.01 | |||
| * | 1335 | ¿14.5 (S) | ¿13.2 (S) | 13.33 0.02 | |||
| 1083 | 13.03 0.08 | 13.890.03 | 13.290.07 | 13.330.04 | |||
| 1302 | 13.650.02 | 12.93 | |||||
| 1670 | 11.71 0.05 | ¿12.87 (S) | ¿11.79 | 12.220.02 | |||
| 1190, 1193, 1260, | 12.230.06 | 13.820.02 | ¡12.0 | 12.850.08 | |||
| 1304, 1526 | |||||||
| * | 1194, 1197, 1264, | ¡11.0 | 12.870.03 | 11.70.3 | 11.9 0.1 | ||
| 1309, 1533 | |||||||
| 1608 | ¡12.70 | ||||||
| Component | BF | BE | BD | BC | BB | BA | |
| 3.349792 | 3.350286 | 3.351016 | 3.351349 | 3.351630 | 3.351808 | ||
| km s-1a𝑎aa𝑎aRelative velocity compared to component B at | -83 | -51 | -1 | 22 | 41 | 54 | |
| km s-1b𝑏bb𝑏b is the broadening parameter for the component determined from the fit to the highest S/N, unsaturated and unblended lines | 10 | 11 | 7 | 33 | 4 | 8 | |
| Ion | Transitions Observedc𝑐cc𝑐cOnly transitions in bold have been used in the determining of column densities or upper limits | ||||||
| Lyman series d𝑑dd𝑑dsee Section 3.1.1 and Figs 3,4 | (S) | (S)hℎhhℎhCombined upper limit for BA+ BB + BC | |||||
| 1548, 1550 | 13.200.01 | 13.200.02 | 13.390.02 | 13.280.02 | 12.70.06 | 13.420.02 | |
| 1238, 1242 | ¡12.3 | ||||||
| 1393, 1402 | 12.600.02 | 12.890.01 | 13.250.01 | 13.160.02 | 12.280.05 | 12.990.02 | |
| System C | ||||
| Component | C | |||
| 3.348545 | ||||
| km s-1a𝑎aa𝑎aRelative velocity compared to component B at | -171 | |||
| km s-1b𝑏bb𝑏b is the broadening parameter for the component determined from the fit to the highest S/N, unsaturated and unblended lines | 4 | |||
| Ion | Transitions Observedc𝑐cc𝑐cOnly transitions in bold have been used in the determining of column densities or upper limits | |||
| 1334 | 13.500.02 | |||
| * | 1335 | 13.110.03 | ||
| Table (cont) | ||||
| Ion | Transitions Observedc𝑐cc𝑐cOnly transitions in bold have been used in the determining of column densities or upper limits | |||
| 1083 | ||||
| 1302 | ¡11.2 | |||
| 1670 | 11.66 0.04 | |||
| 1190, 1193, 1260, | 13.040.03 | |||
| 1304, 1526 | ||||
| * | 1194, 1197, 1264, | 11.70.1 | ||
| 1608 | ¡12.75 | |||
| Component | CC | CB | CA | |
| 3.348234 | 3.348552 | 3.348649 | ||
| km s-1a𝑎aa𝑎aRelative velocity compared to component B at | -193 | -171 | -164 | |
| km s-1b𝑏bb𝑏b is the broadening parameter for the component determined from the fit to the highest S/N, unsaturated and unblended lines | 22 | 41 | 54 | |
| Ion | Transitions Observedc𝑐cc𝑐cOnly transitions in bold have been used in the determining of column densities or upper limits | |||
| Lyman series d𝑑dd𝑑dsee Section 3.1.1 and Figs 3,4 | i𝑖ii𝑖i km s-1 | |||
| 1548, 1550 | 13.20.2 | 13.270.06 | 13.20.2 | |
| 1238, 1242 | ||||
| 1393, 1402 | 12.210.08 | 12.660.02 | 12.010.1 | |
| System D | |||||
| Component | DD | DC | DB | DA | |
| 3.345680 | 3.346103 | 3.346212 | 3.346816 | ||
| km s-1a𝑎aa𝑎aRelative velocity compared to component B at | -369 | -339 | -332 | -290 | |
| km s-1b𝑏bb𝑏b is the broadening parameter for the component determined from the fit to the highest S/N, unsaturated and unblended lines | 4 | ||||
| Ion | Transitions Observedc𝑐cc𝑐cOnly transitions in bold have been used in the determining of column densities or upper limits | ||||
| Lyman series d𝑑dd𝑑dsee Section 3.1.1 and Figs 3,4 | |||||
| 1036, 1334 | 12.660.05 | ||||
| 1083 | |||||
| 1238, 1242 | |||||
| 1548, 1550 | |||||
| 1302 | ¡12.5 | ||||
| 1670 | |||||
| 1190, 1260 | j𝑗jj𝑗jThe true nature of this measurement is discussed in Section 4.4 | ||||
| 1309 | |||||
| 1393, 1402 | |||||
| 1608 |