Absence of selection for quantum coherence in the Fenna-Matthews-Olson complex: a combined evolutionary and excitonic study
Abstract
We present a study on the evolution of the Fenna-Matthews-Olson bacterial photosynthetic pigment-protein complex. This protein complex functions as an antenna. It transports absorbed photons —excitons —to a reaction center where photosynthetic reactions initiate. The efficiency of exciton transport is therefore fundamental for the photosynthetic bacterium’s survival. We have reconstructed an ancestor of the complex to establish whether coherence in the exciton transport was selected for or optimized over time. We have also investigated on the role of optimizing free energy variation upon folding in evolution. We studied whether mutations which connect the ancestor to current day species were stabilizing or destabilizing from a thermodynamic view point. From this study, we established that most of these mutations were thermodynamically neutral. Furthermore, we did not see a large change in exciton transport efficiency or coherence and thus our results predict that exciton coherence was not specifically selected for.
The Fenna-Matthews-Olson complex is a light-harvesting protein complex found in green sulfur bacteria. These bacteria first appeared about 1.6 bilion years ago, in the Proterozoic era (Brocks et al., 2005). Green sulfur bacteria survive through anoxygenic photosynthesis; they use sulfide and other reduced sulfur compounds or hydrogen as photosynthetic electron donors (Blankenship, 2014).
In the last decade, much research has been dedicated to understanding the excitation energy transfer in the Fenna-Matthews-Olson (FMO) protein complex (Adolphs and Renger, 2006; Mohseni et al., 2008; Rebentrost et al., 2009a; Ishizaki and Fleming, 2009a; Rebentrost et al., 2009b; Panitchayangkoon et al., 2010; Rebentrost et al., 2011; Ritschel et al., 2011; Shim et al., 2012; Valleau et al., 2012; Dostlál et al., 2016). Once absorbed, photons become molecular excitations, or excitons. These excitons are then transported through the complex due to their interactions with neighboring excitations, the protein scaffold and the environment. A renewed interest in this complex arose when low temperature 2D-spectroscopy experiments suggested the presence of quantum coherence effects (Engel et al., 2007; Scholes et al., 2017) in the exciton dynamics. Quantum coherent effects can be thought of as concurrent beats between electronic excitations which do not occur classically. Following these experiments, much theoretical work was carried out (Fassioli and Olaya-Castro, 2010; Ishizaki and Fleming, 2009a; Kreisbeck and Kramer, 2012; Olaya-Castro et al., 2008; Olbrich et al., 2011) with the goal of understanding whether quantum effects were present and if so, how they contributed to the exciton transport.
Most of the studies have relied on the existence of an X-ray crystal structure of the FMO complex of either Chlorobaculum tepidum or Prosthecochloris aestuarii.
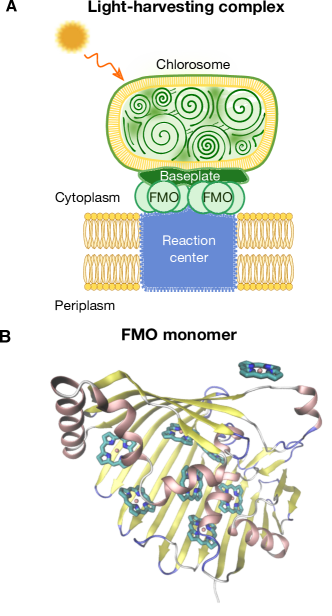
FMO is found in all of the anaerobic Chlorobi phyla and recently it has also been found in aerobic Chloracidobacterium thermophilum of the Acidobacteria phyla (Wen et al., 2011). In these organisms, the FMO complex forms a homo trimer (see Fig. 1). Each monomer consists of 7/8 bacteriochlorophyll-a (BChl-a) pigment molecules enclosed in a protein scaffold. The BChl pigment molecules interact with the protein scaffold through coordination and hydrogen bonds. The complex is thought to act as an excitonic wire, funneling the excitation from the baseplate to the reaction center where charge separation occurs. This charge separation enables reactions which are fundamental to the organisms’ survival. The biological origin of the complex remains a mystery. Olson et al. (Ref. (Olson, 2004)) speculated that the FMO complex might have come from an ancient reaction center. They looked for homology between the FMO protein and PscA, the reaction center protein of green sulfur bacteria. They found a signature sequence common to both, however the sequences only had a 13% identity score. More recently, the role of some specific site mutations (Saer et al., 2017) and of cysteines in the FMO protein has been investigated as well (Saer et al., 2016). In Ref. (Saer et al., 2016) it was found that cysteines appear to be fundamental for the photoprotection mechanism of the protein complex.
Regarding exciton transport in this system, there have only been few efforts to understand whether and how protein evolution might have influenced it. For instance, in Ref. (Müh et al., 2007), the authors computed the BChl transition energies and looked at the effect of including the point charges coming from the protein. They also looked at how changes in the polar groups of amino acids, such as the amino or hydroxyl groups, influence BChl transition energies. They found that the charges coming from the alpha helices seem to influence the energies strongly. On the other hand, no large change in the energies was observed when they modified the charge distribution of single amino acids as a means to emulate single point mutations. Experimentally, the Blankenship group (Tronrud et al., 2009) looked at comparing the optical properties of FMO coming from three different species to understand the effect of the protein scaffold. They observed spectral differences, and these were assigned to the way the BChl molecules bind to the protein scaffold in each species. This suggests that one may probe exciton dynamics and the biological role of coherence through point mutations. In this sense, we are most interested in mutations occurring in the vicinity of BChl binding sites as the effect of their charge is expected to have a stronger influence on the BChl energies.
For the above reasons, we have carried out a theoretical study of the protein complex from an evolutionary perspective. We aimed to identify whether quantum coherence in exciton transport and thermodynamic stability (free energy change upon folding) guided the evolution of the protein complex. Hence, we carried out calculations which trace evolution of exciton transport as well as evolution of thermodynamic stability. For the thermodynamics, we studied the stability of the current day protein complex to mutations by computing and comparing the folding free energy change of the mutant to that of the non mutated protein complex. Subsequently, we constructed an ancestor for the FMO complex and computed the folding free energies due to point mutations along the phylogenetic tree. Thus, with these two results, we were able to compare the stability of C. tepidum to the stability of it’s ancestors and see how it changed along the tree. To investigate on role of exciton transport, we computed and compared exciton transport in the ancestor with that of C. tepidum. Because two-dimensional photon echo (2D-echo) spectroscopy is the experimental tool employed to reveal coherent phenomena, we computed this spectrum to determine the role of coherence in the evolution from ancestor to C. tepidum. Finally, from the reconstructed phylogenetic tree, we identified sites under positive selection and determined whether positively selected amino acids were close to BChl molecules and could influence exciton transport.
Results
Robustness of current day FMO proteins to mutations
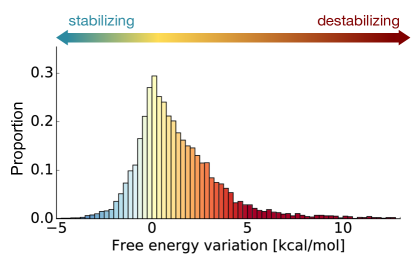
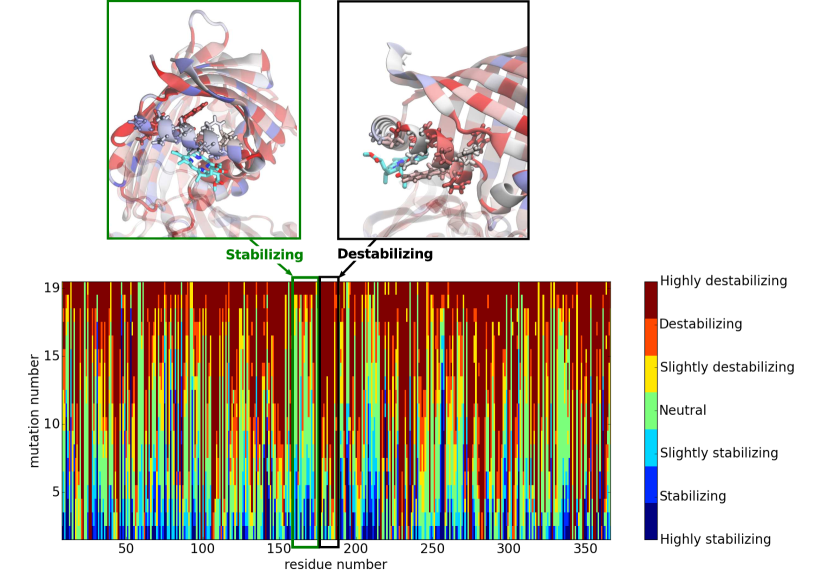
We computed the free energy change upon folding, , as a measure of robustness of the FMO complex to mutations. Calculations were carried out using FoldX (Guerois et al., 2002) for the trimers of C. tepidum and P. aestuarii for all possible single point mutations (see Methods for details). In our model, each single point mutation occurs at the same time in all monomers of the trimer. We found that most single point mutations would be destabilizing ~ 60% (see Fig. 2). The overall landscape of mutations is the same for C. tepidum and P. aestuarii (see Fig. S2 in the Supporting Information). This is qualitatively similar to the general statistics of the effects of mutations on stability (see Ref. (Zeldovich et al., 2007; Tokuriki et al., 2007)).
We also looked at how the free energy change varies depending on the location of the mutation in the protein complex monomers of P. aestuarii and C. tepidum and found that mutations at the interface of monomers are among the most destabilizing (see Fig. S3).These observations rely on the assumption that each single point mutation (in each monomer) does not impede the assembling of a trimeric structure.
Ancestor reconstruction, selection of mutations and variation of the free energy landscape
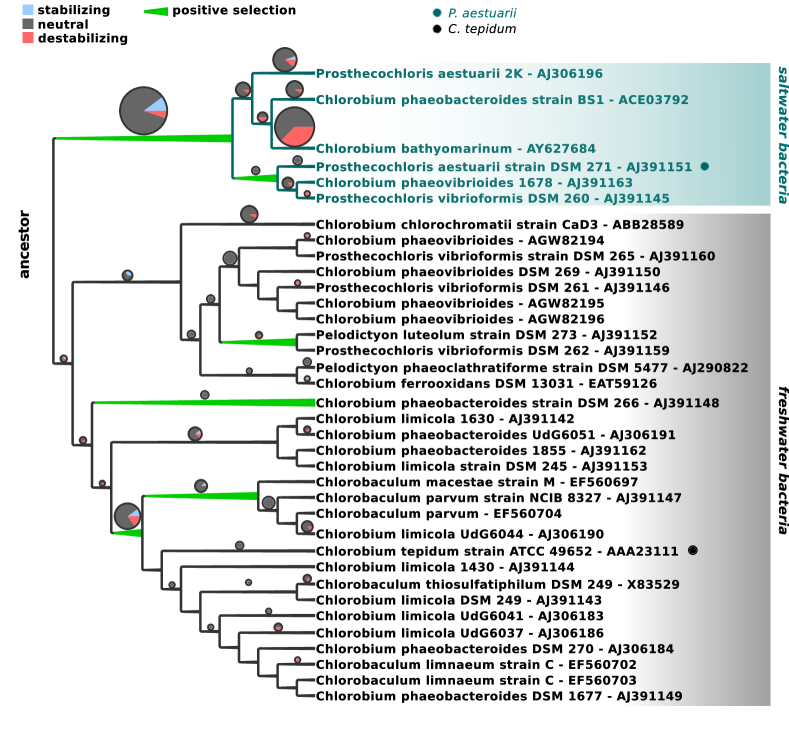
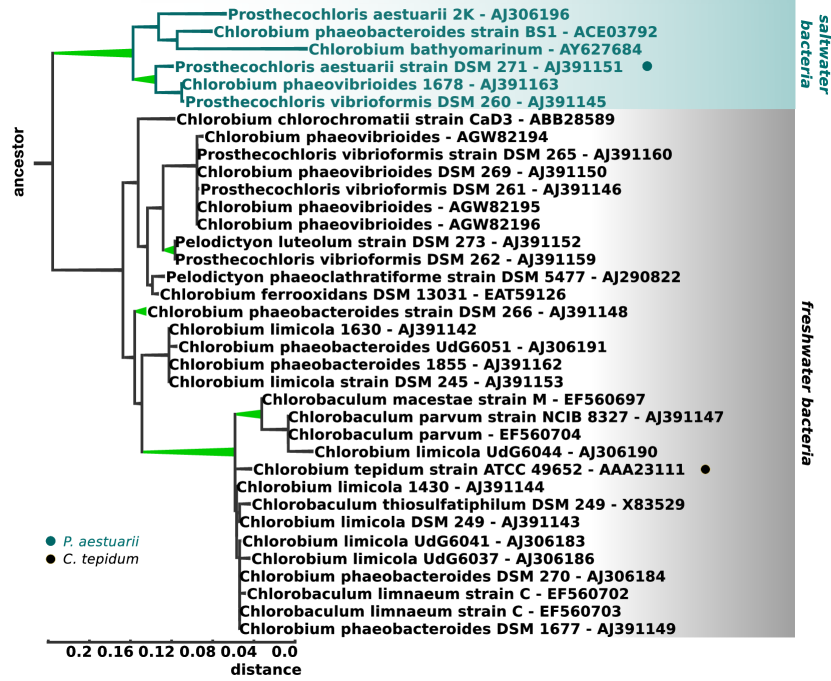
A phylogenetic tree was generated using the multiple sequence alignment built from the fmoA amino acid sequences (see details in Methods). The amino acid sequences were obtained by translating the fmoA monomer gene sequences. In Fig. 3 we show the cladogram tree (phylogenetic tree is also shown in Fig. S1). The tree divides in two main clades: saltwater (e.g. P. aestuarii) and freshwater (e.g. C. tepidum) bacteria.
At each node of the tree, the sequence and structure of the protein scaffold were reconstructed. The ancestral amino acid sequences were obtained using Bayesian inference and the scaffold structures were computed using homology modeling (see Methods). The pie-charts above each branch indicate, based on the diameter, how many mutations occurred between the two branch nodes, and based on the color, whether they were stabilizing (blue), neutral (grey) or destabilizing (red). Most mutations were neutral in terms of modifying the free energy change upon folding.
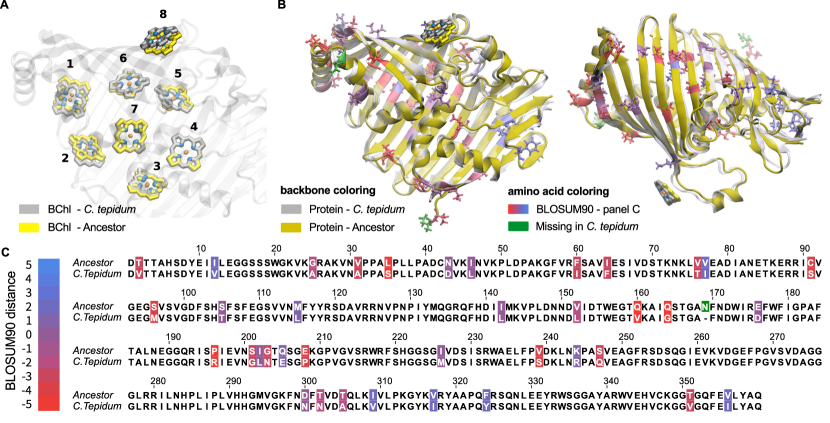
Given the inferred ancestor amino acid sequence at the root we constructed a guess for the full ancestral structure (protein scaffold and BChl molecules) through a combination of homology modeling and molecular dynamics simulations (see Methods). An image of the structure of the putative ancestor compared to that of C. tepidum for one monomer is shown in Fig. 4. The images in each panel are constructed from a snapshot of the molecular dynamics simulations at 300K after equilibration. In panel B, we show two orientations of one monomer of the protein complex. No large difference in the backbone of the protein is observed. This is due to the fact that the protein scaffold was constructed with homology modelling. The differences come from the location of side chains and the change in charge of the mutated amino acids. In panel B, mutations are highlighted using a color scheme based on the BLOSUM90 distance. We see a few red mutations (large negative BLOSUM90 distance) on the beta sheet which could be a problem for the formation of the trimer. Another effect of the mutations is the change in orientation of BChl molecules (see Panel A). This change in orientation of the BChls influences the coupling amongst their first excited states (see Table S1). In particular, the coupling between the first excited states of BChl 3 and 4 is weaker in the ancestor than in C. tepidum and, on the other hand, the coupling between the first excited states of BChl 4 and 5 is stronger in the ancestor than it is in C. tepidum. Finally, as can be seen in Tab. S2, the average distance of the amino acids from the BChl molecules changes between the ancestor and C. tepidum and the differences are on the order of 0.1-0.4.
Given the phylogenetic tree, we also identified branches under positive selection (bright green) by using the branch-site model (details in Methods). In Fig. 5, we show mutations which were positively selected for along these branches in the structure of C. tepidum.
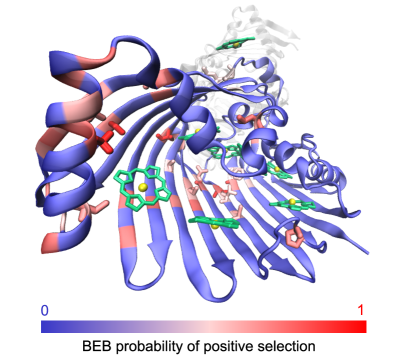
Most positively selected mutations are distant from the BChl residues, and therefore we currently do not believe they had a strong role in modifying exciton transport. Given the high computational cost associated with constructing the full structure (with BChl molecules) at each node, we did not investigate the role of each positively selected mutation using atomistic ab initio methods. However, we computed the free-energy changes associated with the mutations.
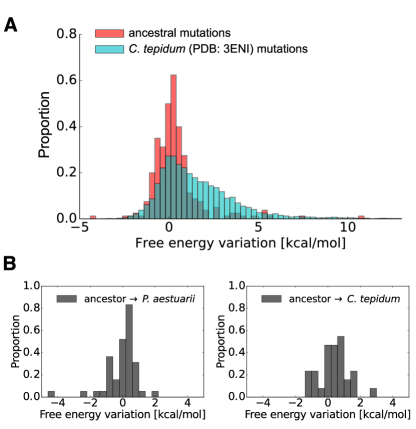
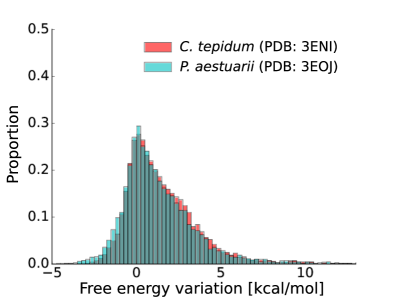
In Fig. 6, panel A, we show the histogram of free energy changes which connects the ancestor to current day species in red and, in cyan, the histogram of folding free energy variation for all possible single-point mutations in the FMO complex trimer of C. tepidum. We found that 65% of mutations are destabilizing for C. tepidum. On the other hand only 32% of mutations of the ancestral FMO complex along the phylogenetic tree were destabilizing while 21% were stabilizing and 47% were neutral. This could indicate that mutations which favored the folding free energy change variation during evolution led to more stable current day protein structures. However, we cannot claim this in general as the trend changes for different current day species. For instance, as can be seen by comparing the two figures in panel B of Fig. 6, the distribution of folding free energy changes for mutations which connect the ancestor to P. aestuarii is significantly different from that for mutations which connect the ancestor to C. tepidum. This difference was confirmed by the Kolmogorov-Smirnov test. Furthermore, we computed that, for the mutations which connect the ancestor to P. aestuarii, 25 % are stabilizing and 19% are destabilizing. However, in the case of mutations which lead to C. tepidum, 47% are destabilizing while 22% are stabilizing. This indicates that C. tepidum is less stable than the ancestor while P. aestuarii is more stable than the ancestor.
Exciton transport and coherence
Absorption, circular dichroism and linear dichroism
In Fig. 7

we compare the absorption spectrum of the ancestor to that of C. tepidum. The ancestor spectrum shows three main absorption peaks at 807, 819 and 830 nm while C. tepidum shows strong absorption at 804, 814 and 826 nm. These trends and the corresponding circular dichroism spectra (see Supporting Information) of the ancestor and of C. tepidum are very similar, respectively, to the spectra of FMO in C. thiosulfatophilum and C. limicola reported in Ref. (Olson et al., 1976). However, we do not see strong evidence of a similarity between the ancestor spectrum and the reaction center absorption spectra reported in that work. The small bump at about 845 nm (see Fig. 7) is most likely due to noise, as it does not correspond to any of the frequencies of the equivalent Fermi-Golden rule absorption spectrum. Therefore, our current results do not confirm that the ancestor is related to current day PscA, the reaction center protein of green sulfur bacteria, however we cannot exclude that it may have been related to ancestral reaction centers.
In the Supporting Information we also show the comparison of our C. tepidum spectra to the experimental absorption, linear dichroism and circular dichroism spectra.
Coherence and 2D spectra
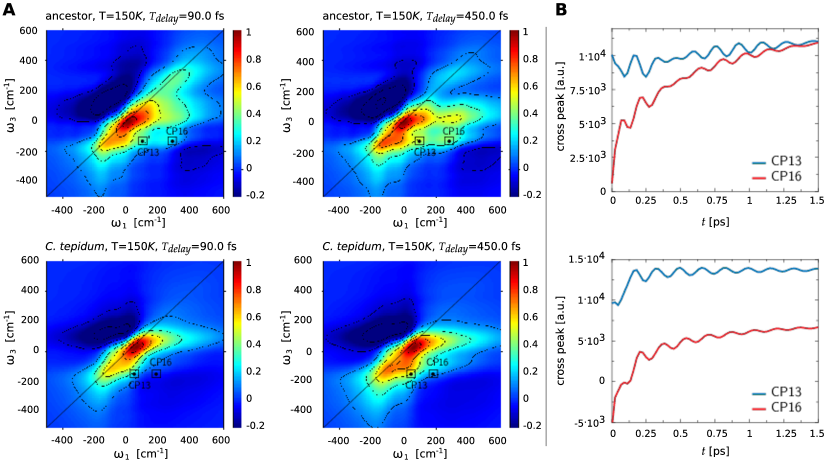
Using the hierarchy equation of motion (HEOM) non-Markovian master equation method (Tanimura and Kubo, 1989; Ishizaki and Tanimura, 2006; Ishizaki and Fleming, 2009b), we computed the 2D-echo spectra of the reconstructed ancestral FMO complex and of C. tepidum at 150 K. To this end we employed the QMaster software package (Kreisbeck et al., 2014) (for more details see Methods). The spectral densities which were employed are described in Methods. These were obtained by fitting the original QM/MM spectral densities to Drude-Lorentz spectral densities with three peaks. The spectral densities indicated a similar coupling strength of the system to the bath for the ancestral and C. tepidum FMO complexes for almost all modes. The total signal of the 2D-echo spectra, i.e. sum of the stimulated emission (SE), ground state bleaching (GB), and excited state absorption (ESA) pathways is shown in Fig. 8. From the oscillations of the cross-peaks in panel B) we cannot deduce an improvement in quantum coherence or a significant difference between the ancestor and C. tepidum. For all species, cross-peak beatings in the 2D-echo spectra are dominated by ground state vibrations (Kreisbeck et al., 2013) superposed by minor vibronic contributions. This suggests that optimizing exciton transport through quantum coherence was not part of the evolution of the FMO complex.
Conclusion
We have reconstructed a structure for the ancestral Fenna-Matthews-Olson complex and found that mutations of it’s amino acids over time have influenced the free energy upon folding of the protein complex. In particular, the current day specie of P. aestuarii was obtained through stabilizing mutations while that of C. tepidum is less stable than the ancestor. Regarding exciton transport, we do not observe a significant change or improvement in the efficiency of exciton transport or quantum coherent transport. These results suggest that the complex did not evolve to optimize for quantum coherent transport. It is also possible that the ancestor was already sufficiently optimized for exciton transport and therefore further evolution or optimization was not necessary. One of the results we find is that mutations most likely led to better binding of the FMO complex to the baseplate and reaction center. This is confirmed by the larger instability associated with mutating residues in those locations. This leaves an open question: perhaps the overall exciton transport, from the chlorosome to the reaction center, was optimized by favoring mutations in FMO which led to a stronger binding of FMO to its neighbouring protein systems.
For future work, we are interested in looking at the exciton transport at each node of the phylogenetic tree and further in expressing the ancestral sequence in current day C. tepidum to obtain an experimental structure and 2D-echo spectra for the ancestor. Finally it would be interesting to look at the role of photoprotection to see whether the mutations could have influenced it.
Methods and computational details
Stability of the C. tepidum and P. aestuarii Fenna-Matthews-Olson complex to mutations
Each of the amino acids of the trimer and monomer of the FMO complex of P. aestuarii and C. tepidum were mutated to the each of the other possible 19 amino acids using FoldX (Guerois et al., 2002). The corresponding free energy variation upon folding was obtained for each mutation. In order to account for the effect of mutations at the interface between monomers within the trimer, the mutations were carried out simultaneously in each monomer of the trimer and the resulting free energy variation was normalized by dividing by three.
In FoldX, mutations are modeled as follows. The initial crystal structure is optimized to remove any eventual steric clashes. Then, the residue of interest is mutated and its nearest neighbors are mutated to themselves and conformationally relaxed to remove any local clash. The nearest neighbors are mutated to themselves so that their geometry may be optimized toghether with that of the central residue. During this procedure the backbone of the protein is kept fixed and all other residues that are far from the one of interest are also kept fixed. The stability, , of this relaxed structure is obtained by using an effective energy function. Subsequently, the residue of interest is mutated to each of the other 19 amino acids and its neighbors to themselves and the various are computed.
The procedure described above was repeated 5 times for each mutation to ensure that the minimum energy conformations of large residues that have many rotamers were identified. The effective energy function (“effective energy” here refers to the Helmoltz free energy of a system (protein + solvent) for a fixed protein conformation) in FoldX has been optimized for amino acid sequences, thus all BChl-a molecules could not be included directly in this calculation. To account for their presence, the structures given in input to FoldX were obtained by homology modeling with Modeller (Sali and Blundell, 1993). In the Modeller simulations, the BChl molecules were inserted and kept fixed as hard spheres. In the FoldX optimization the residues that are known to bind to BChl-a molecules from the crystal structure analysis of FMO complexes from current day species were also kept fixed. A similar procedure was recently employed successfully for the case of RubisCO where Mg atoms are present (Studer et al., 2013).
Determination of positively selected sites: site and branch-site models
Phylogenetic tree
All fmoA gene sequences from the EMBL database were gathered and employed to generate an alignment using translatorX with MAFFT (Abascal et al., 2010). Phylogenetic trees were constructed using PhyML (Guindon et al., 2010) with 5000 bootstraps. The parameters and settings used in PhyML were as following. The LG substitution model was chosen. We selected to have four substitution rate categories. The alpha parameter for the gamma distribution of sites was set to be estimated by the code. Both NNIs and SPR methods were used to search for the optimal tree topology and finally, tree topology, branch lengths and rate parameters were chosen to be optimized by the code. A set of three trees were constructed. In the first tree, all sequences were included excluding FJ210646, as it was missing about 100 residues. Therefore, including it would have introduced more error in the tree reconstruction phase. For the second tree, we removed Chloroacidobacterium thermophilum (ABV27353) as it had the lowest sequence identity percent and thus also introduced more uncertainty. In the third tree, Chloroherpeton thalassium (ACF13179) was removed as it was the second most distant sequence from the rest. We computed ancestral sequences and searched for positively selected sites on all three trees but we present results for the third tree as we believe it has the smallest error.
Site and branch-site models
The branches under positive selection were identified using the branch-site model (Zhang et al., 2005) as implemented in CodeML. This model allows for variation of (the ratio of synonymous to non synonymous mutations) amongst branches and sites. For each simulation, one branch is selected as a foreground branch and, using CodeML, we computed the likelihood that the branch was under positive selection. The input DNA sequence alignment was the same as the one generated to deduce the phylogenetic tree. Given a branch under positive selection, we determined which amino acids were under positive selection by using the Bayes Empirical Bayes (BEB) model (Yang et al., 2005). We corrected the probability values p-values for False Discovery Rate (FDR) by using the q-value (Bass JDSwcfAJ and D, 2015), as discussed in Ref. (Anisimova and Yang, 2007).
Reconstruction of the ancestral protein structure of FMO
Sequence reconstruction
An ancestral sequence was reconstructed using maxium likelihood as implemented in FastML (Ashkenazy et al., 2012) and the LG+G model for amino acid substitution. The LG+G model was established to be the best model under the Bayesian Information Criterion (BIC). With FastML, we obtained the most probable sequences, together with the posterior probabilities for each character and indel at each sequence position for each internal node of the tree. As inputs, we used the phylogenetic trees described in the previous section and rooted them based on the most distant sequence. The alignments used in the input were the same as those employed to generate the trees. For the last tree that excludes C. thermophilum and C. thalassium, we used the midpoint root, as most sequences are similar, (see Fig. 3) and the branching is almost identical to that obtained when C. thalassium or C. thermophilum are included.
Structure reconstruction and molecular dynamics
The ancestral structure was built by using homology modeling with satisfaction of spatial restraints as implemented in Modeller (Sali and Blundell, 1993). The method of modeling by satisfaction of spatial restraints works as follows. Constraints are generated on the structure of the target sequence using its alignment to the related protein structures as a guide. The restraints are obtained based on the assumption that the structures will be similar in the aligned regions. In MODELLER, the form of the restraints was obtained from a statistical analysis of the relationships between similar protein structures in a database of 105 alignments that included 416 proteins of known 3D structure (Sali and Blundell, 1993). These restraints are supplemented by stereochemical restraints such as bond lengths, angles etc, which are obtained from a force field. Once all these restraints are established, the model structure is obtained in Cartesian space by minimizing the violations of all restraints.
We used the structure of P. aestuarii (PDB: 3EOJ) as the homologue and generated 100 possible structures with slow refinement. The ancestral structure was chosen to be the one with the best molpdb factor. The initally reconstructed structure only included the protein scaffold, as there is no current parametrization for BChl’s in Modeller. Thus, BChl molecules were included subsequently using minimization as implemented in NAMD (Phillips et al., 2005). The chromophores were initially positioned as in the homologous structure and the structure was optimized by minimizing the energy in two steps. In the first step, the backbone was kept fixed, and for the second minimization the backbone was free to move. The structure was subsequently equilibrated without constraints using the Amber14 software package, (Case et al., 2014) with the Amber ff99SB force field(Cheatham et al., 1999). The BChl-a parameters employed are reported in Refs. (Chandrasekaran et al., 2015; Shim et al., 2012). The protonation states of all amino acids were determined with the H++ 3.0 software (Anandakrishnan et al., 2012), under neutral pH conditions. All complexes were solvated using TIP3P periodic water boxes, (Jorgensen and Madura, 1983) with a minimum distance of between the complex and the box boundaries. Charges were neutralized by adding sodium ions for the ancestor and P. aestuarii and chloride for C. tepidum. Shake constraints were applied to all bonds containing hydrogen. Minimizations were carried out for steps for P. aestuarii and C. tepidum and for steps for the ancestor. Minimizations were followed by adaptation runs to impose a temperature of and a pressure of on the systems. All three complexes were equilibrated for in the same environmental conditions. Long range electrostatic interactions were calculated using the Particle-Mesh Ewald method (Essmann et al., 1993). For each complex we then carried out production runs with a integration step.
Correlating biological stability and evolution to exciton dynamics
QM/MM Hamiltonian
For the exciton dynamics, the FMO complex is simulated as a system coupled to a bath (the protein environment). The system Hamiltonian is defined as
| (1) |
where is the first excited state energy of the -th BChl. The terms correspond to the excitonic coupling between the excited states for the and molecule.
Site energies were computed using TDDFT in QChem (Shao et al., 2006) with the PBE0 functional (Perdew et al., 1996) and 3-21G basis set for frames () of the MD production run. Couplings were calculated using two approaches: the point-dipole approximation (PDA) and via transition charges from the electrostatic potential (TrEsp) (Madjet et al., 2006). TrEsp has shown to be the most accurate, although it is computationally more demanding than using the PDA (Madjet et al., 2006). The computed couplings are given in the Supplementary information.
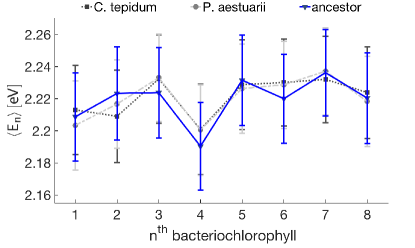
The average first excited state energy of each BChl isshown in Fig. 9. We notice there is no large change in the trend of the excited state energies for the BChl’s.
Exciton coherence and 2d spectrum
The 2d-echo spectra in Fig. 8 were calculated as in Ref. (Hein et al., 2012). In two-dimensional electronic spectroscopy the sample is probed by a sequence of thee laser pulses. Adjusting the delay time between the second and the third pulse yields a time resolved picture of the exciton dynamics. Within the impulsive limit (assuming -pulses), the 2D-echo spectrum is related to the third order response function . Phase matching ensures that the components of the detected signal go along distinct directions, and thus can be experimentally separated. We considered the rephasing (RP) component of the signal
| (2) | ||||
for which coherent phenomena show as unique oscillatory pattern in the cross-peak dynamics as a function of delay time. Using the notation of double sided Feynman diagrams (Mukamel, 1999; Cho, 2009), the total signal is given by three separate pathways: stimulated emission (SE), ground state bleaching (GB) and excited state absorption (ESA). The latter involves the double exciton manifold. We numerically evaluated by propagating the reduced density matrix, describing the exciton degrees of freedom, along the double sided Feynman diagrams. Hereby, each interaction with the laser pulses requires an interruption of the dynamics and a multiplication of the reduced density matrix with the dipole operator, either from the right or from the left. The propagation was done using QMaster (Kreisbeck et al., 2014), a high-performance implementation of HEOM (Kreisbeck et al., 2011; Kreisbeck and Kramer, 2013). The rotational average over random orientations of the probed sample was included by sampling 20 laser polarization vectors aligned with the vertices of a dodecahedron (Hein et al., 2012).
Acknowledgements
S. V. would like to thank Pouria Dasmeh and Adrian Serohijos for their interesting discussions on methods to compute the free energy changes for mutations and phylogenetic tree reconstruction. The authors thank Nicolas Sawaya for sharing his code for the calculation of atomic partial charges from the transition densities. The computations in this paper were completed on the Odyssey cluster supported by the FAS Division of Science, Research Computing Group at Harvard University. S. V., F. H. and A. A.-G. acknowledges support from the Center for Excitonics, an Energy Frontier Research Center funded by the U.S. Department of Energy, Office of Science and Office of Basic Energy Sciences under Award Number DE-SC0001088. A.A.G. acknowledges the generous support from the Canadian Institute for Advanced Research. This work was supported as part of the Photosynthetic Antenna Research Center (PARC), an Energy Frontier Research Center funded by the U.S. Department of Energy, Office of Science, Office of Basic Energy Sciences under Award Number DE-SC 0001035 to REB. RS was supported by the PARC grant.
References
- Brocks et al. [2005] J. J. Brocks, G. D. Love, R. E. Summons, A. H. Knoll, G. A. Logan, and S. A. Bowden, Nature 437, 866 (2005).
- Blankenship [2014] R. E. Blankenship, (Wiley-Blackwell, Oxford, UK, 2014).
- Adolphs and Renger [2006] J. Adolphs and T. Renger, Biophys. J. 91, 2778 (2006).
- Mohseni et al. [2008] M. Mohseni, P. Rebentrost, S. Lloyd, and A. Aspuru-Guzik, J. Chem. Phys. 129, 174106 (2008).
- Rebentrost et al. [2009a] P. Rebentrost, M. Mohseni, I. Kassal, S. Lloyd, and A. Aspuru-Guzik, .
- Ishizaki and Fleming [2009a] A. Ishizaki and G. R. Fleming, Proc. Natl Acad. Sci. USA. 106, 17255 (2009a).
- Rebentrost et al. [2009b] P. Rebentrost, M. Mohseni, and A. Aspuru-Guzik, J. Phys. Chem. B. 113, 9942 (2009b).
- Panitchayangkoon et al. [2010] G. Panitchayangkoon, D. Hayes, K. A. Fransted, J. R. Caram, E. Harel, J. Wen, R. E. Blankenship, and G. S. Engel, Proc. Natl Acad. Sci. USA. 107, 12766 (2010).
- Rebentrost et al. [2011] P. Rebentrost, S. Shim, J. Yuen-Zhou, and A. Aspuru-Guzik, Procedia Chemistry 3, 332 (2011).
- Ritschel et al. [2011] G. Ritschel, J. Roden, W. T. Strunz, A. Aspuru-Guzik, and A. Eisfeld, J. Phys. Chem. Lett. 2, 2912 (2011).
- Shim et al. [2012] S. Shim, P. Rebentrost, S. Valleau, and A. Aspuru-Guzik, Biophys. J. 102, 649 (2012).
- Valleau et al. [2012] S. Valleau, A. Eisfeld, and A. Aspuru-Guzik, J. Chem. Phys. 137, 224103 (2012).
- Dostlál et al. [2016] J. Dostlál, J. Pśenćík, and D. Zigmantas, Nat. Chem. (2016), 10.1038/nchem.2525.
- Engel et al. [2007] G. S. Engel, T. R. Calhoun, E. L. Read, T.-K. Ahn, T. Mancal, Y.-C. Cheng, R. E. Blankenship, and G. R. Fleming, Nature. 446, 782 (2007).
- Scholes et al. [2017] G. D. Scholes, G. R. Fleming, L. X. Chen, A. Aspuru-Guzik, A. Buchleitner, D. F. Coker, G. S. Engel, R. van Grondelle, A. Ishizaki, D. M. Jonas, J. S. Lundeen, J. K. McCusker, S. Mukamel, J. P. Ogilvie, A. Olaya-Castro, M. A. Ratner, F. C. Spano, K. B. Whaley, and X. Zhu, .
- Fassioli and Olaya-Castro [2010] F. Fassioli and A. Olaya-Castro, .
- Kreisbeck and Kramer [2012] C. Kreisbeck and T. Kramer, J. Phys. Chem. Lett. 3, 2828 (2012).
- Olaya-Castro et al. [2008] A. Olaya-Castro, C. Lee, F. Olsen, and N. Johnson, Phys. Rev. B. 78, 085115 (2008).
- Olbrich et al. [2011] C. Olbrich, T. L. C. Jansen, J. Liebers, M. Aghtar, J. Strümpfer, K. Schulten, J. Knoester, and U. Kleinekathöfer, J. Phys. Chem. B 115, 8609 (2011).
- Wen et al. [2011] J. Wen, Y. Tsukatani, W. Cui, H. Zhang, M. L. Gross, D. A. Bryant, and R. E. Blankenship, BBA - Bioenergetics 1807, 157 (2011).
- Olson [2004] J. M. Olson, .
- Saer et al. [2017] R. G. Saer, V. Stadnytskyi, N. C. Magdaong, C. Goodson, S. Savikhin, and R. E. Blankenship, Biochimica et Biophysica Acta (BBA) - Bioenergetics 1858, 288 (2017).
- Saer et al. [2016] R. Saer, G. S. Orf, X. Lu, H. Zhang, M. J. Cuneo, D. A. Myles, and R. E. Blankenship, BBA - Bioenergetics 1857, 1455 (2016).
- Müh et al. [2007] F. Müh, M. E.-A. Madjet, J. Adolphs, A. Abdurahman, B. Rabenstein, H. Ishikita, E.-W. Knapp, and T. Renger, Proc. Natl. Acad. Sci. U. S. A. 104, 16862 (2007).
- Tronrud et al. [2009] D. E. Tronrud, J. Wen, L. Gay, and R. E. Blankenship, Photosynth. Res. 100, 79 (2009).
- Guerois et al. [2002] R. Guerois, J. E. Nielsen, and L. Serrano, J. Mol. Bio. 320, 369 (2002).
- Zeldovich et al. [2007] K. B. Zeldovich, P. Chen, and E. I. Shakhnovich, Proceedings of the National Academy of Sciences 104, 16152 (2007).
- Tokuriki et al. [2007] N. Tokuriki, F. Stricher, J. Schymkowitz, L. Serrano, and D. S. Tawfik, Journal of Molecular Biology 369, 1318 (2007).
- Abascal et al. [2010] F. Abascal, R. Zardoya, and M. J. Telford, .
- Guindon et al. [2010] S. Guindon, J.-F. Dufayard, V. Lefort, M. Anisimova, W. Hordijk, and O. Gascuel, Systematic Biology 59, 307 (2010).
- Olson et al. [1976] J. Olson, K. Bacon, and K. H. Thompson, .
- Tanimura and Kubo [1989] Y. Tanimura and R. Kubo, .
- Ishizaki and Tanimura [2006] A. Ishizaki and Y. Tanimura, .
- Ishizaki and Fleming [2009b] A. Ishizaki and G. R. Fleming, J. Chem. Phys. 130, 234111 (2009b).
- Kreisbeck et al. [2014] C. Kreisbeck, T. Kramer, and A. Aspuru-Guzik, .
- Kreisbeck et al. [2013] C. Kreisbeck, T. Kramer, and A. Aspuru-Guzik, J. Phys. Chem. B 117, 9380 (2013).
- Sali and Blundell [1993] A. Sali and T. L. Blundell, .
- Studer et al. [2013] R. A. Studer, P. A. Christin, M. A. Williams, and C. A. Orengo, Proc. Natl. Acad. Sci. 111, 2223 (2013).
- Zhang et al. [2005] J. Zhang, R. Nielsen, and Z. Yang, Mol. Biol. Evol. 22, 2472 (2005).
- Yang et al. [2005] Z. Yang, W. S. Wong, and R. Nielsen, Mol. Biol. Evol. 22, 1107 (2005).
- Bass JDSwcfAJ and D [2015] D. A. Bass JDSwcfAJ and R. D, .
- Anisimova and Yang [2007] M. Anisimova and Z. Yang, Mol. Biol. Evol. 24, 1219 (2007).
- Ashkenazy et al. [2012] H. Ashkenazy, O. Penn, A. Doron-Faigenboim, O. Cohen, G. Cannarozzi, O. Zomer, and T. Pupko, Nucleic Acids Res. 40, W580 (2012).
- Phillips et al. [2005] J. C. Phillips, R. Braun, W. Wang, J. Gumbart, E. Tajkhorshid, E. Villa, C. Chipot, R. D. Skeel, L. Kalé, and K. Schulten, Journal of Computational Chemistry 26, 1781 (2005).
- Case et al. [2014] D. A. Case, V. Babin, J. T. Berryman, R. M. Betz, Q. Cai, D. S. Cerutti, T. E. Cheatham III, T. A. Darden, R. E. Duke, H. Gohlke, A. W. Goetz, S. Gusarov, N. Homeyer, P. Janowski, J. Kaus, I. Kolossváry, A. Kovalenko, T. S. Lee, S. LeGrand, T. Luchko, R. Luo, B. Madej, K. M. Merz, F. Paesani, D. R. Roe, A. Roitberg, C. Sagui, R. Salomon-Ferrer, G. Seabra, C. L. Simmerling, W. Smith, J. Swails, R. C. Walker, J. Wang, R. M. Wolf, X. Wu, and P. A. Kollman, (2014).
- Cheatham et al. [1999] T. E. Cheatham, R. Cieplak, and R. A. Kollman, .
- Chandrasekaran et al. [2015] S. Chandrasekaran, M. Aghtar, S. Valleau, A. Aspuru-Guzik, and U. Kleinekathöfer, J. Phys. Chem. B 119, 9995 (2015), pMID: 26156758.
- Anandakrishnan et al. [2012] R. Anandakrishnan, B. Aguilar, and A. V. Onufriev, .
- Jorgensen and Madura [1983] W. L. Jorgensen and J. D. Madura, .
- Essmann et al. [1993] U. Essmann, L. Perera, M. L. Berkowitz, T. Darden, H. Lee, and L. Pederson, .
- Shao et al. [2006] Y. Shao, L. F. Molnar, Y. Jung, J. Kussmann, C. Ochsenfeld, S. T. Brown, A. T. Gilbert, L. V. Slipchenko, S. V. Levchenko, D. P. O’Neill, R. A. DiStasio Jr, R. C. Lochan, T. Wang, G. J. Beran, N. A. Besley, J. M. Herbert, C. Yeh Lin, T. Van Voorhis, S. Hung Chien, A. Sodt, R. P. Steele, V. A. Rassolov, P. E. Maslen, P. P. Korambath, R. D. Adamson, B. Austin, J. Baker, E. F. C. Byrd, H. Dachsel, R. J. Doerksen, A. Dreuw, B. D. Dunietz, A. D. Dutoi, T. R. Furlani, S. R. Gwaltney, A. Heyden, S. Hirata, C.-P. Hsu, G. Kedziora, R. Z. Khalliulin, P. Klunzinger, A. M. Lee, M. S. Lee, W. Liang, I. Lotan, N. Nair, B. Peters, E. I. Proynov, P. A. Pieniazek, Y. Min Rhee, J. Ritchie, E. Rosta, C. David Sherrill, A. C. Simmonett, J. E. Subotnik, H. Lee Woodcock III, W. Zhang, A. T. Bell, A. K. Chakraborty, D. M. Chipman, F. J. Keil, A. Warshel, W. J. Hehre, H. F. Schaefer III, J. Kong, A. I. Krylov, P. M. W. Gill, and M. Head-Gordon, Phys. Chem. Chem. Phys. 8, 3172 (2006).
- Perdew et al. [1996] J. P. Perdew, M. Ernzerhof, and K. Burke, J. Chem. Phys. 105, 9982 (1996).
- Madjet et al. [2006] M. E. Madjet, A. Abdurahman, and T. Renger, .
- Hein et al. [2012] B. Hein, C. Kreisbeck, T. Kramer, and M. Rodriguez, .
- Mukamel [1999] S. Mukamel, (Oxford: Oxford University Press, 1999).
- Cho [2009] M. Cho, (Boca Raton, FL: CRC Press, 2009).
- Kreisbeck et al. [2011] C. Kreisbeck, T. Kramer, M. Rodríguez, and B. Hein, .
- Kreisbeck and Kramer [2013] C. Kreisbeck and T. Kramer, (2013), 10.4231/D3RB6W248.
- Renger et al. [2013] T. Renger, M. E.-A. Madjet, M. Schmidt am Busch, J. Adolphs, and F. Müh, Photosynth. Rev. 116, 367 (2013).
- Besler et al. [1990] B. H. Besler, K. M. Merz, and P. A. Kollman, J. Comput. Chem. 11, 431 (1990).
- Sigfridsson and Ryde [1998] E. Sigfridsson and U. Ryde, J. Comput. Chem. 19, 377 (1998).
- Francl et al. [1996] M. M. Francl, C. Carey, L. E. Chirlian, and D. M. Gange, J. Comput. Chem. 17, 367 (1996).
- Vulto et al. [1998] S. I. E. Vulto, S. Neerken, R. J. W. Louwe, M. A. de Baat, J. Amesz, and T. J. Aartsma, J. Phys. Chem. B. 102, 10630 (1998).
Supporting Information (SI)
Phylogenetic tree
In Fig. S1 we show the phylogenetic tree of the FMO complex, based on the fmoA gene, with branch lengths defined in terms of sequence identity.
Thermodynamic results
In Fig. S2 we compare the free energy variation histograms for P. aestuarii and C. tepidum. We notice that the distributions are not significantly different. This was also checked by a Kolmogorov-Smirnov goodness-of-fit test.
Free energy changes due to mutations vary depending on the location in the protein complex monomers of P. aestuarii and C. tepidum. We found that mutations at the interface of monomers are destabilizing. We identify regions where mutations are more stabilizing (green box) and regions where they are mostly destabilizing (black box). In the top left panel of Fig. S3 we show that the outer amino acids neighboring the 8-th BChl can be mutated and this causes no stress / very little stress to the structure. On the other hand, in the top right panel, we show that it is much more destabilizing to mutate the inner alpha-helix (black box), which lies at the interface with another monomer of the trimer. This could indicate that, in this region, there was a larger priority to stabilize the trimeric shape rather than the interaction with the eight BChl.
Hamiltonian
Site couplings were computed using the point-dipole approximation (PDA) and the transfer charge from electrostatic potential (TrEsp) method (Renger et al., 2013).
In the point-dipole approximation, the exciton energy transfer couplings are computed according to Eq. 3, where denotes the transition dipole of the transition for molecule A. Here is the distance between the centers of the molecules A and B. To compute the excitation energy transfer couplings in the PDA we assumed an effective dipole strength of , an orientation of transition dipoles along the axis of the ND and NB nitrogen atoms in the BChls and set .
| (3) |
Excitation energy transfer couplings can also be computed from atomic transition charges and that fit the electrostatic potentials of transition charge densities. We calculated atomic transition charges for all atoms in each of the BChls by fitting the transition densities. The transition density cube files were obtained using TD-DFT with the 6-31G* basis set and PBE0 functional in QChem (Shao et al., 2006). For the fitting, we employed a method inspired by the Merz-Kollman method (Besler et al., 1990) and the CHELP-BOW method (Sigfridsson and Ryde, 1998). A random set of coordinates were chosen, lying more than 2 and less than 8 from any atom. All points were weighted equally. We avoided all points lying within the van der Waals radius as it has been shown that prioritizing points outside of this radius led to charges that better reproduced the electron density’s higher multipoles (Sigfridsson and Ryde, 1998). A sampling frequency of 6000 points per atom was used.
We used the pseudoinverse method to solve the final system of equations and singular value decomposition to find the pseudo inverse. This approach avoids having to deal with poorly conditioned intermediate matrices (Francl et al., 1996).
Excitation energy transfer couplings was then computed by summing over the Coulomb potentials between all pairs of atomic transition charges in the two molecules (see Eq. 4)
| (4) |
Excitation energy transfer couplings for all three FMO complexes calculated in the PDA and with the TrEsp method are reported in Tab. S1.
| C. tepidum | P. aestuarii | Ancestor | ||||
|---|---|---|---|---|---|---|
| Tresp [] | Point dipole [] | Tresp [] | Point dipole [] | Tresp [] | Point dipole [] | |
| 1,2 | -133.65 | -101.73 | -102.28 | -92.62 | -122.74 | -99.83 |
| 1,3 | -9.53 | 7.16 | -7.89 | 7.11 | -5.53 | 4.88 |
| 1,4 | -5.58 | -6.27 | 4.97 | -6.49 | -6.51 | -6.87 |
| 1,5 | 7.99 | 7.65 | 8.56 | 9.17 | -9.44 | 8.54 |
| 1,6 | -17.05 | -15.02 | 20.83 | -34.04 | 16.27 | -23.16 |
| 1,7 | 5.31 | -9.38 | -11.33 | -15.35 | -3.05 | -8.37 |
| 1,8 | 0.13 | -0.04 | 0.38 | 0.81 | 0.08 | -0.03 |
| 2,3 | -39.54 | 37.13 | -39.99 | 37.48 | -37.17 | 35.63 |
| 2,4 | 9.70 | 9.26 | -9.69 | 10.92 | 7.60 | 8.14 |
| 2,5 | 2.06 | 2.55 | 2.11 | 1.79 | -1.80 | 1.56 |
| 2,6 | 11.27 | 12.84 | -17.60 | 18.87 | -7.25 | 11.24 |
| 2,7 | -3.52 | -3.66 | 3.59 | 3.60 | 2.60 | -11.89 |
| 2,8 | 1.57 | 1.41 | 0.79 | 0.88 | 2.00 | 1.98 |
| 3,4 | 124.56 | -108.99 | -125.38 | -129.88 | 80.99 | -81.02 |
| 3,5 | -4.60 | -2.26 | 1.80 | -3.91 | -3.41 | -5.48 |
| 3,6 | 13.67 | -12.17 | -11.42 | -12.26 | -12.23 | -12.45 |
| 3,7 | 27.22 | 20.64 | 1.79 | 14.79 | 7.73 | -2.21 |
| 3,8 | -2.98 | 2.86 | -2.89 | 2.60 | -2.75 | 2.69 |
| 4,5 | -85.36 | -102.29 | 103.72 | -95.63 | 115.46 | -103.75 |
| 4,6 | -26.06 | -26.00 | -25.68 | -23.24 | 27.75 | -26.56 |
| 4,7 | 42.09 | -66.42 | 62.51 | -62.86 | -49.82 | -67.90 |
| 4,8 | -0.86 | -2.09 | 1.90 | -2.12 | -1.91 | -2.36 |
| 5,6 | 103.34 | 110.91 | -86.77 | 94.11 | 101.94 | 115.59 |
| 5,7 | -2.96 | 9.09 | 18.89 | 9.54 | 4.87 | 12.58 |
| 5,8 | 7.25 | 7.06 | 7.45 | 7.15 | -7.71 | 7.28 |
| 6,7 | -68.02 | 51.44 | -42.72 | 56.58 | -46.75 | 60.58 |
| 6,8 | -9.36 | -5.36 | 3.17 | -2.33 | 7.05 | -5.57 |
| 7,8 | 9.59 | -9.79 | -10.38 | -9.50 | -10.76 | -10.21 |
| Average BChl to protein distance | |||
| BChl | C. tepidum | P. aestuarii | Ancestor |
| 1 | |||
| 3 | |||
| 4 | |||
| 5 | |||
| 6 | |||
| 7 | |||
| 8 | |||
Spectral density
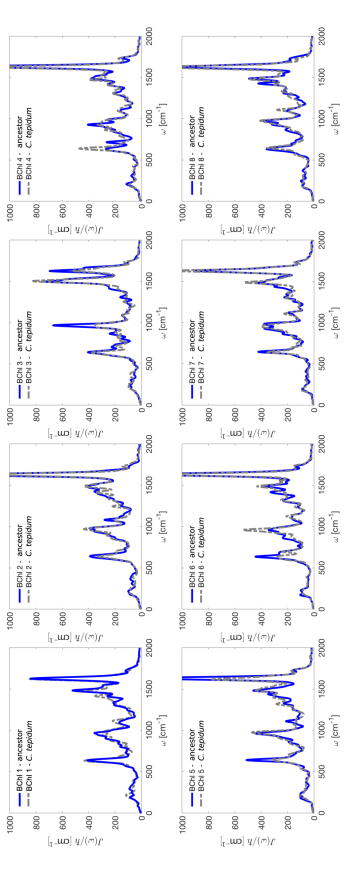
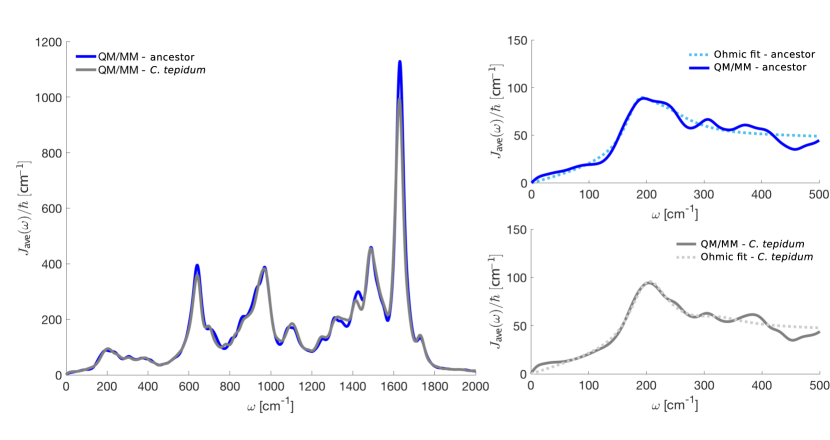
We computed two point correlation functions using the QM/MM first excited state energy trajectories obtained for C. tepidum and for the ancestor. Subsequently we fourier transformed and employed the harmonic approximation (see Ref. (Valleau et al., 2012)) to obtain the spectral densities . A spectral density was computed for each BChl for both structures (see Fig. S4). No large difference is seen. We also averaged the spectral densities over all BChl’s (see Fig. S5 left panel). The two average spectral densities are almost identical, therefore most changes in the dynamics will originate from changes in the system hamiltonian.
To run the dynamics of the system using the HEOM approach, we fitted the atomistic spectral densities to a three peak Drude-Lorentz spectral density
| (5) |
as done, e.g. in Ref. (Kreisbeck et al., 2013). The fitted parameters are given in Tab. S3. The fitted spectral densities are shown on the right hand side panels of Fig. S5.
| C. tepidum | Ancestor | |
|---|---|---|
| [] | 66.713 | 66.713 |
| [] | 86.552 | 72.469 |
| [] | 1.0000 | 94.462 |
| [] | 809.03 | 506.44 |
| [] | 13.142 | 11.502 |
| [] | 199.53 | 215.99 |
| [] | 583.76 | 1229.0 |
| [] | 1.6977 | 5.1297 |
| [] | 320.78 | 183.72 |
Absorption, CD and LD spectra
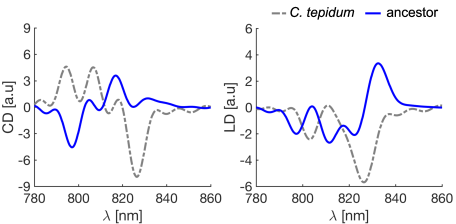
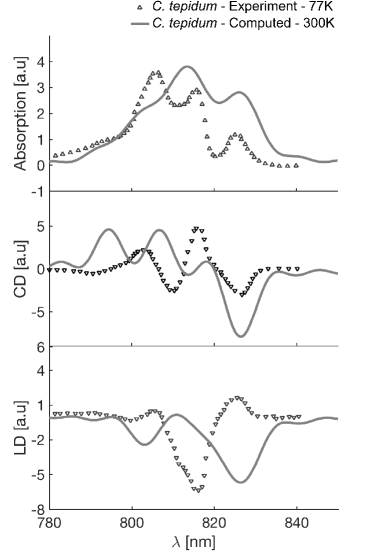
In Fig. S6 we show the computed CD and LD spectra for the ancestor and for C. tepidum at 300K. In Fig. S7 we show the comparison of our absorption, CD and LD spectra computed using QM/MM results at 300K to the experimental spectra of Ref. (Vulto et al., 1998), for C. tepidum. We observe similar peaks in the absorption spectrum although the 300K spectrum is much broader. The fact that the spectrum is broader at 300K is expected because higher temperatures lead to more motion and thus more noise in the system. We also have a similar trend for the CD and LD spectra as that seen experimentally.
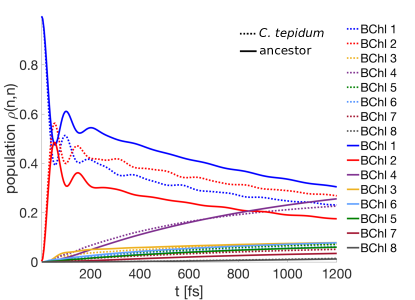
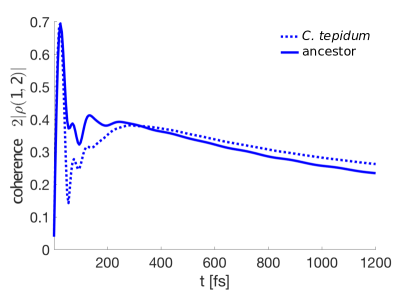
Population dynamics
Using the HEOM approach (Tanimura and Kubo, 1989; Ishizaki and Tanimura, 2006; Ishizaki and Fleming, 2009b) we computed the time evolution of the density matrix of our system of 8 coupled BChl molecules using QMaster (Kreisbeck et al., 2014; Kreisbeck and Kramer, 2013). The spectral densities were taken to be three peak fits of the atomistic spectral density, as described previously. The resulting population for the ancestor and C. tepidum in shown in Fig. S8, we see that site 1 and 2 are less strongly coupled for the ancestor than they are for C. tepidum. One can see this also from the Hamiltonians as given in Tab. S1. The coherence between site 1 and 2 is shown in Fig. S9. Here we do not see a large difference between the two species and this further confirmes the fact that quantum coherence does not appear to have been selected for.