Optical and Near-Infrared Spectra of Orionis Isolated Planetary-mass Objects
Abstract
We have obtained low-resolution optical (0.7–0.98 m) and near-infrared (1.11–1.34 m and 0.8–2.5 m) spectra of twelve isolated planetary-mass candidates ( = 18.2–19.9 mag) of the 3-Myr Orionis star cluster with a view to determining the spectroscopic properties of very young, substellar dwarfs and assembling a complete cluster mass function. We have classified our targets by visual comparison with high- and low-gravity standards and by measuring newly defined spectroscopic indices. We derived L0–L4.5 and M9–L2.5 using high- and low-gravity standards, respectively. Our targets reveal clear signposts of youth, thus corroborating their cluster membership and planetary masses (6–13 MJup). These observations complete the Orionis mass function by spectroscopically confirming the planetary-mass domain to a confidence level of 75 percent. The comparison of our spectra with BT-Settl solar metallicity model atmospheres yields a temperature scale of 2350–1800 K and a low surface gravity of log 4.0 [cm s-2], as would be expected for young planetary-mass objects. We discuss the properties of the cluster least-massive population as a function of spectral type. We have also obtained the first optical spectrum of S Ori 70, a T dwarf in the direction of Orionis. Our data provide reference optical and near-infrared spectra of very young L dwarfs and a mass function that may be used as templates for future studies of low-mass substellar objects and exoplanets. The extrapolation of the Orionis mass function to the solar neighborhood may indicate that isolated planetary-mass objects with temperatures of 200–300 K and masses in the interval 6–13-MJup may be as numerous as very low-mass stars.
1 Introduction
A robust determination of the initial mass function (distribution of objects per unit mass) represents a step forward in our understanding of the formation processes giving rise to stars, brown dwarfs, and planets. There are two basic approaches: i) studying the mass function of field objects and ii) building the mass function of star-forming regions and young star clusters. Neither option is trouble-free. The latter approach has the advantage that the age and metallicity are fixed since all cluster members are believed to be coeval and formed from the same molecular cloud. Additionally, assembling mass functions of star clusters of different ages potentially answers questions concerning what young stars, brown dwarfs, and planets look like and how they evolve. Luhman (2012) has reviewed various surveys for low-mass members of nearby stellar associations, open clusters, star-forming regions, and the methods used to characterize their properties and build the corresponding mass functions.
Of the more than 1200 spectroscopically confirmed field L and T dwarfs, only several tens of the L-type objects show low gravity features that are indicative of young ages: weak alkali lines, strong TiO and VO bands, and a triangular -band pseudo-continuum resembling the properties of directly imaged exoplanetary companions to stars (e.g., Kirkpatrick et al. 2006; Cruz et al. 2009; Liu et al. 2013; Schneider et al. 2014; Gauza et al. 2015; Gizis et al. 2015). They also have very red near- and mid-infrared colors (typically mag) and, as discussed by some groups, dimmer absolute - and brighter -band magnitudes than their old field spectroscopic counterparts (e.g., Faherty et al. 2013) while maintaining about the same bolometric luminosity (Filippazzo et al., 2015). Faherty et al. (2016) present a compilation of all known nearby young L dwarfs in moving groups and the field; these authors discuss their properties in comparison to high-gravity dwarfs of similar spectral type. The trigonometric parallaxes of very red L dwarfs indicate that they are indeed young substellar objects of the solar neighborhood with ages in the interval 10–500 Myr and masses ranging from 10 to 45 MJup (Zapatero Osorio et al., 2014a). There have been valuable attempts to classify and order these objects according to their increasing surface gravity (Allers & Liu, 2013; Faherty et al., 2013; Gagné et al., 2015a). However, a full interpretation of the spectroscopic and photometric data and a proper understanding of the dependence of the various atmospheric properties on gravity require samples of numerous objects with well-constrained age, distance, and metallicity, desiderata that are not always attainable when investigating young field L dwarfs. The members of star-forming regions and open clusters are located in small regions of the sky, which makes it an advantage for discovering new members, but the large distances of these clusters compared to nearby stellar moving groups makes it more challenging to follow up the candidates with high quality spectroscopy. Even so, cool substellar members of young open clusters offer a unique opportunity to establish a proper spectral sequence and to define the attributes of young brown dwarfs and planetary-mass objects at given ages.
Here, we present the spectroscopic follow-up of a significant fraction of isolated planetary-mass candidates (i.e., objects with masses below the deuterium burning mass limit at 13 MJup, Saumon et al. 1996) recently discovered in the young Orionis cluster by Peña Ramírez et al. (2012). Our goals are twofold: first, we address the cluster membership of our candidates and describe their photometric and spectroscopic properties at optical and near-infrared wavelengths for the age of the cluster; second, we address the mass function in the planetary-mass domain. The Orionis cluster has an age of 3 Myr (Zapatero Osorio et al., 2012a; Sherry et al., 2008), solar metallicity (González Hernández et al., 2008), low internal extinction ( mag, Lee 1968), and is located at a distance of 38519 pc (determined by Hummel et al. 2013 from interferometric data and adopted by Simón-Díaz et al. 2015; the latter authors assigned a conservative error of 5%). More recently, Schaefer et al. (2016) have measured a precise distance of 387.5 1.3 pc to the massive triple star Ori. The cluster of the same name is acknowledged as one suitable choice for observational efforts seeking to establish the continuity of the mass function from the O-type stars to the planetary-mass regime. See Caballero (2008), Lodieu et al. (2009), Béjar et al. (2011), and Peña Ramírez et al. (2012, and references therein) for a further description of the Orionis cluster.
This paper is organized as follows. In Section 2, we define the targets. The optical and near-infrared spectroscopic observations are described in Section 3. Cluster membership based on the detection of spectral signatures of low-gravity atmospheres is analyzed in Section 4. In Section 5, once young cool dwarfs were confirmed, we assigned spectral types to the low-gravity targets by defining spectral indices and comparing the observations to spectra from the literature. This classification is compared to those of the field and members of young stellar moving groups in Sections 5 and 6, In the latter section, we also discuss the photometric and spectroscopic properties of the very young L dwarfs. In Section 7, theoretical models are compared with observations to obtain the effective temperature and surface gravity of our targets. We discuss the masses of the cluster members (according to evolutionary models) and the planetary-mass function of Orionis in Section 8. Our conclusions are presented in Section 9. Finally, in Section A we present the first optical spectrum of S Ori 70, a T dwarf found in the direction of the cluster.
2 Target selection
We selected twelve planetary-mass candidates, recently discovered by Peña Ramírez et al. (2012), in the Orionis cluster in the extensive Visible and Infrared Survey Telescope for Astronomy (vista). None has spectra available in the literature. All except two of the candidates (S Ori J053826500209257 and S Ori J053803230226568) lie outside the region where Jeffries et al. (2006, see their Figure 2) reported on a second, significantly less numerous population of young dwarfs (10 Myr, although possibly slightly older than Orionis) with kinematic properties that differ from those of the cluster. Based on the findings of Jeffries et al. (2006), we estimate that about one or two objects in our sample, most probably among the targets mentioned above, may belong to this second population. As pointed out by these authors, only accurate radial velocity measurements can distinguish the two kinematic groups. This expected low contamination will not have an impact on the results of this paper since the ages of the two populations are very close (it is even possible that there is considerable overlap) and are lower than 10 Myr.
The twelve targets, along with 200 Orionis low-mass candidate members, are shown in the versus color–magnitude diagram of Figure 1. The vista photometry can be translated to the 2MASS system (Skrutskie et al., 2006) through color equations provided by the Cambridge Astronomy Survey Unit111http://casu.ast.cam.ac.uk/surveys-projects/vista/technical/photometric-properties (CASU). Superimposed on the photometry is the theoretical, solar metallicity isochrone corresponding to an age of 3 Myr (Chabrier et al., 2000). Predicted luminosities and effective temperatures () were transformed into vista magnitudes and colors using published relations between -band bolometric corrections, observed colors, measured surface temperatures, and spectral types (Dahn et al., 2002; Golimowski et al., 2004; Stephens et al., 2009; Hewett et al., 2006). These relations are valid for temperatures between 3300 K and 1000 K or spectral types M1–T6. We adopted the distance of 385 pc to the Orionis cluster (see Section 1), which is slightly larger than the Hipparcos measurement (Perryman et al., 1997), although both distances are consistent to within 1 . Our program objects have and colors in the intervals 18.2–19.9 mag and 2.2–3.1 mag, respectively. Because of their colors, and after comparison with the field, we expect them to display spectral types between late-M and late-L. As seen in Figure 1, they belong to the faint end of the tail of Orionis candidate members known to date. If confirmed to be true cluster members, evolutionary models (Baraffe et al., 1998; Chabrier et al., 2000; Burrows et al., 2003) predict that their surface temperatures and gravities will lie in the ranges = 2200–1700 K and log = 3.5–4.0 [cm s-2]; their masses would span from the deuterium burning-mass limit at about 13 MJup (Saumon et al., 1996) down to 5–6 MJup, i.e., within the planetary-mass domain. Table 1 provides the targets’ full names and their vista -band magnitudes. In what follows, we shall use abridged names for the program objects. In the sample of Orionis candidates, only two (J053829510259591 and J054000040240331) were reported to show some mid-infrared flux excesses at 4.5 m compatible with the presence of surrounding disks (Peña Ramírez et al., 2012). Five targets (J053829510259591, J053829520229370, J053857510229055, J053803230226568, and J053800060247066) do not show obvious mid-infrared flux excesses up to 4.5 m, and the remaining five sources have insufficient data in the mid-infrared to explore the existence of any flux excess.
One additional object, S Ori 70 (Zapatero Osorio et al., 2002), was included in the target list of optical observations. S Ori 70 was spectroscopically classified in the near infrared as a T5.5 1.0 dwarf (-bands) and as a T6–T7 dwarf (-band) by Zapatero Osorio et al. (2002) and Burgasser et al. (2004), respectively. S Ori 70 was originally identified as a Orionis candidate member; however, Burgasser et al. (2004) suggested, based on the similarity of its near-infrared spectra with the data of field dwarfs of related classification the possibility that it might instead be an old, massive field brown dwarf lying in the foreground of the Orionis cluster. Using proper motion studies and taking into account the observed colors, Peña Ramírez et al. (2011) and Peña Ramírez et al. (2015) indicated that S Ori 70 is not a probable member of the Orionis cluster but a foreground field T dwarf with peculiar colors, or a planet escaping from the Orion region. Scholz & Jayawardhana (2008), Zapatero Osorio et al. (2008), and Luhman et al. (2008) noted that S Ori 70 appears redder in the Spitzer color than the reddest field dwarfs of similar spectral classification, which may be owing to a low-gravity atmosphere or to the presence of a dusty disk. Here, we provide the first optical spectrum of S Ori 70.
3 Observations and data reduction
3.1 Optical spectroscopy
We have carried out low-resolution spectroscopic observations at visible wavelengths of seven cluster planetary-mass candidates and S Ori 70 using the Optical System for Imaging and low-Resolution Integrated Spectroscopy (osiris) spectrograph (Cepa, 1998) located at one of the Nasmyth foci of the Gran Telescopio de Canarias (GTC) at the Roque de los Muchachos Observatory (La Palma, Spain) on 2012 December 13–16 and 2014 November 25–26. osiris consists of a mosaic of two Marconi CCD42-82 (2048 4096 pix). All of our spectra were registered on the second detector, which is the default detector for long-slit spectroscopy because of its better cosmetics. We used a 2 2 binning, providing a pixel size of 0254, and the R300R grism, yielding a spectral coverage of 500–1200 nm and a nominal dispersion of 7.68 Å pix-1. The slit widths were 08, 10, and 123, depending on the seeing conditions. Typical seeing during the observations taken on 2012 December 13–16 was 07–10 at optical wavelengths and the weather was mainly clear and spectroscopic. The seeing during the campaign on 2014 November 25–26 was 10–13. The binning of the pixels along the spectral direction and the projection of the slits onto the detector yielded spectral resolutions of = 200–310 (widest to narrowest slit) at 750 nm. An order blocking filter blueward of 450 nm was used; however, there exists a second-order contribution redward of 950 nm (particularly important for blue objects), which was accounted for by observing spectrophotometric standard stars using the broad -band filter and the same spectroscopic configuration as that of the science targets.
The osiris spectra were acquired at two nodding positions along the slit separated by 8″–10″ for a proper subtraction of the Earth’s sky emission contribution. Both the target and a reference bright star within typically 1′-distance from the program object were centered on the slit. Since our targets are very faint sources at optical wavelengths ( mag) and the trace of their spectra is barely seen in individual exposures, we used the observations of the reference stars to register precisely the two-dimensional spectra by computing relative object shifts. The registered frames were stacked together before optimally extracting the spectra of the targets. Data were not obtained at parallactic angle. Our program objects were acquired on the slit using the filter with a passband of 825–1000 nm, i.e., we ensured that most of the red flux passed through the slit. In addition, the objects do not contribute significantly at blue wavelengths (650 nm), where the flux loss due Earth’s atmospheric refraction would be more noticeable. By observing the reference bright stars once at parallactic angle immediately after the targets we checked that no corrections due to blue-photon losses are required for our program sample. In Table 1, we provide the journal of the osiris observations, which include Universal Time (UT) observing dates, gratings, exposure times, slit widths, and air masses. Typical exposure times of single frames ranged from 1200 to 1800 s. The nodding observations were repeated several times to yield total on-source integrations of between 1 h and 4 h.
Raw images were reduced with standard procedures including bias subtraction and flat-fielding within iraf.222iraf is distributed by the National Optical Astronomy Observatories, which are operated by the Association of Universities for Research in Astronomy, Inc., under cooperative agreement with the National Science Foundation. A full wavelength solution from calibration lamps taken during the observing nights was applied to the spectra. The error associated with the fifth-order Legendre polynomial fit to the wavelength calibration is typically 10% the nominal dispersion. We corrected the extracted spectra for instrumental response using data of the spectrophotometric standard star G 158100 and G 191-B2B (white dwarfs) observed at parallactic angle on the same nights and with the same instrumental configuration as our targets. These standard stars have fluxes over the range 330–1000 nm in Filippenko & Greenstein (1984) and Massey & Gronwall (1990). To complete the data reduction, target spectra were divided by the standard stars to remove the contribution of telluric absorption; the intrinsic features of the white dwarfs were previously interpolated and their spectra were normalized to the continuum before using them for division into the science data. The spectrophotometric standard stars were observed a few hours before or after the targets; therefore, some telluric residuals may be present in the corrected spectra, particularly the strong O2 band at 760.5 nm.
The resulting reduced osiris spectra of Orionis candidates are depicted in Figure 2. They are ordered by increasing -band magnitude and shifted by a constant for clarity. The top panel of Figure 2 displays the wavelength range 700–980 nm because at shorter and longer wavelengths the data have very poor signal-to-noise (S/N) ratio, and the instrumental response correction and wavelength calibration are not reliable at values beyond 1 m. There was no signal detected below 800 nm from the T dwarf S Ori 70. However, it is a very red source at optical wavelengths and the signal at around 1 m is still significant. Therefore, we illustrate the osiris spectrum of S Ori 70 between 0.78 and 1.02 m in the bottom panel of Figure 2.
Together with the science targets, we also observed the spectroscopic standard field dwarf 2MASS J105847871548172 (Delfosse et al., 1997), which has an L3 spectral type and a high-gravity atmosphere. The optical observations of the standard were taken at parallactic angle and were reduced and calibrated in the same manner as the Orionis candidates. We provide the journal of these observations at the bottom of Table 1. The osiris spectrum of 2MASS J105847871548172 was used for the spectral classification of the targets and the definition of the spectral properties of the young Orionis objects in following Sections. The same standard was also observed at near-infrared wavelengths (see the following subsection).
3.2 Near-infrared spectroscopy
3.2.1 isaac data
-band near-infrared spectroscopy was obtained for nine Orionis planetary-mass candidates (six of them in common with the optical targets) using the isaac instrument that (Moorwood et al., 1998) installed on the Nasmyth A focus of the third unit of the Very Large Telescope (VLT) array at Cerro Paranal (Chile). isaac is an imager and spectrograph that covers the wavelength interval 1–5 m. For our observations we used the short wavelength arm that is equipped with a 1024 1024 Hawaii Rockwell detector with a pixel size of 0147, covering 1–2.5 m. All of our data were obtained in the low-resolution mode with a slit width of 10, centered at 1.25 m. This instrumental configuration yielded a nominal spectral dispersion of 3.49 Å pix-1, a resolving power of about 500 at the central frequency, and a wavelength coverage of 1.09–1.42 m. Because of the faint nature of our targets and the fact that Earth’s atmospheric water vapor absorption is very strong redward of 1.34 m, the useful wavelength coverage is 1.11–1.34 m. All of the isaac observations were collected with a typical seeing of 07–10 on 2012 December 1–4 and 2013 January 26–27.
In the near-infrared we employed the same observing strategy as in the optical. Both the targets and their bright reference stars were acquired through the -band filter and simultaneously aligned in the 1200-length slit. Individual 600 s exposures were obtained with the sources at two nod positions separated by typically 100. All targets were observed in an ABBA nodding pattern giving total on-source integration times of 1.3–3.3 h. In Table 1 we provide UT observing dates, exposure times, and air masses. To account for absorption by the Earth’s atmosphere, calibration stars of warm spectral types B were observed immediately after the targets as close as possible to the same air mass, typically within 0.1 air masses. Reduction of the raw data was accomplished using iraf and in a manner similar to that of the optical wavelengths. Pairs of nodded frames were subtracted to remove the background emission contribution and then divided by the corresponding flat field. For each target, individual frames were registered using the bright reference stars and stacked together to produce deeper data. The spectra were optimally extracted and wavelength-calibrated using the terrestrial sky emission lines to a precision of about 10–20% of the nominal dispersion. After removal of the intrinsic features (typically hydrogen lines) of the B-type stars, the calibration spectra were divided into the corresponding target spectra to remove telluric absorptions and instrumental spectral response. Finally, the data were multiplied by a black body curve of 32000 K to restore the spectral slope.
Figure 3 illustrates the final isaac data ordered by increasing spectral type (see Section 5). Together with the science targets there are three field dwarfs that were observed with the same instrumental setup. They are classified in the optical and near-infrared as L1 (2MASS J101707541308398, Cruz et al. 2003), L3 (2MASS J105847871548172, Delfosse et al. 1997), and L7.5 (2MASS J042348580414035, Geballe et al. 2002). In Table 1 (bottom), we provide the journal of the observations of the spectroscopic standards, whose raw spectra were reduced in the same manner as the main program objects. The final data are depicted in Figure 3 and will be employed for comparison with the Orionis candidates.
3.2.2 fire data
Two of the faintest targets were observed with the Folded-port Infrared Echellette (fire) spectrometer (Simcoe et al., 2008, 2010) on the 6.5-m Magellan telescope (Las Campanas Observatory, Chile) on 2014 December 01. This is a single object, prism cross-dispersed infrared instrument that covers the full 0.8–2.5 m band in one shot at a spectral resolution of 45–60 Å for the long slit mode and nominal slit width of 06. We selected the high-throughput prism mode because it is more efficient given the faint nature of the program objects and the long slit length of 40″, which is appropriate for the observing strategy previously described. The pixel size of the 2048 2048 pix HAWAII-2RG detector was 015. Table 1 provides the journal of the fire observations. Individual exposure times were 180 and 300 s and the nodding offset of the ABBA observing pattern was 3″, which was convenient given the 06 seeing conditions during the observations. Data reduction was carried out in a manner similar to that for the isaac and osiris spectra. Wavelength solution with a typical precision of 1.4 Å was performed using arcs of internal Ne and Ar calibration lamps. To correct for the telluric absorption we observed A-type stars, one for each target.
The final fire spectra are shown in Figure 4. To improve the S/N ratio of the data, we smoothed the spectra with a boxcar of 9 pixels (J0540373820240011) and 11 pixels (J054017340236266). Both the original and smoothed data are illustrated in Figure 4. This will be useful for analyzing the pseudo-continuum for an spectral type assignment.
4 Cluster membership
The membership of our targets in Orionis was addressed in terms of the red and late-type nature of the optical and near-infrared spectra, and the evidence of low-gravity atmospheres using the near-infrared data. In what follows, S Ori 70 is not included because its cluster membership is clearly dubious (see Burgasser et al. 2004; Peña Ramírez et al. 2015). It will be discussed separately in the Appendix. The detection of water vapor absorption in the near-infrared spectra of Figures 3 and 4 provides robust confirmation of the cool nature of the candidates. Additionally, the rising slope of the optical spectra, together with the detection of the TiO and VO absorption bands shown in Figure 2, denotes low temperature atmospheres. Therefore, we concluded that all program sources are Galactic objects in origin (non-extragalactic sources), and that they most likely have cool temperatures.
Before making any attempt to determine spectral types, we studied whether the near-infrared spectra show signs of low gravity atmospheres, which in turn would lead to cluster membership confirmation. From the fire data of Figure 4, it becomes apparent that the -band pseudo-continua of J0540373820240011 and J054017340236266 have a peaked shape, in clear contrast to the -band plateau spectrum of a high-gravity dwarf of similar energy distribution also shown in the Figure. This feature, where the -band is dominated by strong water absorption bands to either side of the sharp peak located between 1.68 and 1.70 m, was first reported by Lucas et al. (2001) for very young (1 Myr), cool Trapezium objects. It was ascribed to the effects of low pressure and low gravity atmospheres typical of self-gravitational collapsing objects with K. The triangle-shaped profile of the -band has been accepted as a consistent signature of youth ever since (e.g., Allers et al. 2007; Rice et al. 2010; Allers & Liu 2013; Liu et al. 2013; Schneider et al. 2014; Gagné et al. 2014a). It is also present in some 120-Myr Pleiades L dwarfs (Bihain et al., 2010; Zapatero Osorio et al., 2014a) and appears to discriminate low gravity atmospheres up to ages of about 300–500 Myr (Cruz et al., 2009; Zapatero Osorio et al., 2014a; Gauza et al., 2015). Nevertheless, it is debated whether this feature is also present in peculiar-metallicity dwarfs (see discussion in Looper et al. 2008, Allers & Liu 2013, and Marocco et al. 2014a).
To further constrain the surface gravity, and in turn the age, of the fire spectra, we used the spectroscopic index defined by Canty et al. (2013), which measures the flux ratio and the spectral slope between 2.15 and 2.24 m in the -band due to the absorption of the continuum by H2. According to those authors, this index is more gravity-sensitive than other features, such as the strength of the 2.21 m Na i doublet (also in the -band) and the triangular -band peak. For very young objects (10 Myr) the index returns a value 1. For older objects, which have a negative slope between 2.15 and 2.24 m, the index is 1. We measured for J0540373820240011, which is compatible with a very young age. As for J054017340236266, the index returned a value of ; this object has a poorer S/N ratio spectrum making the index determination less reliable. Nevertheless, both objects display very similar fire data and share related spectroscopic slopes, including the peaked -band pseudo-continuum. The criteria of Canty et al. (2013) added additional proof of the low gravity nature of the fire spectra.
We also investigated other gravity-sensitive features in the near-infrared spectra, in particular the strength of the K i absorption lines at 1.169, 1.177, 1.243, and 1.252 m. The four near-infrared K i lines produced by high-gravity atmospheres are clearly registered at the resolution of our data, as is demonstrated by the isaac spectra of the field L1–L7.5 dwarfs shown in Figure 3. It is well known that these lines are linked to both temperature and gravity dependences (McLean et al., 2003, 2007; McGovern et al., 2004). Low gravity (or low pressure) atmospheres are characterized by -band spectra with alkali line strengths effectively weaker than “normal”. From visual inspection of the panels depicted in Figure 3, it becomes apparent that the Orionis candidates typically show less intense K i lines compared to the field dwarfs of similar energy distribution and colors. We interpreted this property as a sign of youth.
To test the gravity indication from the strength and depth of the alkali lines we measured the pseudo-equivalent width of the neutral K i at 1.252 m for the 11 candidates with isaac and fire spectra. We chose the near-infrared K i line with the longest wavelength to avoid contamination by FeH and other molecular bands; additionally, this line is less affected by telluric absorption and lies in a spectral region with relatively better S/N ratio. Pseudo-equivalent widths333Given the cool nature of our sample, equivalent widths are generally measured relative to the observed local pseudo-continuum formed by molecular absorptions. We refer to these equivalent widths as “pseudo-equivalent widths”. (pEWs) were obtained via direct integration of the line profile with the splot task in iraf. The results of our measurements, given in Table 2, were extracted by adopting the base of the line as the pseudo-continuum. The error bars were determined after integrating over a reasonable range of possible pseudo-continua. With the exception of two candidates, J053829510259591 and J053829520229370, the K i 1.252-m line is not obviously detected and we imposed upper limits on the line pEWs by measuring the strength of other spectroscopic features seen at nearby wavelengths. Our K i pEWs agree with those measured for Taurus (1 Myr) and Upper Scorpius (5–10 Myr) members by Bonnefoy et al. (2014a) within 1- the quoted uncertainties, and typically lie near and below the boundary for objects to be assigned the highest score, indicating low gravity according to Figure 23 of Allers & Liu (2013). The K iJ index defined by these authors, which relies on the intensity of the -band K i lines, is also useful in determining the gravity score of our data. We measured K iJ values in the interval 0.87–1.11 for the isaac and fire spectra of Orionis candidates, from which we assigned very low (VL-G) and intermediate (INT-G) gravity flags to seven and four candidates, respectively. The resulting flags, or “gravity classes” according to the terminology of Allers & Liu (2013), are given in Table 2.
In Table 2, we also include the confirmed Orionis member S Ori 51 (Zapatero Osorio et al., 2000), whose -band spectrum was published by McGovern et al. (2004). These data have a spectral resolution of 2000, four times higher than the isaac data. We determined the K i 1.252-m pEW to be 2.0 0.5 Å from the spectrum of McGovern et al. (2004), thus confirming the weak K i lines, and that good S/N, moderate-to-high resolution spectra are required to study the fine details of the alkali absorptions of low gravity atmospheres. S Ori 51 ( = 17.19 mag) was originally classified as an M90.5 young dwarf at optical wavelengths (Barrado y Navascués et al., 2001); using near-infrared spectra; its classification was recently revised to L00.5 by Canty et al. (2013). The Orionis candidates of this paper (Table 1) are more than 1 mag fainter in the -band; we thus expect them to have similar and later spectral types to S Ori 51, as suggested by the redder near- and mid-infrared colors of our candidates (see Table 2).
Figure 5 illustrates the K i 1.252-m pEWs as a function of the and colors. These colors have a marked pattern with decreasing or cooler spectral type (Leggett et al., 2010a, and references therein), thus leaving the pEWs as the tracers of surface gravity in the two panels of Figure 5. Significant mid-infrared flux excesses may contribute to blur the diagrams. However, as indicated in Section 2, only two Orionis targets show rather moderate (even marginal) mid-infrared flux excesses, one of which (J053829510259591) has a near-infrared spectrum and is included in Figure 5 (the other one, J054000040240331, has only an optical spectrum). To put our K i pEW measurements into context, we also plotted the pEWs obtained for field M, L, and T-type dwarfs reported in the literature (McLean et al., 2003; Allers & Liu, 2013; Lodieu et al., 2015). The required photometry of the field dwarfs was collected from the above-mentioned spectroscopic papers and Patten et al. (2006), or retrieved from the WISE public archive444We exchanged and by assuming that the magnitude is similar to the Spitzer data. This is a reasonable assumption for the L dwarfs: the widths of the WISE and Spitzer bands are similar and, although the WISE filter is slightly shifted to redder wavelegnths, there is no strong molecular absorption at these frequencies in the spectra of M and L dwarfs. Furthermore, Wright et al. (2011) also noted that the color term between Spitzer and WISE is rather small ( mag) and seems to have no trend with spectral type, even for the T dwarfs.. Different spectral types and field dwarfs with spectroscopic evidence of low- and intermediate-gravity atmospheres (Rebolo et al., 1998; Cruz et al., 2003; Faherty et al., 2013; Allers & Liu, 2013; Gauza et al., 2015) are distinguished in the panels of Figure 5. Although there is considerable scatter within the field objects, general trends can be seen in the figure. The K i 1.252-m line strengthens from the M through the L types (i.e., with redder colors) and declines toward the coolest T dwarfs. Interestingly, the Orionis candidates (including S Ori 51) have pEWs and pEW upper limits that systematically lie below the values of high-gravity field dwarfs of similar colors. They occupy regions populated by low-gravity objects, thus confirming a young age for all isaac and fire targets, except for J053857510229055, whose high value of pEW upper limit (poor S/N ratio at around 1.252 m) prevented us from unambiguously establishing its low-gravity atmosphere. Inspection of the other three K i lines and the FeH absorption band at 1.20 m (see Section 6) in the spectrum of this particular source yielded a similar result. Unfortunately, this object does not have an optical spectrum in our work for a further assessment of its true atmospheric nature. Interestingly, the K iJ gravity-sensitive index of Allers & Liu (2013) yielded a value of 0.97 for J053857510229055, as expected for a very low gravity dwarf.
From the above discussion, we conclude that 10 out of 11 Orionis candidates with isaac and fire near-infrared spectra show evidence of low-gravity atmospheres reinforcing their membership of the cluster. A better quality near-infrared spectrum would be required for the remaining candidate before reaching any solid conclusion on its cluster membership. Additional membership criteria, such as accurate proper motion and radial velocity measurements, would be useful for strong cluster membership confirmation. Given the faint nature of our targets, these measurements await the arrival of the next generation of space- and ground-based telescopes. The properties of the optical spectra are discussed in the context of low gravities and spectral types in Sections 5 and 6.
5 Spectral type determination
We assigned spectral types by visual comparison of the observed spectra with data from the literature and by measuring spectral indices previously defined and newly defined in this paper. As reference data, we employed spectral standards with high and low-to-intermediate gravity atmospheres from Kirkpatrick et al. (2010), Bonnefoy et al. (2014a), Tinney et al. (1998), Kirkpatrick et al. (1999), Leggett et al. (2001, 2002), Reid et al. (2001), Béjar et al. (2008), Lodieu et al. (2008), Lafrenière et al. (2010), and Gagné et al. (2014c). Our objective is to provide a classification based on the global morphology of the data. In this regard, the pseudo-continuum slope, rather than the individual atomic and molecular features, plays a key role in defining the spectral sequence. Because there is a classification scheme elaborated particularly for low-to-intermediate gravity L dwarfs (Allers & Liu 2013; see also Faherty et al. 2016 and references therein), we provided spectral types for the Orionis candidates based on the comparison with the so-called young, low-to-intermediate gravity L dwarfs and field high-gravity dwarfs separately. The results are summarized in Table 3.
5.1 Classification from visual comparison
We compared all the spectra with one another to infer a relative spectral sequence within our sample and concluded that J054037820240011, J054017340236226, and J053800060247066 show the steepest pseudo-continuum slopes, consistent with their being the latest-type objects in the target list. The three sources are also the faintest objects in the sample ( = 19.5–19.9 mag). The dwarfs J053826500209257 and J053824710300283 appear to be the earliest-type sources with less steep spectral slopes and -band magnitudes 1.5 mag brighter. Any spectral type derivation obtained from comparison with reference spectra and/or spectral indices should reflect this feature.
The spectral energy distribution of our targets does not differ significantly from those of normal ultra-cool field dwarfs with high- and low-gravity atmospheres (see also Section 6), thus allowing us a direct analogy with the global spectral energy distributions. Allers & Liu (2013) discussed, for the L types, whether there are spectral intervals where the pseudo-continuum shape is sensitive to spectral morphology with little dependence on gravity. Specifically, the regions are 1.07–1.40 m (-band) and 1.90–2.20 m (-band). We qualitatively determined which standard(s) provided the best matches to the pseudo-continuum shape of our targets. From visual inspection of the spectral slopes, we concluded that the Orionis sample has spectral types between M9 and mid-L when compared to high-gravity standards, and late-M and early-L when matched to low-to-intermediate gravity dwarfs. As an example, the two fire spectra are classified as later than the young L1 member of the TW Hydrae object (Gagné et al., 2014c) but as similar to, or slightly earlier than, the young L3 G 196-3B because both fire spectra display a pseudo-continuum slope from blue to red wavelengths that is intermediate between that of the young L1 and L3 objects (Figures 4 and 6). At the same time, the global energy distribution of the fire data is reasonably reproduced (except for low-gravity features) by the overall shape of an L4.5 high-gravity dwarf (DENIS J122815.2154733, Leggett et al. 2001; shown in Figure 6).
5.2 Spectral indices
For the six Orionis candidates with optical and near-infrared data, both spectra were joined by using the colors (Table 2) published in Peña Ramírez et al. (2012) and the zero-point fluxes and filter transmission curves of Hewett et al. (2006). The resulting spectral energy distributions from 0.7 m through 1.34 m are illustrated in Figure 7. These combined data and the fire spectra were the easiest to classify since they cover a significant wavelength interval; more uncertain is establishing the typology of the four objects with isaac or osiris spectra only. To aid and quantify the visual comparison exercise we defined three spectral indices that measure the slope between the optical and the -band and are sensitive to the spectral type. They were useful for establishing an order among the spectra. The , , and indices yield the flux ratios between 1.28–1.32 m and various bluer wavelength intervals that have relatively good quality in our osiris and isaac data as follows:
| (1) | |||||
| (2) | |||||
| (3) |
where stands for relative mean fluxes in the intervals of the same length, and is given in m. These indices were first determined for the high and low-to-intermediate gravity spectral standards given in Kirkpatrick et al. (2010) and the aforementioned references. The behavior of these indices is not always linear with spectral type. In Table 4 we provide the coefficients of the polynomial fits to the indices of the spectral standards according to the following expression:
| (4) |
where SpT values of , 0, 1, … 7 correspond to spectral types M9, L0, L1, … L7, respectively. In Table 4, we also provide the validity regimes and the root mean square (rms) of the fits for each spectral index and for the high-gravity (“high-g”) and low-to-intermediate gravity (“young”) cases.
We used equation 4 to determine quantitatively the spectral types of the Orionis candidates to within 1–2 subtypes. The measured indices over the spectra of the Orionis candidates are given in Table 3. Also provided in Table 3 are the derived spectral types in the “SpT young optNIR” and “SpT high-g optNIR” columns; these were computed as the averages of all three measurements (when they existed) that include the optical and near-infrared spectra. The numbers were rounded to the closest integer or half subtype. With the , and indices we ensured that the optical-to-near-infrared and near-infrared slopes of the Orionis candidates werere well reproduced by the spectral standards, which agrees with the basis of our type determination approach. The least massive population of Orionis known to date with magnitudes spanning the range mag have a sequence of increasing spectral types between L0 and L4.5 and between M9 and L2.5, according to the schemes based on high-gravity and low-to-intermediate gravity.
We also explored other near-infrared indices available in the literature based on the strength of H2O absorption (e.g., Geballe et al. 2002; Gorlova et al. 2003; Slesnick et al. 2004; Allers & Liu 2013). This signature shows an almost linear behavior with spectral type from M6 through T6 as discussed by McLean et al. (2003). We found results consistent with our spectral type determinations to within 2.5 subtypes, except for J053705490251290, where the typings differ by 4.5 subtypes (Geballe et al. 2002 and Gorlova et al. 2003 H2O indices at 1.33 m indicated L6 versus the adopted L1.5). This relatively large difference is probably caused by large error bars associated with the indices of our data.
At optical wavelengths, the PC3 index described by Martín et al. (1999), which measures the pseudo-continuum slope between two 40 Å bands centered at 0.825 and 0.756 m, yielded a narrow spectral classification. The PC3 indices and the determined optical spectral types (“SpT opt”) are provided in Table 3. According to Martín et al. (1999), the error associated with the spectral classification using the PC3 index is typically 0.5 subtypes. All osiris spectra share a similar typing of L1.5–L2.5, suggesting that the optical data are quite similar, despite covering nearly the same -band magnitude interval as the near-infrared spectra. This was already anticipated by the comparison of the optical data with the spectrum of USco 108 B, a young Upper Scorpius member classified as an M9.5 source (Béjar et al., 2008), in Figure 2. Using the PC3 index, these authors determined a spectral type L1 for USco 108 B, in better agreement with our derivations. The similarities between our data and USco 108 B are remarkable; they also provide additional proof of the low-gravity nature of the Orionis candidates.
In general, we found good agreement to within the quoted uncertainties between the spectral types based on visual observations, high-gravity and “youth” for the earliest sources. However, the high-gravity-based “optNIR” spectral types are systematically later than those based on the Allers & Liu (2013) system. This becomes apparent for the coolest types, where differences of up to 2.5 subtypes can be found. Also for the latest types, the disagreement between the optical-based and the high-gravity-based “optNIR” classification is noteworthy: J053800060247066 is classified as an L1.5 from the optical PC3 index, and as an L4.0 from the indices and the visual comparison to field data. Interestingly, the PC3-based typing and the “youth”-based classification agree to within the error bars. Similar disagreements between optical and near-infrared classifications are observed in other young cool dwarfs of the Upper Sco association (Lodieu 2016, priv. communication), and disagreement was also noted for other Orionis candidates by Martín et al. (2001). Additionally, Allers & Liu (2013) found that the -band classification of 10-Myr old cool dwarfs yields near-infrared types that are on average 1.3 subtypes later than their corresponding optical types. It is also possible that for late-L types, the PC3 index delivers optical spectral types a few subtypes earlier than other classifying methods (see Martín et al. 2006).
We note that using TiO- and VO-based indices at optical wavelengths would produce spectral types close to M9–M9.5 for all of our targets, i.e., earlier types than those derived from the slopes of the spectra. We expect cluster members (including S Ori 51) that cover 2.5 mag in the -band and differ by about 0.8 and 0.4 mag in the and colors to have different subtypes and to form a coherent sequence of objects. As an example, this magnitude interval and relative color coverages account for three to seven different M and L subtypes in the field. We ascribe the optical and near-infrared typing mismatch to the low gravity nature (and therefore low pressure atmospheres) of these Orionis objects. TiO and VO are well-known gravity-sensitive features (they have a strong opacity at low pressures). The TiO- and VO-based spectral indices in the literature are anchored on high-gravity field dwarfs. For our sample of young dwarfs that have the same metallicity and age we prefer to define a relative spectral classification that relies on the general slope of the observed spectra, which, as will be discussed in Sections 6 and 7, correlate with other properties of the Orionis sequence of members.
In what follows we adopt the spectral types labeled with the flag “optNIR” in Table 3. The associated uncertainties were obtained as the scatter of the various measurements. We prefer the combined optical and near-infrared types over the optical-only types because, as indicated by Allers & Liu (2013), the - and -band pseudo-continua show little dependence on surface gravity and because the energy distribution of L-type objects peaks in the near-infrared. The adopted classification (both “youth-” and high-gravity-based determinations) correlates with the increasingly red colors (e.g., from 2.2 to 3.0 mag, see also Section 6) and the decreasing , as determined from comparison with model atmospheres (Section 7). For J054000040240331, which has an optical spectrum only, we have adopted an intermediate classification with an error bar that covers the full range of spectral types for this work. We are confident of this procedure because the optical data and the near-infrared colors of this object are similar to those of the rest of the target sample.
6 Properties of Orionis L dwarfs
6.1 Optical and near-infrared spectra
Our targets reveal spectral types in the narrow interval L0–L4.5 (near-infrared, high-gravity-based), M9–L2.5 (near-infrared, low-gravity-based), and L1.5–L2.5 (optical), where only a smooth behavior and no major changes in the spectral features are expected (Kirkpatrick et al., 2010). To improve the S/N of the data, we produced “master” spectra by combining all of the L1.5–L2.5 osiris (optical) and L0–L5 isaac (-band) data for confirmed Orionis members. The noisy isaac spectrum of J053705490251290 was not considered for producing the master near-infrared spectrum. We checked the feasibility of this procedure by merging groups of three to four spectra ramdomly; we always obtained similar outcomes from all combinations. The resulting master spectra are depicted in Figure 8; we used them to establish the spectroscopic properties of solar metallicity L dwarfs with an age of 3 Myr, which corresponds to a surface gravity of log = 3.5–4.0 (cm s-2) according to various substellar evolutionary models (Baraffe et al., 1998; Chabrier et al., 2000; Burrows et al., 2003). Figure 8 also shows the spectra of field high-gravity dwarfs with spectral resolution similar to our data for a proper comparison (see Figure caption). The field standards are classified as M9, L1 and L3 dwarfs, the last two types roughly correspond to the mean spectral type of the Orionis master spectra. Note that the L3 standard (2MASS J105847871548172) is the same object for the optical and near-infrared panels of Figure 8 and was observed with the same instrumental configurations as the Orionis targets.
The improved S/N of the combined Orionis near-infrared spectrum shown in the bottom panel of Figure 8 allows us to confirm the presence of weak absorptions due to the Na i doublet at 1.14 m and the FeH bands at 1.20–1.24 m. All the K i lines are barely seen with pEWs of 2.5 Å (1.169 m), 3.7 Å (1.177 m), 2.2 Å (1.243 m), and 3.3 Å (1.252 m), which have an associated uncertainty of 0.5 Å. These pEWs should be interpreted as the intensity of the -band K i lines of low-gravity early-L dwarfs with an age of 3 Myr. They can be used as a reference for dating young objects of similar classification and metallicity in the field. Higher pEWs would indicate older ages.
As seen from Table 2, a few Orionis L0 dwarfs have smaller values and lower upper limits on the pEW of the reddest K i line. This is explained by the fact that for a given surface gravity, the alkaline absorptions increase in strength with decreasing temperature and spectral type. The master spectrum depicted in the bottom panel of Figure 8 covers from L0 through mid-L. In any case, the so-obtained “average” pEW of the 1.252-m line is smaller than the corresponding pEWs of high-gravity L0–L5 dwarfs (Figure 5); this provides an additional test to confirm that the majority of our candidates are low-gravity sources (otherwise, the combined spectrum would have yielded stronger alkaline lines).
As illustrated in Figure 8, the Orionis -band master spectrum shows stronger water vapor absorption at 1.33 m and a slightly redder pseudocontinuum slope than the field M9 spectrum, which indicates a later type on the basis of the spectroscopic classification criteria defined in the literature. This agrees with our spectral typing. The 1.33 m-band appears marginally deeper in the Orionis averaged spectrum than in the field L1 dwarf and is better reproduced by the field L3 dwarf. Despite the differences observed in the Na i, K i and FeH features, the pattern outlined by the -band pseudocontinuum of Orionis L dwarfs and high-gravity objects of related types are remarkably similar, including the intensity of the water vapor absorption at 1.33 m. Based on these properties and the discussion of previous sections, we concluded that the -band wavelengths are appropriate for spectral classification within 2 subtypes (by using the pseudocontinuum slope) and for discriminating low-gravity from high-gravity dwarfs of similar metallicity (by examining the intensity of the atomic and FeH features).
We followed a similar prescription of spectral comparison for the optical wavelengths as done above for the near-infrared. In the top panel of Figure 8, the Orionis master spectrum (red) is compared with high-gravity M9, L1 and L3 standards (black). The optical data of Orionis are characterized by the presence of weak Na i absorption at 819.5 nm (a sign of youth, e.g., Steele & Jameson 1995), and strong TiO and VO bands. The latter, although also indicating a low-gravity nature (Martín et al., 1999), would also suggest dwarf-based spectral types earlier than M9.5–L0 (Luhman et al., 2007a), in contrast with the L classification derived from the near-infrared. Interestingly, the Orionis optical spectrum also reveals a broad K i resonance doublet absorption at 766.5 nm. This line profile is quite sensitive to gravity and temperature conditions (e.g., Pavlenko et al. 2000, and references therein; Kirkpatrick et al. 2008, and references therein). Although the shape of this resonance doublet mimics that of the early-L types, the K i core appears to be weaker in the combined Orionis spectrum than in the field, high-gravity L1 and L3 dwarfs in the top panel of Figure 8, thus supporting low-gravity atmospheres. The red slope of the Orionis combined optical spectrum is better reproduced by the L3 standard, which is consistent with the near-infrared high-gravity-based classification. As widely discussed in the literature, the transition from M to L types for high-gravity dwarfs is driven by the disappearance of TiO absorption at optical wavelengths (Kirkpatrick et al., 1999; Martín et al., 1999). However, atmospheres of very low gravity show strong TiO and VO features through the mid-L types (see next). As also observed at near-infrared wavelengths, the strength of the optical FeH bands is weaker than normal (in part owing to the intense TiO and H2O absorptions), while the water vapor feature at 935 nm appears to be stronger in the low-gravity spectrum. We caution that the telluric stars used to correct the optical science data were observed at smaller air masses than our Orionis targets, and some telluric residuals might be present in the visible spectra.
In Figure 9, the optical master spectrum of Orionis was also compared with the data of three field L dwarfs with spectroscopic evidence of low-to-intermediate gravity atmospheres (Cruz et al., 2009). These data were collected with the same instrumental setup and were processed in the same manner as the Orionis spectra (thereby avoiding any systematic effects); the field objects’ spectra were published by Zapatero Osorio et al. (2014a). The comparison dwarfs were spectroscopically classified as L1 (2MASS J024111510326587), L2 (2MASS J004521431634446), and L3 (G 1963 B), and were given the status of very low-gravity (VL-G) sources by Allers & Liu (2013). Their likely ages are estimated at 500, 30–250, and 20–85 Myr, respectively, on the basis of the presence of lithium in their atmospheres, their location in the Herzsprung–Russell diagram, and their membership of young stellar moving groups (Zapatero Osorio et al., 2014a; Gagné et al., 2014b). Hence, despite the presence of youthful features in the optical spectra, these three comparison sources are significantly older than Orionis by at least a factor of 10 and their gravities (a proxy of age) may differ. They cover the possible optical and “optNIR” low-gravity-based spectral types of our targets. As seen in Figure 9, the 3-Myr spectrum shows stronger oxides (TiO, VO, and H2O) at all visible wavelengths than any of the other supposedly VL-G, but older (therefore, higher gravity) dwarfs. We interpret this as evidence of the effects of the lower gravity atmospheres (younger age) of the Orionis objects. Note that the pseudo-continuum slope in the optical is quite similar for all three spectral types (young L1, L2, and L3) of Figure 9; only the molecular absorptions due to TiO, VO, and H2O seem to change significantly from one spectral type to another. Because these oxides are known to depend on both atmospheric gravity and temperature (they become stronger with decreasing gravity and increasing temperature in the M–L transition), it might be possible that, at the resolution of our data, a low-gravity, low-temperature spectrum mimics a slightly higher gravity, higher temperature spectrum in the visible. Data at longer wavelengths would be required to solve this ambiguity.
6.2 Magnitude-spectral type diagram
The spectral sequence of Orionis low-mass stars, brown dwarfs, and planetary-mass dwarfs is illustrated in Figure 10: there are two panels depicting the high-gravity- and low-gravity-based spectral types derived in this work. This is one of the first planetary-mass sequences defined for very young ages where the great majority of the low-mass objects are confirmed to be coeval via the diagnosis of spectroscopic features indicative of youth. We adopted the photometry given by the UKIRT Infrared Deep Sky Survey (UKIDSS) data release 10, particularly the Galactic Clusters Survey. The UKIDSS project is defined in Lawrence et al. (2007). UKIDSS uses the UKIRT Wide Field Camera (WFCAM; Casali et al. 2007) and a photometric system described in Hewett et al. (2006). The pipeline processing and science archive are described in Hambly et al. (2008, and references therein). The UKIDSS -band photometry and the data published by Peña Ramírez et al. (2012) are consistent typically to within 1 the quoted uncertainties at bright and intermediate magnitudes, and to within 2 at the faintest magnitudes. However, the UKIDSS color is systematically redded by about 0.05 mag than the index based on the Visible and Infrared Survey Telescope for Astronomy (VISTA) photometric system (see Cross et al. 2012) employed in Peña Ramírez et al. (2012). A further discussion of the comparison between the VISTA and UKIDSS photometry of Orionis objects will be provided in a forthcoming paper. In this paper, the UKIDSS - and -band photometry of our spectroscopic targets and the photometry of Peña Ramírez et al. (2012) are listed in Table 5. In Figure 10, the average location of field dwarfs taken to the distance of the cluster is also shown, together with the Orionis sequence of spectroscopically-confirmed members (Barrado y Navascués et al., 2001; Martín et al., 2001; Sacco et al., 2007; Peña Ramírez et al., 2012). For spectral types M6, we used the field sequence of Faherty et al. (2016, their Table 19), which provides a sequence of high-gravity dwarfs by removing peculiar objects, binaries, low-metallicty dwarfs, and young field sources. Furthermore, it was constructed by using a relatively high number of dwarfs with known trigonometric parallax. The photometric dispersion of the high-gravity field sequence is also depicted in both panels of Figure 10.
The Orionis sequence is well defined and extrapolates the previously known cluster sequence of more luminous members. It runs parallel to the field sequence of high-gravity dwarfs when considering the high-gravity-based spectral types (top panel of Figure 10), as expected for very young objects that are still undergoing self-gravitational contraction. However, the cluster sequence defined by the “youth”-based classification (bottom panel) approaches the high-gravity field sequence, thus indicating that the slope of the -band magnitude–spectral type relationship may be different for low- and high-gravity cool objects. This feature has been extensively discussed in the literature (see Faherty et al. 2016 and Liu et al. 2016, and references therein). Note that this is not the case for color–magnitude diagrams such as that shown in Figure 1, where the Orionis members show a clearly defined sequence.
6.3 Photometric colors
In recent years, the very red near- and mid-infrared colors of cool dwarfs, particularly the index, have been widely associated with a young age (e.g., Cruz et al. 2009, and references therein; Kirkpatrick et al. 2010, and references therein; Faherty et al. 2012, and references therein; Liu et al. 2013, and references therein; Schneider et al. 2014, and references therein; Marocco et al. 2014b, and references therein; Gizis et al. 2015, and references therein). This understanding is driven by the fact that young-aged L-type members of nearby, solar metallicity stellar moving groups (such as Pictoris, Tucana-Horologium, AB Doradus, etc.) show a general flux excess towards longer wavelengths accompanied by weak alkali lines, peaked -band pseudocontinuum, and enhanced metal oxide absorption bands in their optical and infrared spectra. The latter properties are accepted spectroscopic evidence of a low-gravity nature (as discussed in Sections 4 and 6.1). The reddening characteristic has thus been interpreted as mostly due to the low gravity of the atmospheres and to an excess of dust (condensates) in the photospheres, which heavily influence the photometric and spectroscopic properties of the young L dwarfs. Interestingly, there are a few very dusty L dwarfs with no evidence of youth or low gravity (see Liu et al. 2016 and references therein). It is also acknowledged that the very red colors might be caused by a high metallic content of the low-temperature atmospheres (e.g., Looper et al. 2008, and references therein; Leggett et al. 2010b, and references therein).
We confirmed the membership of most of our targets in the 3-Myr Orionis cluster. They all display spectroscopic features ascribed to low-gravity atmospheres and delineate a photometric and spectroscopic progression that is over-luminous with respect to the field sequence (Figure 10), as expected for the age of the cluster. In what follows, we discuss the color properties of our targets as a function of their spectral types.
6.3.1 High-gravity-based spectral types
Figure 11 illustrates UKIDSS colors against spectral types from early-M through mid-L. In the top panel of the Figure, the high-gravity-based types of the Orionis sources of this work are shown. For the two targets lacking UKIDSS -band magnitudes, we adopted the VISTA and UKIDSS values based on the similarity of the -filter measurements between these two photometric systems (Section 6.1). As depicted in the top panel of Figure 11, the L-type Orionis objects do not present obvious near-infrared colors in clear excess of the field dwarfs with similar spectral classification.
The mean location of the field (i.e., high gravity atmospheres) for types M6 is indicated by the solid line (2MASS data were taken from Faherty et al. 2016, and colors were conveniently transformed into the UKIDSS photometric system. The color dispersion of the field is also shown). For each spectral subtype, the field sequence has a color dispersion of typically 0.15–0.25 mag. The Orionis members of this paper and those from the compilation made by Peña Ramírez et al. (2012) and Sacco et al. (2007) follow the trend described by the field. Among the M dwarfs, there are several Orionis outliers, which show mid-infrared flux excesses typical of surrounding disks (Peña Ramírez et al., 2012). From Figure 11 it becomes apparent that the M- and L-type Orionis and field dwarfs have similar colors to within the quoted dispersion. Furthermore, other L dwarfs with ages 10 Myr, such as additional Orionis members from Zapatero Osorio et al. (2000), Barrado y Navascués et al. (2001), and Martín et al. (2001), Upper Scorpius members recently discovered by Lodieu et al. (2008), Béjar et al. (2008), Lafrenière et al. (2010), Peña Ramírez et al. (2016), and members of the TW Hydrae (TWA) moving group compiled by Chauvin et al. (2004, 2005a), Gagné et al. (2015a), Kellogg et al. (2015, 2016), and Schneider et al. (2016a) also have colors resembling the indices of the Orionis L0–L4.5 objects of this paper. Figure 11 shows the location of the Orionis, Upper Scorpius and TWA sequences using different symbols. Only a few Upper Sco L1-type members and 2MASSW J1207334393254b (TWA member, Chauvin et al., 2004) appear redder than the TWA and Orionis sequences. The similarity of the very young L4–L5 dwarfs is illustrated in Figure 6, where the L4 spectrum of an Upper Scorpius member is shown in comparison with two of our Orionis targets: all three spectra are well matched.
Other young cool dwarfs with known age and spectroscopic signposts of low gravity atmospheres are also depicted in Figure 11. The figure shows, in order of increasing age, the location of members of the 25-Myr Pictoris moving group taken from the compilation made by Lagrange et al. (2009), Liu et al. (2013), Schneider et al. (2014), Gagné et al. (2015a), and Deacon et al. (2016), members of stellar moving groups with ages in the interval 20–50 Myr (see Gagné et al. 2015a for the lists of objects and moving groups), and members of the 120-Myr Pleiades cluster (Bihain et al., 2010; Zapatero Osorio et al., 2014a, b). All of these objects are supposed to share solar metallicity. For a given spectral type, the similarity of the colors for all ages is consistent with the observed photometric dispersion from the mid-Ms through L0. However, the situation changes at cooler types. The L0–L5 dwarfs with intermediate ages ( Pic and particularly the 20–50 Myr moving group members) tend to have on average redder colors than their younger and older (the field) spectral couterparts. The impact of the very red colors in the near-infrared spectra can be seen in Figure 6, where the spectra of 2MASSW J1207334393254b (TWA member, spectrum from Patience et al., 2012) and G 1963 B (20–85 Myr, spectrum from Bihain et al., 2010) are shown in comparison with our fire data. As discussed in Bihain et al. (2010), Pleiades M and early-L members show slightly redder colors than the field by 0.11 mag, which the authors ascribe to both reddening and youth. Zapatero Osorio et al. (2014a, b) argued that the Pleiades sequence continues towards even redder colors for cooler types, matching the colors observed from giant planets around stars (e.g., planets HR 8799bcde, Marois et al. 2008, 2010) and other extremely red field dwarfs with likely planetary masses. As illustrated in Figure 11, dwarfs of young stellar moving groups and Pleiades members with spectral types L5 and ages in the interval 10–500 Myr have colors 0.2–1.0 mag redder than the field (1–10 Gyr) spectral counterparts.
The top panel of Figure 11 suggests that the L dwarfs become redder than the field, achieving up to mag at ages typically 10 Myr and then turn back to “normal” colors at an age (gravity) that is not well constrained yet. This timing appears to be older than 120–300 Myr for the latest L types since Pleiades late-L dwarfs (120 Myr) and the L7 dwarf (150–300 Myr) of Gauza et al. (2015) still display very red atmospheres. Regarding the early-L types, as is seen in Figure 11, both the 120-Myr Pleiades cluster and the field have colors that are consistent to within the uncertainties. Aller et al. (2016) also noted that the L0–L4 members of the AB Doradus moving group, which has an age similar to that of the Pleiades, do not have such distinct near-infrared colors from field ultracool dwarfs. The authors ascribed this effect to the higher-gravity atmospheres of AB Doradus members than those of the the TWA and Pic moving groups members. By adopting the high-gravity-based spectral types, it seems that the near-infrared colors of the L dwarfs behave nonlinearly with low surface gravity, and atmospheric gravity alone cannot account for the reddening and subsequent blue turn-over of the colors with age (increasing gravity). Given the young-to-intermediate ages of the very red L dwarfs (most appear to have ages in the interval 10–500 Myr), other scenarios may be at play such as an enhanced dust production at certain atmospheric pressures, the presence of warm debris disks, which might contribute to the signficant long wavelength reddening (e.g., Zakhozhay et al. 2016), and/or thermo-chemical instabilities that produce changes in the temperature structure of cool atmospheres (Tremblin et al., 2016).
6.3.2 Youth-based spectral types
The bottom panel of Figure 11 shows the low-to-intermediate gravity-based types of the Orionis objects. Under this classification scheme, the great majority of the cluster members appear to be very red late-M and early-L dwarfs, as compared to the high-gravity dwarfs of related types. This scenario suggests that the “red nature” of L dwarfs develop very early in the evolution of the low-mass objects with cool atmospheres (as opposed to the scenario described in the previous section), and that this property disappears at an age 120 Myr for the latest L types, and around 120–150 Myr for the early-to-mid L sources.
7 Comparison with model atmospheres
We used the latest generation of the BT-Settl synthetic spectra555http://perso.ens-lyon.fr/france.allard/ created with the phoenix code (version 15.5, Hauschildt et al. 1997; Allard et al. 2001) for solar metallicity. These models aim to describe the atmospheres of low-mass stars, brown dwarfs, and planets without irradiation. They include a cloud model by accounting for the formation and gravitational settling of dust grains for K following the approach of Rossow (1978). Further details on BT-Settl theoretical atmospheres are given in Allard et al. (2012); Allard (2014) and Manjavacas et al. (2015). For our purposes, we employed a subsample of the BT-Settl solar metallicity models that extend from = 1200 to 3000 K in steps of 50–100 K and log = 2.5 to 5.5 (cm s-2) in steps of 0.5 dex. We performed a comparison between observed and BT-Settl synthetic spectra to derive the physical parameters of our Orionis objects with fire and osirisisaac data because these sources have a long wavelength coverage that may provide well-constrained parameters. The resolution of the original BT-Settl computations was degraded with a Gaussian profile to match that of the optical and near-infrared observations, and all theoretical and observed spectra were normalized to unity in the interval 1.28–1.32 m, which does not include strong spectral features (the observations are not flux calibrated). This normalization allowed us to compare the observed and predicted molecular and atomic signatures, as well as the pseudo-continuum behavior, and provided an additional check on the veracity of the synthetic spectra. Given the low resolution of our data, we neither broadened the BT-Settl models to account for rotation nor corrected for radial velocity shifts.
Best fits to the observed spectra were found by minimizing the following merit function:
| (5) |
where and stand for the observed and theoretical flux densities, and accounts for the wavelength intervals 0.700–0.9815 and 1.091–1.345 m (osiris and isaac data), and 0.90–1.32 and 2.00–2.36 m (fire data). The -band was excluded from the comparisons (see below). The regions of strong telluric water vapor absorption in the near-infrared were also excluded. We fixed the chemical abundance to the solar value, which is the metallicity of the Orionis cluster (González Hernández et al., 2008), and kept and log free. The merit functions were obtained for each fire and pair of osirisisaac spectra. Examples are shown in Figure 12. The merit functions show a marked decrease towards a minimum from the warm to the cool temperatures. We assigned errors of 100 K and 0.5 dex to the derived and log (corresponding to the sampling of the models). The acceptable temperature and gravity parameters were visually inspected by comparing them with the observed spectra.
We found that the best-fit gravities providing the smallest values of are in the interval log = 3.5–4.5 dex. For all the observed spectra used we consistently derived such low gravities as are to be expected for low-mass objects with an age of a few Myr. They agree quantitatively to within 0.5 dex with the predictions made for Orionis by evolutionary models (e.g., Baraffe et al. 1998; Chabrier et al. 2000; Burrows et al. 2003). The best-fit s are given in Table 2; these correspond to log = 4.0 dex. The measured spectral types and the s obtained from the minimization technique successfully correlate, i.e., the cooler the temperature, the later the spectral type, thus supporting our relative ordering of the data and the spectral classification.
For the low gravities, such as those of the Orionis low mass objects, our analysis shows that the scale of Table 2 differs slightly from that of the field high-gravity dwarfs of related types. Our determinations are systematically warmer by 100–200 K than recent –spectral type relations valid for field L0–L5 dwarfs (Stephens et al., 2009). We note, however, that this difference is close to the temperature uncertainty associated with the model fitting technique, and that there might be some uncontrolled systematics in the models. A similar effect was discussed for the M dwarfs by Luhman (1999) and Luhman et al. (2003). These authors developed a temperature scale for young, low-gravity M dwarfs that is intermediate between the dwarf (cooler) and giant (warmer) scales. This scale has been used by various groups to study the low-mass population of young star clusters (e.g., Briceño et al. 2002). Our temperature scale for the young early-L dwarfs seems to follow the tendency reported by Luhman et al. (2003, see their Table 8). A better agreement is found with the predictions made by the evolutionary models, yet our derivations from the spectral fitting analysis are 100 K warmer (albeit close to the quoted uncertainty in ).
Figures 13 and 14 illustrate the comparison between the observed spectra and the best-fit model atmospheres. In Figure 13, we also included the vista photometry (appropriately normalized to the observed spectra) and the theoretical photometry computed by integrating the best-fit models using the vista filter passband profiles and flux densities of Hewett et al. (2006). The overall aspect of the optical and near-infrared data is successfully reproduced by the theoretical spectra, implying that no relevant molecule or atomic element is missing from the atmospheric computations. However, not all the fine details of the observations are well matched by the models. At optical wavelengths, the various TiO, VO, FeH and CrH absorptions and the red optical slope are nicely fitted using solar metallicity, log = 4.0 dex, models with the temperatures of Table 2 (Figure 13). However, the water vapor absorption at 935 nm appears to be slightly overestimated by the model atmospheres. As for the alkaline lines, the theoretical spectra degraded to the low resolution of our data exhibit no measurable Na i (at 819.5 nm), Cs i, and Rb i; this agrees with the properties of the Orionis spectra. The resonance doublet of K i in the visible, although one of the strongest features at low temperatures, depends strongly on atmospheric pressure; the weak intensity of this feature present in the low-gravity Orionis spectra appears to be reasonably well matched by the theory.
The success of the BT-Settl low-gravity models at near-infrared wavelengths is not as remarkable as it is in the optical. While the strength of the alkaline near-infrared lines are acceptably predicted by the theory (at the resolution of our data), the broad features due to VO at 1.06 m and VO and TiO between 1.17 and 1.29 m (McGovern et al., 2004) are typically less intense in the observed data. Not even the true shape of these bands is fitted by the theory, probably because of the lack of accurate molecular data to describe the VO A–X () and TiO () band heads. Manjavacas et al. (2015) have discussed the possibility that the pEWs of the K i 1.252 m of high-gravity models overestimate those measured from the observed spectra of field early-L dwarfs (an opposite effect was observed for the late-L and T dwarfs). This does not occur at the low gravities of Orionis, perhaps because of our poor understanding of the opacities of the dust being formed in high pressure (gravity) atmospheric layers (the pseudocontinuum around 1.25 m is dominated by condensate grain opaicities, Ackerman & Marley 2001; Faherty et al. 2014). The model -band delivers a poor fit to the observed triangular shape of the data (Figure 14), probably because of the poor description of the water opacities at these wavelengths (Allard et al., 2012). The small S/N of the -band spectra at around 2.3 m (CO bands) prevented us from giving a qualitative despcription of the observed–theoretical comparison results. However, we note that the models attractively reproduce the relative fluxes between the optical, -, -, and -bands, which can be understood as evidence in favour of a proper treatment of the gas and dust condensation chemistry and the dust opacity at these low temperatures and surface gravities.
8 Masses and Orionis mass function
Given the similarity of the spectral energy distributions of the Orionis members with those of the field objects of related classification, we used the - and -band bolometric corrections (BCs) recently determined for M and L dwarfs by Filippazzo et al. (2015), and the magnitudes and spectral types of our targets to determine absolute luminosities. The luminosities provided in Table 2 correspond to the mean values between the - and -band derivations, both of which agree to within 0.1 dex. For the Sun, we used mag. The associated uncertainty in luminosity was obtained by considering the photometric errors and by adopting error bars of 0.20 mag in the BCs, and 0.25 mag in the distance modulus of the cluster ( mag). Filippazzo et al. (2015) measured a dispersion of 0.16 and 0.24 mag for the - and -band BCs. We did not consider the spectral type uncertainties because they do not have a significant effect on the BC values beyond the adopted BC error; from early- through mid-Ls, the - and -band BCs vary little to within a few subtypes. This behavior is also present in other BC determinations available in the literature (e.g., Leggett et al. 2001; Dahn et al. 2002; Golimowski et al. 2004; Schmidt et al. 2014).
The luminosities were then compared to the predictions made by the 3-Myr isochrone from Chabrier et al. (2000) to determine the masses666We employed the following mass conversion: 1 M⊙ = 1047.56 MJup. listed in the last column of Table 2. The quoted mass uncertainties take into account the errors in luminosity. If the cluster were younger (1 Myr) or older (5 Myr), the masses would be smaller by a factor of 1.5–2.0 or greater by a factor of 1.3, respectively. At the age of 3 Myr, our targets have masses from 6 MJup up to the deuterium burning-mass limit at 13 MJup. They can serve as very low-gravity templates to study other young isolated and planetary companion sources in the field, and star-forming regions and star clusters. According to the theory of substellar evolution, they mature towards fainter luminosities and cooler temperatures, reaching 10-7 L⊙ and 240–400 K at the age of a few Gyr. They would belong to the recently defined Y spectral type (Cushing et al., 2011) and would have prohibitively dim optical and near-infrared magnitudes for current ground-based and space telescopes. Most of their flux is expected to be emitted at 3 m, an example of which could be WISE J085510.83071442.5 (Luhman, 2014), a 3–10 MJup isolated planetary-mass dwarf located at 2 pc from the Sun. To date, this object remains undetected at optical wavelengths and has detections in a few near-infrared wavelengths, and mid-infrared Spitzer and WISE short-wavelength bands (Schneider et al., 2016b; Luhman & Esplin, 2016; Zapatero Osorio et al., 2016); indeed, it is the reddest and coolest dwarf (250 K) ever discovered (Beamín et al., 2014). WISE J085510.83071442.5 may represent the “old” face of the Orionis isolated planetary-mass objects studied here.
The validation of a significant number of Orionis planetary-mass members adds solid support to the cluster luminosity and mass functions presented in Figures 13 and 15 of Peña Ramírez et al. (2012), particularly in the substellar domain. In the mass interval 6–13 MJup, these authors counted 22 cluster candidates in a circular area of radius of around the massive, multiple star Ori. Here, we established the cluster membership of 10 (possibly 11) of these objects using a gravity-sensitive spectroscopic diagnosis. Another two L dwarfs (S Ori 56 and 60) within the aforementioned mass range have mid-infrared flux excesses compatible with surrounding disks (Luhman et al., 2008, and references therein), thus confirming their likely cluster membership. Therefore, 55–60% of the original 6–13 MJup sample is corroborated by well-accepted signs of youth. The statistics increases up to 77% by considering another 4 sources (S Ori 58, 62, 66, and 68) that have L spectral types (Martín et al., 2001; Barrado y Navascués et al., 2001) and magnitudes consistent with the Orionis spectroscopic sequence (Figure 11). The Orionis mass function assembled by Peña Ramírez et al. (2012) is thus verified from the high-mass stars through the planetary-mass domain. The mass function can be used as a reference for future investigations. According to the Orionis mass function (in its linear form), there are as many 6–13 MJup members as 0.075–0.15 M⊙ low-mass stars in the cluster. The observed density of isolated planetary-mass objects accounts for one such object for every stars in Orionis. This ratio of planetary-mass to stellar cluster members agrees with recent estimates based on the least massive population of other young clusters and stellar moving groups (e.g., Gagné et al. 2015a), but is smaller than that determined for the TWA moving group by Gagné et al. (2017). By extrapolating the rising behavior of the Orionis mass function to the field, we would expect as many 6–13 MJup isolated planetary-mass objects with properties similar to WISE J085510.83071442.5 (Luhman, 2014) as 0.075–0.15 M⊙ late-M and early-L stars in the solar neighborhood. This estimate is in line with the results of Sumi et al. (2011) based on microlensing events, although we caution that these authors were looking at even less massive objects (1 MJup). Their discovery is indeed challenging.
9 Conclusions and final remarks
We have collected low-resolution optical and near-infrared spectra of twelve planetary-mass candidates of the young (3 Myr), solar metallicity Orionis cluster using osiris (0.70–0.98 , ) on the GTC, isaac (1.11–1.34 m, ) on the VLT, and fire (0.8–2.5 , ) on the Magellan Telescope. These sources represent about half of the sample populating the planetary-mass interval (6–13 MJup) of the cluster mass function defined in Peña Ramírez et al. (2012). Confirming their low-gravity nature and in turn, their membership in Orionis, is critical for building a reference mass function. All twelve targets have -band magnitudes in the range 18.2–19.9 mag and define the faint end of the photometric cluster sequence.
By visual inspection of the comparisons of our data with spectroscopic reference high- and low-gravity dwarfs, and by measuring newly-defined indices and known indices from the literature that quantify the spectral slopes and water vapor absorption, we determined that the Orionis candidates have spectral types in the interval L0–L4.5 (high-gravity-based) and M9–L2.5 (low-gravity-based) from the near-infrared spectra and L1.5–L2.5 from the visible data. The observed spectra revealed features of low-gravity atmospheres for nearly all of the targets, such as weak alkali lines due to Na i and K i, peak-shaped -band pseudo-continua, weak CrH and FeH absorptions, and strong molecular absorptions due to oxides (TiO and VO). This confirms them as bona fide members of Orionis. Contrary to the definition of the dwarf-based L classification for field high-gravity objects (where oxides vanish from the optical spectra), the TiO and VO signatures of young L dwarfs do not disappear from the visible data and maintain their strength through the mid-L types. We caution that using the gravity-sensitive TiO- and VO-based indices in the optical, would lead one to derive earlier spectral types for the Orionis objects. The individual data were combined to produce acceptable S/N “master” spectra at optical and near-infrared wavelengths that can be used as templates for future studies of young L dwarfs. As a reference, our measurements showed that the pEWs of the near-infrared K i lines are 2.50.5 Å (1.169 m), 3.70.5 Å (1.177 m), 2.20.5 Å (1.243 m), and 3.30.5 Å (1.252 m) for young early-L dwarfs with an age of 3 Myr. Higher pEWs would indicate older ages.
Considering the low-to-intermediate gravity-based spectral classification, nearly all Orionis objects present infrared colors in excess of those of the majority of the known dwarfs of related types, in line with observations of other young L dwarfs in the field (e.g., Chauvin et al. 2004; Cruz et al. 2009; Kirkpatrick et al. 2010; Faherty et al. 2012; Liu et al. 2013; Schneider et al. 2014; Marocco et al. 2014b; Zapatero Osorio et al. 2014a; Gizis et al. 2015; Gauza et al. 2015; Kellogg et al. 2015). This implies that the very red nature of L dwarfs develops early in the evolution of cool, low-mass objects and lasts up to 120–150 Myr for the early-L types. The reddening effect has been explained in the literature in terms of the presence of dusty atmospheres at low gravities. The classification based on the similarity of the global spectral energy distribution of Orionis sources with high-gravity references leads to the conclusion that very young dwarfs have no obvious color excesses and suggests that the reddening feature appears at ages 10 Myr. There might be other scenarios at play to account for the very red colors of the young L dwarfs, such as the presence of warm debris disks, which may contribute to the long wavelength reddening (e.g., Zakhozhay et al. 2016) and/or instabilities that produce changes in the temperature structure of the atmospheres (Tremblin et al., 2016).
We have compared the Orionis observations with BT-Settl, solar metallicity model atmospheres deriving low gravities, log [cm s-2], as expected for 3-Myr low-mass sources. We also obtained a scale that correlates with the near-infrared spectral types and the observed colors: 2350–1800 K for the L0–L4.5 (high-gravity-based) and M9–L2.5 (low-gravity-based) Orionis dwarfs. At the resolution of our data, the synthetic spectra appear to reproduce reasonably well the spectral slope and some atomic and molecular features of the observations. However, the theory predicts stronger VO absorption in the near-infrared than is observed. Water vapor bands, particularly in the band, are another pending issue for the models.
Through comparison with evolutionary tracks, we determined the masses of the Orionis L dwarfs to be in the interval 6–13 MJup and confirm them as planetary-mass members of the cluster. The Orionis mass function presented in Peña Ramírez et al. (2012) is now confirmed with the spectroscopic observations of up to 75% of the cluster members from the high-mass O-type stars through the planetary-mass domain at 6 MJup. It is expected that the Orionis isolated planetary-mass objects evolve and look like the 2-pc distant WISE J085510.83071442.5 (Luhman, 2014) at the age of a few Gyr, of which there might be as many as late-M and early-L dwarfs in the solar neighborhood.
We also included the first optical spectrum of S Ori 70 (T5–T7) obtained with osiris on the GTC aimed at identifying possible features indicative of a low-gravity atmosphere. Although the spectrum has poor S/N ( mag) and no photons were registered blueward of 800 nm, a very red slope is clearly detected that is compatible with a T6–T7 spectral type, which agrees with the near-infrared typing of S Ori 70. A strong water vapor absorption is detected at 935 nm. Better quality data and spectra with sufficient S/N in the blue wing of the K i doublet are required for a solid characterization of the surface gravity of this particular object.
References
- Ackerman & Marley (2001) Ackerman, A. S. & Marley, M. S. 2001, ApJ, 556, 872
- Allard (2014) Allard, F. 2014 (Presented at the workshop on Exploring the Formation and Evolution of Planetary Systems, IAU Symposium, 299, 271)
- Allard et al. (2001) Allard, F., Hauschildt, P. H., Alexander, D. R., Tamanai, A., & Schweitzer, A. 2001, ApJ, 556, 357
- Allard et al. (2012) Allard, F., Homeier, D., & Freytag, B. 2012, Royal Society of London Philosophical Transactions Series A, 370, 2765
- Aller et al. (2016) Aller, K. M., Liu, M. C., Magnier, E. A., et al. 2016, ApJ, 821, 120
- Allers et al. (2007) Allers, K. N., Jaffe, D. T., Luhman, K. L., et al. 2007, ApJ, 657, 511
- Allers & Liu (2013) Allers, K. N. & Liu, M. C. 2013, ApJ, 772, 79
- Baraffe et al. (1998) Baraffe, I., Chabrier, G., Allard, F., & Hauschildt, P. H. 1998, A&A, 337, 403
- Barrado y Navascués et al. (2001) Barrado y Navascués, D., Zapatero Osorio, M. R., Béjar, V. J. S., et al. 2001, A&A, 377, L9
- Beamín et al. (2014) Beamín, J. C., Ivanov, V. D., Bayo, A., et al. 2014, A&A, 570L, 8
- Béjar et al. (2008) Béjar, V. J. S., Zapatero Osorio, M. R., Pérez-Garrido, A., et al. 2008, ApJ, 673, L185
- Béjar et al. (2011) Béjar, V. J. S., Zapatero Osorio, M. R., Rebolo, R., et al. 2011, ApJ, 743, 64
- Best et al. (2015) Best, W. M. J., Liu, M. C., Magnier, E. A., et al. 2015, ApJ, 814, 118
- Bihain et al. (2010) Bihain, G., Rebolo, R., Zapatero Osorio, M. R., Béjar, V. J. S., & Caballero, J. A. 2010, A&A, 519, 93
- Bonnefoy et al. (2014a) Bonnefoy, M., Chauvin, G., Lagrange, A.-M., et al. 2014a, A&A, 562, A127
- Briceño et al. (2002) Briceño, C., Luhman, K. L., Hartmann, L., Stauffer, J. R., & Kirkpatrick, J. D. 2002, ApJ, 580, 317
- Burgasser et al. (2003) Burgasser, A. J., Kirkpatrick, J. D., Liebert, J., & Burrows, A. 2003, ApJ, 594, 510
- Burgasser et al. (2004) Burgasser, A. J., Kirkpatrick, J. D., McGovern, M. R., et al. 2004, ApJ, 604, 827
- Burrows et al. (2003) Burrows, A., Sudarsky, D., & Lunine, J. I. 2003, ApJ, 596, 587
- Caballero (2008) Caballero, J. A. 2008, A&A, 478, 667
- Canty et al. (2013) Canty, J. I., Lucas, P. W., Roche, P. F., & Pinfield, D. J. 2013, MNRAS, 435, 2650
- Casali et al. (2007) Casali, M., Adamson, A., Alves de Oliveira, C., et al. 2007, A&A, 467, 777
- Cepa (1998) Cepa, J. 1998, Ap&SS, 263, 369
- Chabrier et al. (2000) Chabrier, G., Baraffe, I., Allard, F., & Hauschildt, P. H. 2000, ApJ, 542, 464
- Chauvin et al. (2004) Chauvin, G., Lagrange, A.-M., Dumas, C., et al. 2004, A&A, 425, L29
- Chauvin et al. (2005a) Chauvin, G., Lagrange, A.-M., Dumas, C., et al. 2005a, A&A, 438, L25
- Chiang & Chen (2015) Chiang, P. & Chen, W. P. 2015, ApJ, 811, L16
- Cross et al. (2012) Cross, N. J. G., Collins, R. S., Mann, R. G., et al. 2012, A&A, 548, A119
- Cruz et al. (2009) Cruz, K. L., Kirkpatrick, J. D., & Burgasser, A. J. 2009, AJ, 137, 3345
- Cruz et al. (2003) Cruz, K. L., Reid, I. N., Liebert, J., Kirkpatrick, J. D., & Lowrance, P. J. 2003, AJ, 126, 2421
- Cushing et al. (2011) Cushing, M. C., Kirkpatrick, J. D., Gelino, C. R., et al. 2011, ApJ, 743, 50
- Cushing et al. (2005) Cushing, M. C., Rayner, J. T., & Vacca, W. D. 2005, ApJ, 623, 1115
- Dahn et al. (2002) Dahn, C. C., Harris, H. C., Vrba, F. J., et al. 2002, AJ, 124, 1170
- Deacon et al. (2016) Deacon, N. R., Schlieder, J. E., & Murphy, S. J. 2016, MNRAS, 457, 3191
- Delfosse et al. (1997) Delfosse, X., Tinney, C., Forveille, T., & et al. 1997, ApJ, 327, L25
- Faherty et al. (2014) Faherty, J. K., Beletsky, Y., Burgasser, A. J., et al. 2014, ApJ, 790, 90
- Faherty et al. (2012) Faherty, J. K., Burgasser, A. J., Walter, F. M., et al. 2012, ApJ, 752, 56
- Faherty et al. (2013) Faherty, J. K., Rice, E. L., Cruz, K. L., Mamajek, E. E., & Núñez, A. 2013, AJ, 145, 2
- Faherty et al. (2016) Faherty, J. K., Riedel, A. R., Cruz, K. L., et al. 2016, ApJS, 225, 10
- Filippazzo et al. (2015) Filippazzo, J. C., Rice, E. L., Faherty, J., et al. 2015, ApJ, 810, 158
- Filippenko & Greenstein (1984) Filippenko, A., V. & Greenstein, J. L. 1984, PASP, 96, 530
- Gagné et al. (2015b) Gagné, J., Burgasser, A. K., Faherty, J. K., et al. 2015b, ApJ, 808, L20
- Gagné et al. (2014c) Gagné, J., Faherty, J. K., Cruz, K., et al. 2014c, ApJ, 785, 14
- Gagné et al. (2015a) Gagné, J., Faherty, J. K., Cruz, K. L., et al. 2015a, ApJS, 219, 33
- Gagné et al. (2017) Gagné, J., Faherty, J. K., Mamajek, E., et al. 2017, ApJS, 228, 18
- Gagné et al. (2014a) Gagné, J., Lafrenière, D., Doyon, R., et al. 2014a, ApJ, 792, L17
- Gagné et al. (2014b) Gagné, J., Lafrenière, D., Doyon, R., Malo, L., & Artigau, E. 2014b, ApJ, 783, 121
- Gauza et al. (2015) Gauza, B., Béjar, V. J. S., Pérez Garrido, A., et al. 2015, ApJ, 804, 96
- Geballe et al. (2002) Geballe, T. R., Knapp, G. R., Leggett, S. K., et al. 2002, ApJ, 564, 466
- Gizis et al. (2015) Gizis, J. E., Allers, K. N., Liu, M. C., et al. 2015, ApJ, 799, 203
- Goldman et al. (2010) Goldman, B., Marsat, S., Henning, T., Clemens, C., & Greiner, J. 2010, MNRAS, 405, 1140
- Golimowski et al. (2004) Golimowski, D. A., Leggett, S. K., Marley, M. S., et al. 2004, AJ, 127, 3516
- González Hernández et al. (2008) González Hernández, J. I., Caballero, J. A., Rebolo, R., et al. 2008, A&A, 490, 1135
- Gorlova et al. (2003) Gorlova, N. I., Meyer, M. R., Rieke, G. H., & Liebert, J. 2003, ApJ, 593, 1074
- Hambly et al. (2008) Hambly, N. C., Collins, R. S., Cross, N. J. G., et al. 2008, MNRAS, 384, 637
- Hauschildt et al. (1997) Hauschildt, P. H., Baron, E., & Allard, F. 1997, ApJ, 483, 390
- Hewett et al. (2006) Hewett, P. C., Warren, S. J., Leggett, S. K., & Hodgkin, S. T. 2006, MNRAS, 367, 454
- Hummel et al. (2013) Hummel, C. A., Rivinius, T., Nieva, M.-F., et al. 2013, A&A, 554, A52
- Jeffries et al. (2006) Jeffries, R. D., Maxted, P. F. L., Oliveira, J. ., & Naylor, T. 2006, MNRAS, 371, L6
- Kellogg et al. (2016) Kellogg, K., Metchev, S., Gagné, J., & Faherty, J. 2016, ApJL, 821, L15
- Kellogg et al. (2015) Kellogg, K., Metchev, S., Geissler, K., et al. 2015, AJ, 150, 182
- King et al. (2010) King, R. R., McCaughrean, M. J., Homeier, D., Allard, F., a. S. R.-D., & Lodieu, N. 2010, A&A, 510, 99
- Kirkpatrick (2005) Kirkpatrick, J. D. 2005, ARA&A, 43, 195
- Kirkpatrick et al. (2006) Kirkpatrick, J. D., Barman, T. S., Burgasser, A. J., et al. 2006, ApJ, 639, 1120
- Kirkpatrick et al. (2008) Kirkpatrick, J. D., Cruz, K. L., Barman, T. S., et al. 2008, ApJ, 689, 1295
- Kirkpatrick et al. (2010) Kirkpatrick, J. D., Looper, D. L., Burgasser, A. J., et al. 2010, ApJS, 190, 100
- Kirkpatrick et al. (1999) Kirkpatrick, J. D., Reid, I. N., Liebert, J., et al. 1999, ApJ, 519, 802
- Knapp et al. (2004) Knapp, G. R., Leggett, S. K., Fan, X., et al. 2004, AJ, 127, 3553
- Lafrenière et al. (2010) Lafrenière, D., Jayawardhana, R., & van Kerkwijk, M. H. 2010, ApJ, 719, 497
- Lagrange et al. (2009) Lagrange, A.-M., Gratadour, D., Chauvin, G., et al. 2009, A&A, 493, L21
- Lawrence et al. (2007) Lawrence, A., Warren, S. J., Almaini, O., et al. 2007, MNRAS, 379, 1599
- Lee (1968) Lee, T. A. 1968, ApJ, 152, 913
- Leggett et al. (2001) Leggett, S. K., Allard, F., Geballe, T. R., Hauschildt, P. H., & Schweitzer, A. 2001, ApJ, 548, 908
- Leggett et al. (2010b) Leggett, S. K., Burningham, B., Saumon, D., et al. 2010b, ApJ, 710, 1627
- Leggett et al. (2002) Leggett, S. K., Golimowski, D., Fan, X., et al. 2002, ApJ, 564, 452
- Leggett et al. (2007) Leggett, S. K., Saumon, D., Marley, M. S., et al. 2007, ApJ, 655, 1079
- Leggett et al. (2010a) Leggett, S. L., Burningham, B., Saumon, D., et al. 2010a, ApJ, 710, 1627
- Liebert & Burgasser (2007) Liebert, J. & Burgasser, A. J. 2007, ApJ, 655, 522
- Liu et al. (2016) Liu, M. C., Dupuy, T. J., & Allers, K. N. 2016, ApJ, 833, 96
- Liu et al. (2013) Liu, M. C., Magnier, E. A., Deacon, N. R., et al. 2013, ApJ, 777, L20
- Lodieu et al. (2008) Lodieu, N., Hambly, N. C., Jameson, R. F., & Hodgkin, S. T. 2008, MNRAS, 383, 1385
- Lodieu et al. (2007) Lodieu, N., Hambly, N. C., Jameson, R. F., et al. 2007, MNRAS, 374, 372
- Lodieu et al. (2015) Lodieu, N., Zapatero Osorio, M. R., Rebolo, R., et al. 2015, A&A, 581, 73
- Lodieu et al. (2009) Lodieu, N., Zapatero Osorio, M. R., Rebolo, R., Martín, E. L., & Hambly, N. C. 2009, A&A, 505, 1115
- Looper et al. (2008) Looper, D. L., Kirkpatrick, J. D., Cutri, R. M., et al. 2008, ApJ, 686, 528
- Lucas et al. (2001) Lucas, P. W., Roche, P. F., Allard, F., & Hauschildt, P. H. 2001, MNRAS, 326, 695
- Luhman & Esplin (2016) Luhman, K. & Esplin, T. L. 2016, AJ, in press
- Luhman (1999) Luhman, K. L. 1999, ApJ, 525, 466
- Luhman (2012) Luhman, K. L. 2012, ARA&A, 50, 65
- Luhman (2014) Luhman, K. L. 2014, ApJ, 786, L18
- Luhman et al. (2007a) Luhman, K. L., Allers, K. N., Jaffe, D. T., et al. 2007a, ApJ, 659, 1629
- Luhman et al. (2008) Luhman, K. L., Hernández, J., Downes, J. J., Hartmann, L., & Briceño, C. 2008, ApJ, 688, 362
- Luhman et al. (2007b) Luhman, K. L., Patten, B. M., Marengo, M., et al. 2007b, ApJ, 654, 570
- Luhman et al. (2003) Luhman, K. L., Stauffer, J. R., Muench, A. A., et al. 2003, ApJ, 593, 1093
- Macintosh et al. (2015) Macintosh, B., Graham, J. R., Barman, T., et al. 2015, Science, 350, 64
- Manjavacas et al. (2015) Manjavacas, E., Goldman, B., Alcalá, J. M., et al. 2015, MNRAS, 455, 1341
- Marocco et al. (2014a) Marocco, F., Day-Jones, A. C., Lucas, P. W., et al. 2014a, MNRAS, 439, 372
- Marocco et al. (2014b) Marocco, F., Jones, H. R. A., Day-Jones, A. C., et al. 2014b, MNRAS, 449, 365
- Marois et al. (2008) Marois, C., Macintosh, B., Barman, T., et al. 2008, Science, 322, 1348
- Marois et al. (2010) Marois, C., Zuckerman, B., Konopacky, Q. M., Macintosh, B., & Barman, T. 2010, Nature, 468, 1080
- Martín et al. (2006) Martín, E. L., Brandner, W., Bouy, H., et al. 2006, A&A, 456, 253
- Martín et al. (1999) Martín, E. L., Delfosse, X., Basri, G., et al. 1999, AJ, 118, 2466
- Martín et al. (2001) Martín, E. L., Zapatero Osorio, M. R., Barrado y Navascués, D., Béjar, V. J. S., & rebolo, R. 2001, ApJ, 558, L117
- Massey & Gronwall (1990) Massey, P. & Gronwall, C. 1990, ApJ, 358, 344
- McCaughrean et al. (2004) McCaughrean, M. J., Close, L. M., Scholz, R.-D., et al. 2004, A&A, 413, 1029
- McGovern et al. (2004) McGovern, M. R., Kirkpatrick, J. D., McLean, I. S., et al. 2004, ApJ, 600, 1020
- McLean et al. (2003) McLean, I. S., McGovern, M. R., Burgasser, A. J., et al. 2003, ApJ, 596, 561
- McLean et al. (2007) McLean, I. S., Prato, L., McGovern, M. R., et al. 2007, ApJ, 658, 1217
- Moorwood et al. (1998) Moorwood, A., Cuby, J.-G., Biereichel, P., et al. 1998, The Messenger, 94, 7
- Naud et al. (2014) Naud, M.-E., Artigau, E., Malo, L., et al. 2014, ApJ, 787, 5
- Patience et al. (2012) Patience, K., King, R. R., De Rosa, R. J., et al. 2012, A&A, 540, 85
- Patten et al. (2006) Patten, B. M., Stauffer, J. R., Burrows, A., et al. 2006, ApJ, 651, 502
- Pavlenko et al. (2000) Pavlenko, Y., Zapatero Osorio, M. R., & Rebolo, R. 2000, A&A, 355, 245
- Peña Ramírez et al. (2016) Peña Ramírez, K., Béjar, V. J. S., & Zapatero Osorio, M. R. 2016, A&A, 586, A157
- Peña Ramírez et al. (2012) Peña Ramírez, K., Béjar, V. J. S., Zapatero Osorio, M. R., Petr-Gotzens, M. G., & Martín, E. L. 2012, ApJ, 754, 30
- Peña Ramírez et al. (2015) Peña Ramírez, K., Zapatero Osorio, M. R., & Béjar, V. J. S. 2015, A&A, 574, 118
- Peña Ramírez et al. (2011) Peña Ramírez, K., Zapatero Osorio, M. R., Béjar, V. J. S., Rebolo, R., & Bihain, G. 2011, A&A, 532, 42
- Perryman et al. (1997) Perryman, M. A. C., Lindegren, L., Kovalevsky, J., et al. 1997, A&A, 323, L49
- Rebolo et al. (1998) Rebolo, R., Zapatero Osorio, M. R., Madruga, S., et al. 1998, Science, 282, 1309
- Reid et al. (2001) Reid, I. N., Burgasser, A. J., Cruz, K. L., Kirkpatrick, J. D., & Gizis, J. E. 2001, AJ, 121, 1710
- Rice et al. (2010) Rice, E. L., Barman, T., McLean, I. S., Prato, L., & Kirkpatrick, J. D. 2010, ApJS, 186, 63
- Rossow (1978) Rossow, W. B. 1978, Icarus, 36, 1
- Sacco et al. (2007) Sacco, G. G., Randich, S., Franciosini, E., Pallavicini, R., & Palla, F. 2007, A&A, 462, L23
- Saumon et al. (1996) Saumon, D., Hubbard, W. B., Burrows, A., et al. 1996, ApJ, 460, 993
- Schaefer et al. (2016) Schaefer, G. H., Hummel, C. A., Gies, D. R., et al. 2016, AJ, 152, 213
- Schmidt et al. (2014) Schmidt, S., J., West, A. A., Bochanski, J. J., Hawley, S. L., & Kielty, C. 2014, PASP, 126, 642
- Schneider et al. (2016b) Schneider, A. C., Cushing, M. C., Kirkpatrick, J. D., & Gelino, C. R. 2016b, ApJL, 823, L35
- Schneider et al. (2014) Schneider, A. C., Cushing, M. C., Kirkpatrick, J. D., et al. 2014, AJ, 147, 34
- Schneider et al. (2016a) Schneider, A. C., Windsor, J., Cushing, M. C., Kirkpatrick, J. D., & Wright, E. L. 2016a, ApJL, 822, L1
- Scholz & Jayawardhana (2008) Scholz, A. & Jayawardhana, R. 2008, ApJ, 672, L49
- Scholz et al. (2003) Scholz, R.-D., McCaughrean, M. J., Lodieu, N., & Kuhlbrodt, B. 2003, A&A, 398, L29
- Sherry et al. (2008) Sherry, W. H., Walter, F. M., Wolk, S. J., & Adams, N. R. 2008, AJ, 135, 1616
- Simcoe et al. (2008) Simcoe, R. A., Burgasser, A. J., Bernstein, R. A., & et al. 2008, Proc. SPIE, 7014, 70140U
- Simcoe et al. (2010) Simcoe, R. A., Burgasser, A. J., Bochanski, J. J., & et al. 2010, Proc. SPIE, 7735, 773514
- Simón-Díaz et al. (2015) Simón-Díaz, S., Caballero, J. A., Korenzo, J., et al. 2015, ApJ, 799, 169
- Skrutskie et al. (2006) Skrutskie, M. F., Cutri, R. M., Stiening, R., et al. 2006, AJ, 131, 1163
- Slesnick et al. (2004) Slesnick, C. L., Hillenbrand, L. A., & Carpenter, J. M. 2004, ApJ, 610, 1045
- Steele & Jameson (1995) Steele, I. A. & Jameson, R. F. 1995, MNRAS, 272, 630
- Stephens et al. (2009) Stephens, D. C., Leggett, S. K., Cushing, M. C., et al. 2009, ApJ, 702, 154
- Sumi et al. (2011) Sumi, T., Kamiya, K., Bennett, D. P., et al. 2011, Nature, 473, 349
- Tinney et al. (1998) Tinney, C. G., Delfosse, X., Forveille, T., & Allard, F. 1998, A&A, 338, 1066
- Tremblin et al. (2016) Tremblin, P., Amundsen, D. S., Chabrier, G., et al. 2016, ApJL, 817, L19
- Wright et al. (2011) Wright, E. L., Mainzer, A., Gelino, C., & Kirkpatrick, J. D. 2011, arXiv:1104.2569
- Zakhozhay et al. (2016) Zakhozhay, O., Zapatero Osorio, M. R., & Béjar, V. J. S. 2016, MNRAS, submitted
- Zapatero Osorio et al. (2008) Zapatero Osorio, M. R., Béjar, V. J. S., Bihain, G., et al. 2008, A&A, 477, 895
- Zapatero Osorio et al. (2014a) Zapatero Osorio, M. R., Béjar, V. J. S., Martín, E. L., et al. 2014a, A&A, 572, 67
- Zapatero Osorio et al. (2000) Zapatero Osorio, M. R., Béjar, V. J. S., Martín, E. L., et al. 2000, Science, 290, 103
- Zapatero Osorio et al. (2002) Zapatero Osorio, M. R., Béjar, V. J. S., Martín, E. L., et al. 2002, ApJ, 578, 536
- Zapatero Osorio et al. (2014b) Zapatero Osorio, M. R., Béjar, V. J. S., Miles-Páez, P. A., et al. 2014b, A&A, 568, 6
- Zapatero Osorio et al. (2012a) Zapatero Osorio, M. R., Béjar, V. J. S., Pavlenko, Y., et al. 2012a, A&A, 384, 937
- Zapatero Osorio et al. (2014a) Zapatero Osorio, M. R., Gálvez Ortiz, M. C., Bihain, G., et al. 2014a, A&A, 568, 77
- Zapatero Osorio et al. (2016) Zapatero Osorio, M. R., Lodieu, N., Béjar, V. J. S., et al. 2016, A&A, 592, A80
Appendix A S Ori 70
With the low-resolution and modest S/N of our data, there are no obvious features in the osiris spectrum of S Ori 70 (Figure 2), except for a markedly increasing slope from blue to red wavelengths typical of the T classification. This agrees with the determinations of T5.51.0 and T6–T7 of Zapatero Osorio et al. (2002) and Burgasser et al. (2004), respectively, based on ground-based near-infrared spectra. More recently, Peña Ramírez et al. (2015) employed high S/N data at - and -band wavelengths collected with the Wide Field Camera 3 of the Hubble Space Telescope (HST) to classify S Ori 70. These authors found that the HST near-infrared spectrum better resembles T7 type and noted that the -band spectrum of Zapatero Osorio et al. (2002) is better matched by earlier types, which agrees with the measured red color. No obvious signatures detectable at the low resolution of the HST spectrum () have yet confirmed the low gravity atmosphere of S Ori 70.
The Spitzer colors of S Ori 70 are also redder than those of the high-gravity spectral counterparts (Luhman et al. 2008; Scholz & Jayawardhana 2008; Zapatero Osorio et al. 2008). Because of the different pressure and density conditions at which H2, CH4, and CO absorptions are produced, low-gravity ultra-cool T-type objects tend to be brighter at and redder in all near-infrared and colors than comparable high-gravity objects (see discussions and figures in Knapp et al. 2004; Patten et al. 2006; Leggett et al. 2007; Liebert & Burgasser 2007). As an example, Naud et al. (2014) reported on the discovery of GU Psc b, a T3.5 dwarf, with a relatively strong -band emission, that orbits the 110–130-Myr AB Doradus moving group star GU Psc (70–130 Myr). And Gagné et al. (2015b) announced a T5.5 member of the same moving group with a mass of about 10–12 MJup and a red color for its spectral type. Other “red” T dwarfs have been reported in the literature (e.g., Luhman et al. 2007b; Goldman et al. 2010; Best et al. 2015), all of which probably have intermediate ages. Very recently, Chiang & Chen (2015) published the finding of two methane dwarf candidates in the Oph star-forming region whose colors resemble those of S Ori 70; and Macintosh et al. (2015) announced the finding of the 20-Myr T-dwarf 51 Eri b, which has a red color. This reddish nature might provide a hint for the case of S Ori 70, whose optical spectrum we explored to search for features that might reveal a low gravity atmosphere.
We compared the optical spectrum of S Ori 70 with the low-resolution data for field T dwarf spectral standards (Kirkpatrick et al. 2010) with observed spectra available from the SpeX Prism Library999http://pono.ucsd.edu/ adam/browndwarfs/spexprism/. The reference data were obtained with a resolution of = 75–200 and span roughly 0.65–2.55 m. Using Equation 5 and the observed T dwarf spectra instead of theoretical models, we searched for the field standard that minimized the quantity in the wavelength interval 840–980 nm, where both the osiris and SpeX prism spectra have better quality. The best match was found to be T6 with an associated uncertainty of 1 subtype. The “color-e” index defined by Burgasser et al. (2003), which measures the K i spectral slope between 919 and 845 nm for late-L and T dwarfs, also yields a T6 classification for S Ori 70 (“color-e” = 5.6). The visual comparison of S Ori 70’s optical spectrum with other T dwarfs is provided in Figure 15. The high quality data of Indi Ba (T0–T2) and Bb (T6–T6.5) published by King et al. (2010) were used after a suitable convolution with a Gaussian function for the spectral degradation to the resolution of = 200, which is close to that of the osiris spectrum. Because the binary Indi Bab (McCaughrean et al. 2004) is a companion to the nearby, well-known K4.5V star Indi (Scholz et al. 2003), the system has been deeply studied in the literature (King et al. 2010, and references therein); the two T dwarfs can be used as templates. The lack of lithium absorption at 670.82 nm in their atmospheres provides solid evidence of their old ages and therefore high gravity nature.
From Figure 15, it becomes apparent that the red slope of the optical spectrum of S Ori 70 better matches that of T6–T7 high-gravity field dwarfs, which agrees with the near-infrared classification. Water vapor absorption at 935 nm appears prominent in the spectrum of S Ori 70, even at the very low resolution of our data (we note that the spectrally degraded data of Indi Ba and Bb also show strong water vapor features; see Figure 15). As depicted in Figure 6 of Burgasser et al. (2003), H2O at 935 nm increases in strength with decreasing spectral type, the strongest feature occurring at around T8. This supports the optical spectral classification of S Ori 70 based on the red optical pseudo-continuum. At wavelengths blueward of 800 nm, there are practically no photon counts registered in the osiris spectrum, thus preventing us from studying the blue wing of K i and determining whether this signature behaves differently in S Ori 70. We determined an upper limit of pEW 20 Å on the intensity of the Cs i absorptions at 852.1 and 894.3 nm. This is not a very restrictive measurement since the great majority of field T dwarfs have pEWs ranging from 4 to 9 Å (Cs i), as indicated by Burgasser et al. (2003). In summary, we found that the spectral classification of S Ori 70 at optical and near-infrared wavelengths agrees to within one sutype. However, higher spectral resolution and better S/N data are required for a detailed quantitative analysis of its individual spectroscopic features for a proper assessment of its surface gravity.

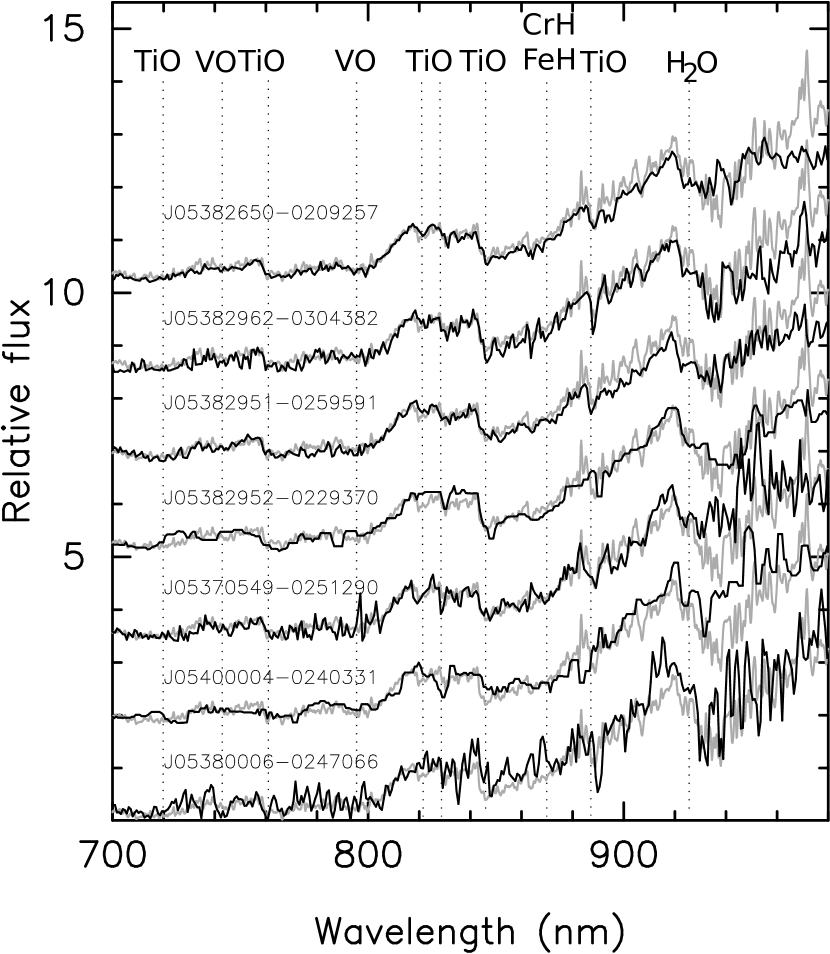
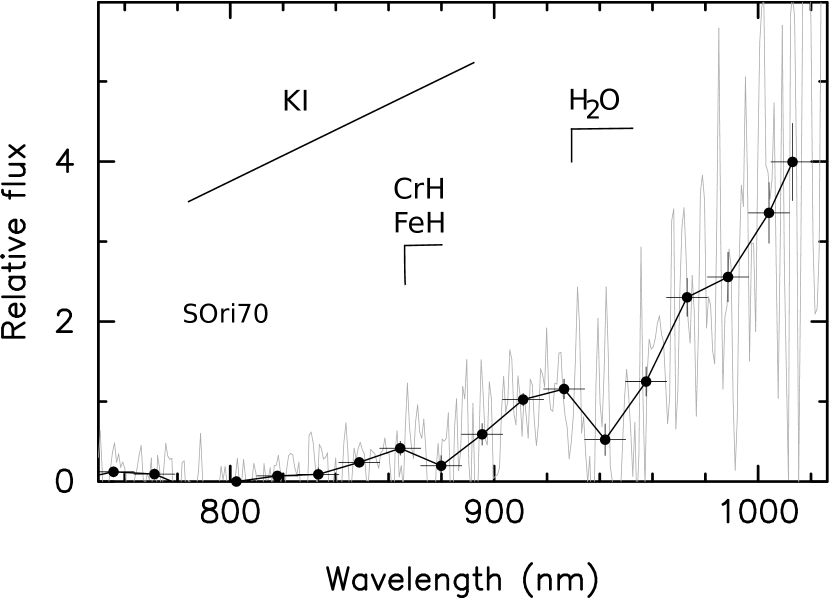
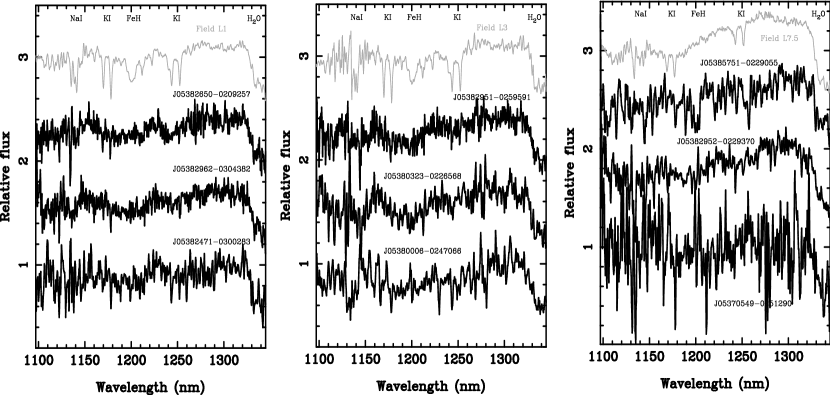
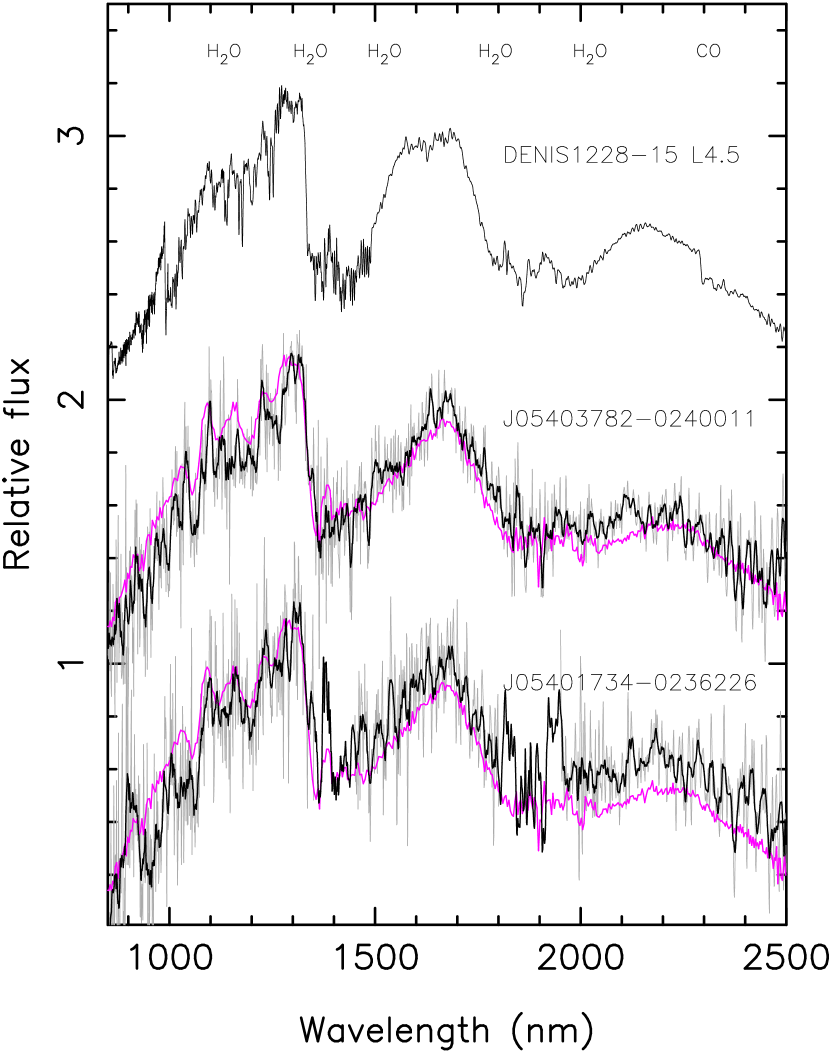
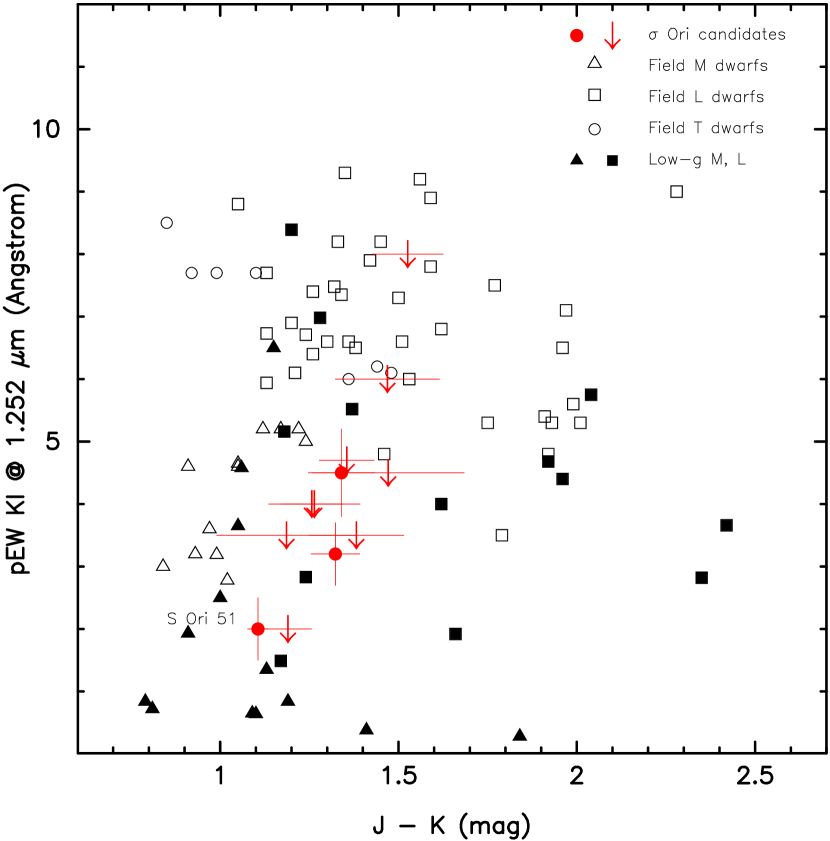
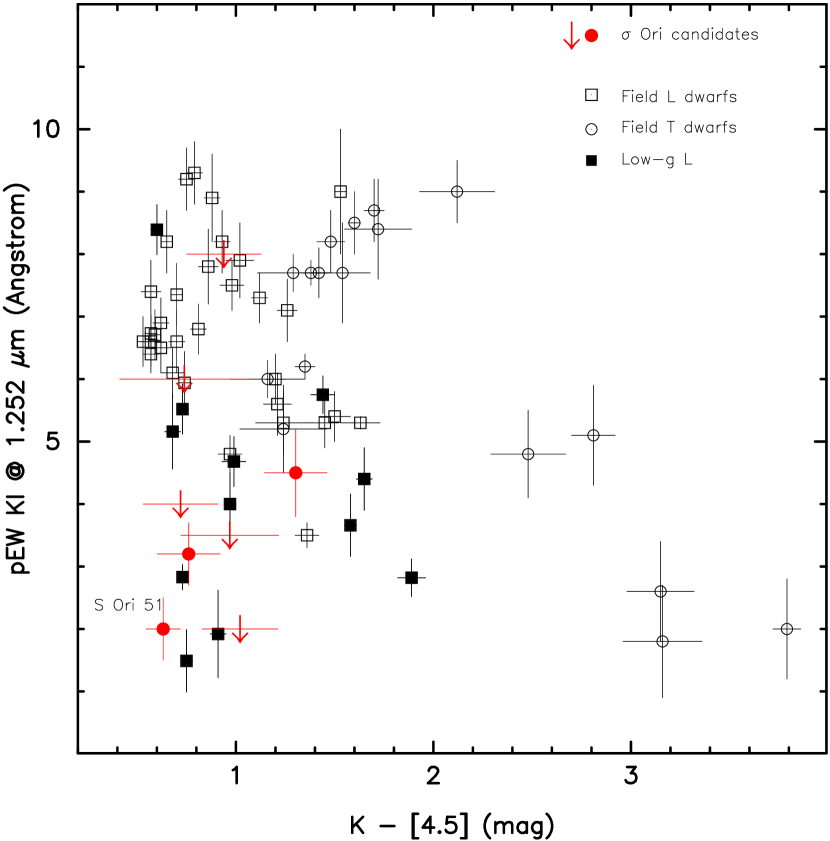
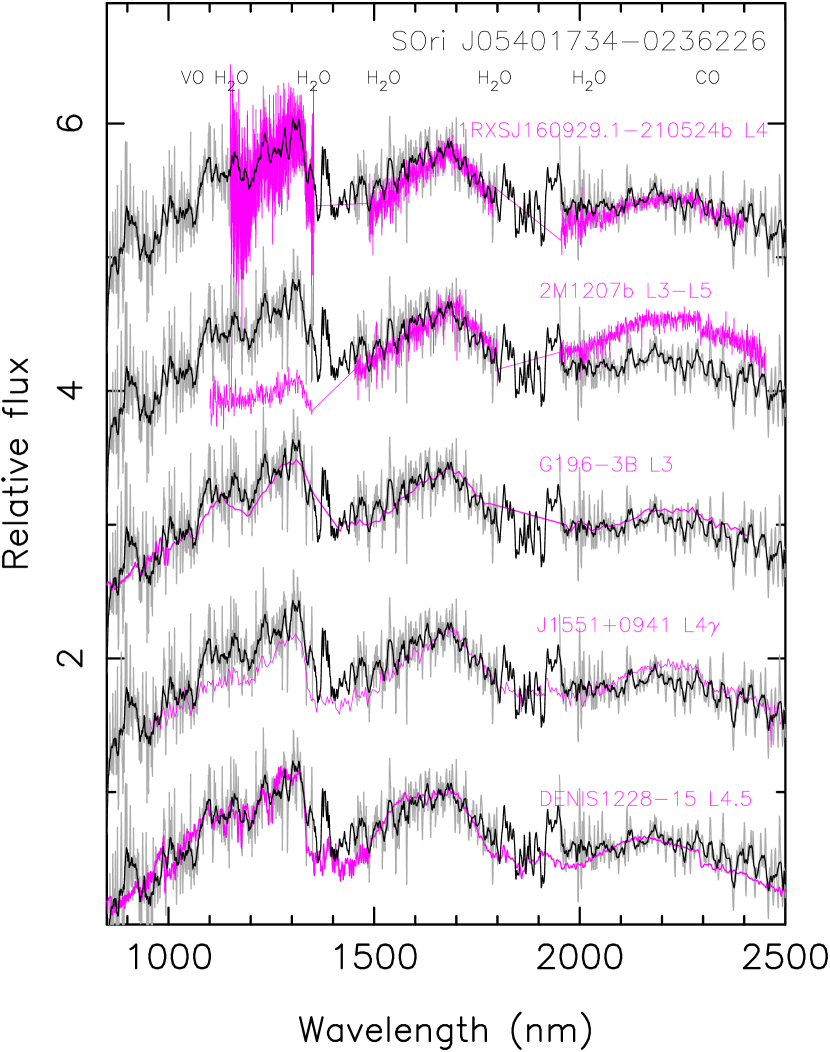
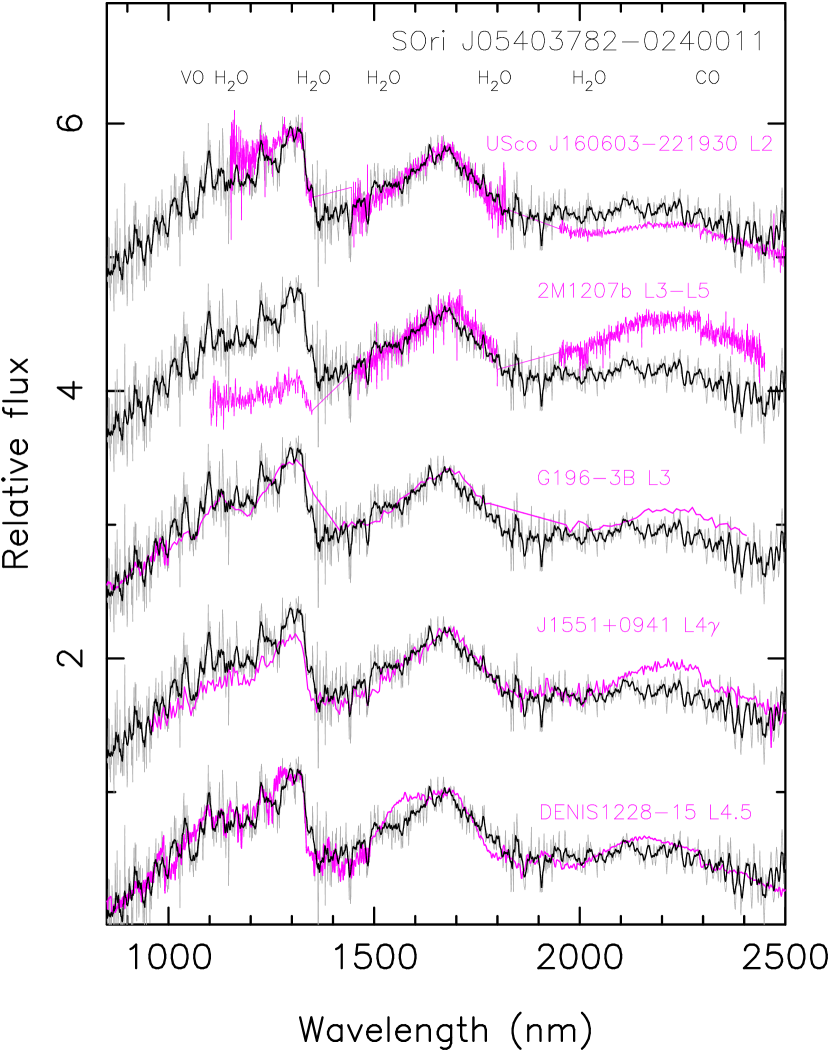

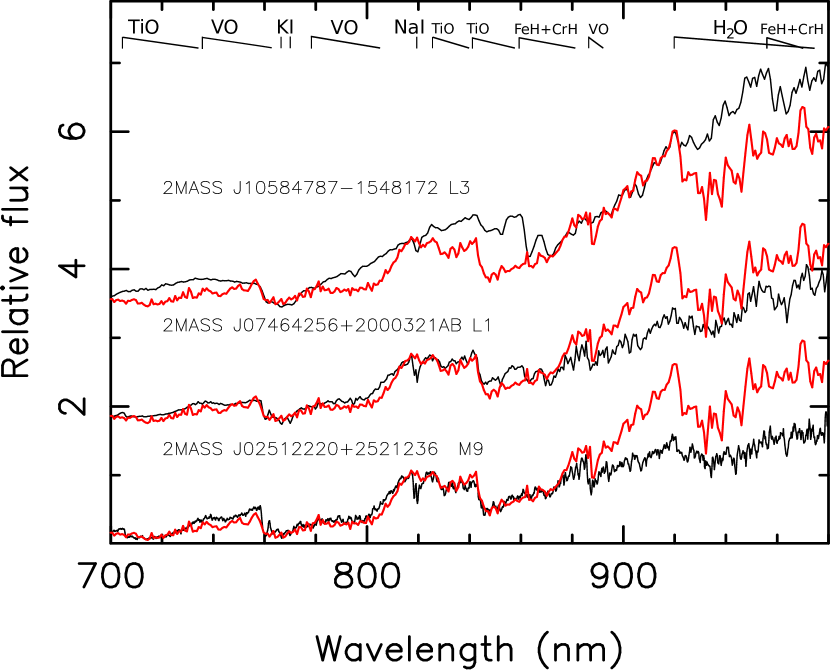
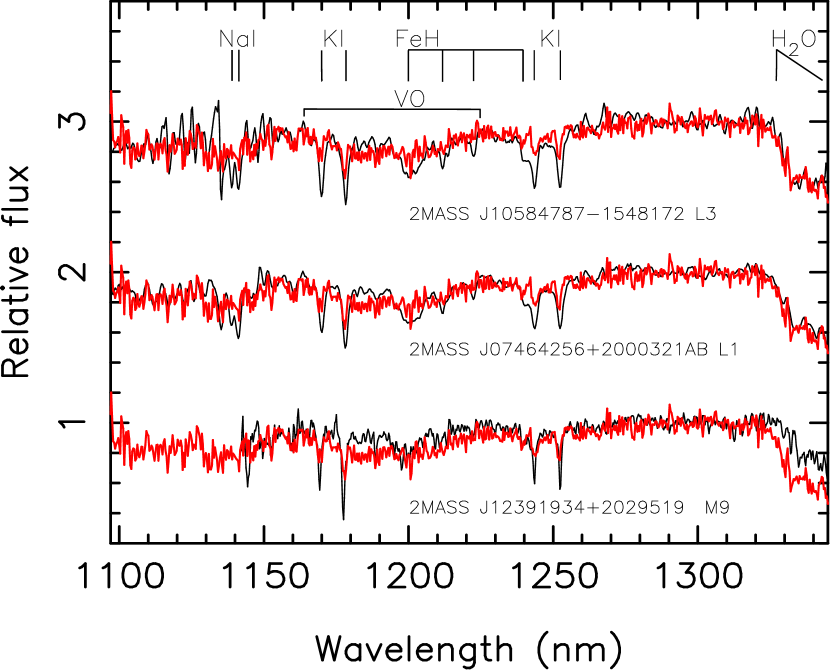
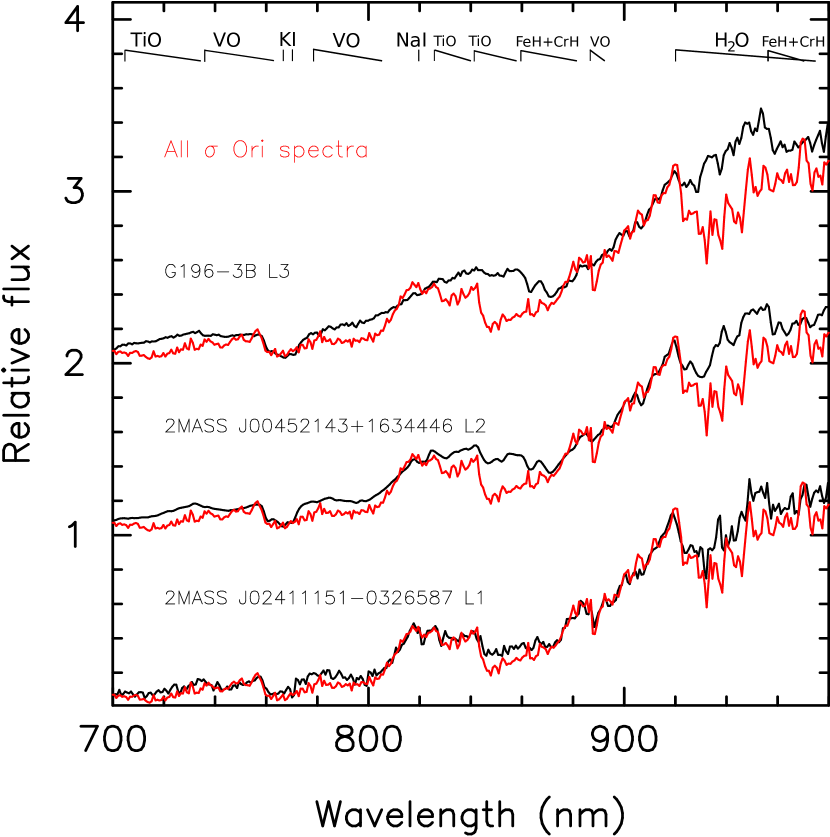
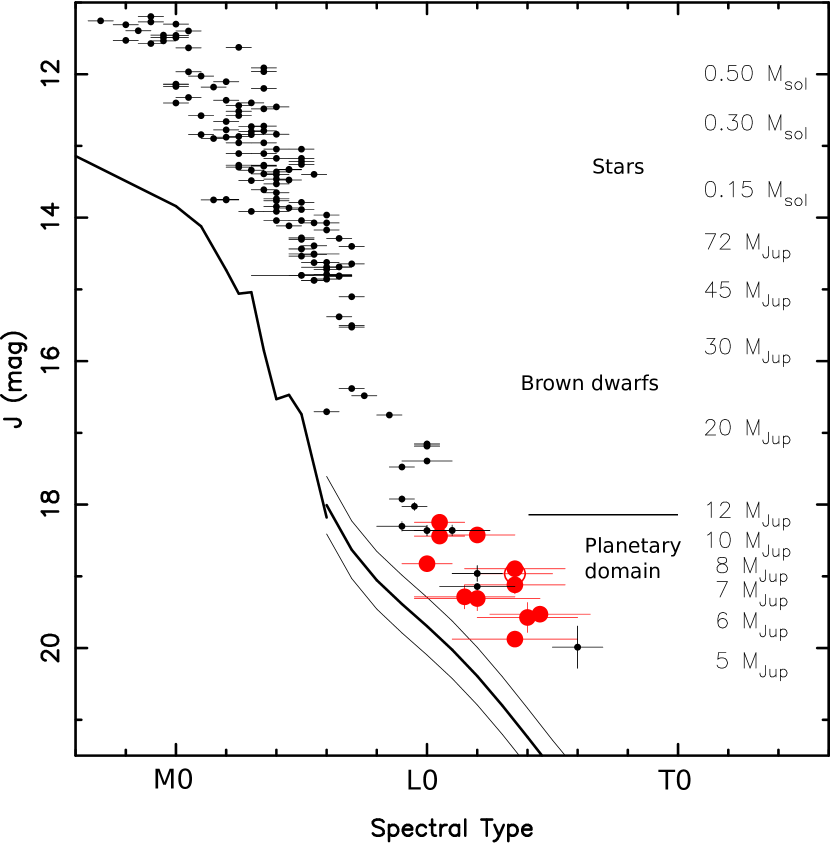
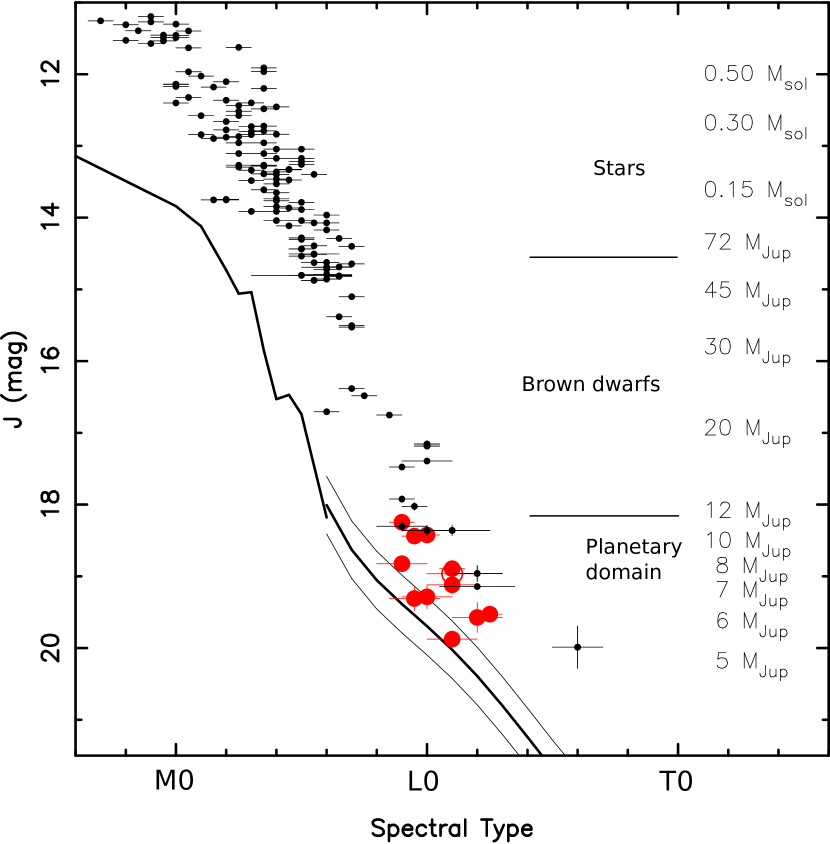
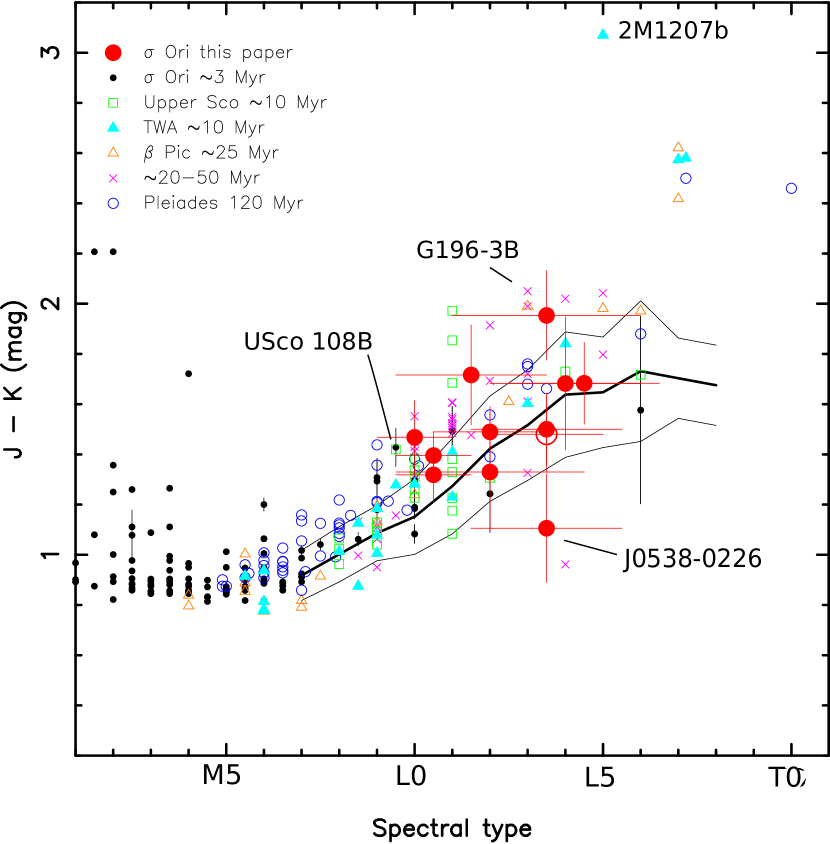
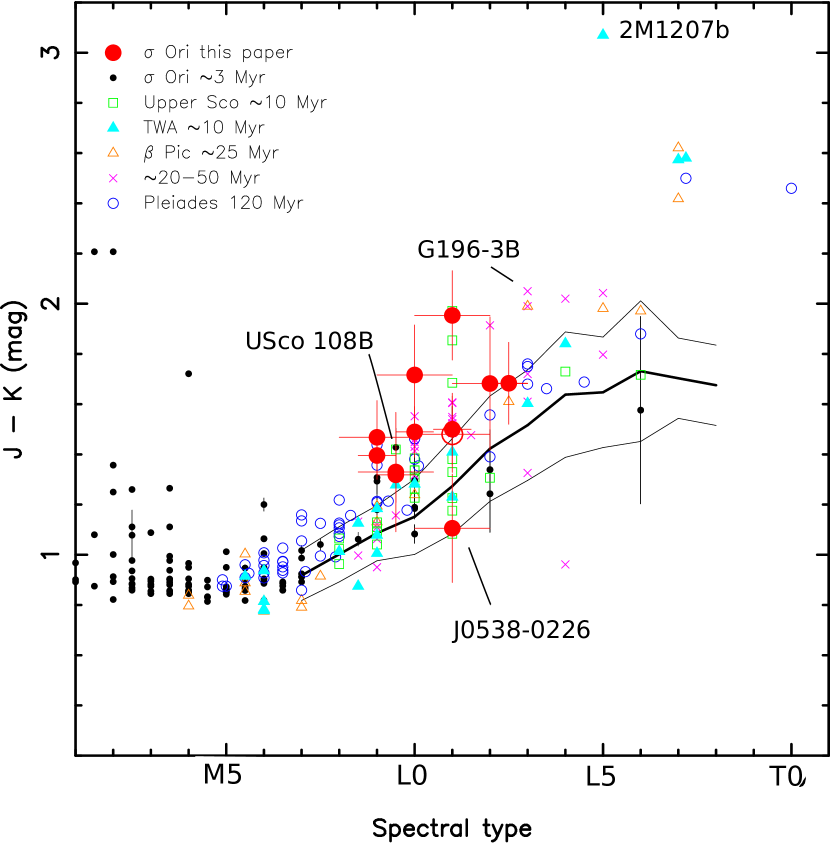

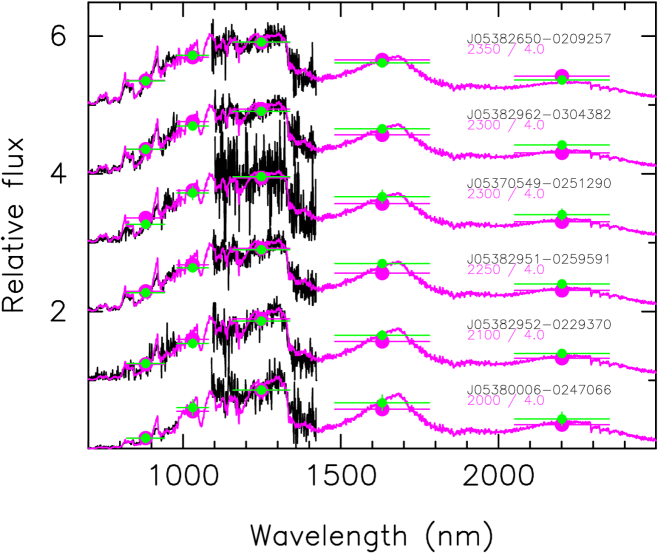
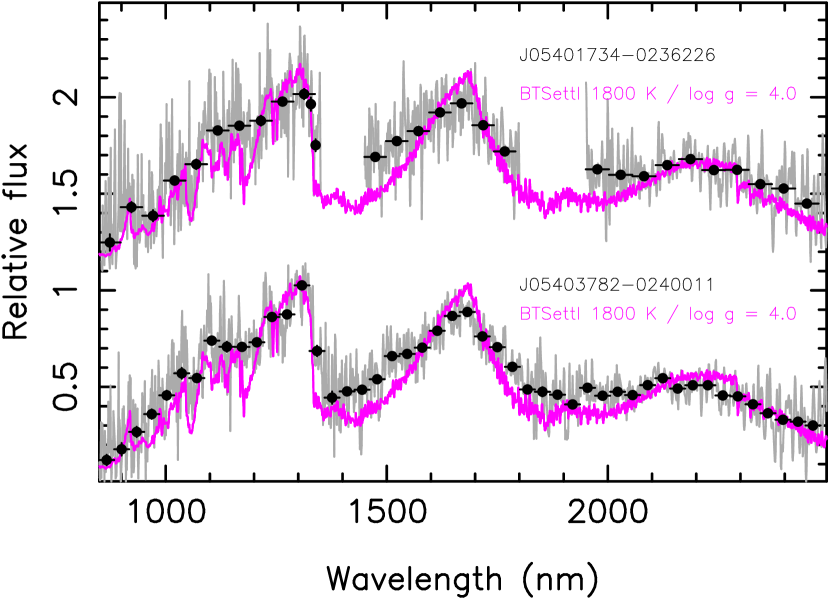
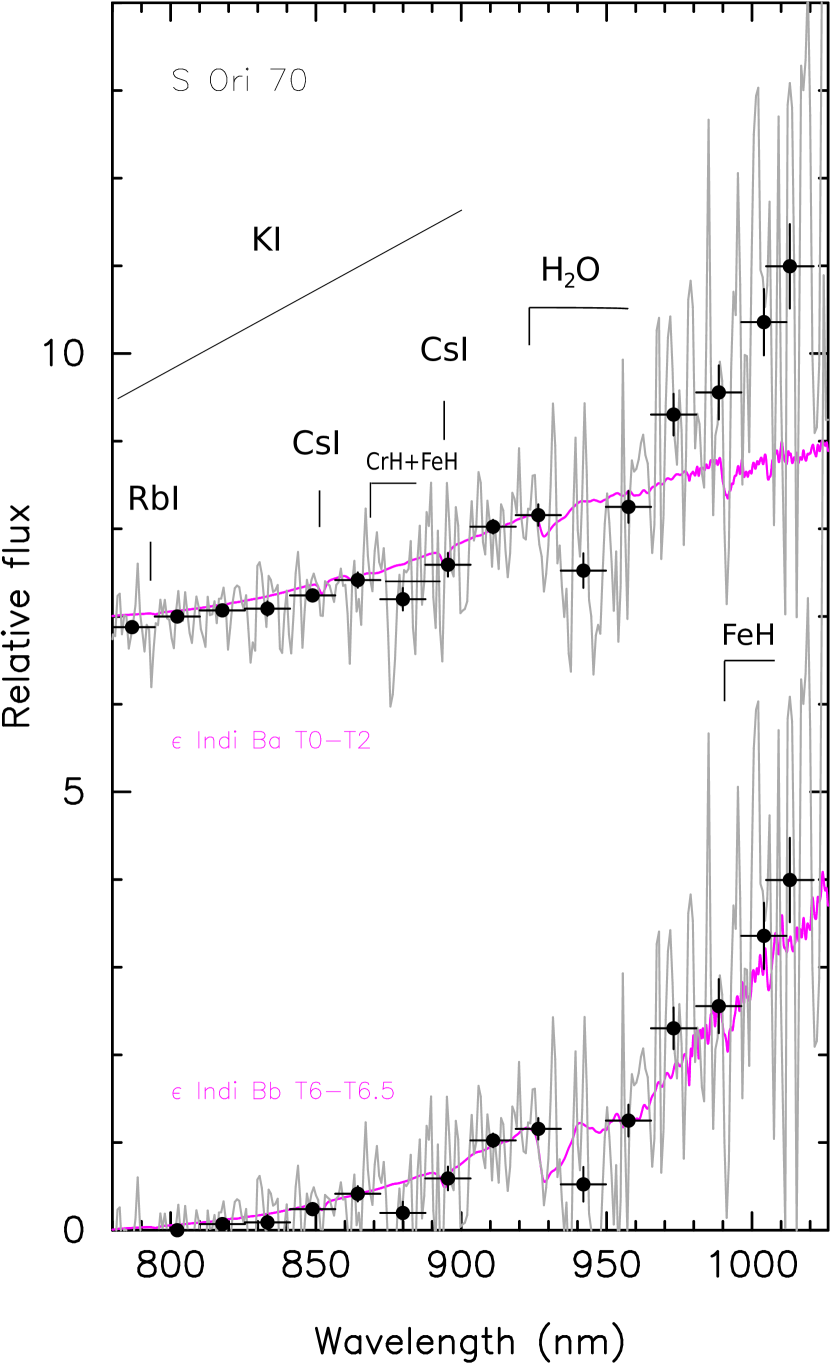
| Object | aavista photometry given by Peña Ramírez et al. (2012). | Obs. date | Inst./Teles. | Grating | Slit width | Air mass | ||
|---|---|---|---|---|---|---|---|---|
| (mag) | (UT) | (″) | (m) | (s) | ||||
| S Ori J053826500209257 | 18.25 | 2012 Dec 03 | isaac/vlt | LR | 1.0 | 1.097–1.339 | 8600 | 1.10–1.08 |
| 2012 Dec 14 | osiris/gtc | R300R | 1.2 | 0.700–0.980 | 41800 | 1.66–1.26 | ||
| S Ori J053829620304382 | 18.40 | 2012 Dec 04 | isaac/vlt | LR | 1.0 | 1.097–1.339 | 8600 | 1.11–1.32 |
| 2014 Nov 25 | osiris/gtc | R300R | 1.0 | 0.700–0.980 | 21800 | 1.26–1.35 | ||
| S Ori J053829510259591 | 18.42 | 2012 Dec 01 | isaac/vlt | LR | 1.0 | 1.097–1.339 | 10600 | 1.08–1.18 |
| 2012 Dec 13 | osiris/gtc | R300R | 0.8 | 0.700–0.980 | 41200 | 1.53–1.28 | ||
| S Ori J053824710300283 | 18.64 | 2012 Dec 02 | isaac/vlt | LR | 1.0 | 1.097–1.339 | 8600 | 1.11–1.42 |
| S Ori J053829520229370 | 18.80 | 2013 Jan 26 | isaac/vlt | LR | 1.0 | 1.097–1.339 | 12600 | 1.37–2.60 |
| 2012 Dec 15 | osiris/gtc | R300R | 1.0 | 0.700–0.980 | 31200 | 1.43–1.68 | ||
| S Ori J053857510229055 | 19.04 | 2012 Dec 01 | isaac/vlt | LR | 1.0 | 1.097–1.339 | 8600 | 1.16–1.45 |
| S Ori J053705490251290 | 19.11 | 2013 Jan 27 | isaac/vlt | LR | 1.0 | 1.097–1.339 | 8600 | 1.54–2.62 |
| 2012 Dec 16 | osiris/gtc | R300R | 1.0 | 0.700–0.980 | 41200 | 1.20–1.18 | ||
| S Ori J053803230226568 | 19.26 | 2013 Jan 26 | isaac/vlt | LR | 1.0 | 1.097–1.339 | 16600 | 1.10–1.22 |
| S Ori J054000040240331 | 19.31 | 2012 Dec 15 | osiris/gtc | R300R | 1.0 | 0.700–0.980 | 41800 | 1.17–1.24 |
| S Ori J053800060247066 | 19.45 | 2012 Dec 02 | isaac/vlt | LR | 1.0 | 1.097–1.339 | 14600 | 1.14–1.09 |
| 2012 Dec 16 | osiris/gtc | R300R | 1.2 | 0.700–0.980 | 41800 | 1.23–1.57 | ||
| 2014 Nov 26 | osiris/gtc | R300R | 1.2 | 0.700–0.980 | 41800 | 1.18–1.25 | ||
| S Ori J054037820240011 | 19.53 | 2014 Dec 01 | fire/Magellan | LR | 0.6 | 0.820–2.400 | 8180,8300 | 1.12–1.16 |
| S Ori 70 | 19.83 | 2012 Dec 14 | osiris/gtc | R300R | 0.8 | 0.750–0.980 | 81800 | 1.18–1.78 |
| S Ori J054017340236226 | 19.88 | 2014 Dec 01 | fire/Magellan | LR | 0.6 | 0.820–2.400 | 14300 | 1.22–1.55 |
| 2MASS J101707541308398bbField L1 dwarf. | 14.10 | 2012 Dec 04 | isaac/vlt | LR | 1.0 | 1.097–1.339 | 2600 | 1.40–1.44 |
| 2MASS J105847871548172ccField L3 dwarf. | 14.16 | 2012 Dec 02 | isaac/vlt | LR | 1.0 | 1.097–1.339 | 2300 | 1.17–1.19 |
| 2012 Dec 15 | osiris/gtc | R300R | 0.8 | 0.700–0.980 | 2300 | 1.41–1.35 | ||
| 2MASS J042348580414035ddField L7.5 dwarf. | 14.47 | 2012 Dec 01 | isaac/vlt | LR | 1.0 | 1.097–1.339 | 2200 | 1.06–1.07 |
| Object | pEWaaCorresponding to K i 1.252 micron. | -classbbGravity class as defined by Allers & Liu (2013). | log /L⊙ | Mass | |
|---|---|---|---|---|---|
| (Å) | (K) | (MJup) | |||
| S Ori 51 | 2.00.5ccMeasure obtained from the spectrum published by McGovern et al. (2004). | 2.600.16 | 20.83.7 | ||
| S Ori J053826500209257 | 2.0 | INT-G | 2350100 | 3.020.17 | 12.92.7 |
| S Ori J053829620304382 | 4.7 | VL-G | 2300100 | 3.050.17 | 12.42.6 |
| S Ori J053829510259591 | 3.20.5 | VL-G | 2250100 | 3.070.17 | 12.22.6 |
| S Ori J053824710300283 | 4.0 | VL-G | 3.170.18 | 10.82.4 | |
| S Ori J053829520229370 | 4.50.7 | INT-G | 2100100 | 3.210.18 | 10.22.3 |
| S Ori J053857510229055 | 8.0 | VL-G | 3.270.18 | 9.52.2 | |
| S Ori J053705490251290 | 4.0 | VL-G | 2300100 | 3.360.19 | 8.62.0 |
| S Ori J053803230226568 | 3.5 | VL-G | 3.390.19 | 8.22.0 | |
| S Ori J054000040240331 | 3.370.19 | 8.42.0 | |||
| S Ori J053800060247066 | 6.0 | INT-G | 2000100 | 3.400.19 | 8.12.0 |
| S Ori J054037820240011 | 3.5 | INT-G | 1800100 | 3.470.20 | 7.42.0 |
| S Ori J054017340236226 | 4.5 | VL-G | 1800100 | 3.550.21 | 6.71.8 |
Note. — Temperatures are derived from spectral fitting of log = 4.0 (cm s-2) and solar metallicity BTSettl model atmospheres.
| Object | aavista and Spitzer photometry given by Peña Ramírez et al. (2012). | aavista and Spitzer photometry given by Peña Ramírez et al. (2012). | aavista and Spitzer photometry given by Peña Ramírez et al. (2012). | PC3 | SpT | SpT “youth” | SpT “high ” | |||
|---|---|---|---|---|---|---|---|---|---|---|
| (mag) | (mag) | (mag) | opt | optNIR | optNIR | |||||
| S Ori 51 | 2.240.03 | 1.110.03 | 0.630.09 | M9.0bbSpectral type published by Barrado y Navascués et al. (2001). | L0ccSpectral type published by Canty et al. (2013). | |||||
| S Ori J053826500209257 | 2.210.06 | 1.190.07 | 1.020.19 | 2.74 | L1.5 | 4.61 | 2.29 | 1.19 | M9.0 0.5 | L0.5 1.0 |
| S Ori J053829620304382 | 2.180.06 | 1.360.08 | 2.81 | L1.5 | 4.74 | 2.19 | 1.23 | M9.5 0.5 | L0.5 1.0 | |
| S Ori J053829510259591 | 2.460.07 | 1.320.07 | 0.760.16 | 2.32 | L1.0 | 5.75 | 2.95 | 1.29 | L0.0 0.5 | L2.0 1.5 |
| S Ori J053824710300283 | 2.410.08 | 1.260.09 | 0.720.19 | 1.16 | M9.0 1.0 | L0.0 1.0 | ||||
| S Ori J053829520229370 | 2.530.10 | 1.340.09 | 1.300.16 | 4.07 | L2.5 | 6.93 | 3.33 | 1.35 | L1.0 0.5 | L3.5 2.0 |
| S Ori J053857510229055 | 2.900.14 | 1.530.10 | 0.940.19 | 1.35 | L1.0 1.0 | L3.5 1.5 | ||||
| S Ori J053705490251290 | 2.550.12 | 1.260.13 | 2.77 | L1.5 | 6.85 | 2.99 | 1.11 | L0.0 1.0 | L1.5 2.0 | |
| S Ori J053803230226568 | 2.560.13 | 1.380.13 | 0.970.25 | 1.31 | L1.0 1.0 | L3.5 2.0 | ||||
| S Ori J054000040240331 | 2.420.12 | 3.14 | L2.0 | |||||||
| S Ori J053800060247066 | 2.990.19 | 1.470.15 | 0.740.33 | 2.92 | L1.5 | 12.0ddLarge uncertainty. | 5.27 | 1.33 | L2.0 1.0 | L4.0 2.0 |
| S Ori J054037820240011 | 2.760.18 | 1.190.20 | 5.08 | 1.40 | L2.5 0.5 | L4.5 2.0 | ||||
| S Ori J054017340236226 | 3.040.50 | 1.470.21 | 2.91 | 1.39 | L1.0 1.0 | L3.5 2.5 |
| Index | rms | Index range | SpT range | ||||
|---|---|---|---|---|---|---|---|
| high-g | 5.56 | 1.45 | 0.7 | 1.69–7.92 | M9–L7 | ||
| high-g | 17.42 | 18.21 | 6.71 | 0.87 | 0.4 | 1.29–4.35 | M9–L7 |
| high-g | 815.28 | 2088.18 | 1791.97 | 515.21 | 1.0 | 1.01–1.36 | M9–L7 |
| young | 3.20 | 0.59 | 1.2 | 1.95–8.01 | M7.5–L4 | ||
| young | 4.30 | 1.38 | 0.8 | 1.36–5.22 | M7.5–L4 | ||
| young | 14.85 | 11.94 | 0.8 | 1.01–1.48 | M7.5–L4 |
Note. — The rms is given in units of spectral subtype.
| Object | VISTA | VISTA | UKIDSS | UKIDSS | UKIDSS |
|---|---|---|---|---|---|
| (mag) | (mag) | (mag) | (mag) | (mag) | |
| S Ori J053826500209257 | 18.250.03 | 17.060.06 | 18.250.07 | 16.850.06 | 1.400.10 |
| S Ori J053829620304382 | 18.400.03 | 17.050.06 | 18.440.07 | 17.120.09 | 1.320.11 |
| S Ori J053829510259591 | 18.420.03 | 17.090.06 | 18.420.07 | 16.940.07 | 1.490.10 |
| S Ori J053824710300283 | 18.640.03 | 17.390.08 | 18.820.10 | 17.360.11 | 1.470.15 |
| S Ori J053829520229370 | 18.800.04 | 17.460.09 | 18.890.11 | 17.390.09 | 1.500.14 |
| S Ori J053857510229055 | 19.040.04 | 17.520.09 | 18.960.11 | 17.480.10 | 1.480.15 |
| S Ori J053705490251290 | 19.110.04 | 17.840.12 | 19.290.17 | 17.570.11 | 1.720.20 |
| S Ori J053803230226568 | 19.260.05 | 17.880.17 | 19.120.13 | 18.010.18 | 1.110.22 |
| S Ori J054000040240331 | 19.310.05 | 17.760.11 | 19.310.17 | 17.980.17 | 1.330.24 |
| S Ori J053800060247066 | 19.450.05 | 17.980.14 | 19.570.21 | 17.890.16 | 1.680.27 |
| S Ori J054037820240011 | 19.530.06 | 18.340.19 | 17.840.15 | ||
| S Ori J054017340236226 | 19.880.07 | 18.410.20 | 17.920.16 |