The First Optical Spectra of Wolf Rayet Stars in M101 Revealed with Gemini/GMOS
Abstract
Deep narrow-band HST imaging of the iconic spiral galaxy M101 has revealed over a thousand new Wolf Rayet (WR) candidates. We report spectrographic confirmation of 10 He ii-emission line sources hosting 15 WR stars. We find WR stars present at both sub– and super–solar metalicities with WC stars favouring more metal-rich regions compared to WN stars. We investigate the association of WR stars with H ii regions using archival HST imaging and conclude that the majority of WR stars are in or associated with H ii regions. Of the 10 emission lines sources, only one appears to be unassociated with a star-forming region. Our spectroscopic survey provides confidence that our narrow-band photometric candidates are in fact bonafide WR stars, which will allow us to characterise the progenitors of any core-collapse supernovae that erupt in the future in M101.
keywords:
Wolf Rayet Stars – HII regions – Spectroscopy.1 Introduction
Wolf-Rayet (WR) stars are the descendants of massive O stars. They display powerful stellar winds, resulting in unique, broad emission-line spectra which allow us to detect WR stars in both Local Group (Moffat & Shara, 1983; Massey & Johnson, 1998; Neugent & Massey, 2011) and more distant star-forming galaxies (Conti & Vacca, 1990; Hadfield et al., 2005). The strong stellar winds strip the outer layers, revealing the nuclear by-products of central core burning in the photosphere of the star. The products of hydrogen burning via the CNO cycle are seen at the surface in nitrogen-rich WN stars while the products of helium burning are revealed in more evolved carbon-rich WC stars and even more evolved oxygen-rich WO stars.
Stellar evolutionary theory suggests that massive stars end their lives as core-collapse supernovae, providing chemical enrichment within the interstellar medium (ISM). Indeed, Red Supergiants (RSGs) between 8–16M⊙ have been directly observed to produce hydrogen–rich Type II-P ccSNe (Mattila et al., 2010; Smartt, 2009). Theoretical models have also supported WN and WC stars as progenitors of H–poor Type Ib and H– and He–poor Type Ic ccSNe, respectively, since such elements have been stripped from the star via strong stellar winds (Groh et al., 2013).
Since most O and WR stars are in massive binaries, one expects the ccSN of the initially more massive star to lead to a Black Hole (BH) O star , followed by a BHWR star binary. Examples of such systems include Cyg X-1 (Gies et al., 2003) as well as IC10 X-1 (Prestwich et al., 2007; Silverman & Filippenko, 2008), NGC300 X-1 (Crowther et al., 2010) and M33 X-7 (Orosz et al., 2007). However such systems are rare and normally the asymmetric SN explosion combined with the orbital motion in the original binary will lead to two runaway stars, one of which will evolve as a single WR star.
One problem with this massive star evolution scenario is the growing lack of direct detections of Type Ib/c progenitors, which has called into question the WR-ccSNe connection (Smartt, 2009). For example, pre-explosion images at the location of Type Ic SN 2002ap in M74 failed to reveal a progenitor down to MB = –4.2 mag. A binary scenario was, instead, favoured by Crockett et al. (2007). In addition, (Eldridge et al., 2013) suggest that all Type Ib/c progenitors are the result of low–mass helium cores produced during binary evolution, proposing that the WR stars may produce black holes with which no visible component is associated. However, Smith et al. (2011) show that the inclusion of both binary and single evolutionary paths is optimum for reproducing the observed ccSNe rate from a standard initial mass function whilst Cao et al. (2013) report that the photometric properties of the progenitor of Type Ib SN iPTF13bvn are consistent with those of a WR star. Similarly, analysis of the light curve and ejecta mass of the Type Ibn SN OGLE-2014-SN-131 suggests a massive WR progenitor, although no direct detection has been made (Karamehmetoglu et al., 2017).
We need a catalogue of 20,000 WR stars to definitively demonstrate that WR stars are, or are not, the progenitors of Type Ibc SNe. This is because the mean lifetime of a WR star is 300,000 years so assuming that each star has an average of 150,000 years left as a WR star, one WR star from a sample of 20,000 should explode as a Ibc SNe within 7 years, although one within 50 years would be a more conservative estimate. Conversely, the demonstration that Ibc SNe come from objects that are fainter in He ii than the faintest known WR stars, such as those in the metal-poor Small Magellanic Cloud, would indicate that most WR stars do not end their lives as supernovae.
M101 is an ideal galaxy with which to study the content and associated environments of WR stars. At a distance of 6.4Mpc (Shappee & Stanek, 2011) we are still able to resolve large clusters, and the face-on orientation is favourable to an acceptable level of extinction, typically between 0.25–1 mag (Cedrés & Cepa, 2002). Based on H imaging, Kennicutt (1998) determined a Star Formation Rate (SFR)1.7 M⊙yr-1. This is a lower limit as they note that coverage is not complete, which is consistent with the upper value of SFR3.3 M⊙yr-1 found by Jarrett et al. (2013) from UV and IR observations. Based on a Milky Way SFR2 M⊙yr-1 (Chomiuk & Povich, 2011) and a predicted Galactic WR population 1900 (Rosslowe & Crowther, 2015) we expect 3000 WR stars in M101.
In addition, M101 has a strong metallicity gradient, extending from a super-solar metallicity of log(O/H)12 = 8.9 in the central regions to log(O/H)12 = 7.5 in the outer regions (Rosa & Benvenuti, 1994; Bresolin, 2007; Cedrés, Urbaneja & Cepa, 2004), allowing us to test N(WR)/N(O) and N(WN)/N(WC) ratios as a function of ambient metallicity predicted from stellar evolutionary models (Eldridge & Vink, 2006; Meynet & Maeder, 2005).
Currently the only published spectrum of a WR star in M101 is that of the WR counterpart to ULX-1 which is identified as a WN8 star by Liu et al. (2013). In this paper we present new Gemini/GMOS spectroscopy of 10 WR candidates identified from F469N narrow-band imaging using WFC3 on HST. In Section 2 we describe details of our observations, followed by our data reduction techniques in Section 3. Our results are presented in Section 4, along with H analysis in Section 5. Discussion of our non-detections is presented in Section 4.4 followed by a summary in Section 6.
2 Observations
M101 was observed in Cycle 17 by the Hubble Space Telescope, Wide Field Camera 3 (HST/WFC3), under program ID 11635 (PI. Shara). Eighteen pointings, each with a 2.72.7 arcmin field of view, were obtained using the narrow-band F469N filter (tuned to He ii4684 Å) to identify Wolf-Rayet (WR) candidates. A detailed account of the image analysis and first results is presented in Shara et al. (2013). At a distance of 6.4 Mpc (Shappee & Stanek, 2011) our M101 imaging has a spatial scale of 1.24pc pixel-1 based on HST/WFC3 0.04 arcsec pixel-1.
Full details of our imaging survey and initial results are presented in Shara et al. (2013). In summary, we found 25 F469N bright objects as WR candidates and 71 candidate Red Supergiant (RSG) stars in one of our 18 HST fields. We noted their distribution, namely that the WR stars were much more concentrated in the young star-forming complex NGC 5462 compared to the RSG. This is all predicated on the assumption that the F469N bright objects really are WR stars. This demands follow-up spectroscopy of the WR candidates, which will also allow us to distinguish between WN and WC stars. This is also a test of stellar evolutionary theory which predicts more WC stars in metal-rich regions of the galaxy.
As a first step we obtained observations with the Gemini-North Multi- Object Spectrograph (GMOS) under program ID GN-2012A-Q-49 (PI: Bibby). In total, 7 GMOS masks were designed, providing good coverage of the central region of M101. By observing additional spectrophotometric standard stars we were also able to flux calibrate the spectra to ascertain whether each WR candidate is in fact multiple WR stars, as is commonly seen in previous studies e.g. in NGC 2403 (Drissen et al., 1999) and NGC 7793 (Bibby & Crowther 2010).
2.1 Pre-Imaging
The 55 arcmin GMOS field is approximately twice the size of the HST/WFC3 field of view and as such each GMOS pointing covers several HST pointings. To design the MOS masks from the WFC3/F469N imaging would have required multiple pointings to be combined onto a single mosaic image. Unfortunately this was not possible as the F469N fields did not overlap sufficiently. Consequently we opted to use GMOS imaging to ensure that we could take full advantage of the 30 slits GMOS can accommodate.
The Gemini Science Archive contained g-band imaging obtained on February 21 2007, under program ID GN-2007A-Q-72 (PI: Chandar) which covered the central and north-east regions of M101. However, in order to sample the complete radial distribution of WR stars we obtained additional pre-imaging on February 16 2012, covering the southern central region of M101. The coverage of M101 with both HST and Gemini is shown in Figure 1. The archival and new GMOS imaging had similar spatial resolutions of 1.0 arcsec and 1.1 arcsec, respectively.
2.2 GMOS spectroscopy
Gemini Multi-Object Spectroscopy of WR candidates in M101 was obtained during April-June 2012 in seeing conditions ranging between 0.7 and 1.0 arcsec. The R150 grism was used, with no blocking filter, to allow a large wavelength range to include numerous stellar and nebular diagnostic lines. Standard dithering techniques were used with a central wavelength of 510nm and 530nm to provide full coverage across the chip gaps on GMOS in the spectral dimension.
MOS masks were designed using the Gemini mask preparation software and co-ordinates were transformed from HST/WFC3 imaging to Gemini pre-imaging. Any gaps in the MOS mask design were filled with slits placed on H ii regions to maximise the science output; results of these regions will be presented in a future paper.
The spectral dispersion obtained 3.5 Å pixel-1 and the resolution was derived from nebular lines to be 15 Å. Exposure times for MOS masks #1–3 and # 5–7 were 42240 sec, while MOS mask #4 was observed for 62300 seconds as we tried to sample the faintest WR candidates, at the limit of GMOS’s capability. A summary of the spectroscopic observations is presented in Table 1.
| Date | MOS | Exposure | Airmass | Seeing | |
|---|---|---|---|---|---|
| Mask | time (s) | (Å) | (arcsec) | ||
| 28 Feb 2012 | # 1 | 2240 (2) | 510 | 1.28 | 0.75 |
| 28 Feb 2012 | # 1 | 2240 (2) | 530 | 1.22 | 0.87 |
| 3 Apr 2012 | # 2 | 2240 (2) | 510 | 1.30 | 0.73 |
| 12 Apr 2012 | # 2 | 2240 (2) | 530 | 1.43 | 0.73 |
| 13 Apr 2012 | # 3 | 2240 (2) | 510 | 1.29 | 0.93 |
| 26 Apr 2012 | # 3 | 2240 (2) | 530 | 1.24 | 0.73 |
| 26 Apr 2012 | # 4 | 2300 (3) | 510 | 1.25 | 0.73 |
| 20 May 2012 | # 4 | 2300 (2) | 530 | 1.34 | 0.71 |
| 21 May 2012 | # 4 | 2300 (1) | 530 | 1.34 | 0.80 |
| 21 May 2012 | # 5 | 2240 (2) | 510 | 1.22 | 0.80 |
| 21 May 2012 | # 5 | 2240 (1) | 530 | 1.23 | 0.80 |
| 29 Jun 2012 | #5 | 2240 (1) | 530 | 1.26 | 0.79 |
| 27 Jun 2012 | # 6 | 2240 (2) | 510 | 1.29 | 0.59 |
| 29 Jun 2012 | # 6 | 2240 (1) | 530 | 1.22 | 0.79 |
| 29 Jun 2012 | # 7 | 2240 (2) | 510 | 1.36 | 0.79 |
| 30 Jun 2012 | # 7 | 2240 (2) | 530 | 1.23 | 0.75 |
3 Data Reduction & Calibration
Spectroscopic data reduction was performed using standard Gemini iraf 111IRAF is distributed by the National Optical Astronomy Observatories, which are operated by the Association of Universities for Research in Astronomy, Inc., under cooperative agreement with the National Science Foundation. reduction packages including gprepare and gsreduce. Wavelength calibration was performed from observations of a CuAr lamp using the same instrumental setup and MOS mask as the science observations.
In order for flux calibration to be possible we obtained observations of the spectrophotometric standard HZ44 (Oke, 1990) on the same night as MOS mask #1. The second order contamination from the R150 grism prevented the Gemini iraf software from being used so flux calibration was achieved using the starlink package figaro instead (Shortridge et al., 2004). The wavelength range was trimmed to 4000–7000 Å to remove the majority of the second order contamination and both the observed and tabulated standards were fit with a spline function and then divided by each other to produce a calibration curve.
Since our observing program only allowed for one standard star observation we cross-calibrated the other MOS masks using a common object and determining a calibration factor. The exception was MOS mask #6 and #7 which covered the most southernly region of M101 and which did not contain the calibration object so an additional object was used. Unfortunately this object was too faint to extract with the Gemini packages so cross-calibration could not be performed in this way, however the calibration factor for the other MOS masks were relatively consistent so the average was used.
To achieve an absolute flux calibration we have to account for slit losses since not all of the WR light will enter the slit. This was achieved by comparing the empirical photometric magnitude of each source to its spectroscopic magnitude calculated by convolving the observed spectrum with the filter bandpass. For masks #1,2,5,6 we found the fraction of light in the slit to be 0.86, and 0.76 for mask #4. No WR sources were extracted from Mask #7 so no slit losses were determined. The majority of the synthetic magnitudes revealed a brighter source than in the HST imaging, suggesting that the spectra was contaminated by additional sources. This is not surprising, or unexpected since the GMOS slit width is significantly larger than the HST/WFC3 resolution.
4 Results
The GMOS spectra were analysed using the Emission Line Fitting routine (ELF) within dipso to measure line fluxes of both stellar and nebular emission lines(Howarth et al., 2004).
4.1 Nebular Analysis
Where possible we made local estimates of extinction using Balmer line ratios, assuming Case B recombination for an optically thick nebula and a Standard Galactic Extinction Law. We used the H/H = 2.86 line ratio for all nebular sources apart from #48 and #112 where the H line unfortunately fell within the chip gap due to the source being unable to be extracted in one or more of the exposures. In both cases, the H4343 emission line was present so we used the H/H = 0.164 line ratio (Osterbrock & Ferland,, 2006) to determine extinction. The line fluxes and resulting E(B-V) values for each nebular source are presented in Table 2. We note that where there were no nebular lines present we adopt a value of E(B-V) = 0.44 mag from Lee et al. (2009), which is consistent with our average of E(B–V) = 0.420.07 mag.
For estimates of the metallicity of the nebular regions we rely on the strong line method of Pettini & Pagel, (2004) using the [N ii]/H ratio as a proxy for metallicity since the [O ii]3727 line was not detected in our spectra. Given the proximity of [N ii] 6583 to the H 6568 emission line, the narrow-band filter includes a contribution from both, and hence we need to correct for this contribution in our measurement of L(H). Where nebular lines are present in our GMOS spectra the [N ii]/H ratio has been determined directly whilst for others a ratio of [N ii]/H = 0.54 has been taken from Kennicutt et al. (2008). This is slightly higher than our average [N ii]/H ratio of 0.370.07 albeit from a small sample size.
Using the N2 method from Pettini & Pagel, (2004) to determine the metallicity of those H ii regions hosting WR stars we find a range of log(O/H)12 = 8.41–8.80 with errors of 0.4 dex. Using the O3N2 indicator we find a similar range of log(O/H)12 = 8.56–8.92 (0.25 dex) with regions in general agreement by 0.15 dex. The derived metallicity for Source #1024 differs by 0.3 dex between methods but is still in agreement within errors. Overall we find an average value of log(O/H)12 = 8.660.24 dex for the metallicity of H ii regions in M101. This is consistent with the metallicities derived in Bresolin (2007) and Rosa & Benvenuti (1994) but is slightly higher than we would expect from the metallicity gradient of 8.769(0.06)–0.90(0.08)(R/R0) found by Cedrés, Urbaneja & Cepa (2004). One explanation may be that all of our regions lie within the central regions of M101 with R/R25 of 0.04 to 0.22, based on an inclination of 18 degrees, PA = 45 degrees (Kenney et al., 1991) and a distance of 6.4Mpc. In contrast, the majority of the 90 regions used by Cedrés, Urbaneja & Cepa (2004) are within R/R0 = 0.30.
| Source ID | ||||||||
| ID | (Å) | 48 | 1012 | 1016 | 49 | 112 | 1024 | 2053 |
| F(H) | 4100 | 7.71 | – | – | – | – | – | – |
| I(H) | 4100 | 9.67 | – | – | – | – | – | – |
| F(H) | 4343 | 13.3 | 16.5 | 6.47 | – | 7.19 | 10.9 | 5.57 |
| I(H) | 4343 | 16.3 | 18.8 | 17.9 | – | 15.9 | 21.7 | 24.0 |
| F(H) | 4861 | c/g | 32.0 | 19.0 | 30.8 | c/g | 21.7 | 12.7 |
| I(H) | 4861 | c/g | 35.1 | 35.2 | 33.9 | c/g | 35.3 | 9.03 |
| F([O iii]) | 4959 | 22.1 | – | – | 9.74 | 3.03 | 0.37 | 6.73 |
| I([O iii]) | 4959 | 25.5 | – | – | 10.4 | 5.07 | 0.51 | 21.2 |
| F([O iii]) | 5007 | 53.8 | 1.68 | 3.96 | 49.5 | 8.94 | 2.80 | 7.71 |
| I([O iii]) | 5007 | 61.7 | 1.59 | 7.16 | 54.7 | 14.8 | 4.21 | 23.1 |
| F(H) | 6563 | 100 | 100 | 100 | 100 | 100 | 100 | 100 |
| I(H) | 6563 | 100 | 100 | 100 | 100 | 100 | 100 | 100 |
| F([N ii]) | 6583 | 31.2 | 34.8 | 64.6 | 66.6 | 30.0 | 22.6 | 14.7 |
| I([N ii]) | 6583 | 31.2 | 34.7 | 63.3 | 66.7 | 29.9 | 22.5 | 14.2 |
| F(H) | 6563 | 42.0 | 71.3 | 236.6 | 3.80 | 143.2 | 66.7 | 224.3 |
| I(H) | 6563 | 57.7 | 86.5 | 929.1 | 4.98 | 475.7 | 189.4 | 2058.0 |
| E(B-V) | 0.14 | 0.09 | 0.59 | 0.12 | 0.53 | 0.46 | 0.98 | |
| NII/H | 0.31 | 0.35 | 0.63 | 0.67 | 0.30 | 0.22 | 0.14 | |
| log(O/H)121 | 8.61 | 8.64 | 8.79 | 8.80 | 8.60 | 8.53 | 8.41 | |
| O iii/H | – | 0.40 | 0.20 | 1.61 | – | 0.12 | 0.60 | |
| log(O/H)122 | – | 8.74 | 8.92 | 8.64 | – | 8.85 | 8.56 | |
| log(O/H)123 | 8.61 | 8.69 | 8.85 | 8.72 | 8.60 | 8.69 | 8.49 | |
| R/R25 | 0.18 | 0.11 | 0.13 | 0.16 | 0.16 | 0.08 | 0.22 | |
| log(O/H)124 | 8.60 | 8.66 | 8.64 | 8.62 | 8.62 | 8.67 | 8.56 | |
| 1 from N2, 2 from O3N2, 3 Mean log(O/H)12, 4 log(O/H)12 | ||||||||
| based on gradient in Cedrés, Urbaneja & Cepa (2004) | ||||||||
4.2 Stellar Analysis
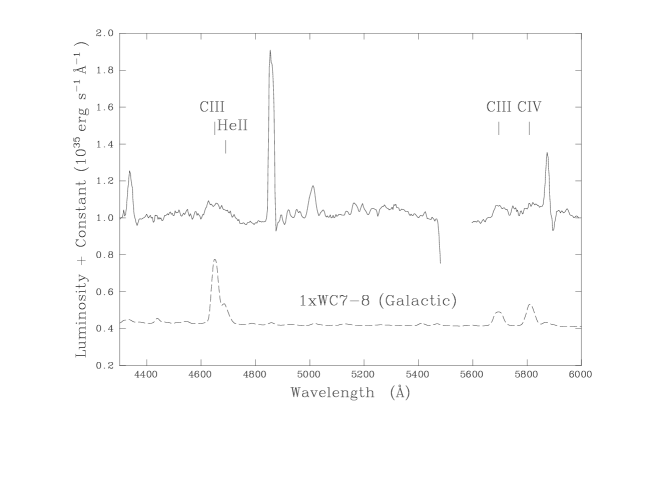
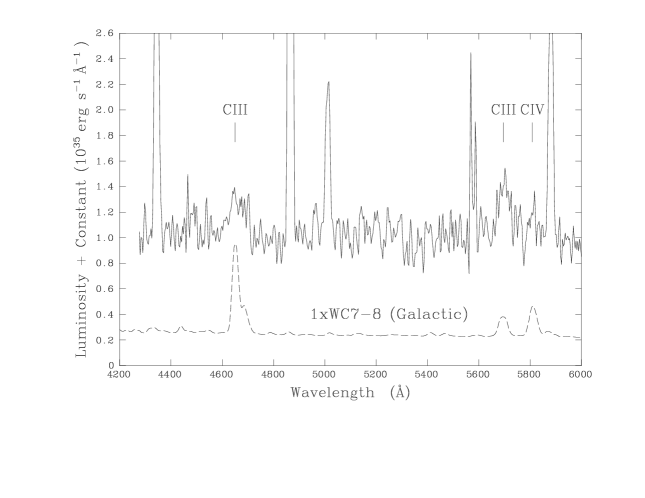
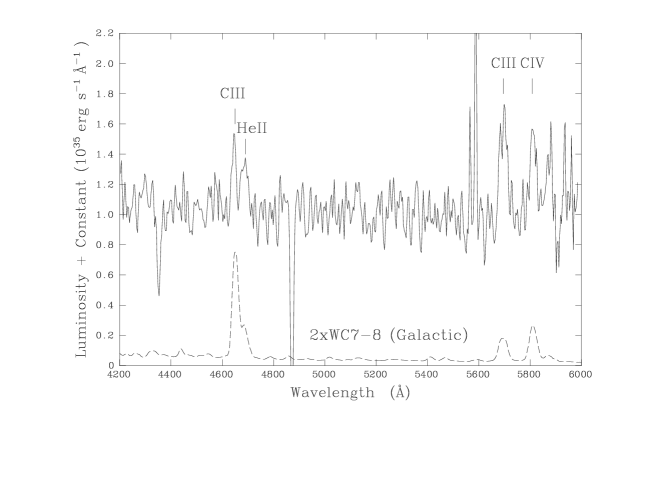
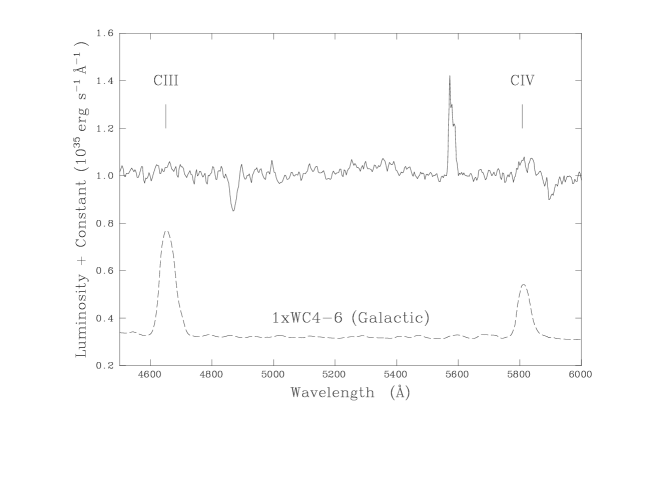
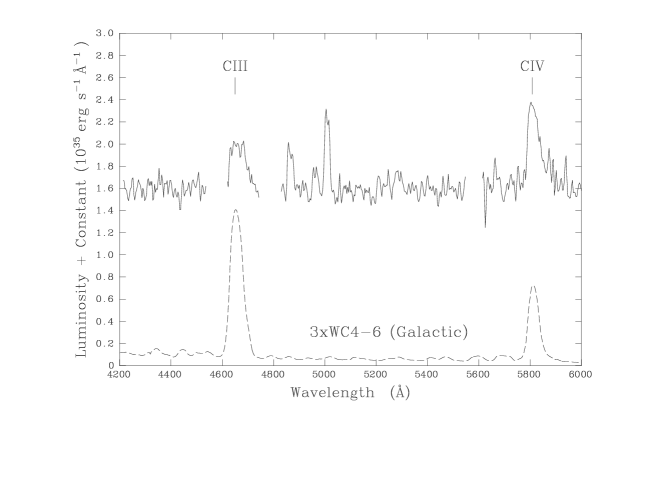
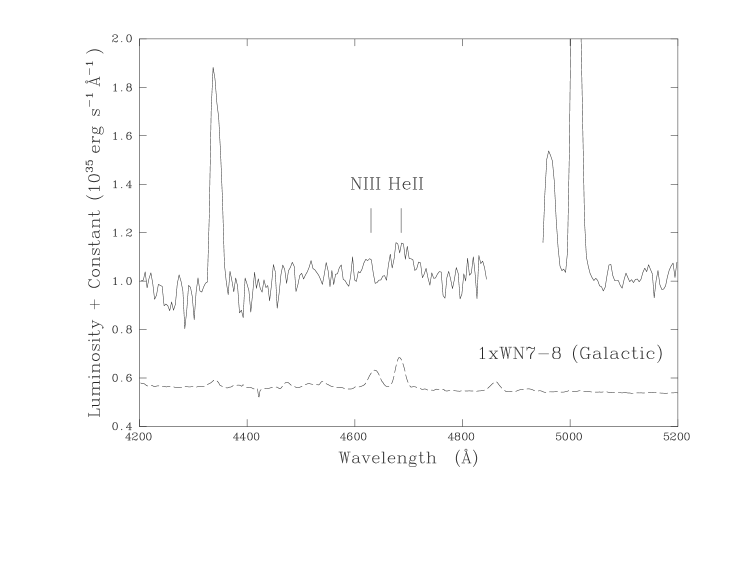
Wolf-Rayet candidates can be identified from narrow-band He ii imaging and photometry but they can only be confirmed as bonafide WR stars from spectroscopy. The photometric properties of each WR candidate presented in this paper are taken from HST imaging (see Shara et al. (2013) for details) and are presented in Table 3. Spectroscopy allows us to identify Nitrogen-rich (WN) stars predominantly from their He ii 4686 emission line while carbon-rich (WC) stars are seen to be dominated by C iii 4650 and C iv 5808. Rarer oxygen-rich (WO) stars are identified by O iv 3811-34 emission lines; however, these lines lie outside the spectral range of our observations.
We have spectroscopically confirmed 10 WR sources within M101 as indicated in Figure 2. For completeness we present more detailed finding charts in Appendix B. As for the nebular analysis we used the dipso emission line fitting routine ELF to measure the flux from the stellar source, results of which are presented in Table 4. Typical errors for the flux measurements were higher than expected at 20% for strong lines such as He ii and C iv. This is likely due to the fact that the 1 slit covers 30pc in physical size so there are more surrounding massive stars to contribute to the continuum and dilute the WR emission lines, producing a weak excess.
Previous studies use the line ratios of Smith el al. (1996) and Smith el al. (1990) to classify WN and WC subtypes, respectively along with the LMC line luminosities from Crowther & Hadfield (2006) to estimate the number of WN and WC stars within each source. However, M101 is known to be a metal-rich galaxy (Bresolin, 2007) and we consistently find our WR sources in solar and super-solar regions (see Section 4.1) so instead we use Galactic templates from observations of WR stars in Rosslowe & Crowther (2015) to estimate the number of WR stars in M101. The templates are adjusted to a Galactic distance of 1kpc and assume an average extinction for each subtype. The properties of each star used in each template are summarised in Appendix C. We note that for super-solar metallicity regions, such as #1016, the WR emission is expected to be stronger therefore the number of WR stars stated is an upper limit.
Within our 10 WR sources we have identified 11 WC stars and 4 WN stars. Figure 3 shows an example of our spectra along with the Galactic template stars whilst additional spectra are presented in Appendix D. We find mid- and late-type WN stars (Smith el al., 1996) in our M101 survey but no early-type WN stars, which is consistent with the online WR Galactic catalogue hosted by Crowther 222P.Crowther hosts an up-to-date Galactic WR catalogue at http://pacrowther.staff.shef.ac.uk/WRcat/index.php (and references therein), which shows that over 90% of the WR stars classified in the Milky Way to have subtype later than WN5. For our WC stars we see both WC4-6 and WC7-8 subtypes, indicating a trend towards later types but not as clear as for the Galactic sample. Again, small number statistics prevent any firm conclusion.
Interestingly, we see our WN stars located in regions of sub-solar metallicity between log(O/H)12 = 8.49–8.61, whereas our WC stars favour slightly more metal-rich regions of log(O/H)12 = 8.69–8.85. This is consistent with stellar evolutionary theory, which predicts that the WC/WN ratio should increase in metal-rich regions due to stronger stellar winds and enhanced stripping of the outer layers (Eldridge & Vink, 2006; Meynet & Maeder, 2005). Since our WR stars are all within the inner galaxy we are cautious not to make any direct comparisons but the presence of WN7-8 stars in the most central regions is consistent with the presence of WN9 stars in the inner regions of our own Galaxy. Obtaining spectra of additional WR candidates will allow us to test this theory further. We note that 3 of our WR sources, including the composite WNWC source, do not exhibit nebular lines in their spectra so we cannot determine their local metallicity.


4.3 Synthetic Magnitudes
As described in Section 3 we used synthetic magnitudes to determine the slit losses for each MOS mask. When comparing the magnitudes derived from the ground-based spectra we find that the synthetic He ii magnitudes are at least 1 magnitude greater than the WFC3/F469N magnitudes in all but one source. This suggests that most of our spectra have multiple stars in the slit which is unsurprising given the 0.8 versus 0.1 resolution difference. This is further highlighted in the 22 arcmin images of each source presented in Appendix A where additional sources can be seen within 1 (our GMOS slit size) of each WR candidate with the exception of source #56. Unsurprisingly, Source #56 is the only source where the WR component dominates the spectra, indicating an He ii excess of –1.16 mag. The crowding owing to the 1 slit width results in a synthetic He ii excess of a m(He ii) - m(Continuum) excess –0.15 mag for all but one source (#49). This excess is within typical errors of ground-based photometry and as such these WR stars would not have been identified as WR candidates from ground-based imaging such as that presented in Bibby & Crowther (2012).
4.4 Non Detections
In total 208 WR candidates were included in the 7 MOS mask designs. There was an error in the co-ordinate transformation from the HST imaging to the GMOS pre-imaging so one MOS mask (#7) yielded no WR spectra. In addition, we used one MOS mask (#4) to try to acquire spectra of the faintest WR stars with mF435W24 mag, however none of these 17 candidates in this mask were extracted successfully. This reduced the total number of WR candidates to 159 sources.
Out of these 19% of spectra revealed nebular lines, 11% absorption lines, 7% WR emission lines and 3% had the He ii 4686 emission line located in a chip gap. We hoped to avoid diagnostic lines falling into chip gaps by using 2 central wavelengths however the combined spectra often was not clean enough to identify a WR emission line confidently. Unfortunately the remaining spectra showed only noise or could not be extracted. On further inspection, the majority of our WR candidates had mF435W24 mag in the continuum so it is not surprising that they could not be extracted as was found with MOS mask #4.
No WR stars fainter than mF435W = 23.64 mag were detected by Gemini/GMOS and we note for future observations that this limits us to the brighter stars in M101. Moreover, the photometry presented in Table 3 indicates that the WR stars had mF435W-mF469N excesses 0.36 mag suggesting that our GMOS survey is favouring the strongest emission-line stars. Nonetheless the WR stars we have detected are strongly supportive of our identification of candidates as WR stars. We expect that a number of the objects we were unabel to detect as WR strs in these observations will ultimately be shown to be WR stars, as their luminosity function suggests. To confirm this however, more sensitive observations will be required.
| ID | RA | Dec | R/R25 | mf469N | err | mF435W | err | mF555W | err | mF814W | err | Mask # |
|---|---|---|---|---|---|---|---|---|---|---|---|---|
| 56 | 14:03:25.915 | 54:20:39.01 | 0.14 | 22.59 | 0.03 | 23.08 | 0.02 | 23.94 | 0.02 | 25.23 | 0.03 | 1 |
| 1030 | 14:03:16.533 | 54:20:44.45 | 0.04 | 22.92 | 0.11 | 23.64 | 0.46 | 24.67 | 0.05 | – | – | 1 |
| 48 | 14:03:25:286 | 54:19:17.87 | 0.18 | 22.61 | 0.03 | 23.56 | 0.03 | 24.30 | 0.03 | 25.33 | 0.05 | 1 |
| 1012 | 14:03:02.861 | 54:20:11.61 | 0.11 | 22.16 | 0.02 | 22.62 | 0.02 | 23.59 | 0.03 | 24.60 | 0.05 | 2 |
| 1016 | 14:03:04.711 | 54:19:24.14 | 0.13 | 22.40 | 0.08 | 23.20 | 0.05 | 24.12 | 0.05 | 24.68 | 0.08 | 2 |
| 49 | 14:03:23.604 | 54:19:24.71 | 0.16 | 22.43 | 0.04 | 23.49 | 0.01 | 24.33 | 0.02 | 25.65 | 0.03 | 4 |
| 112 | 14:03:24.893 | 54:19:43.16 | 0.16 | 22.18 | 0.09 | – | – | 22.71 | 0.04 | 23.96 | 0.10 | 5 |
| 114 | 14:03:29.640 | 54:22:35.91 | 0.21 | 20.70 | 0.04 | 20.24 | 0.06 | 20.60 | 0.04 | 21.68 | 0.05 | 5 |
| 1024 | 14:03:13.561 | 54:19:47.72 | 0.08 | 22.67 | 0.08 | 23.03 | 0.02 | 23.81 | 0.03 | 24.74 | 0.05 | 6 |
| 2053 | 14:03:32.816 | 54:20:07.79 | 0.22 | 24.83 | 0.10 | – | – | – | – | – | – | 6 |
| Fλ (10-16 erg s-1 cm-2) | Lλ (1036 erg s-1) | |||||||||||
|---|---|---|---|---|---|---|---|---|---|---|---|---|
| ID | R/R25 | F(N iii) | F(C iii) | F(He ii) | F(He ii) | F(C iii) | F(C iv) | E(B-V) | L(He ii) | L(C iv) | N(WN) | N(WC) |
| 4612-30 | 4650 | 4686 | 5411 | 5696 | 5808 | 4686 | 5808 | |||||
| 56 | 0.14 | – | 1.27(0.14) | 1.35(0.14) | 0.54(0.12) | – | 1.64(0.14) | 0.44 | 3.19 | 2.56 | 1WN4-6 | 2WC4-6 |
| 1030 | 0.04 | – | 1.10(0.17) | 1.22(0.23) | – | 0.92(0.26) | 0.76(0.19) | 0.44 | 2.84 | 1.23 | – | 2WC7-8 |
| 48 | 0.18 | – | – | 3.17(0.40) | – | – | – | 0.14 | 2.62 | – | 1WN4-6 | – |
| 1012 | 0.11 | – | 3.83(0.54) | 2.58(0.47) | – | – | 3.69(1.18) | 0.09 | 1.68 | 2.24 | – | 1WC4-6 |
| 1016 | 0.13 | – | 11.6(1.68) | 6.13(1.56) | – | 6.27(0.68) | 2.38(0.48) | 0.59 | 13.8 | 12.0 | – | 1WC7-8 |
| 49 | 0.16 | – | 5.07(0.27) | – | – | – | 1.88(0.12) | 0.12 | – | 1.33 | – | 3WC4-6 |
| 112 | 0.16 | – | – | 1.93(0.40) | – | – | – | 0.53 | 5.25 | – | 1WN7-8 | – |
| 114 | 0.21 | – | 1.45(0.33) | – | – | – | 1.23(0.32) | 0.44 | – | 2.49 | – | 1WC4-6 |
| 1024 | 0.08 | – | 1.86(0.30) | – | – | 1.00(0.15) | 0.24(0.11) | 0.46 | – | 0.28 | – | 1WC7-8 |
| 2053 | 0.22 | 6.3(0.11) | – | 6.59(0.16) | – | – | – | 0.98 | 90.7 | – | 1WN7-8 | – |
5 WR Stars in H ii regions
H ii regions are formed and powered by the ionising radiation produced by massive O stars. The number of O stars and amount of ionising radiation influences the size of the H ii region. Classical H ii regions contain only a handful of O stars and are typically of order 10pc in diameter. Giant H ii regions are of order 100pc in size, hosting 100 O7 v stars. However, giant H ii regions often host separate star-forming regions of different sizes and ages so there is not a direct size-luminosity correlation. Since only O stars are capable of producing such regions, one would expect O stars, WR stars and resulting core-collapse supernovae to be associated with such H ii regions. However, in the Milky Way only 27% of WR stars are seen to be associated with such regions (Crowther, 2015) which is most likely due to the fact that they are ejected or that the star-forming region is unbound so dissolves quickly (Crowther, 2013). It is also possible that the H ii region fades quicker than the average lifetime of the WR stars or that the cluster itself may still be embedded due to its young age (Gvaramadze et al., 2012); rarely these stars might also form in isolation.
In addition to investigating the association with H ii regions we can also estimate the O star population itself. We have used flux calibrated KPNO/JAG H images from Knapen et al. (2004), corrected for extinction and [N ii] contamination, to determine the H luminosity for each region. Using the relation of Kennicutt (1998) we can determine the number of ionising photons from the strength of the H emission which in turn allows us to estimate the number of O stars present, assuming 1049 photons s-1 for an O7V star (Vacca, 1994). For six of our WR sources we can compare the WR/O7V ratio as a function of metallicity to predictions from evolutionary models (such as Eldridge & Vink (2006)) but with so few points it is not possible to make any helpful comparison. Also, we do not account for the contribution of WR stars to the ionising photons (Vacca & Conti, 1992). For example, in source #49 the 3 WC stars present would be expected to contribute significantly towards the ionising flux so the WR/O = 0.75 ratio is a lower limit since the number of O stars is not required to be as high to account for the measured flux. Our full survey of M101 will allow us to investigate this in more detail.
We have identified whether a WR star is directly in, on the edge of an H ii region or is truly isolated and have identified the region from Hodge et al. (1990) and use their nomenclature in this work. Aperture photometry was performed in gaia and each aperture size was determined based on a 95% luminosity cut with background subtraction performed by using an additional aperture of the same radius on an ’empty’ region local to the H ii region. The corresponding aperture radii, luminosity measurements and resulting O star population for each source are presented in Table 5. The error on the final number of O stars is 10% which results from the choice of aperture size although this does not account for the error associated with the ionising flux from WR stars; the errors on the flux measurements themselves are of order 1%.
Seven of our 10 sources exhibit H emission in their spectra, from which we conclude that 70% of WR stars in M101 are found in H ii regions (based on small number statistics of course). On inspection of archival KPNO imaging (Knapen et al., 2004) we also conclude that 70% of WR stars are in H ii regions, however there are discrepancies between the imaging and spectroscopic data.
Source #112 is directly located in an H ii region in both archival KPNO and HST narrow-band H imaging and, as one would expect, shows nebular emission lines in its spectrum. Conversely, the spectrum of source #114 does not show nebular emission but does show stellar absorption features typical of a main-sequence A star along with WR emission lines. Ground-based KPNO imaging suggests that the source is in an H ii region, however the superior spatial resolution of HST/ACS imaging reveals that the source is actually 2 arcsec NW of the H ii region. We note that the resolution of the KPNO imaging is 2.5 arcsec.
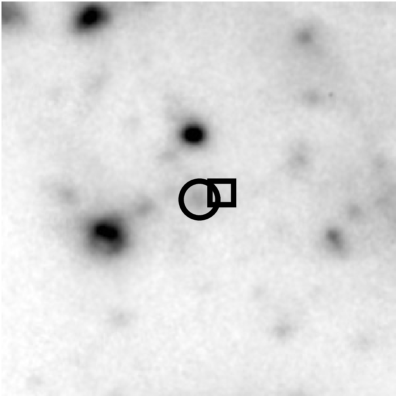
The lack of nebular emission in Source #56 is consistent with no H detection in the KPNO imaging (Figure 4). Since the spectrum of source #56 reveals the presence of both WN and WC stars it is likely that the H ii region is beyond the detection limits of the KPNO imaging. In addition, archival HST F658N imaging does not reveal the presence of an H ii region, suggesting that the gas from the star cluster has been expelled. The projected distance of Source #56 from the closest cluster is 150 pc which is consistent with the distance a runaway WR star can travel in its lifetime (Eldridge, Langer, Tout, 2011). The presence of multiple WR stars in the GMOS spectrum makes this scenario unlikely.
The spectrum of Source #1030 has a chip gap at the location of the H6563 emission, but the star but is located on the edge of an H ii region in the KPNO image, which the HST imaging reveals to be a stream connecting two H ii regions. The most likely explanation is that the spatially extended H emission is too weak to be detected in the GMOS spectra. Interestingly, source #48 does show H emission in its spectrum, however the KPNO imaging does not reveal any H ii region. This would suggest that there is a faint, underlying H ii region beyond the detection limits of the KPNO data which is confirmed to be the case from archival HST F658N imaging.
In addition to #112, a further three of our WR sources, #1012, 1016, and 1024 present a nebular spectrum and are located in H ii regions seen in both KPNO and HST imaging. Although sources #49 and #2053 exhibit H emission in the GMOS spectroscopy and KPNO imaging the resolution of HST reveals that they are in fact on the edge of the H ii region, suggesting that the spectroscopic detection is of the H ii region itself. The location of each WR source relative to the H emission is presented in Appendix A.
In summary, from KPNO H imaging we conclude that 70% of WR stars in our sample are in H ii regions, 10% are associated with H ii regions and 20% are not associated with H ii regions. However, from the improved spatial resolution of HST our conclusions are 50% in, 40% associated with and 10% not in H ii regions. The high fraction of WR stars being associated with H ii regions is not consistent with the low fraction (27%) of WR stars associated with star-forming regions presented by Crowther (2015). Whilst we do not claim these results to be statistically robust due to small number statistics, the difference between the conclusions based on the two sets of imaging, particularly between those directly in or on the edge of a H ii region, demonstrates how the spatial resolution and sensitivity of imaging can lead to different interpretations of stellar environment. Moreover, the spectroscopic results presented here are limited to the brighter WR stars which are more likely to be found in bright H ii regions. We expect a full spectroscopic survey including the fainter WR candidates to reduce the fraction of WR stars seen in H ii regions.
| WR | Hodge | RA1 | Dec1 | Radius | F(H[N ii]) | E(B-V) | [N ii]/ | L(H) | log Q0 | N(O7 v) | N(WR)/ | Spectra | KPNO | HST |
| ID | ID | (h:m:s) | (∘:’:”) | (arcsec) | (erg s-1 cm-2) | H | (erg s-1) | (s -1) | N(O7 v) | |||||
| 56 | No | No | No | |||||||||||
| 1030 | 733 | 14:03:10.786 | 54:20:18.34 | 3.32 | 4.2910-14 | 0.44 | 0.54 | 3.711038 | 50.44 | 28 | 0.07 | No | Edge | Edge |
| 48 | Yes | No | Yes | |||||||||||
| 1012 | 470 | 14:03:07.184 | 54:22:21.02 | 4.22 | 7.6910-14 | 0.09 | 0.35 | 3.791038 | 50.17 | 15 | 0.14 | Yes | Yes | Yes |
| 1016 | 505,507 | 14:03:01.800 | 54:22:03.87 | 6.27 | 3.0810-13 | 0.59 | 0.63 | 3.391039 | 51.40 | 250 | 0.004 | Yes | Yes | Yes |
| 49 | 872 | 14:03:02.108 | 54:19:16.07 | 2.34 | 5.1110-15 | 0.12 | 0.67 | 5.371037 | 49.60 | 4 | 0.75 | Yes | Yes | Edge |
| 112 | 901 | 14:03:04.219 | 54:19:05.39 | 3.86 | 7.4910-14 | 0.53 | 0.30 | 1.301039 | 50.98 | 96 | 0.01 | Yes | Yes | Yes |
| 114 | 998 | 14:03:23.969 | 54:18:24.57 | 3.37 | 5.5610-14 | 0.44 | 0.54 | 1.931039 | 51.16 | 145 | 0.007 | No | Yes | Edge |
| 1024 | 671 | 14:03:04.531 | 54:20:45.32 | 2.90 | 1.6310-14 | 0.46 | 0.22 | 2.391038 | 50.25 | 18 | 0.06 | Yes | Yes | Yes |
| 2053 | 1044 | 14:03:07.460 | 54:17:55.79 | 6.87 | 3.8810-13 | 0.98 | 0.14 | 3.281040 | 52.39 | 2454 | 0.0004 | Yes | Yes | Edge |
| 1Co-ordinates of the H ii region are taken from the KPNO H image in Knapen et al. (2004) | ||||||||||||||
6 Summary
We spectrographically confirmed the detection of 15 WR stars within 10 He ii emission sources in M101. From comparison with Galactic templates we conclude that these regions host 4 WN and 11 WC stars, indicating that our detections are biased towards WC stars. This is not surprising given the higher He ii excess for WC stars compared to WN stars. Moreover, all of our regions are metal-rich so we expect a WC/WN ratio 1 based on the evolutionary models from Eldridge & Vink (2006), which is consistent with our findings though our sample is limited by small number statistics.
We see no distinctive division between the locations of WC and WN stars, though again, our sample is small. The successful detection of both WC and WN stars demonstrates that our imaging technique is sensitive to both, including the coolest WC and WN stars, WC7-8 and WN7-8, respectively.
The main challenge to spectroscopically confirming WR stars in M101 is the required line to continuum contrast, since the He ii excess, or line-to-continuum ratio, is our primary diagnostic for identifying WR candidates. This can be hindered by intrinsically weak WR emission (e.g. in low metallicity environments) hence high S/N observations are required in future to confirm these candidates as bonafide WR stars. A companion star or surrounding massive stars within the same slit will also increase the continuum and dilute the WR emission line making the confirmation of a WR more difficult; high resolution observations are required to overcome this as well as careful mapping of sources from HST imaging to ground-based spectra.
Acknowledgments
This research is based on spectroscopic observations obtained at the Gemini Observatory, which is operated by the Association of Universities for Research in Astronomy, Inc., under a cooperative agreement with the NSF on behalf of the Gemini partnership: the National Science Foundation (United States), the National Research Council (Canada), CONICYT (Chile), the Australian Research Council (Australia), Ministério da Ciência, Tecnologia e Inovação (Brazil) and Ministerio de Ciencia, Tecnología e Innovación Productiva (Argentina). Photometric results presented here are based on NASA/ESA Hubble Space Telescope observations obtained at the Space Telescope Science Institute, which is operated by the Association of Universities for Research in Astronomy Inc. under NASA contract NAS5-26555. JLB, MMS and MW acknowledge the interest and generous support of Hilary and Ethel Lipsitz. AFJM is grateful to NSERC (Canada) and FQRNT (Quebec) for financial assistance.
References
- Anderson et al. (2012) Anderson, J. P., Habergham, S.M., James, P.A, & Hamuy, M. 2012, MNRAS, 424, 1372
- Anderson et al. (2010) Anderson, J. P., Covarrubias, R.A., James, P.A., Hamuy, M., Habergham, S.M., 2010, MNRAS, 407, 2660
- Bibby & Crowther (2010) Bibby, J.L., & Crowther, P.A. 2010, MNRAS, 405, 2737
- Bibby & Crowther (2012) Bibby, J.L., & Crowther, P.A. 2012, MNRAS, 420, 3483
- Bresolin (2007) Bresolin, F. 2007, ApJ, 656, 186
- Cao et al. (2013) Cao, Y., Kasliwal, M.M., Arcavi, I., Horesh, A., Hancock, P., Valenti, S., Cenko, S.B., Kulkarni, S.R., et al. 2013, AJ, 775, L7
- Cedrés & Cepa (2002) Cedrés, B., & Cepa, J. 2002, A&A, 391, 809
- Cedrés, Urbaneja & Cepa (2004) Cedrés, B., Urbaneja, M.A., & Cepa, J. 2004, A&A, 422, 514
- Chomiuk & Povich (2011) Chomiuk, L., & Povich, M. S. 2011, AJ, 142, 197
- Conti & Vacca (1990) Conti, P.S., & Vacca, W.D. 1990, AJ, 100, 431
- Crockett et al. (2007) Crockett, R.M., Smartt, S.J., Eldridge, J.J., Mattila, S., Young, D.R., Pastorello, A., Maund, J.R., Benn, C.R., & Skillen, I. 2007, MNRAS, 381, 835
- Crowther & Hadfield (2006) Crowther, P. A., & Hadfield, L. J. 2006, A&A, 449, 711
- Crowther et al. (2010) Crowther, P. A., Barnard, R., Carpano, S., et al. 2010, MNRAS, 403, L41
- Crowther (2013) Crowther, P. A. 2013, MNRAS, 428, 1927
- Crowther (2015) Crowther, P. A. 2015, Proceedings of an International Workshop help in Potsdam, Edited by W.R. Hamann, A. Sander & H. Todt.
- Drissen et al. (1999) Drissen, L., Roy, J.-R., Moffat, A. F. J., & Shara M.M. 1999, AJ, 117, 1249
- Eldridge & Vink (2006) Eldridge, J. J., Vink, J.S. 2006, A&A, 452, 295
- Eldridge, Langer, Tout (2011) Eldridge, J. J., Langer, N., & Tout, C.A. 2011, MNRAS, 414, 3501
- Eldridge et al. (2013) Eldridge, J. J., Fraser, M., Smartt, S.J., Maund, J.R., & Crockett, M.R., Submitted to MNRAS, arXiv:1301.1975
- Fruchter et al. (2006) Fruchter, A. S., Levan, A. J., Strolger, L., Vreeswikj, P.M., Thorsett, S.E., Bersier, D., Burud, I., Castro Cron, J.M., et al., 2006, Nature, 441, 463
- Galama et al. (1998) Galama, T.J., Vreeswijk, P.M., van Paradijs, J., Kouveliotou, C., Augusteijn, T., Bhnhardt, H., Brewer, J.P., Doublier, V., et al. 1998, Nature, 395, 670
- Gies et al. (2003) Gies, D.R., Bolton, C.T., Thomson, J.R., Huang, W., McSwain, M.V., Riddle, R.L., Wang, Z., Wiita, P.J., et al. 2003, ApJ, 583, 424
- Groh et al. (2013) Groh, J.H., Georgy, C., & Ekström, S. 2013, A&A, 558, L1
- Gvaramadze et al. (2012) Gvaramadze, V.V., Weidner, C., Kroupa, P., & Pflamm-AAltenburg, J. 2012, MNRAS, 424, 3037
- Hadfield et al. (2005) Hadfield, L. J., Crowther, P. A., Schild, H., & Schmutz, W. 2005, A&A, 439, 265
- Hodge et al. (1990) Hodge, P.W., Gurwell, M., Goldader, J.D., & Kennicutt, R.C.Jr, 1990, ApJS, 73, 661
- Howarth et al. (2004) Howarth, I.D., Murray, J., Mills, D., & Berry, D.S., 2004, Starlink User Note 50, Starlink Project
- Jarrett et al. (2013) Jarrett, T. H., Masci, F., Tsai, C. W., Petty, S., Cluver, M. E., Assef, R. J., Benford, D., Blain, A., et al. 2013, AJ, 145, 6
- Karamehmetoglu et al. (2017) Karamehmetoglu, E., Taddia, F., Sollerman, J, Wyrzykowski, L., Schmidl, S., Fraser, M., Fremling, et al., 2017, arXiv:1703.08222
- Kelly et al. (2008) Kelly, P. L., Kirshner, R. P., & Pahre, M. 2008, ApJ, 687, 1201
- Kenney et al. (1991) Kenney, J.D.P. & Lord, S.D., 1991, ApJ, 381, 118
- Kennicutt (1984) Kennicutt, R. C., Jr., 1984, ApJ, 287, 116
- Kennicutt (1998) Kennicutt, R. C., Jr., 1998, ARA&A, 36, 189
- Kennicutt et al. (2008) Kennicutt, R. C., Jr., Lee, J.C., Funes, S.J., José , G., Sakai, S., & Akiyama, S., 2008, ApJS, 178, 247
- Knapen et al. (2004) Knapen, J.H., Stedman, S., Bramich, D.M., Folkes, S.F., & Bradley, T.R., 2004, A&A, 426, 1135
- Lee et al. (2009) Lee, J.C., et al., 2009, ApJ, 706, 599
- Leitherer (1997) Leitherer, C. 1997, Revista Mexicana de Astronomia y Astrofisica Conference Series, 6, 114
- Leloudas et al. (2011) Leloudas, G., Gallazzi, A., Sollerman, J., Strizinger, M.D., Fynbo, J.P.U., Hjorth, J., Malasani, D., et al., 2011, A&A, 530, 95
- Leloudas et al. (2010) Leloudas, G., Sollerman, J., Levan, A. J., et al. 2010, A&A, 518, A29
- Levesque et al. (2010) Levesque, E.M., Kewley, L.J., Graham, J.F., Fruchter, A.S. 2010, ApJ, 712, 26
- Liu et al. (2013) Liu, J., Bregman, J.N., Bai, Y., Justham, S. & Crowther, P.A. 2013, Nature, 503, 500
- Meynet & Maeder (2005) Meynet G., Maeder A., A&A, 429, 581
- Martins, Schaerer & Hillier (2005) Martins, F., Schaerer, D., & Hillier, D.J., 2005, A&A, 436, 1049
- Massey & Johnson (1998) Massey, P., & Johnson, O. 1998, ApJ, 505, 793
- Mattila et al. (2010) Mattila, S., Smartt, S.J., Maund, J., Benetti, S., & Ergon, M. 2010, arXiv, 1011.5494
- Modjaz et al. (2011) Modjaz, M., Kewley, L., Bloom, J.S., Filippenko, A.V., Perley, D., Silverman, J.M. 2011, ApJ, 731, 4
- Modjaz et al. (2008) Modjaz, M., Kewley, L., Kirshner, R.P., Stanek, K.Z., Challis, P., Garnavich, P.M., Greene, J.E., Kelly, P.L., Prieto, J.L. 2008, AJ, 135, 1136
- Moffat & Shara (1983) Moffat, A..J., & Shara, M.M. 1983, ApJ, 273, 544
- Neugent & Massey (2011) Neugent, K. F., & Massey, P. 2011, ApJ, 733, 123
- Oke (1990) Oke, J. B. 1990, AJ, 99, 1621
- Orosz et al. (2007) Orosz, J.A., McClintock, J.E., Narayan, R., Bailyn, C.D., Hartman, J.D., Macri, L., Liu, J., et al. 2007, Nature, 449, 872
- Osterbrock & Ferland, (2006) Osterbrock, D.E., & Ferland, G.J., 2006, “Astrophysics of gaseous nebulae and active galactic nuclei”, 2nd. ed. Sausalito, CA: University Science Books
- Pettini & Pagel, (2004) Pettini, M., & Pagel, B.E.J., 2004, MNRAS, 348, L59
- Pilyugin & Thuan, (2005) Pilyugin, L.S., & Thuan, T.X., 2005, ApJ, 631, 231
- Prestwich et al. (2007) Prestwich, A.H., Kilgard, R., Crowther, P.A., Carpano, S., Pollock, A.M.T., Zezas, A., Saar, S.H., Roberts, T.P., Ward, M.J, ApJ, 669, 21
- Rosa & Benvenuti (1994) Rosa, M.R. & 291, 1
- Rosslowe & Crowther (2015) Rosslowe, C. K., & Crowther, P. A. 2015, MNRAS, 447, 2322
- Shappee & Stanek (2011) Shappee, B. J. & Stanek, K. Z. 2011, ApJ, 733, 124
- Shara et al. (2013) Shara, M. M., Bibby, J. L., Zurek, D., Crowther, P. A., Moffat, A. F. J., Drissen, L., 2013, AJ, 146, 162
- Shortridge et al. (2004) Shortridge, K., Meyerdierks, H., Currie, M., Clayton, C., Lockley, J., Charles, A., Davenhall, C., Taylor, M., et al. 2004, Starlink User Note 86, Starlink Project
- Silverman & Filippenko (2008) Silverman, J.M., & Filippenko, A.V., ApJ, 678, 17
- Smartt (2009) Smartt, S.J. 2009, ARA&A, 47, 63
- Smith el al. (1990) Smith, L.F., Shara, M.M., & Moffat, A.F.J., 1990, ApJ, 358, 229
- Smith el al. (1996) Smith, L.F., Shara, M.M., & Moffat, A.F.J., 1996, MNRAS, 281, 163
- Smith et al. (2011) Smith, N., Li, W., Filippenko, A., Chornock, R. 2011, MNRAS, 412, 1522
- Stanek et al. (2006) Stanek, K.Z., Gnedin, O.Y., Beacom, J.F., Gould, A.P., Johnson, J.A., Kollmeier, J.A., Modjaz, M., Pinsonneault, M.H., et al., 2006, Acta Astronomica, 56, 333
- Vacca (1994) Vacca, W. D. ApJ, 421, 140
- Vacca & Conti (1992) Vacca, W. D., & Conti, P. S., 1992, ApJ, 401, 543
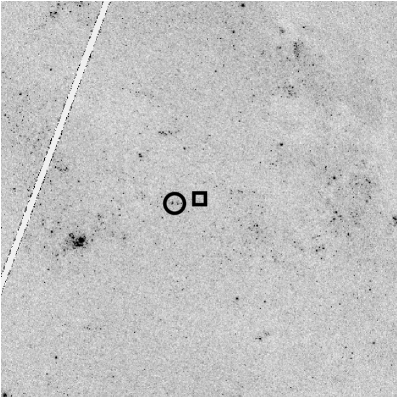
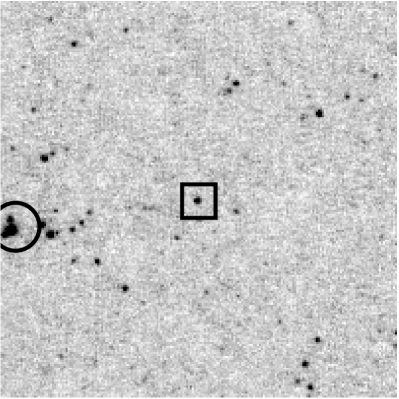
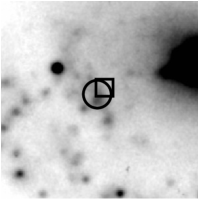
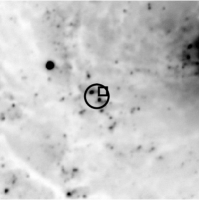
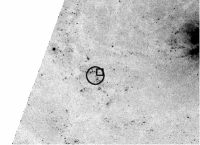
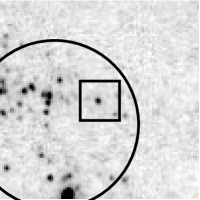
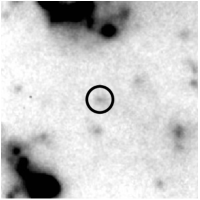
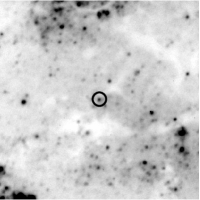
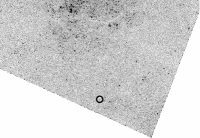
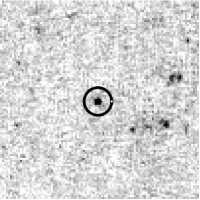
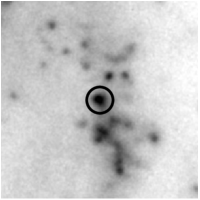
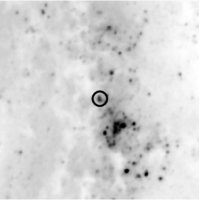
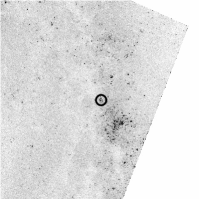
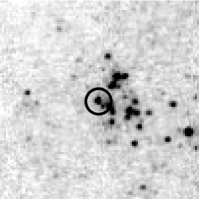
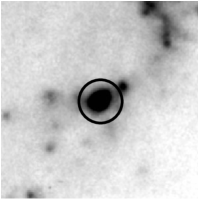
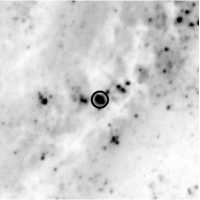
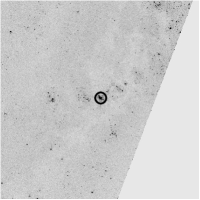
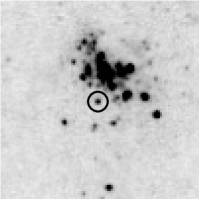
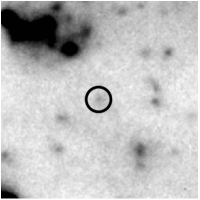
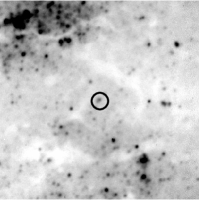
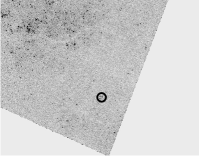
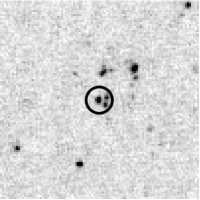
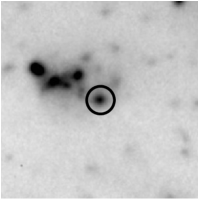
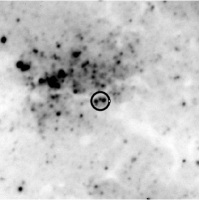
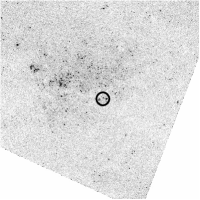
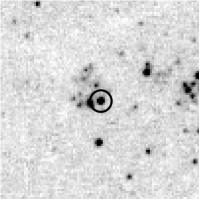
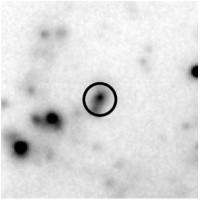
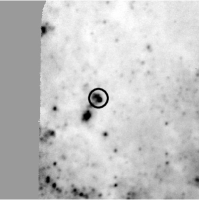
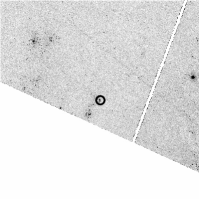
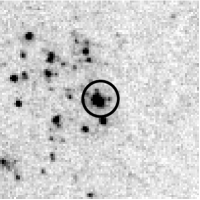
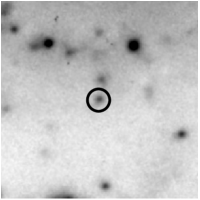
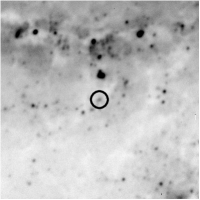
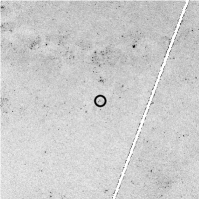
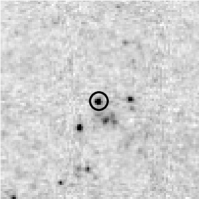
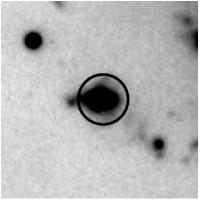
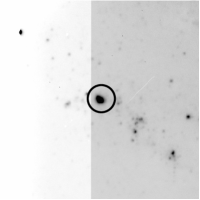
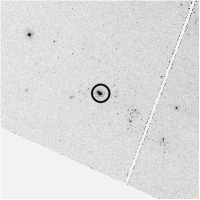
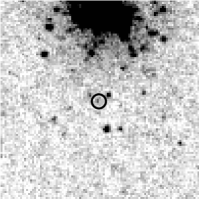
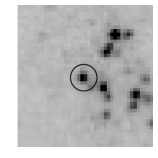
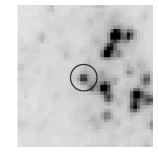
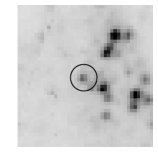
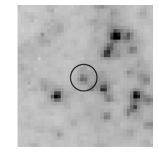
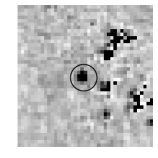
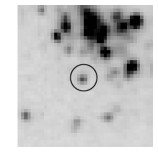
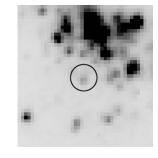
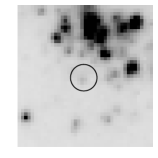
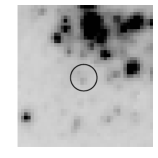
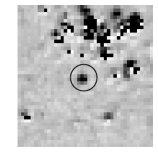
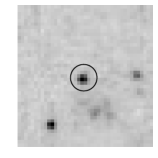
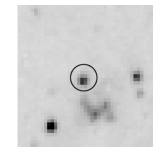
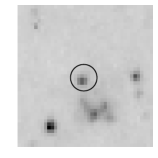
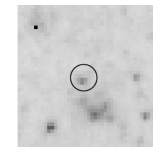
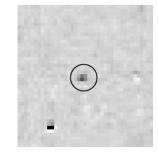
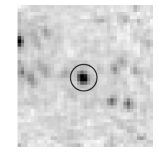
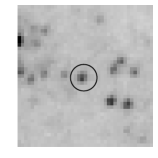
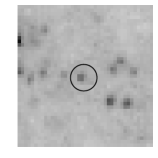
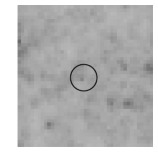
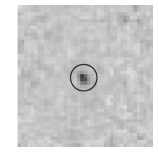
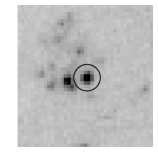
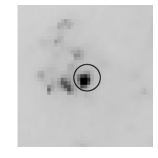
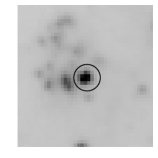
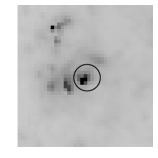
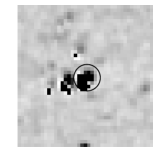
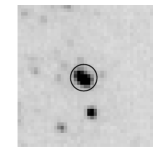
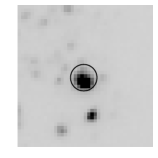
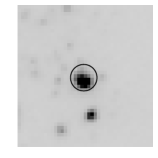
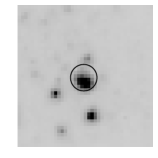
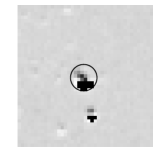
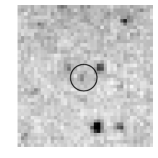
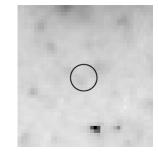
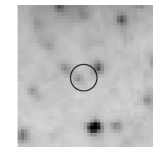
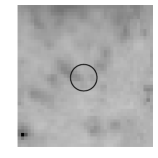
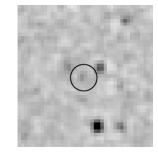
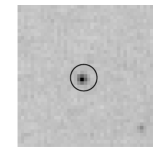
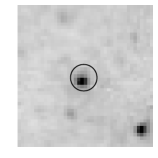
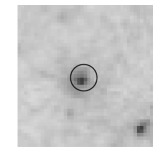
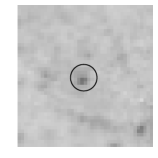
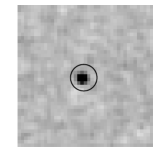
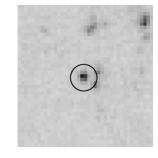
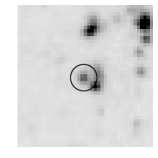
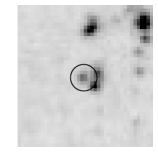
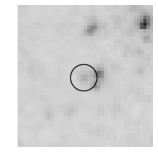
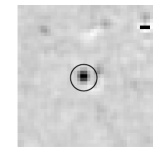
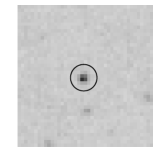
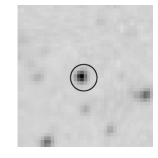
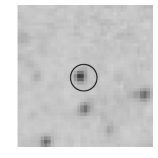
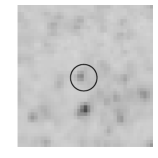
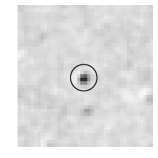
Appendix A Location of WR sources in relation to H ii regions
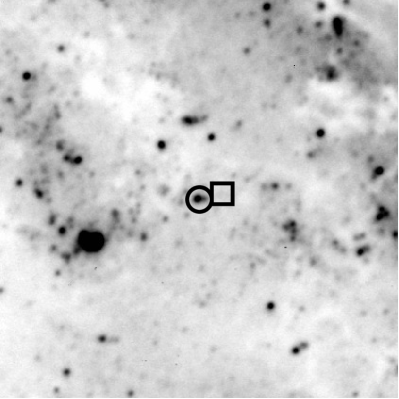
Postage stamp images of 1 arcmin showing the location of the H ii region closest to the WR source. Circles indicate the location of the H ii region in (a) - (c) and of the WR star in (d). Where the WR star is located outside the H ii region a square has been used to identify it’s location.
Appendix B Finding Charts for WR stars
This appendix contains 22 arcmin stamps of each WR star in the a) F469N, b) F435W, c) F555W, d) F814W and e) continuum subtracted F469N filters.
Appendix C Data for Galactic Flux Templates
| ID | Subtype | Distance (kpc) | E(B-V) |
| WN4-6 template | |||
| WR1 | WN4b | 2.3 | 1.09 |
| WR6 | WN4b | 1.8 | 0.17 |
| WR7 | WN4b | 5.5 | 0.69 |
| WR18 | WN4b | 2.3 | 0.91 |
| WR134 | WN6b | 1.9 | 0.50 |
| WR136 | WN6b | 1.3 | 0.59 |
| WN7-8 template | |||
| WR12 | WN7 | 4.2 | 0.72 |
| WR66 | WN8 | 3.6 | 1.12 |
| WC4-6 | |||
| WR144 | WC4 | 1.4 | 2.65 |
| WR111 | WC5 | 1.9 | 0.34 |
| WR114 | WC5 | 2.05 | 1.45 |
| WR23 | WC6 | 2.3 | 0.42 |
| WR154 | WC6 | 3.5 | 0.78 |
| WC7-8 template | |||
| WR14 | WC7 | 2.2 | 0.57 |
| WR68 | WC7 | 3.6 | 1.55 |
| WR135 | WC8 | 1.9 | 0.28 |
| WR53 | WC8d | 4.2 | 0.58 |
Appendix D Spectra for each WR source.
This appendix contains the flux calibrated Gemini/GMOS spectra of each WR source. Also shown is the best fitting Galactic WR template spectra from Rosslowe & Crowther (2015).