Arpit Gupta, Rob Harrison, Ankita Pawar, Rüdiger Birkner,
Marco Canini, Nick Feamster, Jennifer Rexford, Walter Willinger
Princeton University Unaffiliated ETH Zürich KAUST NIKSUN Inc.
Sonata: Query-Driven Network Telemetry
Abstract
Operating networks depends on collecting and analyzing measurement data. Current technologies do not make it easy to do so, typically because they separate data collection (e.g., packet capture or flow monitoring) from analysis, producing either too much data to answer a general question, or too little data to answer a detailed question. In this paper, we present Sonata, a network telemetry system that uses a uniform query interface to drive the joint collection and analysis of network traffic. Sonata takes advantage of two emerging technologies—streaming analytics platforms and programmable network devices—to facilitate joint collection and analysis. Sonata allows operators to more directly express network traffic analysis tasks in terms of a high-level language. The underlying runtime Sonata partitions each query into a portion that runs in the switch and another that runs on the streaming analytics platform, iteratively refines the query to efficiently capture only the traffic that pertains to the operator’s query, and exploits sketches to reduce state in switches in exchange for more approximate results. Through an evaluation of a prototype implementation, we demonstrate that Sonata can support a wide range of network telemetry tasks with less state in the network, and lower data rates to streaming analytics systems, than current approaches can achieve.
1 Introduction
Network operators routinely perform a variety of measurement tasks, such as diagnosing performance problems, detecting network attacks, and performing traffic engineering. These tasks require collecting and analyzing measurement data—often in real time—through a process called network telemetry NT-ietf16 . Historically, this process has involved a distinct separation between collection and analysis of network measurements, leading to data that is often too coarse or too fine-grained to support a particular query or task. For example, when analyzing the performance of streaming video traffic across a backbone link or interconnection point, an operator typically has to cope with coarse-grained flow records, as opposed to detailed, packet-level information that could provide insight about delays and loss. Similarly, detecting an intrusion or denial-of-service attack may require analysis of packet payloads, which also may be difficult to execute at high traffic rates.
The first problem with current approaches is that analysis ordinarily only begins after the data have been collected. Typically, an operator has a question pertaining to some operational task and must make do with a warehouse of packet-level or flow-level data that has already been collected. The data is thus not well-suited to the query, and collection cannot adapt in response to an operator’s desire to refine a query. The second problem is that the collection of the measurements themselves are constrained by the (relatively limited) capabilities of current switch hardware, which generally support static (and often coarse) data collection such as packet sampling and simple counting.
In this paper, we argue that queries about network traffic should drive both the collection and analysis of network measurements. Some existing systems gigascope ; kentik ; deepfield grapple with the challenge of joint collection and analysis, but supporting a general query interface efficiently and accurately on networks of high-speed switches remains an unsolved problem. Towards this goal, we present a packet-level telemetry system called Sonata (Streaming Network Traffic Analysis). Sonata exposes a query interface with a familiar programming paradigm using dataflow operators over the raw packet stream; the underlying runtime then compiles the query to functions that operate on the switches, which in turn pass a subset of traffic statistics to a scalable stream processor. Sonata offers three new features:
-
•
Uniform programming abstraction. (Section 3) Rather than relying on custom code for different kinds of measurement data, Sonata supports a wide range of queries with a single, familiar programming abstraction: dataflow operators over packet tuples, capitalizing on scalable stream processing architectures (e.g., Flink, Spark Streaming, Tigon) flink ; spark ; tigon .
-
•
Query-driven data reduction with programmable switches. (Section 4) Sonata exploits the emergence of programmable network devices rmt ; p4-xilinx ; barefoot-blog ; p4-netronome that can be programmed via a domain-specific language like P4 P4 . These devices support operations such as filtering, sampling, aggregation, and sketching at line rate to reduce the amount of data that the stream processor must handle.
-
•
Coordinated data collection and analysis. (Section 5) Sonata analyzes each query to coordinate the collection and analysis of the traffic. This creates significant gains in scalability, since the traffic that pertains to any given measurement task is generally a minute fraction of the overall traffic.
Yet, simply juxtaposing a stream processing system with programmable network devices is not, by itself, a viable solution. Coupling these capabilities requires solving challenging design problems, such as: determining which parts of the query should run on the switches and which should run on the stream processor (query partitioning), how to compute accurate estimates using limited-state (sketches), and how and when to modify a query to zero-in on more fine-grained subsets of the traffic (iterative refinement). These three processes introduce tradeoffs between the resources at switches (e.g., state) and the stream processor (e.g., bandwidth and computation) to execute the query and the latency to satisfy the query and the accuracy of the result. These tradeoffs depend on the workload, such as the number of ongoing flows or the fraction of packets with certain properties; thus, Sonata learns an efficient query plan by solving an optimization problem that minimizes a weighted objective function based on historical traffic patterns.
We use realistic network telemetry tasks over different real-world workloads, to demonstrate that coordinated data collection and analysis help scale query executions. Compared to state-of-the-art solutions that rely on the data plane for filtering and sampling only, Sonata reduces the load on the stream processor by more than a factor of four. Compared to solutions that exploit sketches to reduce state in the data plane without coordinating with stream processors, Sonata reduces the amount of state required by more than a factor of two.
2 Current Network Telemetry Approaches
We review the state of the art in network telemetry. Whereas Sonata uses queries to jointly perform data collection and analysis, existing network monitoring systems primarily tackle either collection or analysis, with analysis typically occurring only after collection. This section surveys the state of the art in collection and analysis separately.
2.1 Traffic Collection
Network traffic collection and monitoring falls into two classes: packet-level monitoring (sometimes referred to as “deep packet inspection”) and flow-level monitoring.
Packet monitoring Packet-level monitoring can be performed with software libraries such as libpcap, or in hardware, using devices such as the Eagle 10 or Endace capture cards endance . Commonly, collection infrastructure is deployed on a switch span port, which mirrors traffic going through the switch. A device connected to the span port—typically a server—captures and stores the mirrored traffic. The collection infrastructure can be configured with filters that can specify conditions for capturing traffic; configuration can also determine whether complete packet payloads are captured, or simply an excerpt of the packet, such as packet headers. Packet-level monitoring can provide precise information for calculating statistics like the instantaneous bitrate, packet loss, or round-trip latency experienced by individual flows. Access to packet payloads can also be useful for a variety of purposes, such as determining whether any given packet carries a malicious payload.
Unfortunately, packet-level monitoring has significant drawbacks, due to the high overhead of collection, storage, and analysis. The sheer volume of network traffic makes it prohibitive to capture every packet. Even if the infrastructure could capture every packet, operators face daunting storage and analysis hurdles associated with storing a complete log of all network traffic. As such, despite the rich possibilities that packet-level traffic capture offer, many networks do not deploy this type of infrastructure on a widespread basis. For example, recent figures from a large access ISP have indicated that deep-packet inspection capabilities are deployed for less than 10% of the network capacity. This sparse deployment makes it essentially prohibitive to generally perform the types of queries involving network performance or security that could benefit from packet-level statistics.
Flow monitoring An alternative to packet-level monitoring is flow-level monitoring—standardized in the Internet Engineering Task Force (IETF) as IPFIX, and commonly referred to by the Cisco “NetFlow” moniker. IPFIX permits each switch to collect flow-level statistics that contain coarse-grained information such as the number of packets and bytes for a particular flow (e.g., as defined by the source and destination IP address, source and destination port, and protocol), as well as the start and end time of the flow. This type of information is often gathered in a “sampled” fashion: on average, one out of every packets is tabulated in an IPFIX flow record; typical sampling rates for an ISP backbone network can be in the 1,000 10,000 range, meaning that low-volume flows may often not be captured at all. Additionally, IPFIX records do not contain detailed information about flows, such as packet loss rates or packet timings, let alone packet payload information.
Both packet-level and flow-level monitoring systems can, of course, be tailored to capture specific subsets of traffic. Packet-level monitoring can be customized with filters that focus on specific subsets of traffic, and flow-level monitoring can be tuned so that sampling rates are higher for specific links of interest. The advent of programmable data planes has also enabled programmatic collection of individual data flows bigtap ; univmon ; opensketch ; everflow ; pathdump ; narayana2016codesign ; fb-p4 . Yet, these tools either support limited sets of queries that can only operate over fixed packet headers (e.g., UnivMon univmon and OpenSketch opensketch ) or require custom tools to analyze one specific type of data (e.g., BigTap bigtap and PLT fb-p4 ) precluding any analysis that requires fusing multiple data streams.
Furthermore, the level of flexibility that all of these systems offers is limited, in the sense that (1) in general, their configurations remain static; (2) decisions about capturing more fine-grained information are completely decoupled from the queries or analysis, which occurs post facto. In short, because the monitoring process is decoupled from analysis, all of these decisions must be made far in advance of analysis, often resulting in traffic collection that is either too sparse or too voluminous.
| Query | Description |
|---|---|
| Queries that process packet header fields | |
| Heavy Hitter Detection mina-snap ; univmon ; opensketch | Identify flows consuming more than a threshold Th of link capacity. |
| Superspreader Detection mina-snap ; univmon ; opensketch | Identify hosts that contacts more than Th unique destinations. |
| Port Scan Detection minds | Identify hosts that send traffic over more that Th destination ports. |
| SSH Brute Force Detection | Identify hosts receive similar-sized packets from more than Th unique senders. |
| Queries that process packet’s payload | |
| DNS TTL Change Tracking mina-snap ; exposure ; chimera | Identify hosts for which their domain’s TTL value changes more than Th times. |
| IP-2-Domain Anomaly mina-snap ; exposure ; chimera | Identify hosts that are shared by more Th domains. |
| Domain-2-IP Anomaly mina-snap ; exposure ; chimera | Identify domains that are advertised by more Th hosts. |
| Sidejacking mina-snap ; exposure ; chimera | Identify HTTP session cookies that are used by more than one hosts. |
| Queries that process packet’s context fields | |
| Loop Freedom Detection pathdump ; pathquery ; everflow ; fb-p4 | Detect forwarding loops. |
| Congested Link Detection pathdump ; everflow ; fb-p4 | Identify flows that traverse congested links. |
| Silent Packet Drop/ Blackhole Detection pathdump ; everflow ; fb-p4 | Identify switches that drop packets. |
| Path Conformance Detection pathdump | Identify flows that violate path constraints, such as maximum path length. |
2.2 Traffic Analysis
Given the ability to perform packet or flow monitoring on network traffic, network operators can use systems such as Deepfield deepfield , Kentic kentik , or Velocidata velocidata to support network analysis in support of network performance or security. For example, Deepfield Singularity performs joint analysis of packet captures and IPFIX records to help network operators understand questions such as the relationship between traffic overload and application performance, as well as detect network attacks such as distributed denial of service attacks. For example, analyzing the average bitrate of Netflix streams traversing the network requires: (1) capturing the DNS queries (and responses) for DNS domains corresponding to Netflix streams; (2) joining the resulting IP addresses to the corresponding traffic data (e.g., either IPFIX or packet capture) that can provide information about the rates that individual flows are seeing. Another example might be the detection of a DNS reflection and amplification attack, which involve compromised hosts sending large volumes of DNS queries with the spoofed source IP address of the victim. Detecting such attacks often involves detecting an abnormally high number of DNS queries from an IP address (in this case, the IP address of the victim), typically for DNS query types that elicit large responses (e.g., TXT, RRSIG); alternatively, one could look for an abnormally large number of such responses destined for a given IP address.
Although existing technologies developed by Deepfield and Kentik support certain aspects of this type of analysis, they do not use the query itself to drive collection of the traffic data, which often results in collecting, storing and analyzing large volumes of data that do not pertain to the specific queries. Specifically, these analysis tools rely on separate collection of DNS data (with packet monitoring) and traffic utilization information (e.g., with IPFIX), which the analysis tools subsequently joint post hoc. This approach to analysis also requires capturing a large amount of traffic that is not relevant to the analysis, which increases the overhead of the analysis, both in terms of the volume of data and the computation time. Furthermore, because IPFIX data is often based on sampled traffic traces with high sampling rates, many DNS queries and responses will not be captured in the IPFIX data at all, severely compromising accuracy. Finally, the post hoc nature of existing analysis tools also precludes real-time detection, since all data is collected and warehoused for subsequent joint analysis.
3 Uniform Programming Abstraction
In this section, we first introduce the programming abstraction for expressing queries, which is based on extensible packet-as-tuple abstractions. Then, we show how applying dataflow operators over these tuples can support a wide range of network telemetry applications.
3.1 Extensible Packet-tuple Abstraction
Network telemetry involves answering questions about the packets flowing through a network. Packets not only carry information about the header fields and payload, but also they can sometimes carry the information about the state of the underlying network, as in in-band network telemetry (INT) INT . Allowing network operators to express their queries directly over packet tuples, where each tuple captures the properties of the packet and its experience in the network, enables network operators to express queries for a wider range of network telemetry tasks. Existing systems such as Everflow everflow and Pathdump pathdump also operate at packet-level granularity, but only over a limited set of fields.
Sonata presents a simple abstraction where queries operate over all packets, at every location in their journeys through the network. Fields in the packet tuples can include:
-
•
Packet contents, including header fields in different protocol layers such as Ethernet (e.g., srcMac), IP (e.g., srcIP, dstIP, and proto), UDP/TCP (e.g., srcPort), and application (e.g., dns.ttl), or even payload (payload)
-
•
Packet size in bytes (size)
-
•
Location (locationID), which identifies a specific queue on a specific switch in the network
To allow the operator to extend the tuple abstraction (e.g., by adding support for protocol-specific tuple values), Sonata’s parser specifies how to extract the packet-level information necessary to support a specific set of queries. For example, a query on DNS traffic may need to extract information from DNS messages (e.g., dns.rr.type), whereas some security applications may analyze the packet payload (payload) as a string. The ability to parse traffic at line rate often depends on the capabilities of the respective data-plane targets. When compiling queries, Sonata aims to perform parsing in the underlying switches whenever possible, directing certain packets to the stream processing system for further processing only when necessary. Sonata is designed to easily incorporate standard parsers for common protocols.
3.2 Expressive Dataflow Operators
Network telemetry applications often require collecting aggregate statistics over a subset of traffic and joining the result of one analysis with another. Most of these tasks can be expressed as declarative queries composing dataflow operators like map, reduce, and join over a stream of packet tuples. Unlike existing solutions where telemetry tasks are tightly coupled with the choice of collection tool, our programming abstraction hides the details of how Sonata performs query execution, where each query operator runs, and how the underlying targets perform operations. Thus, the same queries can be applied over different choices of streaming or data-plane targets—ensuring that the telemetry system is flexible and easy to maintain.
Sonata’s query interface is inspired by dataflow frameworks like Spark spark ; we currently support map, reduce, distinct, filter, sample, and join operations over the stream of packet tuples. Stateful operators like distinct and reduce are applied on the stream over a rolling time window (of s) specified in the query; every seconds, the values of those operators are evaluated and reset. Queries can also express a maximum acceptable delay (in seconds) for detecting statistics of interest, as well as an error tolerance for the answers. Tolerating bounded latency and error gives Sonata flexibility to answer queries efficiently with limited resources, as discussed in Section 4.3.
Applying dataflow operators over packet tuples makes it relatively easy to express telemetry queries, such as detecting the onset of the DNS-based reflection attacks discussed in Section 2.2. One way to detect DNS reflection attacks is to identify destinations (dstIP) receiving DNS responses (srcPort of 53) from a large number (more than Th1) of unique sources (srcIP) polychroniou2014track , as shown in Query 1. Then, Query 2 operates over DNS header fields to confirm the presence of reflection attacks. After winnowing out the destinations that do not satisfy Query 1 during the previous window interval (line ), Query 2 looks only at DNS response messages of type RRSIG (dns.rr.type of 46) ietf-rrsig , commonly associated with amplification attacks rossow . The query then keeps a count for each dstIP that receives such response messages, returning the set of victims that exceed some threshold (Th2). Writing these high-level queries is much simpler than performing custom analysis of sampled Netflow data (for Query 1), and configuring a packet monitor and analyzing the results (for Query 2).
Table 1 summarizes some of the queries that we have written using Sonata. These examples, drawn from the existing literature, illustrate the expressiveness of the packet-tuple abstraction combined with dataflow programming to support a wide range of telemetry applications.
4 Query-Driven Data Reduction
We now describe the capabilities of PISA (Protocol-Independent Switch Architecture) targets and explain how Sonata supports dataflow operations on these targets.
4.1 Protocol-Independent Switch Architecture (PISA)
Conventional network devices do not support custom packet processing or state management. In contrast, recently introduced PISA targets rmt ; p4-xilinx ; barefoot-blog ; p4-netronome provide features that can support dataflow operations directly in the data plane, implementable in the P4 language P4 .
Programmable parsing. PISA targets allow for the specification of new header formats for parsing packets. Programmable parsing enables both the extraction of desired header fields for answering arbitrary queries and the definition of application-specific header formats for sending streams of tuples to a stream processor.
State in packets and registers. PISA targets have registers that support simple stateful computations, as well as match/action tables with a byte and packet counter for each rule. These capabilities can allow queries to accumulate statistics across a sequence of packets (e.g., a sum in a reduce operation). In addition, PISA targets can place state in custom metadata that is carried along with a packet through the packet-processing pipeline or on to the next switch, enabling queries to perform more complex operations across multiple stages.
Customizable hash functions. PISA targets support hash functions over a flexible set of fields, e.g., to access a specific register in a register array. These hash functions are useful for implementing operators like reduce and distinct that maintain state that depends on combinations of query-specific reduction keys.
Flexible match/action table pipelines. PISA targets support flexible match/action tables with programmable actions. The flexible matches on packet-header fields can support filter operations, and programmable actions enable the computations that update state or affect the next stage of packet processing.
4.2 Compiling Dataflow Operators to PISA Targets
Using these features, PISA targets can directly support many dataflow operators. For a PISA switch, Sonata can implement the following operations.
Map, filter, and sample operations. Filter operations, like line 2 of Query 1, match on fields in the packet’s header. Naturally, this operation aligns with a match-action table in the data plane; specifically, line 2 corresponds to a table that matches on the proto field and either permits the packet to continue processing or ignores it. Map and sample operations can also be executed using similar match-action tables each applying different actions over matched packets. For example, in Query 1, line 5 corresponds to an action in a table that transforms the dstIP, srcIP pair into a tuple of (dstIP, ). Operations that require evaluating a predicate, as in line 7 of Query 1, are implemented with two match/action tables: one for each possible evaluation of the predicate. For all of these operations, the state required to execute them in the data plane consists of the entries in the match/action tables. The savings in processing realized at the stream processor comes at the cost of maintaining this state in the data plane.
Distinct and reduce operations. The distinct and reduce operations are slightly different from the previous operations because these operations require maintaining state across sequences of packets. In the case of distinct, the state maintained is a single bit indicating whether or not a particular key has already been observed; in the case of reduce, it is the result of applying a function (e.g., sum) over a particular (set of) key(s). We use hash tables (implemented as arrays of registers) to maintain cross-packet state and metadata fields for storing and updating the values from the hash tables. The state required for executing these stateful operations in the data plane can be quantified as the total number of registers used.
Limitations. PISA targets cannot support all of Sonata’s dataflow operators directly in the data plane. The set of supported parsing actions and available computational capacity limit these targets’ ability to support arbitrary dataflow operations. For example, extracting a payload and performing arbitrary regular expression matching over the payload is not currently supported in PISA targets. Also, only simple computations, like add and subtract, or simple bit manipulations (e.g., bit_or), can be applied over tuple fields in the data plane. Thus, operations that require complex transformations over tuple fields e.g., a reduce operation for entropy estimation which requires a logarithmic transformation, cannot be supported in the data plane.
4.3 Bounding Data-Plane State With Sketches
Maintaining the state required by these dataflow operations consumes scarce memory and typically takes the form of a hash table. To avoid hash collisions, these hash tables are often both bloated and sparse. Instead, we can employ probabilistic data structures that summarize the relevant data in constant-space at the expense of a probabilistically-bounded error. For example, Bloom filters bloom-filters are compact data structures useful for set-membership testing.
In the case of the distinct operator, we can use a Bloom filter to test whether or not a given key is a member of the “set of unique keys”. For example, in Query 1 at line 4, we use a register array with rows storing only a single bit in each row. For a single input key (i.e., dstIP and srcIP pair), hashed indices into this array are calculated. The values at these indices in the array determine whether or not a given key is already a member of this set. After checking set membership, these array entries can be set to so future checks for the same input key are successful.
Similarly, when performing a reduce with a sum, we can employ a count-min sketch. This sketch estimates the count associated with each key by maintaining -bit wide arrays, each indexed using different hash functions. For example, in Query 1, we use a count-min sketch at line 6 for performing the reduction over the (dstIP, ) tuples. For each incoming packet, for the input key dstIP, indices are computed. The count values stored at each of these indices are incremented by one and the minimum of the updated values is selected as the estimated count. By carefully choosing the values of and , we can achieve significant size reduction with a provable accuracy guarantee cms .
4.4 Compiling Dataflow Queries to PISA Targets
Compiling a Single Query. To compile a dataflow query to a PISA switch, we first configure the match/action tables and hash tables required to execute the individual operators for the query as discussed above. We then ensure that these operator-specific tables are correctly applied in sequence. We take two goals into consideration while compiling dataflow queries for PISA targets: (1) The query processing pipelines should not affect a packet’s forwarding behavior; speficially, transformations over a packet’s header should not be applied over the packet’s actual header fields. (2) The mirroring overhead for each query should be minimal; specifically, the switch should only mirror packets that need to be reported to the streaming target. To achieve the first goal, we create query-specific metadata fields—copying information from the original header fields to these fields. To achieve the second goal, we maintain one additional bit in metadata, report, for each packet that specifies whether or not the result associated with the packet should be reported to the streaming target. For example in Query 1, if a given packet causes count to increment without crossing the threshold Th1, there is no need to report the tuple to the stream processor. Queries are always evaluated with respect to a particular packet, i.e., a packet is needed to trigger the query processing pipeline in the data plane.
Compiling Multiple Queries. Most streaming systems execute multiple queries in parallel, where each query operates logically over its own copy of the input stream. Rather than actually replicating the packets, we execute queries in the data plane sequentially. To decide whether or not to report a given query result to the stream processor, we take the union of the report bits from each query. This design choice significantly reduces the mirroring overhead and requires only an additional bit of state. When reporting data to the stream processor, this approach requires that each single packet carries the metadata fields for all reported queries in the pipeline—making the task of decoding the packet at the stream processor harder, since the stream processor must determine which of the queries actually need to see the tuple.
5 Coordinated Data Collection & Analysis
In this section, we describe how Sonata makes use of two scalability techniques: (1) query partitioning, and (2) iterative refinement, to scale query execution. We then describe the problem of query planning, that determines how and where each query should be executed.
5.1 Query Partitioning
Section 4 describes how Sonata can execute dataflow queries in PISA targets. Not all operations for a query can be executed in the data plane. Either the switch cannot support them or the state required exceeds what the switch can support. Thus, for each query, the runtime needs to decide how to partition the query—executing portions of a query directly in the data plane and the remainder in the stream processor.
| Driver API | Description |
|---|---|
| isSupported(q) | Returns whether the target can execute query q. |
| getCost(q,t) | Returns normalized cost of executing query q over the target, given training data t. |
| compile([q]) | Executes list of queries [q] over the target. |
Partitioning Plans. Before deciding how to partition a query, Sonata’s runtime must first identify possible ways (i.e., partitioning plans), in which it can partition the query, and estimate the cost of each partitioning plan. For any dataflow query with operators, there are possible ways in which it can partitioning the query—each executing first operators in the data plane and the remainder in the stream processor. Here represents the plan in which we execute all the dataflow operators in the stream processor and represents plan where we execute all dataflow operators in the data plane. We use to represent the set of partitioning plans for each query.
The runtime relies on the API exposed by the data plane drivers, as shown in Table 2, to determine what partitioning plans can be executed in the data plane and their cost. For example, if the runtime calls the isSupported function on the partitioning plan, executing all operators for Query 1 for a PISA target, it returns true because all the constituent dataflow operators can be implemented in a PISA dataplane. Similarly, it calls the getCost function to estimate normalized cost of executing a partitioned query in the data plane. If the output normalized cost and/or are greater than one, then the plan cannot be supported by the data plane and/or the stream processor.
5.2 Iterative Refinement
For many queries, the traffic of interest is typically only a small fraction of the total traffic. If we continuously collect and analyze all the incoming packets, we end up wasting compute resources and maintaining state for traffic that is of no interest as far as a given query is concerned. We argue that coupling collection and analysis for network telemetry helps Sonata to selectively spend resources on only the relevant portions of the traffic.
To this end, we exploit the hierarchical structure of some of the fields in the packet tuple—srcIP, dstIP, dns.qname—executing queries at coarser levels of refinement for these fields, and iteratively zooming-in on traffic that satisfies the query at a coarser level. Executing queries at coarser levels requires less resources in the data plane. For example, if we replace the field dstIP with dstIP/8 for Query 1 (see line 3 in Query 3), then the number of unique pairs of dstIP/8, and srcIP drops significantly. Iterative refinement winnows out the uninteresting traffic in each round which, in turn, allows us to dedicate available compute resources to the portion of traffic that matters for the query. This process saves state in the data plane but comes at the cost of the additional detection delay incurred during the iteration.
Refinement Keys. To enable iterative refinement, the runtime needs to find fields in the packet tuples that can be used for iterative refinement (the refinement keys). They are determined by identifying the set of fields that (1) are used as keys in stateful dataflow operations like reduce and distinct and (2) have a hierarchical structure that allows us to replace them with coarser versions without missing any traffic that satisfies the original query. For example, Query 1 can use the field dstIP as a key for iterative refinement.
While it is possible to have more than one candidate field for iterative refinement, it is also possible to not find any candidate for refinement for a query. Consider the example of the query for detecting sidejacking attacks (see table 1). This query cannot benefit from iterative refinement because the two fields sessionID and userAgent that are used in the stateful operation do not have any hierarchical structure.
Refinement Levels. After identifying the refinement key(s), the runtime needs to enumerate the levels for each field that can be used for iterative refinement. To generalize, each refinement key () consists of a set of levels where is the coarsest level and is the finest; thus, implies that is “finer” than . The meaning of the refinement level is specific to each key; in the case of an IPv4 address, the refinement level would be a /1 mask applied to the address. In the case of a domain name, the refinement level would be the root domain (".") and the refinement level would be a fully qualified domain name.
5.3 Query Planning
Sonata’s query planning performs cost-based optimization to determine where and how to execute input queries. Query planning for Sonata primarily focuses on deciding how to combine different techniques like query partitioning and iterative refinement to make best use of available resources. For a single query, there exist many possible combinations of partitioning plans and refinemet levels and selecting poor combinations of these might actually worsen system performance. We call the specific sequence in which we refine each query and partition the query for each refinement level while configuring sketches in the data plane, a query plan. In this section, we describe how the runtime selects the best plan among all the possible candidates for each query.
5.3.1 Workload-Agnostic Query Planning
Let us first consider a solution in which the runtime selects a uniform query plan for all input queries, without taking into consideration the workload that affects each specific query differently. Selecting such a query plan might not help scale query executions for two reasons.
First, different refinement levels will winnow out traffic at varying degrees of effectiveness depending on the fields used as keys for reduce and distinct operations, the threshold values for filter operations, and the workload-specific subset of traffic over which the query is applied. If a given query plan iterates over refinement levels that do not effectively filter out the uninteresting traffic, then both detection delay and state in the data plane are increased.
Second, sketch-based data structure performance would also decrease because their guarantees on accuracy rely on an estimate of the true count of elements to be stored therein. Therefore in order to determine which query plan strikes the right balance of costs given the system and query-specific constraints, we need traffic data collected from the network.
| Set of input queries expressed using Sonata’s API | |
| Interval for windowed operations for each query | |
| Max. detection delay specified for each query | |
| Training data collected for window intervals | |
| Max. state (bits) data plane can support | |
| Max. tuples that the streaming target can process in seconds |
5.3.2 Workload-driven Query Planning
The runtime system’s goal is to select the minimum-cost query plan, using traffic data collected from the underlying network for comparing the cost of various candidate plans. We observe that if we think of all the specific combinations of refinement levels and partitioning plans as vertices in a graph, then all possible paths from the coarsest to the finest refinement level become the candidate query plans. Better yet, the best query plan becomes the shortest-path with minimum cost in the graph of candidate query plans.
Generating Query Plan Graph. Candidate query plans are paths embedded in a query plan graph (). The maximum number of window intervals is the minimum of , the maximum detection delay each query can tolerate, and the number of possible refinement levels. All possible combinations of refinement levels and partitioning plans that are executed in consecutive window intervals constitute the vertices in the query plan graph. The query plan graph is constrained by two requirements: (1) edges are permitted only from vertices with coarser refinement levels to finer ones, and (2) from vertices in the window interval to vertices in the window interval. Two vertices are connected by an edge in this graph if and only if they are direct neighbors in a candidate query plan. After adding all the edges that satisfy the above requirements, we discard all the disconnected vertices to obtain the final query plan graph for query . We also define a globally “coarsest” vertex (Src) and a globally “finest” vertex (Tgt) as the source and sink for every candidate refinement plan as vertices in .
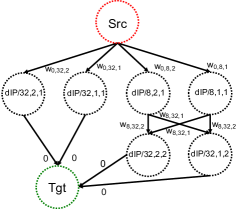
Figure 1 shows the query plan graph for Query 1. It has dstIP as the refinement key, and for ease of illustration has only two refinement ({dstIP/8, dstIP/32}) and partitioning ({1,2}) choices. In this example, there is no edge between nodes (dstIP/32,1,1) to (dstIP/8,1,2) because we only allow zoom-in from a coarser to a finer refinement level in successive iterations. Not shown are the disconnected nodes we discarded (dstIP/8,1,2) or (dstIP/8,2,2) from the final query plan graph shown in Figure 1. Every path in this graph from Src to Tgt represents a candidate query plan.
Updating Weights for Query Plan Graphs. We will now describe how the runtime uses the traffic data to update the weight for each edge in the resulting query plan graph . We compute a new weighted graph for every window interval in the traffic data. If the duration of data is window intervals long, then we compute different weights for each edge and generate different weighted query plan graphs.
To compute the weights for each edge in the query plan graph, the runtime needs to generate a transformed version of the original query that is appropriate for the specific refinement level and partition plan of each node in the graph. The runtime first maps the refinement keys to coarser values to count statistics at coarser levels of granularity (see line 3 in Query 3). It must also update the thresholds at each refinement level. Selecting the appropriate threshold at coarser levels is challenging. For example, in Query 1, the network operator specifies a threshold value on line 7 for a specific dstIP (also written as dIP/32). At coarser refinement levels, such as dstIP/8, it would be inappropriate to apply the same threshold as originally specified because the field in question is now an aggregate count bucket and not a specific dstIP/32. Sonata’s runtime has to select appropriate thresholds for each node in the graph such that no traffic that satisfies the query at the finest level is missed.
The runtime first runs the query at the finest refinement level over the training data to identify the portion of traffic that satisfies the original input query. It then backtracks to a coarser refinement level, runs the query again, but this time tracks the results for aggregate count buckets that contain the results at the next finer refinement level. It then selects the minimum count, of all count buckets, as the threshold value for this coarser refinement level. The runtime continues this process until it reaches the coarsest refinement level thereby ensuring that at each refinement level, it selects a threshold greater than or equal to the original threshold without missing any traffic that satisfies the query.
The runtime then joins queries for pair of nodes—ensuring that the query at a finer level is only applied over traffic that satisfies the query at the coarser level. It then provides the training data and joined query for each edge as input to driver’s getCost (see Table 2). For each edge, this function returns the number of packet tuples to be processed by the stream processor and the amount of state required in the data plane. The target applies an implementation-specific cost model to estimate the number of bits required. For PISA targets, it estimates the cost as number of bits required to execute stateful operations like distinct and reduce in the data plane—estimating sketch sizes in the process. To enable comparison between these two cost metrics, the function returns the values and normalized with respect to system constraints. The costs for edge () depend only on how well the traffic not-satisfying the given query was winnowed out at refinement level () before getting executed at refinement level () with a partitioning plan . This implies that multiple edges will have the same cost—reducing the complexity of computing the weights for query plan graphs. We define the weight for each edge () as a linear combination of the costs: . is a tunable parameter that assigns relative importance to the two cost metrics.
5.3.3 Selecting the Best Query Plan
The runtime can apply the Dijkstra algorithm over the weighted graph to find the plan with minimum cost. For each time interval, the edges in the graph will have different weights. Different time intervals are likely to have different minimum-cost query plans. Thus, the goal is to find the query plan that best represents the minimum-cost query plan for all of the training intervals. We select the candidate query plan () that minimizes the root-mean square error, . Here, represents the minimum-cost query plan for interval and the cost for each plan is defined as: for all edges in plan .
Tuning . The tunable parameter assigns relative importance to the normalized and costs where and . As we increase , we trade off higher cost for lower cost . For the given system constraints, and , each value of can result in four possible states depending on whether cost is greater than and/or cost is greater than . To tune , we start with (equal weight to normalized and costs) and perform a binary search with the goal of finding an -value where the weighted cost of the query plan across all intervals is minimum while ensuring that the constraints and are satisfied for each candidate . Note that no feasible solution exists if any and .
Selecting Query Plans for Multiple Queries. Multiple queries compete for limited resources, specifically, the amount of state in the data plane and processing power at the streaming streaming targets. The problem of finding the right query plans for all queries that require minimum resources and also satisfy the system constraints, can be mapped to the bin packing problem bin-pack . We designed a simple algorithm for multiple queries that tunes a single value of for all queries together, which is a simple extension of our algorithm for the single query case. It performs a binary search exploring the value of that minimizes the total weighted cost and applies the constraints over the total number of bits and tuples for all the queries. Other algorithms can readily be substituted to learn the best query plan.
6 Evaluation
In this section, we evaluate Sonata using realistic network telemetry tasks over different real-world workloads.
6.1 Setup
| Network | Tool | Description |
|---|---|---|
| Large IXP | IPFIX | Sample (1 in 10K packets), 3 Tbps peak rate, August 2015. |
| Large ISP | NetFlow | Unsampled, 10 Gbps backbone link, January 2016. |
| Campus | Pcap | Unsampled, 150 Kbps DNS traffic, February 2017. |
| Queries | Lines of Code | Description | |
|---|---|---|---|
| Sonata | P4 | ||
| DDoS-UDP | 8 | 383 | Detecting traffic anomaly over UDP traffic |
| SSpreader | 7 | 333 | Superspreader detection query |
| PortScan | 7 | 320 | Port scan detection query |
| DDoS-DNS | 8 | 383 | Detecting traffic anomaly over DNS traffic, i.e. Query 1 |
| Reflection Attack | 16 | 402 | Detecting reflection attacks using DNS headers, i.e. Query 2 |
Workloads. To quantify Sonata’s performance, we use actual traffic traces collected from three different networking environments as shown in Table 4. The first trace consists of sampled, flow-level statistics that was collected at a large IXP using the IPFIX tool. The second trace is unsampled flow-level data collected from a large ISP’s backbone link connecting Seattle and Chicago. We selected two hours of traffic from both of these two traces and used them to evaluate the capability of Sonata’s runtime system to learn workload-driven query plans for scalability. The third trace consists of unsampled DNS requests and responses that we collected from a campus network. We use one minute of this low-volume packet trace to demonstrate Sonata’s end-to-end performance with software switches as data plane targets.
Monitoring Queries. To compare and contrast Sonata’s performance with different state-of-the-art network telemetry solutions under realistic workloads, we primarily focus on queries that operate over packets-header fields. Applying these queries to the available flow-level traces quantifies Sonata’s performance under realistic workloads. These queries can also contrast Sonata’s performance against solutions that execute the entire query over the streaming or the data plane targets. Table 5 lists the queries we use for our evaluation. Unless specified otherwise, we set the threshold values for each query as the percentile of the respective counts; window interval as one second; and sketch accuracy as %. For all of these queries, the refinement keys are IP addresses. We consider eight refinement levels (i.e., {/4, /8, ,/32}) for iterative refinement.
Table 5 also shows the lines of code for expressing these queries using Sonata’s query interface. We compare these numbers with the lines of code required to configure match/action tables in the PISA targets to execute the same queries. These results show that Sonata makes it easier for network operators to express their queries without worrying about configuring the low-level data plane targets.
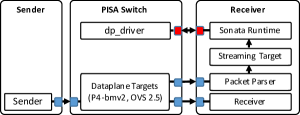
Prototype. Our prototype is implemented in Python (around 9,000 lines of code). We use the P4 Behavioral Model (bmv2) bmv2 , and Open vSwitch 2.5 as the data plane targets, and use Spark 1.6.1 spark as the stream processor. We use scapy scapy for parsing the query-specific header fields embedded in packet’s header coming out from a switch’s span port.
Testbed. Our testbed has three physical servers, each with Xeon 4-core 3.70 GHz CPU, three 10 GbE, and one 1GbE cards. We use the 1G interfaces for communication between different components (i.e., data plane driver and runtime) and the other ports for sending data. Figure 2 shows how we configured these machines. Note, in practice, PISA targets are expected to support traffic rates up to 6 Tbps tofino . Unfortunately, this hardware is currently still in a pre-release phase and not yet available to us. The current P4 behavioral model, however, can only process a few hundred packets per second. This limits our ability to perform end-to-end performance evaluation using high volume workloads.
Comparison. We compare Sonata’s performance against four categories of state-of-the-art network telemetry solutions. First, Stream-Only represents solutions like OpenSOC opensoc that collect all raw packets for analysis. Second, Part-OF represents solutions like EverFlow everflow that can perform limited data collection in the dataplane before analysis (e.g., partitioning filter and sample operations). Third, Part-PISA represents solutions such as OpenSketch opensketch that can use PISA targetes for executing as many dataflow operations as possible in the data plane. Fourth, Fixed-Refinement represents the class of solutions that apply a workload-agnostic static refinement plan (see Section 5.3.1) for all queries in order to reduce the state required to execute dataflow operations in the data plane.
6.2 Scaling Query Executions
We now demonstrate that using workload-driven query plans help scale query executions. Compared to configurations that rely on the data plane for filtering and sampling only, Sonata reduces the load on the stream processor by more than a factor of four. Compared to approaches that exploit sketches to reduce sate in the data plane without coordinating with stream processors, Sonata reduces the amount of state required by more than a factor of two.
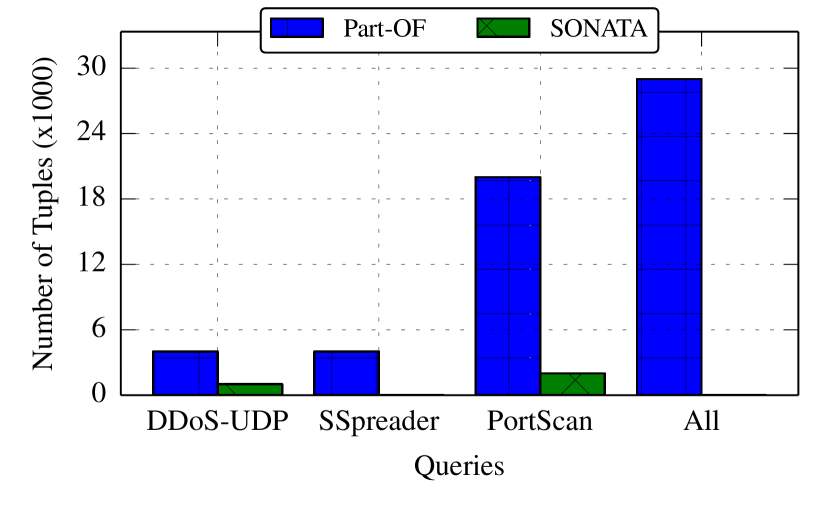
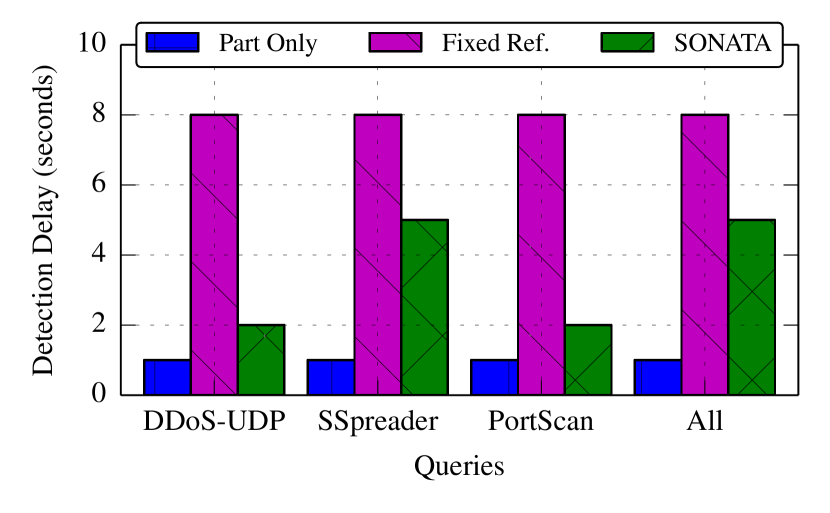
We apply both the large IXP and ISP workloads on the DDoS-UDP, SSpreader, and PortScan queries. For each query, we configure the system constraints such that Sonata will be able to partition at least one stateful operation to the data plane. For example, in the case of DDoS-UDP query , setting KB ensures that all the incoming packets are not forwarded to the stream processor. For each experiment, we partition the workload data into two parts, using the first twenty window intervals as training data for selecting the query plan, and the remaining windows as test data. We report median values across all the test data points. Figure 3 shows how Sonata scales the execution of the three queries when they run independently and concurrently.
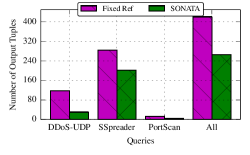
Number of Packet Tuples. Any gains compared to mirror-all-traffic solutions, i.e. Stream-Only are obvious. Thus, in Figure 3(a), we show the number of packet tuples processed by Part-OF and Sonata. We observe that compared to Part-OF solutions that can only execute filter and sample operators to the data plane, Sonata’s ability to execute stateful operations significantly reduces the load on the stream processor. Assuming the context of the scalability study in osoc-scale , which shows scalability results of the stream processor up to 1M packet tuples/s, by simply extrapolating the results for DDoS-UDP in this figure, we can expect that compared to Part-OF solutions that can support around 250 such queries, Sonata can support up to 1000 such queries.
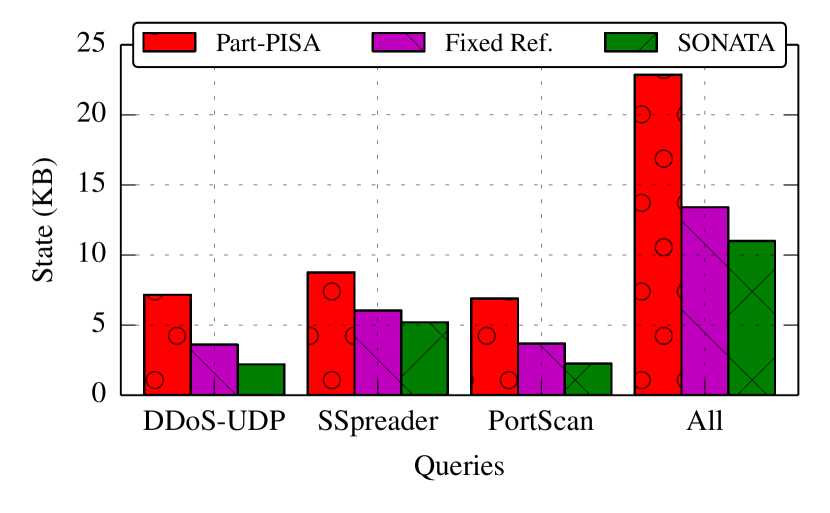
State in the Data Plane. Figure 3(b) compares the amount of state required to execute a subset of the query in the data plane by Sonata against Part-PISA, and Fixed-Refinement. These solutions either do not use iterative refinement (Part-PISA) or use a fixed refinement plan for all queries (Fixed-Refinement). We can see that Sonata’s ability to select workload-driven query plans ensures that it requires minimal state in the data plane. Given that in practice, PISA targets can easily support 4 MB of state in the data plane for monitoring applications narayana2016codesign , by simply extrapolating the results for DDoS-UDP query in this experiment, we can expect Sonata can support up to 1600 such queries compared to Part-PISA solutions which can only support 800.
Detection Delay. Figure 3(c) shows the time it takes to detect traffic of interest. Solutions that do not require iterative refinement have a delay that is equal to one window interval. Fixed-Refinement solutions require eight window intervals to detect traffic of interest. In contrast, Sonata learns better query plans—not only requiring lesser state in the data plane but also detects events of interest sooner than Fixed-Refinement solutions.
To understand how sensitive our results are with respect to to parameters, like threshold, sketch accuracy, and window intervals for each query, we ran the experiments varying each of these parameters. We observed that gains from iterative refinement are higher for high threshold values and they diminish as the fraction that satisfies the query increases for lower threshold values. Similarly, for queries that require higher sketch accuracy, the performance gains are higher for Sonata and the performance of Part-PISA solutions are comparable to Sonata for lower sketch accuracy—as they require less state to execute the queries at the finest refinement levels. The performance trends were unaffected by the choice of window intervals. However, longer window intervals require more state in the data plane.
6.3 Benefits of Query Planning
We now demonstrate that Sonata’s ability to facilitate workload-driven query planning makes efficient usage of available resources. Specifically, we show how Sonata’s query planning algorithm learns different plans under different system constraints. We exhaustively explore the configuration space by determining query plans for each configuration. For a given query and workload, we first determine the maximum amount of state () and the maximum number of tuples () required to execute all possible candidate query plans. We then evaluate a given query plan for all possible configurations—varying system constraints from and , respectively, in steps of size for each constraint.
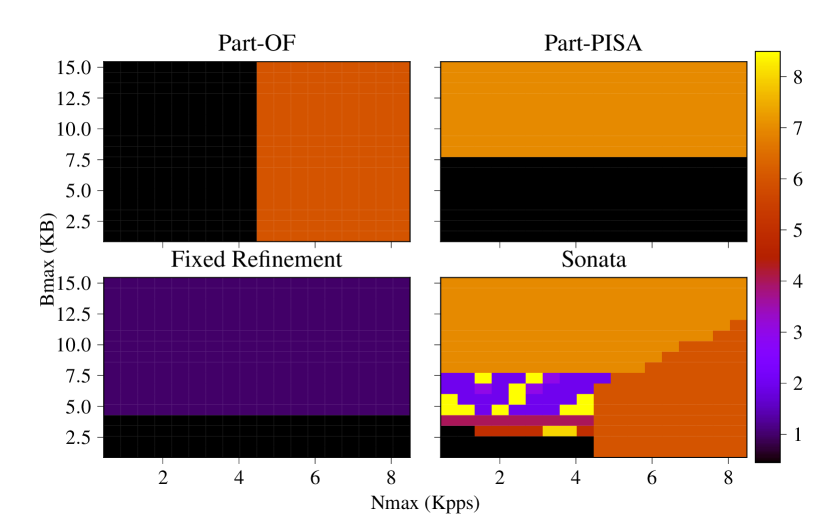
Figure 4 shows unique query plans selected for each combination of system constraints for the DDoS-UDP query with the large IXP trace as workload. The black region in the graph shows configuration where no solution is possible, i.e. either the number of tuples sent to the stream processor exceeds the limit or the number of bits required in the data plane exceeds the limit . Since Part-OF solutions cannot execute stateful operations in the data plane, no solutions exists if is configured to be less than the number of incoming UDP packets. For Part-PISA solutions, no feasible query plans exist if the number of bits is configured lower than what is required for executing both the distinct and reduce operations for DDoS-UDP in the data plane. Fixed-Refinement solutions show a similar trend but require less state compared to Part-PISA solutions. Finally, Sonata is able to learn the minimum cost query plans, finding feasible solutions for relatively more combinations of system configurations. We observed similar results for the other queries and with the large ISP trace as workload.
Table 6 shows the total number of unique query plans observed for each query. We also observe that different queries (e.g., DDoS-UDP & SSpreader or DDoS-UDP & PortScan) can result in different minimum cost query plans for the same system constraints which highlights the importance of selecting workload-driven query plans.
| Network | DDoS-UDP | SSpreader | PortScan | All |
|---|---|---|---|---|
| Large IXP | 8 | 5 | 5 | 17 |
| Large ISP | 6 | 4 | 13 | 20 |
6.4 Overheads
We now quantify various overheads in selecting the query plans and updating the queries for iterative refinement.
Training Overheads. To quantify the overhead for the runtime system to select the best query plan for a given query, we first determine the training duration (), i.e., the number of window intervals required to accurately learn the best query query plan. To this end, we compute the training and test errors as we gradually increase the number of window intervals used for training. These errors typically converge within 10–20 window intervals. We observed that it takes 3-5 minutes to generate query plan graphs from the collected data of duration 20 window intervals, and 20–30 seconds to process the generated graphs to select query plans on our testbed.
Updating Query Executions. To quantify the time it takes to update the queries at the end of every window interval for iterative refinement, Figure 5 shows the number of output tuples at the end of every window interval for iterative refinement. Using our testbed setup, we quantify the time it takes for (1) the runtime to process these output tuples, and (2) the data plane driver to reset the hash tables for stateful operators, and update the entries for the filter tables. We observed that the total overhead is around 100–150 ms. This high value is attributable to the time it takes to update the software switch which is around 100–120 ms. We expect this number to be smaller for production-level switches like Tofino tofino —enabling faster updates.
6.5 End-to-end Operation
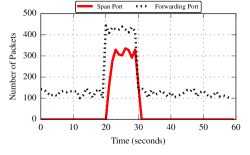
To demonstrate Sonata’s end-2-end operation, we focus on the Reflection Attack query and use the campus network trace as our workload. We load the packets from the trace and send them to the data plane target. Operating with a window interval of one second, the query uses the refinement levels dIP/16 and dIP/32. At time seconds, we inject additional packets at rate 300 packets/second, for a period of ten seconds. This injected (synthetic) traffic consists of multiple source addresses sending DNS packets of type RRSIG to a single host.
We measure the number of packets at the forwarding and the span ports. Figure 6 shows how Sonata applies dataflow operations over the incoming packet stream, ignoring the normal traffic most of the time. As soon as anomalous traffic is injected, at the end of first window interval, i.e. one second, it updates the packet processing pipeline to report only the traffic that satisfies Query 1 to the stream processor which in turn is applying dataflow operations over the packet’s DNS header fields.
7 Related Work
Stream processing of network data. The most closely related technologies to Sonata are those that support analysis of a combination of network traffic sources such as packet capture and IPFIX to support performance or security applications. Both Deepfield deepfield and Kentik kentik support complex queries that require fusing information from both IPFIX and packet traces, as discussed in Section 2.2; yet, these systems are still relatively rigid in terms of the types of queries that they can support, because they rely on existing collection technologies (e.g., IPFIX). For example, existing Deepfield deployments perform analysis based on sampled IPFIX records, since the tools do not support iterative query refinement and must collect all data a priori. Neither Deepfield nor Kentik support queries over high data-rate packet-level traffic streams. Other systems can process streaming network data carney2002monitoring ; sullivan1996tribeca ; progme ; gigascope ; abadi2003aurora ; abadi2005design ; amann2014count . Some of these systems, such as Tribeca sullivan1996tribeca and Gigascope gigascope , tailored for network packet traces; Tigon tigon and OpenSOC opensoc provide similar abstractions and rely on streaming analytics technologies such as Apache Hadoop, Spark, and Hive. Yet, these systems do not work directly on network switches, and do not introduce scalability techniques such as sketches and real-time iterative refinement that allow Sonata to scale.
Query planning. The database community has explored query optimization extensively polychroniou2014track ; mullin1990optimal ; graefe1987exodus ; catalyst . An early example of query partitioning can be found in the Gigascope system gigascope where the technique is used to minimize the data transfer from the capture card to the stream processor. Query partitioning has also been extensively explored in the database literature in the context of query optimization polychroniou2014track ; mullin1990optimal ; graefe1987exodus ; catalyst ; telegraphCQ . The idea of query partitioning has also been used for distributing and efficiently executing queries in sensor networks of low-power devices, using in-network operators for filtering and aggregation Madden.OSDI02 ; tinydb ; Srivastava.PODS05 . Geo-distributed analytics systems such as Clarinet clarinet and Geode vulimiri2015global partition queries across geographically distributed compute and storage clusters. Similarly, large-scale tracing of distributed systems, as in Fay fay , also adopts distributed query execution across the cluster of machines, optimizing for factors such as early trace data aggregation and reduced network communication.
Iterative refinement. Iterative zoom-in to reduce the load on the data plane has been explored in earlier work such as Autofocus autofocus , ProgME progme , and HHH jose2011online . Yet, these efforts either do not apply to streaming data (i.e., they require multiple passes over the data progme , or they use static refinement plans (e.g., HHH performs zooms-in one bit at a time). More recently, Gupta et al. sonata-hotnets explored the idea of iterative query refinement in combination with query partitioning, but their system only considers data-plane targets with fixed-function chipsets and requires network operators to manually choose the refinement and partitioning plan. In contrast, Sonata is designed for streaming data, also supports drivers for programmable data-plane targets, and selects workload-driven query plans.
Sketches. Sketches have long been an active area of research for many years in the theoretical computer science community muthu-book . More recently, networking researchers have explored applications of sketches to network traffic monitoring in next-generation switches univmon ; opensketch ; hashpipe . In Sonata, our focus is on automatically generating an efficient sequence of sketches for realizing a specific query, rather than supporting a universal sketching platform univmon ; opensketch or a point solution for a specific query hashpipe .
8 Conclusion
Sonata makes it easier for network operators to express queries for a range of network telemetry tasks without worrying about how and where these tasks get executed. Using realistic queries and workloads, we demonstrate that Sonata selects optimal query plans that require less state in the data plane and reduce data rates for the streaming analytics systems in comparison with various state-of-the-art systems.
References
- [1] D. Abadi, D. Carney, U. Cetintemel, M. Cherniack, C. Convey, C. Erwin, E. Galvez, M. Hatoun, A. Maskey, A. Rasin, et al. Aurora: A Data Stream Management System. In Proceedings of the 2003 ACM SIGMOD international conference on Management of data, pages 666–666. ACM, 2003.
- [2] D. J. Abadi, Y. Ahmad, M. Balazinska, U. Cetintemel, M. Cherniack, J.-H. Hwang, W. Lindner, A. Maskey, A. Rasin, E. Ryvkina, et al. The Design of the Borealis Stream Processing Engine. In CIDR, volume 5, pages 277–289, 2005.
- [3] J. Amann, S. Hall, and R. Sommer. Count Me In: Viable Distributed Summary Statistics for Securing High-Speed Networks. In International Workshop on Recent Advances in Intrusion Detection (RAID), pages 320–340, September 2014.
- [4] M. T. Arashloo, Y. Koral, M. Greenberg, J. Rexford, and D. Walker. Snap: Stateful network-wide abstractions for packet processing. In Proceedings of the 2016 conference on ACM SIGCOMM 2016 Conference, pages 29–43. ACM, 2016.
- [5] M. Armbrust, R. S. Xin, C. Lian, Y. Huai, D. Liu, J. K. Bradley, X. Meng, T. Kaftan, M. J. Franklin, A. Ghodsi, et al. Spark sql: Relational data processing in spark. In Proceedings of the 2015 ACM SIGMOD International Conference on Management of Data, pages 1383–1394. ACM, 2015.
- [6] L. Bilge, E. Kirda, C. Kruegel, and M. Balduzzi. Exposure: Finding malicious domains using passive dns analysis. In Ndss, 2011.
- [7] K. Borders, J. Springer, and M. Burnside. Chimera: A declarative language for streaming network traffic analysis. In Presented as part of the 21st USENIX Security Symposium (USENIX Security 12), pages 365–379. USENIX, 2012.
- [8] P. Bosshart, D. Daly, G. Gibb, M. Izzard, N. McKeown, J. Rexford, C. Schlesinger, D. Talayco, A. Vahdat, G. Varghese, and D. Walker. P4: Programming protocol-independent packet processors. ACM SIGCOMM Computer Communication Review, 44(3):87–95, July 2014.
- [9] P. Bosshart, G. Gibb, H.-S. Kim, G. Varghese, N. McKeown, M. Izzard, F. Mujica, and M. Horowitz. Forwarding metamorphosis: Fast programmable match-action processing in hardware for SDN. In Proc. ACM SIGCOMM, August 2013.
- [10] G. Brebner. P4 for an FPGA Target. In P4 Workshop, June 2015.
- [11] A. Broder and M. Mitzenmacher. Network applications of bloom filters: A survey. Internet mathematics, 1(4):485–509, 2004.
- [12] D. Carney, U. Çetintemel, M. Cherniack, C. Convey, S. Lee, G. Seidman, M. Stonebraker, N. Tatbul, and S. Zdonik. Monitoring Streams: A New Class of Data Management Applications. In VLDB, pages 215–226, 2002.
- [13] S. Chandrasekaran, O. Cooper, A. Deshpande, M. J. Franklin, J. M. Hellerstein, W. Hong, S. Krishnamurthy, S. R. Madden, F. Reiss, and M. A. Shah. Telegraphcq: continuous dataflow processing. In Proceedings of the 2003 ACM SIGMOD international conference on Management of data, pages 668–668. ACM, 2003.
- [14] G. Cormode and S. Muthukrishnan. An improved data stream summary: the count-min sketch and its applications. Journal of Algorithms, 55(1):58–75, 2005.
- [15] C. Cranor, T. Johnson, O. Spataschek, and V. Shkapenyuk. Gigascope: A Stream Database for Network Applications. In Proceedings of the 2003 ACM SIGMOD international conference on Management of data, pages 647–651. ACM, 2003.
- [16] Endance packet capture cards. https://www.endace.com/endace-dag-high-speed-packet-capture-cards.html.
- [17] U. Erlingsson, M. Peinado, S. Peter, and M. Budiu. Fay: Extensible Distributed Tracing from Kernels to Clusters. In SOSP, 2011.
- [18] L. Ertöz, E. Eilertson, A. Lazarevic, P.-N. Tan, V. Kumar, and J. Srivastava. Minds-minnesota intrusion detection system.
- [19] C. Estan, S. Savage, and G. Varghese. Automatically inferring patterns of resource consumption in network traffic. In Proceedings of the 2003 conference on Applications, technologies, architectures, and protocols for computer communications, pages 137–148. ACM, 2003.
- [20] G. Graefe and D. J. DeWitt. The EXODUS optimizer generator, volume 16. ACM, 1987.
- [21] A. Gupta, R. Birkner, M. Canini, N. Feamster, C. MacStoker, and W. Willinger. Network Monitoring as a Streaming Analytics Problem . In HotNets, 2016.
- [22] M. Hira and L. J. Wobker. Improving Network Monitoring and Management with Programmable Data Planes. http://p4.org/p4/inband-network-telemetry/.
- [23] L. Jose, M. Yu, and J. Rexford. Online measurement of large traffic aggregates on commodity switches. In Proceedings of the 11th USENIX conference on Hot topics in management of internet, cloud, and enterprise networks and services, pages 13–13. USENIX Association, 2011.
- [24] M. Kührer, T. Hupperich, C. Rossow, and T. Holz. Exit from hell? reducing the impact of amplification ddos attacks. In USENIX Security, volume 2014, 2014.
- [25] Z. Liu, G. Vorsanger, V. Braverman, and V. Sekar. Enabling a RISC Approach for Software-Defined Monitoring using Universal Streaming. In Proceedings of the 14th ACM Workshop on Hot Topics in Networks, page 21. ACM, 2015.
- [26] S. Madden, M. J. Franklin, J. M. Hellerstein, and W. Hong. TAG: A Tiny AGgregation Service for Ad-hoc Sensor Networks. In OSDI, 2002.
- [27] S. R. Madden, M. J. Franklin, J. M. Hellerstein, and W. Hong. TinyDB: An Acquisitional Query Processing System for Sensor Networks. ACM Trans. Database Syst., 30(1), March 2005.
- [28] J. K. Mullin. Optimal semijoins for distributed database systems. IEEE Transactions on Software Engineering, 16(5):558–560, 1990.
- [29] S. Muthukrishnan. Data Streams: Algorithms and Applications. Foundations and Trends in Theoretical Computer Science. 2010.
- [30] S. Narayana, A. Sivaraman, V. Nathan, M. Alizadeh, D. Walker, J. Rexford, V. Jeyakumar, and C. Kim. Co-designing software and hardware for declarative network performance management. In HotNets, 2016.
- [31] S. Narayana, M. Tahmasbi, J. Rexford, and D. Walker. Compiling path queries. In 13th USENIX Symposium on Networked Systems Design and Implementation (NSDI 16), pages 207–222. USENIX Association, 2016.
- [32] The Programmable Switch Chip Consigns Legacy Fixed-Function Chips to the History Books. https://goo.gl/dYxv37.
- [33] O. Polychroniou, R. Sen, and K. A. Ross. Track join: distributed joins with minimal network traffic. In Proceedings of the 2014 ACM SIGMOD international conference on Management of data, pages 1483–1494. ACM, 2014.
- [34] Resource Records for the DNS Security Extensions. https://www.ietf.org/proceedings/93/slides/slides-93-dots-3.pdf.
- [35] Apache Flink. http://flink.apache.org/.
- [36] Deepfield Defender. http://deepfield.com/products/deepfield-defender/.
- [37] OpenSOC. http://opensoc.github.io/.
- [38] OpenSOC Scalability. https://goo.gl/CX2jWr.
- [39] Tigon. http://tigon.io/.
- [40] Tracking Packets’ Paths and Latency via INT . https://schd.ws/hosted_files/2016p4workshop/1d/FB%20BFN%2C%20INT-PLT_Talk_May_2016-v1.1-1.pdf.
- [41] V. Sivaraman, S. Narayana, O. Rottenstreich, S. Muthukrishnan, and J. Rexford. Heavy-hitter detection entirely in the data plane. In ACM Symposium on SDN Research, April 2017.
- [42] Big Monitoring Fabric. http://www.slideshare.net/bigswitchnetworks/big-monitoring-fabric-58389045.
- [43] U. Srivastava, K. Munagala, and J. Widom. Operator Placement for In-Network Stream Query Processing. In PODS, 2005.
- [44] M. Sullivan. Tribeca: A Stream Database Manager for Network Traffic Analysis. In VLDB, volume 96, page 594, 1996.
- [45] P. Tammana, R. Agarwal, and M. Lee. Simplifying datacenter network debugging with pathdump. In 12th USENIX Symposium on Operating Systems Design and Implementation (OSDI 16), pages 233–248. USENIX Association, 2016.
- [46] Apache Spark. http://spark.apache.org/.
- [47] Barefoot’s Tofino. https://www.barefootnetworks.com/technology/.
- [48] Kentik. https://www.kentik.com.
- [49] P4 software switch . https://github.com/p4lang/behavioral-model.
- [50] Scapy: Python-based interactive packet manipulation program. https://github.com/secdev/scapy/.
- [51] Velocidata. http://velocidata.com/.
- [52] V. V. Vazirani. Approximation algorithms, Section 3.3. Springer Science & Business Media, 2013.
- [53] B. Vinnakota. P4 with the Netronome Server Networking Platform. https://goo.gl/PKQtC7, May 2016.
- [54] R. Viswanathan, G. Ananthanarayanan, and A. Akella. Clarinet: WAN-Aware Optimization for Analytics Queries. In OSDI, 2016.
- [55] A. Vulimiri, C. Curino, P. B. Godfrey, T. Jungblut, J. Padhye, and G. Varghese. Global analytics in the face of bandwidth and regulatory constraints. In 12th USENIX Symposium on Networked Systems Design and Implementation (NSDI 15), pages 323–336, 2015.
- [56] Q. Wu, J. Strassner, A. Farrel, and L. Zhang. Network telemetry and big data analysis. Network Working Group Internet-Draft, 2016.
- [57] M. Yu, L. Jose, and R. Miao. Software Defined Traffic Measurement with OpenSketch. In 10th USENIX Symposium on Networked Systems Design and Implementation (NSDI 13), pages 29–42, 2013.
- [58] L. Yuan, C.-N. Chuah, and P. Mohapatra. ProgME: Towards Programmable Network Measurement. In SIGCOMM, 2007.
- [59] Y. Zhu, N. Kang, J. Cao, A. Greenberg, G. Lu, R. Mahajan, D. Maltz, L. Yuan, M. Zhang, B. Y. Zhao, et al. Packet-level telemetry in large datacenter networks. In ACM SIGCOMM Computer Communication Review, volume 45, pages 479–491. ACM, 2015.