Periodic accretion-powered flares from colliding EMRIs as TDE Imposters
Abstract
When a main sequence star undergoes Roche lobe overflow onto a supermassive black hole (SMBH) in a circular extreme mass ratio inspiral (EMRI), a phase of steady mass transfer ensues. Over millions of years, the binary evolves to a period minimum before reversing course and migrating outwards as a brown dwarf. Because the time interval between consecutive EMRIs is comparable to the mass-transfer timescale, the semi-major axes of two consecutive mass-transferring EMRIs will cross on a radial scale of less than a few AU. We show that such EMRI crossing events are inevitably accompanied by a series of mildly relativistic, grazing physical collisions between the stars. Each collision strips a small quantity of mass, primarily from the more massive star, which generally increases their radial separation to set up the next collision after a delay of decades to centuries (or longer) set by further gravitational radiation. Depending on the mass of the SMBH, this interaction can result in gas production events of mass , thus powering a quasi-periodic sequence of SMBH accretion-powered flares over a total duration of thousands of years or longer. Although the EMRI rate is 2-3 orders of magnitude lower than the rate of tidal disruption events (TDE), the ability of a single interacting EMRI pair to produce a large number of luminous flares - and to make more judicious use of the available stellar fuel - could make their observed rate competitive with the TDE rate, enabling them to masquerade as “TDE Imposters.” Gas produced by EMRI collisions is easier to circularize than the highly eccentric debris streams produced in TDEs. We predict flares with bolometric luminosities that decay both as power laws shallower than or as decaying exponentials in time. Viscous spreading of the gaseous disks produced by the accumulation of previous mass-stripping events will place a substantial mass of gas on radial scales AU at the time of a given flare, providing a possible explanation for the “reprocessing blanket” required to explain the unexpectedly high optical luminosities of some candidate TDE flares.
Subject headings:
keywords1. Introduction
Compact star clusters around supermassive black holes (SMBHs) in galactic nuclei are the densest known stellar systems in the Universe. Rapid exchange of angular momentum between the stars and stellar remnants in these environments causes stars to be occasionally perturbed onto low angular momentum (“loss cone”) orbits, which bring them near or within the tidal radius of the SMBH.
The vast majority of ill-fated stars descend to the SMBH on nearly parabolic orbits, from initial distances comparable to the parsec-scale SMBH sphere of influence (e.g. Magorrian & Tremaine 1999; Wang & Merritt 2004; Stone & Metzger 2016). Depending on the depth of the pericenter distance relative to the tidal radius, these “plunge” events result in a partial or complete dynamical disruption of the star accompanied by strong tidal compression, a phenomenon commonly known as a “tidal disruption event” (TDE; Hills 1975; Carter & Luminet 1983; Evans & Kochanek 1989; Lodato et al. 2009; Guillochon & Ramirez-Ruiz 2013; Stone et al. 2013). Prompt accretion by the SMBH of the gaseous debris of the disrupted star following a TDE was predicted to power a luminous flare (Rees 1988; Phinney 1989; Ulmer 1999), characterized by a rise time of weeks to months and followed by a power-law decay in the bolometric light curve set by the declining rate of mass fallback at late times.
Despite this initial picture, recent numerical and analytic works have demonstrated that it is non-trivial to circularize the highly eccentric stellar debris streams created by the TDE into the compact accretion disk needed to power a flare (e.g., Hayasaki et al. 2013; Shiokawa et al. 2015; Dai et al. 2015; Hayasaki et al. 2016; Guillochon & Ramirez-Ruiz 2015; Bonnerot et al. 2016; Coughlin et al. 2016; Sa̧dowski et al. 2016; Bonnerot et al. 2017; Tejeda et al. 2017). This has lead to speculation that only a small fraction of TDE are accompanied by luminous flares, with most instead being “dark” (Guillochon & Ramirez-Ruiz 2015; Hayasaki et al. 2016) or producing emission through less efficient mechanisms than standard thin-disk accretion (Shiokawa et al. 2015; Piran et al. 2015; Miller 2015; Metzger & Stone 2016). This possibility is supported by the discrepency between the theoretically-predicted TDE rate (Stone & Metzger 2016; Kochanek 2016) and the lower flare rate observed from optical surveys (e.g., van Velzen et al. 2011; van Velzen & Farrar 2014; Holoien et al. 2016b).
In addition to those stars on parabolic plunges fated to produce TDEs, a smaller fraction approach the SMBH on more tightly bound orbits with lower eccentricities. These “extreme mass ratio inspirals” (EMRIs) have received attention as gravitational wave sources for the Laser Interferometer Space Antenna (LISA; Audley et al. 2017). This is especially true when the EMRI bodies are compact remnants (white dwarfs, neutron stars, and stellar mass black holes) for which tidal forces play little to no role in their inspiral evolution prior to their final plunge into the event horizon (although see Zalamea et al. 2010).
EMRIs of main sequence stars have received comparatively less attention than their compact remnants, in part because matter interactions alter the gravitational wave inspiral signal (Linial & Sari 2017) and thus reduce their potential as pristine probes of general relativity. If a main sequence star approaches the tidal sphere on a nearly circular orbit and begins overflowing its Roche lobe, mass transfer onto the SMBH is stable, resulting in the star being slowly accreted over millions of years (King & Done, 1993; Dai & Blandford, 2013; Linial & Sari, 2017). When the response of the star to mass loss is adiabatic, or once its equation of state becomes dominated by electron degeneracy after it loses sufficient mass, the radius of the star expands and its orbit evolves to larger semi-major axes as a the result of further mass loss. The system may be described during this phase as an extreme mass ratio “outspiral” (e.g., Dai & Blandford 2013; Linial & Sari 2017), similar to the orbital evolution of cataclysmic variables following the period minimum.
The rate of EMRIs due to bodies entering the loss cone via two-body gravitational interactions is estimated to be yr-1 per galaxy (Bar-Or & Alexander 2016; Aharon & Perets 2016; see also Hils & Bender 1995; Sigurdsson & Rees 1997; Freitag 2001; Ivanov 2002; Alexander & Hopman 2003; Hopman & Alexander 2006), roughly orders of magnitude lower than the TDE rate. Due to the effects of mass segregation in nuclear clusters, this rate is also dominated by stellar mass black holes instead of lower mass main sequence stars or white dwarfs (e.g. Hopman & Alexander 2006; Aharon & Perets 2016). Although the eccentricities of these “two-body” EMRIs are much lower than those of the plunge events, they are usually still significant ( on scales of the tidal radius; Hopman & Alexander 2005), such that the fate of most main sequence EMRIs delivered by two-body interactions will also be tidal disruption, though their light curves will differ from canonical TDEs (Hayasaki et al., 2013).
More nearly circular EMRIs are created by the tidal separation of stellar binaries by the SMBH (Miller et al. 2005; Amaro-Seoane et al. 2012). This is the same process hypothesized to produce the cluster of S-stars orbiting Sgr A∗ (e.g., Perets et al. 2009) and hypervelocity stars from our galactic centre (e.g. Hills 1988; Sari et al. 2010). Amaro-Seoane et al. (2012) estimate the rate of circular EMRIs to be yr-1 per galaxy for an assumed binary fraction of (lower than in the field due to the dissociation of the soft binaries in the dense stellar environment of the nuclear cluster). This rate could be up to two orders of magnitude higher in galactic nuclei with large numbers of massive perturbers (Perets et al., 2007) or nuclear spiral arms (Hamers & Perets, 2017).
This work develops an observable consequence of the existence of stable mass-transferring EMRIs, which is closely related to the fact that the lifetime of these systems is comparable to the average time interval between consecutive EMRIs. As we will show, this naturally predicts a collision, or a series of quasi-periodic collisions, between every two inspiraling (or, more typically, one inspiraling and one outspiraling) stars as their semi-major axes cross on a radial scale of few AU. Such collisions, which happen deep within the potential well of the black hole at relative velocities up to several tenths of the speed of light, can seriously damage or completely obliterate both stars, leading to punctuated episodes of sizable gas production.
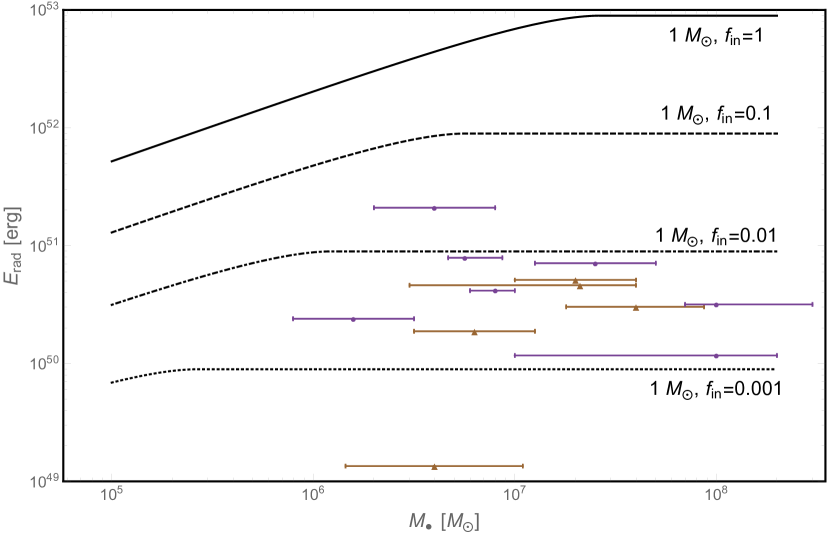
Rapid accretion of this gas by the SMBH powers a single luminous flare, or a series of periodic flares lasting hundreds to thousands of years or longer, caused by multiple grazing encounters between the stars separated by intervals of decades to centuries. Although this emission mechanism is qualitatively similar to the common picture of TDE flares, EMRI collision flares may be observed more frequently than would be naively guessed from the low EMRI rate. This is because standard TDEs may suffer from low radiative efficiencies due either to super-Eddington accretion rates (Ayal et al., 2000; Metzger & Stone, 2016) or, conversely, difficulty circularizing highly eccentric debris streams (Hayasaki et al., 2013; Shiokawa et al., 2015; Guillochon & Ramirez-Ruiz, 2015; Hayasaki et al., 2016; Bonnerot et al., 2016). Indeed, small accreted masses in putative TDE flares are consistent with the low bolometric energy fluences inferred by their optical/UV SEDs relative to the expection of thin disk accretion, as shown in Fig. 2 (though the minority of flares seen to exhibit luminous IR dust echoes may have higher bolometric luminosities; van Velzen et al. 2016). Collisions among circularized EMRIs can make more judicious use of the available stellar mass budget, as accretion rates are generally sub-Eddington and collisionally liberated gas is produced on initially circular orbits.
This scenario raises the possibility that some nuclear transients currently identified as TDE flares may in fact be EMRI collision products, i.e. “TDE Imposters”. Indeed, we show that otherwise puzzling behavior seen in some of these flares, such as light curves which decay exponentially in time rather than as power-laws, may find a natural explanation in the EMRI collision model. Viscous spreading of the accretion disks (out to radial scales of AU) made in regular gas production events over the prolonged interval of the collisional flaring activity also provides an alternative source for the extended reprocessing layer needed to explain the unexpectedly high optical luminosities of many TDE flares.
This paper is organized as follows. In we review the evolution of stable mass transfer from a main sequence star onto a SMBH. In we discuss the conditions required for a collision between two consecutive EMRI stars. In we discuss the observable signatures of such a collision, including periodic flares from SMBH accretion, compare them to the observed population of TDE flares, and discuss the interactions of main sequence EMRIs with bona fide TDEs. In we briefly summarize our conclusions.
2. EMRI Mass Transfer Evolution
We consider stars inspiraling into the SMBH on nearly circular orbits when they reach the point of Roche lobe overflow (RLOF) on radial scales of a few AU (see below). As discussed above, this will not be satisfied for most of the main sequence EMRIs produced by two-body scattering or resonant relaxation, which instead will possess high eccentricies at this separation and will likely undergo tidal disruption.
However, EMRIs created by tidally detached binaries will generally possess lower eccentricities when their pericenters reach these distances (Miller et al. 2005; Amaro-Seoane et al. 2012). Depending on the competition between circularization of the orbit due to gravitational wave emission versus that due to tidal friction, these stars will either undergo tidal disruption or they will end up in circular, stably mass-transferring orbits (see discussion in Amaro-Seoane et al. 2012). We focus on the latter case, which accounts for a large portion of the allowed parameter space for a reasonable range in the theoretically uncertain value of the parameter controlling the rate of tidal circularization.
Once in a nearly circular orbit of semi-major axis , a star of mass orbiting the SMBH of mass loses energy to gravitational wave (GW) emission on the timescale
| (1) |
to lowest post-Newtonian order. Here , , AU, and we have written the gravitational constant and the speed of light as and , respectively.
The size of the star’s Roche lobe in the extreme mass ratio limit is given by (Eggleton 1983)
| (2) |
This becomes equal to the radius of the star below a critical semi-major axis
| (3) | |||||
where in the second line we have used a mass-radius relationship appropriate for low mass main sequence stars (Kippenhahn & Weigert, 1990). Below a critical black hole mass , the star overflows its Roche lobe outside the innermost stable circular orbit (ISCO) for a Schwarzschild black hole.
The GW inspiral time at Roche contact is
| (4) |
Following Roche overflow, the star loses mass, primarily through the inner L1 Lagrange point, at a characteristic rate,
| (5) |
As the star loses mass, its radius changes according to , where the value of depends on the properties of the star and its response to mass loss (see below).
Combining the above results, one finds
| (6) |
where is the initial mass of the star. For a fixed value of , this results in the following evolution as a function of time after the onset of Roche-lobe overflow,
| (7) |
| (8) |
In reality, the value of evolves in time as the star loses mass. Following Linial & Sari (2017), for stars of initial mass , we have the following evolution
| (9) |
where is the critical mass at which the GW loss timescale equals the Kelvin-Helmholtz cooling timescale . Stars with masses initially above this critical mass evolve close to the main sequence (), before evolving with at lower masses, with or , depending on whether the stellar envelope is radiative or convective. In the final line of equation (9), we have taken for stars below the hydrogen fusion limit to account for the radius being approximately independent of mass from brown dwarfs to Jupiter scale planets (e.g. Chabrier et al. 2009).
The above analysis assumes that mass transfer is stable, as occurs when upon mass loss the radius of the star decreases faster than its Roche lobe radius. Mass loss from the star feeds an accretion disk around the SMBH. A common assumption is that the gas disk transfers most of its angular momentum back to that of the orbit , which is therefore conserved333In this stability analysis we are focusing on timescales much shorter than , and therefore neglect angular momentum loss to gravitational radiation.. Since
| (10) |
we see that stable mass transfer requires in the conservative case, as is satisfied for all stages of evolution given in equation (9). Even if no angular momentum is placed back into the stellar orbit, still increases upon mass loss at fixed for , as will be satisfied until the period minimum is reached and .
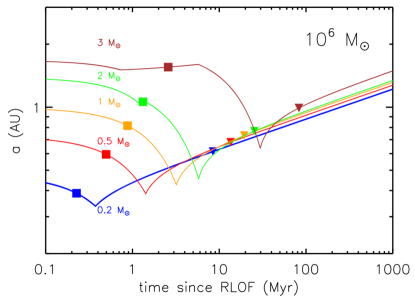
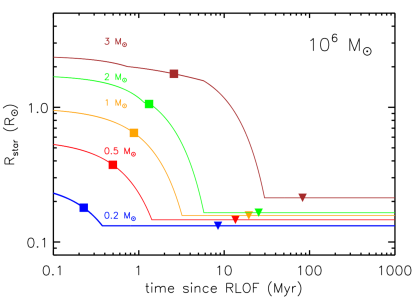
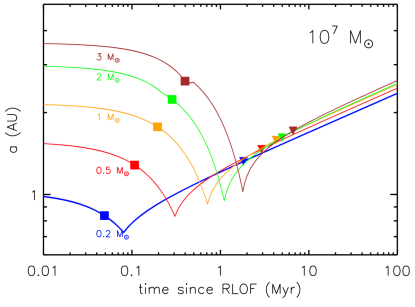
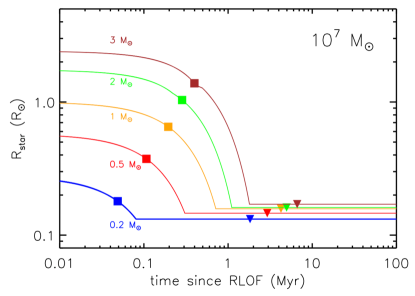
Figure 2 shows the evolution of the semi-major axis and stellar radius after RLOF contact as a function of time for SMBHs of mass (top panel) and (bottom panel). Squares and triangles denote, respectively, the point at which the stellar mass has decreased to one half and one tenth of its initial value.
Low mass stars lose half their mass in Myr, while higher mass stars require Myr to do the same. These timescales decrease with increasing SMBH mass, approximately as (eq. 4). Throughout most of their inspiral evolution, stars evolve from large to small semi-major axis in the convective regime , and their semi-major axis evolves on a characteristic timescale (eqs. 7, 8)
| (11) |
This timescale is larger by a factor of than the inspiral time which occurs prior to the onset of mass transfer (eq. 4).
At late times following the period minimum (), the orbit evolves to larger radii as while the mass decreases as . This relatively slow rate of outspiral implies that the star (now technically a brown dwarf) will retain substantial mass of for a period of time Myr. As we discuss below, even such a low mass (but high density) object is sufficient to damage or disrupt a more massive star in a collision given the enormous orbital velocities on these radial scales.
3. Collision Between Successive EMRIs
Main sequence EMRIs which undergo stable mass transfer are estimated to occur in galactic nuclei at the rate yr-1 (Amaro-Seoane et al. 2012). The timescale between consecutive EMRIs of Myr is therefore comparable to the slow outspiral timescale of a star undergoing RLOF (Fig. 2). This implies the probable existence at any time in a galactic nucleus of a star or brown dwarf undergoing mass transfer evolution (e.g. Linial & Sari 2017). It also raises the possibility for a strong interaction or collision between successive inspiraling/outspiraling EMRIs.
Based on the semi-major axis evolution (Fig. 2) and the initial mass function of stars, one common way a collision could occur is between a star of initial mass which has already already transferred most of its mass and is now migrating outwards as a brown dwarf of mass and radius , and another star of similar initial mass and radius which has also begun RLOF but is still moving inwards and thus would cross the orbit of at a distance of AU with most of its initial mass still intact. We consider this example as a fiducial case. Note that, at the point of a collision, each star fills its Roche lobe and shares approximately the same semi-major axis; therefore the mean densities of the stars when they are interacting are equal, i.e.
Our analysis in assumes conservative mass transfer, which does not account for self-interaction between two EMRIs undergoing Roche-lobe overflow. For instance, if the accretion disk of the more massive inspiraling star interferes with the ability of the less massive star’s disk to feed its angular momentum back into the orbit, this could destabilize the orbit of the outspiraling brown dwarf (because during the outspiral phase). It is well beyond the scope of this paper to address the complex interplay between mass transfer in three body systems, and so we leave this issue to future work. However, we note that if the EMRI rate is higher than we have assumed (e.g. yr-1 due to the influence of massive perturbers; Perets et al. 2007) then even a collision between two consecutive stars which are still inspiraling () may occur as the more massive star overtakes a less massive one. Although the radial migration rate of the stars would differ in this case than the precise evolution predicted in , the qualitative collisional interaction we describe hereafter would not be altered.
Given the high rate of EMRIs of stellar mass black holes compared to those of main sequence ones, direct interactions between between inspiraling black holes and stars could be more common than star-star collisions. However, we show in Appendix A that the collision velocity is so high that the tidal or accretion interaction between the star and the black hole passing through it is probably too small to influence the evolution of the star appreciably.
3.1. Conditions for a Collision
Neither the orientation of the orbital plane or the orbital phases of the two stars will in general be aligned as they approach each other. However, a physical collision444The orbital velocities of the stars greatly exceed their surface escape speeds, so that the effect of gravitational focusing on their cross section is negligible. is still possible once the semi-major axes of the stars cross near a value AU (eq. 3), as illustrated in Fig. 3.
We may neglect the comparatively slow outward radial motion of compared to the faster inspiral of : the less massive can viewed as radially stationary for purposes of their interaction. The more massive star migrates inward a distance on a timescale given by , where is the characteristic inspiral time assuming that is undergoing mass transfer (eq. 11). The number of orbits of period required for to migrate radially by is therefore
| (12) | |||||
where .
Stars on orbits with precisely the same semi-major axis would possess identical orbital periods, modulo tiny reduced mass differences , and thus cannot collide. However, stars on orbits with a small but finite semi-major axis difference are still able to produce a physical collision, as their periods differ by an amount and thus will share the same orbital phase, on average, after orbits.
A physical collision requires not only that both stars cross the same orbital phase, but also that their orbital planes cross at this phase, i.e. that they reside within a distance of the line of ascending nodes of relative to the orbital plane of , where is the approximate length parallel to the surface of at times when the radial depth of into the atmosphere of is ( is also the impact parameter of the collision; see Fig. 3). This coincidence will occur only a fraction of the times the phases cross, where the factor of 2 accounts for the two locations where the orbital planes cross.
Combining results, the number of orbits required for a physical collision - once their separation is sufficiently small to enable one - is given by
| (13) | |||||
The requisite condition for a single collision to occur before radially migrates past is that for , , and , where
| (14) |
The fact that this ratio exceeds unity is a key result. It shows that at least a single collision between the two stars is likely for all SMBH masses of interest .
3.2. Outcome of Stellar Collision
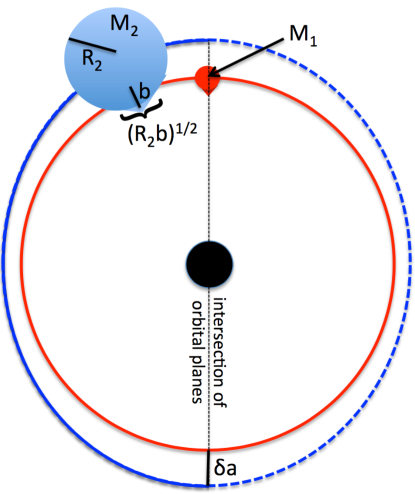
We define the collision impact parameter as the distance measured from the center of to the outer edge of (Fig. 3). The impact parameter of the first collision will on average be equal to half the inward radial distance traveled between collisions. This value is found by equating using equation (14) and assuming a grazing encounter , . This gives a value
| (15) |
which is typically a few percent of the radius of . In most cases of interest and hence will just graze the surface layers of instead of punching through its envelope at greater depth.
The orbital velocity at the time of collision is a mildly relativistic555As noted before, in this work we treat the orbital dynamics of EMRI collisions in a primarily Newtonian way, which is accurate to leading order aside from the issue of nodal precession - which we account for in the post-Newtonian approximation. However, circular orbit speeds may motivate future, fully general relativistic treatments of this scenario.
| (16) |
Depending on the mutual inclination angle of the orbital planes of with respect to that of , the collision will occur at a relative speed
| (17) |
This value ranges from for a head-on collision to for a tail-on collision. Assuming an isotropic distribution of inclination angles, we find an average value of .
Tidal forces between the passing stars impart modest accelerations because the collision velocity is typically two to three orders of magnitude higher than the surface escape speeds of the stars (see Appendix A for further discussion). However, the direct, albeit grazing, physical collision between the surfaces of the stars will result in powerful shock heating, leading to gaseous mass loss. Quantifying the collision properties, such as the total ejecta mass and its dependence on the impact parameter , would require 3D hydrodynamical simulations well beyond the scope of this work. Numerical simulations of stellar collisions exist in the literature (e.g. Freitag & Benz 2005), however these are generally for much lower velocities than considered here and do not involve stars which already fill their Roche surfaces. In what follows, we instead provide a rough analytic estimate of the mass loss and its impact on the subsequent evolution of the stars. This crude treatment is justified in part because our qualitative conclusions are insensitive to the precise amount of mass loss per collision.
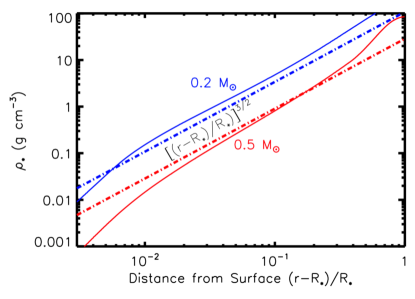
We approximate as a polytrope of index appropriate for a lower main sequence convective star, in which case its density at a depth from its outer edge is very approximately given by
| (18) |
as is shown in Fig. 4. A larger value of would be appropriate for the outer layers of stars with radiative envelopes (such as main sequence stars more massive than the Sun), but the subsequent treatment is easily generalized. We neglect non-spherical distortion of the star caused by its Roche-lobe filling shape.
The drag force on as it grazes the atmosphere of is approximately , where is the effective cross section of the encounter, assuming (Fig. 3). The energy dissipated by shock heating as passes across the distance through is therefore
where in the second line and hereafter we take . This energy is usefully compared to the gravitational binding energy of the stars
| (20) |
The ratio of the collision heating energy to the binding energy of is given by
| (21) | |||||
where in the second line we have used the characteristic impact parameter (eq. 15) of the first collision.
We expect complete disruption of the star if . This occurs for collisions with impact parameter well above a critical value given by
| (22) |
where we have taken . This condition is achieved in the first collision (; eq. 15) if the SMBH mass greatly exceeds a critical value
| (23) |
For we instead have and both stars will instead survive the first collision at least partially intact. Although the above calculation is quite approximate and should be refined by future hydrodynamical simulations, the steep scaling indicates two clear regimes for EMRI collisions: around larger SMBHs, a first encounter is likely destructive, while many encounters can occur around smaller SMBHs.
Any collision will result in some mass loss from both stars. We assume that most of the total mass loss originates from the more massive star , motivated as follows. As passes through the outer layers of , the ram pressure of the interaction will drive dual shocks, through the outer layers of both stars. However, the density of at the collision depth is typically 2 orders of magnitude or more lower than the density of (both stars have equal mean densities, but the collision occurs comparatively closer to the surface of than ). Since the shock through will move with a velocity larger by a factor of ( than the shock through and thus will carry an energy flux larger by the same factor of (which generally is comparable to or exceeds the ratio of the gravitational binding energy of the two stars).
In what follows, we make the crude approximation that the fractional mass lost from by the collision, , is equal to the ratio of shock-deposited energy to the gravitational binding energy. In other words, we take
| (24) |
as given in equation (21). Equivalently,
| (25) |
Eq. 24 provides only a rough upper limit on ; the true amount of mass loss could be significantly lower if low-density outer layers of are ejected at speeds . As we discuss in , our results for the long-term evolution of the stars are not qualitatively altered if the mass loss per collision is substantially lower than this maximum (though the range of SMBH masses responsible for the most interesting behavior will shift to higher values).
3.3. Multiple Collision Evolution
If the stars survive their first collision (, ), then it is natural to ask whether and when subsequent collisions will occur. Will the stars collide again immediately, on the next orbit, or only after a significant delay required for the orbital phases to realign?
The semi-major axes of and differ by at the time of the first collision, and hence their orbital periods differ by a factor . The stars therefore accumulate a per-orbit phase difference of , which is coincidentally comparable to the maximum phase difference between the stars that allows for a collision at the common line of ascending nodes, . Therefore, we conclude that the second collision will not generally occur on the next immediate orbit, but will instead be delayed by at least another (eq. 13) orbits, corresponding to a minimum time delay of
| (26) |
Even were this differential phase accumulation insufficient to prevent an immediate second collision, Lense-Thirring precession would cause the angular momenta of the stellar orbits to precess rapidly about the spin axis of the SMBH. This will advance the line of nodes of each orbit by a large fractional angle. At leading post-Newtonian order, and assuming circular orbits, this angular shift is (e.g., Merritt et al. 2010)
| (27) |
where and is the dimensionless spin parameter of the SMBH.
Over the minimum time interval before the second collision , GW radiation will move closer to on average by a distance (eq. 15). If this were the whole story, then according to equation 3.2, one would expect the impact parameter of the second collision to be times higher than the first and (according to equation 3.2) the energy released to be times stronger. Likewise, the third collision would be times stronger than the second, and so on; this sequence would rapidly terminate in a single, final, disruption once (eq. 22).
However, this simple runaway argument neglects the impact of mass loss on the radial separation between the stars.666Change in the orbital energy due to collisions will cause the orbits of both and to acquire mild eccentricities. However, the magnitude of the collision energy required to induce even a small eccentricity is comparable to the binding energy of the stars. Under adiabatic mass loss, the radius of each star will expand slightly according to (for assumed adiabatic index ). More importantly, the semi-major axis of each star will increase by a much larger amount This expression assumes conservative mass transfer: the gaseous disk created by the collision transfers its angular momentum back into the orbit of the mass-losing star with high efficiency.
Given our expectation that the fractional mass loss from will exceed that from , the main effect on the system is to increase the semi-major axis of - and thus the radial separation of the orbits of and - by an amount
| (28) |
Again, our assumption is that most of the angular momentum lost by is placed back into its orbit, as opposed to the orbit of . This is justified by our expectation that most of the mass loss from , despite being struck obliquely by , will nevertheless occur quasi-isotropically, forming a gaseous disk which lies in roughly the same orbital plane of .
Since this change in separation between the stars is typically much larger than the characteristic impact parameter of the first collision (eq. 15), this will introduce an additional delay until the next collision beyond the minimum value (eq. 26) set by the double alignment of orbital phase and nodal line. Specifically, the time required to traverse this distance through gravitational wave radiation is
Here we have used equations (21,24) and have calculated the GW inspiral time neglecting mass transfer effects (eq. 1) because, for most of its inward return, is no longer overflowing its Roche Lobe (though we have retained the dependence on the impact parameter ). This delay could be substantially shorter than estimated here if the mass loss per collision is much less than (24).
After this inspiral, the characteristic impact parameter and mass loss of each such collision will be similar to the first one, . Each collision will also release a comparable amount of mass as the first (eq. 25). Neglecting slow changes to the stellar properties caused by the collisions, the star will be completely destroyed over a total number of collisions very approximately given by
| (30) | |||||
This number is for low mass SMBHs and approaches unity for (eq. 23). For , the total duration of the interaction is just given by the gravitational wave inspiral time
| (31) |
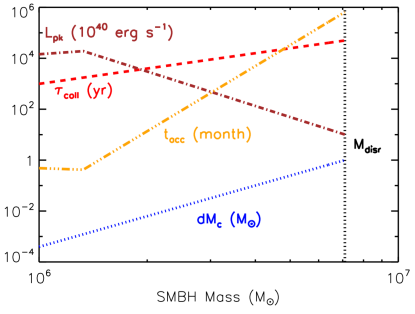
which ranges from yr, depending on the SMBH mass. These different regimes of collisions are summarized in Figure 5.
4. Transient SMBH Accretion Events
We have shown that collisional evolution between consecutive stellar EMRIs around SMBHs of mass can result in repeated, prompt episodes of gas formation; the colliding stars liberate a mass , on a radial scale of AU, at periodic intervals of decades to centuries or longer, and lasting for a total duration of up to a million years. We now describe the observable signatures of these punctuated episodes of gas production.
By equating the thermal energy released per unit volume with the specific heat of radiation-dominated matter, , the immediate temperature of the shocked stellar material is K even for a head-on collision, too low to result in nuclear burning up to 56Ni. Without such a radioactive heating source, the expanding ejecta will cool rapidly via adiabatic expansion before becoming transparent and radiating the remaining thermal energy. This will produce a dim rapidly-evolving transient which would itself be very challenging to detect (see also Balberg et al. 2013).
A more important source of luminosity is the gravitational energy liberated by the accretion of the gaseous ejecta onto the SMBH. The ejected gas will possess an angular momentum similar to that of the stars, resulting in the formation of circular disk on a similar radial scale of . Internal stresses (likely magneto-turbulent in origin) within the accretion flow will transport this angular momentum outwards, allowing the gas mass to accrete inwards on the characteristic accretion timescale
| (32) |
where is the orbital angular velocity of the disk, is the Shakura-Sunyaev viscosity parameter, and is the vertical scale height of the disk.
Following deposition of the gaseous material, the accretion rate will quickly rise to a peak value of (Pringle 1981). For a radiation-pressure dominated disk with electron scattering opacity , the vertical scale-height of the disk obeys cm, where g s-1 is the Eddington accretion rate for radiative efficiency . Combining results, we find that
| (33) |
with
| (34) |
and
| (35) |
The resulting peak accretion luminosity is given by
| (36) | |||||
where we have assumed a radiative efficiency .
For a characteristic value of , as is expected in our fiducial models for (eq. 25), we predict accretion-powered transients of peak luminosity erg s-1 and characteristic timescales . However, these properties scale sensitively with SMBH mass.
These precise scalings, in particular the unintuitive inverse relationship between peak accretion rate and gas disk mass, must be taken with caution. It is well known that the thermal and viscous stability of radiation pressure dominated disks remains an open issue (e.g. Hirose et al. 2009; Jiang et al. 2016; Sa̧dowski & Narayan 2016), and the true behavior of these disks could differ significantly from the expectations of the -models.
The evolution of the accretion rate at times after the peak () depends on the interaction between the outer edge of the gaseous disk and the stars. If most of the angular momentum of the disk is transferred back into the stellar orbit, then - in contrast to circularized TDE disks (Cannizzo et al., 1990) - the disk will not freely spread outwards beyond the orbit of the star. In this case the accretion rate will decay exponentially on a timescale set by the initial viscous timescale , i.e. we expect a bolometric light curve of the form
| (37) |
On the other hand, a portion of the disk may be free to viscously spread outwards beyond the orbit of the star. This could occur if the angular momentum of the gas produced by the collision places it into an orbital plane significantly different either star. It could also occur if the Bardeen-Petterson effect (Bardeen & Petterson, 1975) aligns the disk into a different plane from both stars on a timescale short compared to the disk evolution timescale; such misalignment could also be accomplished by differential nodal precession between stellar orbits and the disk. In this case, the mass accretion rate would instead decay at late times as a power-law, , where (e.g. Cannizzo et al. 1990; Shen & Matzner 2014), although we caution that this evolution could be complicated by possible thermodynamic state changes from radiation-pressure to gas-pressure dominated regimes (Shen & Matzner 2014). In both cases, the predicted evolution differs from the canonical prediction for the late-time decay of the mass fall-back rate in TDEs.
4.1. TDE Imposters
The flare timescales and bolometric luminosities we predict from colliding main sequence EMRIs overlap with those of observed tidal disruption flare candidates (Komossa 2015). However, unlike TDEs, which are singular events, a colliding EMRI pair may produce hundreds or thousands of mass production events (eq. 30). This large number may be sufficient to at least partially overcome the order of magnitude deficit between the predicted TDE and circular EMRI rate, allowing flares of the collisional EMRIs described here to be detected. This would especially be true if a large fraction of TDEs are “dark” due to inefficiency associated with accretion at super-Eddington rates (Strubbe & Quataert 2009; Metzger & Stone 2016) or the process of debris circularization of the highly elliptical streams produced in most TDEs (Guillochon & Ramirez-Ruiz 2015; Dai et al. 2015; Hayasaki et al. 2016).
The total radiated energy inferred from optical TDE candidate flares ranges from erg for iPTF16fnl (Blagorodnova et al. 2017) and erg for PS1-11af (Chornock et al. 2014) to values up to times higher, as compiled in Figure 2. These radiated energies correspond to accreted masses in the range for an assumed radiative efficiency of . These often low radiated energies have been described as a “missing energy problem” (Piran et al., 2015), though this problem has many possible resolutions in the TDE paradigm, including low accretion or radiative efficiencies in TDEs (e.g. Piran et al. 2015; Metzger & Stone 2016), large bolometric corrections (van Velzen et al., 2016), or the lower accreted mass of a partial tidal disruption event (Chornock et al., 2014).
Alternatively, these low radiated energies may indicate that some of the observed TDE candidates are in fact just one in a sequence of quasi-periodic EMRI collision flares, each producing a low-mass accretion transient. One way to distinguish these scenarios is to search for additional flares from the same galactic nucleus after the initial burst. The required wait time will usually be too long to serve as a definitive test (up to for fiducial parameters; see eqs. 26, LABEL:eq:taucoll), though because and , repeated flares can happen on timescales shorter than a decade if the victim star is a few times the mass of the Sun, or is a sub-solar mass star that has bloated due to shock heating. A shorter flare duration would occur if the mass loss per collision is much less than our conservative upper limit on its value (eq. 24).
The accretion timescale of the gaseous disks produced by stellar collisions, (eq. 35), is short compared to the interval between consecutive collisions. This implies that the light curve would appear as periodic spikes in luminosity, separated by quasi-periodic intervals ranging from decades to hundreds of millenia. Such quasi-periodic flaring may have been observed in IC3599, a Seyfert galaxy which produced a large-amplitude nuclear X-ray outburst in the 1990s (Brandt et al. 1995; Grupe et al. 1995), initially interpreted as a TDE. However, IC3599 was then observed to repeat its flaring behavior (Grupe et al., 2015; Campana et al., 2015). Based on modeling the light curves and disk temperature evolution, Campana et al. (2015) claim the existence of 3 outbursts with a separation of 10 years, each reaching a luminosity of erg s-1.
Individual flares produced from EMRI collisions may also be distinguished from standard TDE flares by differences in the predicted late-time light curve decay. In cases when the orbits of the surviving stars absorb angular momentum from the gaseous disk, we could expect the light curve to decay exponentially at late times (eq. 37), a feature which may in fact be observed some TDE flares (e.g., NGC 247, Feng et al. 2015; ASASSN-14li, Holoien et al. 2016b; iPTF16fnl, Blagorodnova et al. 2017). On the other hand, if a sizable fraction of the gas from the collision is able to viscously spread beyond the orbits of the stars, we would expect a power-lower light curve decay shallower than the canonical fall-back rate. Such shallow decays are inferred from the X-ray sample of TDE flares compiled by Auchettl et al. (2017).
One of the most puzzling mysteries of optical TDE candidates concerns their observed color temperatures, which are roughly an order of magnitude lower than those predicted from compact disk emission models (e.g., Gezari et al. 2012; Cenko et al. 2012; Holoien et al. 2016b), which should instead peak in the extreme UV/soft X-ray band (corresponding to the disk temperature at ). One explanation for this behavior is the existence of a dense layer of gas on radial scales AU, which reprocesses much of the accretion power to lower frequencies (Loeb & Ulmer 1997; Roth et al. 2016). In TDE scenarios, this reprocessing material could be the result of a super-Eddington wind (Metzger & Stone 2016) or highly eccentric, inefficiently circularized debris streams produced during the disruption process (e.g., Guillochon et al. 2014; Miller 2015).
A radially extended gaseous disk is also expected to arise naturally in the EMRI collision scenario, and could provide an alternative reprocessing screen. As discussed above, the gaseous disk deposited by a given collision at AU will in some cases carry its angular momentum outwards by viscously expanding (Cannizzo et al., 1990) beyond the orbits of the stars. Since total angular momentum is roughly conserved in this process, the disk mass which remains when the outer edge of the disk reaches a radius is . The timescale for the gas from a collision event to reach AU by viscous spreading is yr (Cannizzo et al., 1990; Shen & Matzner, 2014), many orders of magnitude longer777The disk evolution slows considerably once the midplane transitions from being radiation pressure dominated to being gas pressure dominated (e.g. Shen & Matzner 2014). than the initial viscous timescale (flare time) and potentially comparable to the entire duration of the collisional interaction between the stars, (eq. 31).
The accumulation of spreading disks produced by each of the hundreds to thousands of collisions which occur prior to a given typical collision could therefore place up to over radial scales of AU, potentially sufficient to explain the observed reprocessing (Roth et al., 2016). Due to Lense-Thirring precession of the stellar orbits, the collision plane will rotate between subsequent encounters around the SMBH spin axis (eq. 27), such that each gaseous disk would be created with its angular momentum pointed in a significantly different direction. However, differential Lense-Thirring precession will generally align each transient disk with the SMBH equatorial plane (Bardeen & Petterson, 1975), leading to a larger scale accretion flow that is coplanar.
Once UV/X-ray irradiation from the flare intercepts the geometrically thin disk, the resulting heating will cause it to puff up vertically, blocking a larger fraction of the light than it would have given its initial vertical thickness. If the timescale for the collision evolution is sufficiently long, with yr (eq. 31), then gas accretion from a TDE in the same nucleus might destroy the fossil disk (). However, in this case the viscous spreading-evolution of one (or several consecutive) TDE disks could itself deposit sufficient mass on large scales to replenish the repocessing disk. Thus, our new proposed scenario for the reprocessing layer is largely independent of the EMRI collision scenario, and could also apply to galaxies with a high TDE rate.
This fossil reprocessing disk could also serve as source of magnetic flux, to be swept towards the black hole by the debris from future TDEs (Tchekhovskoy et al., 2014; Kelley et al., 2014), explaining why some TDEs are able to produce powerful magnetically-dominated jets (Giannios & Metzger 2011; Tchekhovskoy et al. 2014; Kelley et al. 2014).
4.2. Gas Ablation in True Tidal Disruption Events
The rate of TDEs around small SMBHs is typically , with a scatter of about an order of magnitude depending on the detailed properties of the specific galaxy (Stone & Metzger, 2016). Given that this exceeds our fiducial rate of circular EMRI inspirals by a factor of , the first mass-transferring star must survive this many gas production events in a galactic nucleus in order to undergo the collisional evolution described in this paper. This section considers whether such survival is feasible in the face of mass loss due to shock-heating from the interaction between the star and the gaseous TDE accretion disk.
The TDE results in a transient accretion event of duration months and average mass accretion rate , where is the total accreted mass. The star’s semi-major axis distance is comparable to the tidal radius of a disrupted star, and the midplane density of the gaseous TDE disk at this location is approximately given by
| (38) |
where we have used the standard relationship for a steady-state disk with viscosity .
In general the orbital plane of the gaseous disk will not be aligned with that of the star, and so the star will be impacted by a “headwind” of gas at a relative velocity up to twice the orbital velocity . The shock created by the interaction of the star with the gaseous disk will ablate mass stellar mass.
The shock will penetrate to a depth inside the star approximately given by equality between ram pressure and the interior pressure of the star,
| (39) |
where is the mean stellar density and for a polytrope. The shocks thus initially penetrate to a depth where the stellar density equals
| (40) |
While the star is within the gaseous disk, the shocks will cause mass ablation from its surface. The maximum rate of mass ablation is approximately equal to the rate at which gas passes through the shock,
| (41) |
where is the cross section of the star and is the velocity of the shock bring driven into the star (McKee & Cowie 1975).
Combining results, we find that the minimum timescale for the star to be destroyed by ablation is given by
where is the fraction of the star’s orbit spent in the midplane of the disk, and in the final line we have substitute in equation (40). A stellar orbit misinclined relative to the plane of the disrupted star will have , while one close to the same orbital plane would have .888However, may change even during the TDE itself due to Lense-Thirring precession of the stellar orbit (eq. 27).
We thus see that for fiducial parameters, and thus the star should survive at least one TDE intact. However, the outcome is sensitive to the precise semi-major axis of the star and the total gas mass accreted in the TDE, , which could be as low as (Fig. 2; Metzger & Stone 2016), in which case would be larger by significant factor. Also note that equation (4.2) is likely a lower limit on the ablation timescale, because not all matter which passes through the shock will necessarily become unbound from its surface. This is because the specific thermal energy imparted to the shocked gas may be comparable to the gravitational binding of the star ; gas stripped from the stellar surface may therefore accumulate in a wake behind the star to become re-accreted once the flare ceases.
What is less clear from the above numbers is whether the outspiraling brown dwarf can survive the large number of expected collisions during its lifetime. Once a second EMRI arrives on a quasi-circular orbit, the period of the collisional interaction is (Eq. 31). During this period, the expected number of TDEs is (Stone & Metzger, 2016). Large portions of this range are likely surviveable for the brown dwarf. The greater challenge for the brown dwarf is surviving long enough to greet an arriving second EMRI. The fiducial circular EMRI rate of would require the brown dwarf to survive tidal ablation events, which will be much more challenging (Eq. 4.2). However, we note that this fiducial circular EMRI rate could be enhanced by up to two orders of magnitude if binary orbits are perturbed outside the SMBH influence radius by massive objects (e.g. giant molecular clouds; Perets et al. 2007) or non-axisymmetric components of the galactic potential (Hamers & Perets, 2017). The large estimated galaxy-to-galaxy scatter (at fixed SMBH mass) in the classical TDE rate (Stone & Metzger, 2016) is not necessarily correlated with the comparably large scatter in the circular EMRI rate (as most of the TDEs are sourced from scales, while tidally detached binaries can come from much larger distances), making it likely that at least a subset of galactic nuclei will produce EMRI collisions which are not seriously inhibited by ablation from interloping TDEs.
5. Conclusions
The inevitability of stellar collisions in galactic nuclei is well-documented (e.g. Ginsburg & Loeb 2007; Antonini et al. 2010; Balberg et al. 2013; Leigh et al. 2016). However, past work has focused on singular collisions, or mergers of stars on eccentric orbits located far outside the tidal radius of the SMBH. Given the relatively large radius of gas produced in such collisions, any resulting accretion-powered flare produced by these collisions would probably be slowly evolving and very dim.
Here we have explored a very different scenario: mildly relativistic physical colllisions between two (initially) main sequence stars on circular EMRI orbits undergoing stable Roche-lobe overflow. Focusing on the probably most common case of an inspiraling, low mass main sequence star interacting with an outspiraling brown dwarf, we have shown that at least a single collision between the stars is inevitable, when they occupy the same orbital phase at the line of nodes where their orbital planes cross (Fig. 3).
The initial collision is generally grazing. Although only a tiny fraction of the stars’ surfaces geometrically intersect, the enormous relative velocities () cause massive shock heating of the stellar atmospheres. When the mass of the SMBH , this heating is insufficient to destroy the stars in a single encounter, and only a small fraction of the stellar mass is liberated, primarily from the more massive star. This mass loss produces a gaseous accretion disk, which feeds the SMBH and causes a transient electromagnetic flare, potentially similar in appearance to observed candidate TDE flares. Mass loss from the collision also causes the orbital semi-major axis of the outer star to expand, separating it from the orbit of the inner star and delaying the next interaction for at least a decade and perhaps many millenia; the stars must wait for gravitational wave inspiral to realign their orbits before they can once again collide. The net result of the ensusing string of grazing collisions is a “death by a thousand cuts,” producing a series of quasi-periodic accretion-powered flares, over a total duration of thousands of years or longer. Conversely, if , the first collision is likely powerful enough to completely destroy one or both stars; the ensuing flare will be more analogous to a classical TDE.
Although our estimates for the amount of shock heating and the resulting mass lost in grazing stellar collisions are crude, we expect that the qualitative features of the evolution described above should be qualitatively robust. If the mass loss is smaller (larger) than we have assumed, this will simply increase (decrease) the total number of collisions before the stellar mass is eroded and decrease (increase) the interval between the collisions. Future hydrodynamical simulations will better quantify the outcome of mildly relativistic stellar collisions and allow for a more accurate calibration of our model. Future simulation work is also needed to quantify the fraction of the angular momentum of collisionally liberated gas which is fed back into the stellar orbit, accounting for the possible role of Lense-Thirring precession both on the disk and stellar orbits.
Because the lifetime of the mass transfer evolution is comparable to the expected interval between EMRIs, colliding EMRI chains should occur at a rate comparable to the circular EMRI inspiral rate of yr-1 per galaxy (Amaro-Seoane et al., 2012). Although this is still 2-3 orders of magnitude smaller than the predicted or observed TDE rate, we nevertheless conclude that collisional EMRIs can still contribute an appreciable fraction of the observed TDE rate, serving as “TDE imposters.” This is because a given collisional interaction may produce a number of gas production events (eq. 30) each of mass . If accreted with high radiative efficiency, the luminosities produced after each collision could well explain those of many observed TDE flare candidates.
Unlike in TDEs, the stellar debris from colliding EMRIs is tightly bound to the SMBH, allowing it to avoid the theoretically uncertain and perhaps lossy circularization process required to accrete highly eccentric TDE debris streams. Our model provides a natural explanation for some flare light curves which appear to decay exponentially (e.g. iPTF-16fnl; Blagorodnova et al. 2017), or as power-laws shallower than , depending on how efficiently the gas angular momentum liberated in the collision is fed back into the stellar orbit. Viscous spreading of the gaseous disks produced by previous collisions in the chain can also provide a natural supply of radially extended, dense gas around the site of future collisions or TDEs, providing a possible medium for reprocessing the UV/X-ray accretion luminosity down to optical frequencies.
Future work is required to explore this new transient scenario in greater detail. The rates of quasi-circular stellar EMRIs are quite uncertain, and hydrodynamic simulations are required to better understand mass loss in mildly relativistic stellar collisions. They are also required to confirm whether Roche-overflowing stars can survive the substantial gas ablation expected during the many TDEs experienced between collisional interaction events (). A population study of colliding EMRIs with a realistic distribution of initial stars and orbits would provide more accurate statistics on the expected range of outcomes. Also deserving of future study is the role of stellar-mass black hole EMRIs, which should periodically pass through the main sequence EMRIs over the course of their mass-transfer evolution (Appendix A).
Appendix A Appendix A: Black Hole-Star Interactions
Due to mass segregation in galactic nuclei, EMRIs of stellar-mass black holes are probably more common than those of main sequence stars. For this reason, black hole-star “collisions” could be more common than the star-star collisions focused on in this paper. However, the effect of a BH piercing through a star which is parked in a mass-transferring orbit will likely be small.
First consider the energy imparted to the star by the tidal forces of the black hole. The momentum and velocity change imparted as the black hole of mass passes the star at a characteristic distance of is estimated in the impulse approximation by the gravitational force times the fly-by time, . The ratio of the deposited energy to the gravitational binding energy of the star, , is given by
| (A1) |
where km s-1 is the escape speed from the star. For typical parameters of (eq. 16) and , this ratio is less than a percent. Due to the higher mass of the black hole, it will migrate radially through the orbital radii occupied by the star star due via gravitational waves at a rate which is time faster than a star of mass , such that the number of close encounters (eq. 14 for , ) will typically be a modest .
The amount of stellar gas accreted by the black hole during the interaction will also be negligible. While passing through the star, the black hole will accrete at a rate which is at most the Bondi-Hoyle rate , where is the typical stellar density encountered by the black hole. The maximum mass accreted during a single passage of duration is thus , corresponding to a fraction of the star
| (A2) |
For typical parameters one finds , in which case even hundreds of collisions would not substantially erode the mass of the star.
Finally, we note that Eq. A1 predicts even weaker tidal perturbations in the canonical scenario of this paper, where the perturber is a low mass brown dwarf rather than a stellar mass BH.
References
- Aharon & Perets (2016) Aharon, D., & Perets, H. B. 2016, ApJ, 830, L1
- Alexander & Hopman (2003) Alexander, T., & Hopman, C. 2003, ApJ, 590, L29
- Amaro-Seoane et al. (2012) Amaro-Seoane, P., Miller, M. C., & Kennedy, G. F. 2012, MNRAS, 425, 2401
- Antonini et al. (2010) Antonini, F., Faber, J., Gualandris, A., & Merritt, D. 2010, ApJ, 713, 90
- Arcavi et al. (2014) Arcavi, I., et al. 2014, ApJ, 793, 38
- Auchettl et al. (2017) Auchettl, K., Ramirez-Ruiz, E., & Guillochon, J. 2017, ArXiv e-prints, arXiv:1703.06141 [astro-ph.HE]
- Audley et al. (2017) Audley, H., et al. 2017, ArXiv e-prints, arXiv:1702.00786 [astro-ph.IM]
- Ayal et al. (2000) Ayal, S., Livio, M., & Piran, T. 2000, ApJ, 545, 772
- Balberg et al. (2013) Balberg, S., Sari, R., & Loeb, A. 2013, MNRAS, 434, L26
- Bar-Or & Alexander (2016) Bar-Or, B., & Alexander, T. 2016, ApJ, 820, 129
- Bardeen & Petterson (1975) Bardeen, J. M., & Petterson, J. A. 1975, ApJ, 195, L65
- Blagorodnova et al. (2017) Blagorodnova, N., et al. 2017, ArXiv e-prints, arXiv:1703.00965 [astro-ph.HE]
- Bonnerot et al. (2017) Bonnerot, C., Rossi, E. M., & Lodato, G. 2017, MNRAS, 464, 2816
- Bonnerot et al. (2016) Bonnerot, C., Rossi, E. M., Lodato, G., & Price, D. J. 2016, MNRAS, 455, 2253
- Brandt et al. (1995) Brandt, W. N., Pounds, K. A., & Fink, H. 1995, MNRAS, 273, L47
- Campana et al. (2015) Campana, S., Mainetti, D., Colpi, M., et al. 2015, A&A, 581, A17
- Cannizzo et al. (1990) Cannizzo, J. K., Lee, H. M., & Goodman, J. 1990, ApJ, 351, 38
- Carter & Luminet (1983) Carter, B., & Luminet, J.-P. 1983, A&A, 121, 97
- Cenko et al. (2012) Cenko, S. B., et al. 2012, MNRAS, 420, 2684
- Chabrier et al. (2009) Chabrier, G., Baraffe, I., Leconte, J., Gallardo, J., & Barman, T. 2009, in American Institute of Physics Conference Series, Vol. 1094, 15th Cambridge Workshop on Cool Stars, Stellar Systems, and the Sun, ed. E. Stempels, 102
- Chornock et al. (2014) Chornock, R., et al. 2014, ApJ, 780, 44
- Coughlin et al. (2016) Coughlin, E. R., Nixon, C., Begelman, M. C., Armitage, P. J., & Price, D. J. 2016, MNRAS, 455, 3612
- Dai & Blandford (2013) Dai, L., & Blandford, R. 2013, MNRAS, 434, 2948
- Dai et al. (2015) Dai, L., McKinney, J. C., & Miller, M. C. 2015, ApJ, 812, L39
- Eggleton (1983) Eggleton, P. P. 1983, ApJ, 268, 368
- Evans & Kochanek (1989) Evans, C. R., & Kochanek, C. S. 1989, ApJ, 346, L13
- Feng et al. (2015) Feng, H., Ho, L. C., Kaaret, P., et al. 2015, ApJ, 807, 185
- Freitag (2001) Freitag, M. 2001, Classical and Quantum Gravity, 18, 4033
- Freitag & Benz (2005) Freitag, M., & Benz, W. 2005, MNRAS, 358, 1133
- Gezari et al. (2008) Gezari, S., Basa, S., Martin, D. C., et al. 2008, ApJ, 676, 944
- Gezari et al. (2012) Gezari, S., et al. 2012, Nature, 485, 217
- Giannios & Metzger (2011) Giannios, D., & Metzger, B. D. 2011, MNRAS, 416, 2102
- Ginsburg & Loeb (2007) Ginsburg, I., & Loeb, A. 2007, MNRAS, 376, 492
- Grupe et al. (1995) Grupe, D., Beuermann, K., Mannheim, K., et al. 1995, A&A, 299, L5
- Grupe et al. (2015) Grupe, D., Komossa, S., & Saxton, R. 2015, ApJ, 803, L28
- Guillochon et al. (2014) Guillochon, J., Manukian, H., & Ramirez-Ruiz, E. 2014, ApJ, 783, 23
- Guillochon & Ramirez-Ruiz (2013) Guillochon, J., & Ramirez-Ruiz, E. 2013, ApJ, 767, 25
- Guillochon & Ramirez-Ruiz (2015) —. 2015, ApJ, 809, 166
- Hamers & Perets (2017) Hamers, A. S., & Perets, H. B. 2017, ArXiv e-prints, arXiv:1704.06257
- Hayasaki et al. (2013) Hayasaki, K., Stone, N., & Loeb, A. 2013, MNRAS, 434, 909
- Hayasaki et al. (2016) —. 2016, MNRAS, 461, 3760
- Hills (1975) Hills, J. G. 1975, Nature, 254, 295
- Hills (1988) —. 1988, Nature, 331, 687
- Hils & Bender (1995) Hils, D., & Bender, P. L. 1995, ApJ, 445, L7
- Hirose et al. (2009) Hirose, S., Blaes, O., & Krolik, J. H. 2009, ApJ, 704, 781
- Holoien et al. (2014) Holoien, T. W.-S., Prieto, J. L., Bersier, D., et al. 2014, MNRAS, 445, 3263
- Holoien et al. (2016a) Holoien, T. W.-S., et al. 2016a, MNRAS, 463, 3813
- Holoien et al. (2016b) —. 2016b, MNRAS, 455, 2918
- Hopman & Alexander (2005) Hopman, C., & Alexander, T. 2005, ApJ, 629, 362
- Hopman & Alexander (2006) —. 2006, ApJ, 645, 1152
- Hung et al. (2017) Hung, T., Gezari, S., Blagorodnova, N., et al. 2017, ArXiv e-prints, arXiv:1703.01299 [astro-ph.HE]
- Ivanov (2002) Ivanov, P. B. 2002, MNRAS, 336, 373
- Jiang et al. (2016) Jiang, Y.-F., Davis, S. W., & Stone, J. M. 2016, ApJ, 827, 10
- Kelley et al. (2014) Kelley, L. Z., Tchekhovskoy, A., & Narayan, R. 2014, MNRAS, 445, 3919
- King & Done (1993) King, A. R., & Done, C. 1993, MNRAS, 264, 388
- Kippenhahn & Weigert (1990) Kippenhahn, R., & Weigert, A. 1990, Stellar Structure and Evolution, 192
- Kochanek (2016) Kochanek, C. S. 2016, MNRAS, 461, 371
- Komossa (2015) Komossa, S. 2015, Journal of High Energy Astrophysics, 7, 148
- Leigh et al. (2016) Leigh, N. W. C., Antonini, F., Stone, N. C., Shara, M. M., & Merritt, D. 2016, MNRAS, 463, 1605
- Linial & Sari (2017) Linial, I., & Sari, R. 2017, MNRAS, xx
- Lodato et al. (2009) Lodato, G., King, A. R., & Pringle, J. E. 2009, MNRAS, 392, 332
- Loeb & Ulmer (1997) Loeb, A., & Ulmer, A. 1997, ApJ, 489, 573
- Magorrian & Tremaine (1999) Magorrian, J., & Tremaine, S. 1999, MNRAS, 309, 447
- McKee & Cowie (1975) McKee, C. F., & Cowie, L. L. 1975, ApJ, 195, 715
- Merritt et al. (2010) Merritt, D., Alexander, T., Mikkola, S., & Will, C. M. 2010, Phys. Rev. D, 81, 062002
- Metzger & Stone (2016) Metzger, B. D., & Stone, N. C. 2016, MNRAS, 461, 948
- Miller (2015) Miller, M. C. 2015, ApJ, 805, 83
- Miller et al. (2005) Miller, M. C., Freitag, M., Hamilton, D. P., & Lauburg, V. M. 2005, ApJ, 631, L117
- Perets et al. (2009) Perets, H. B., Gualandris, A., Kupi, G., Merritt, D., & Alexander, T. 2009, ApJ, 702, 884
- Perets et al. (2007) Perets, H. B., Hopman, C., & Alexander, T. 2007, ApJ, 656, 709
- Phinney (1989) Phinney, E. S. 1989, in IAU Symposium, Vol. 136, The Center of the Galaxy, ed. M. Morris, 543
- Piran et al. (2015) Piran, T., Svirski, G., Krolik, J., Cheng, R. M., & Shiokawa, H. 2015, ApJ, 806, 164
- Pringle (1981) Pringle, J. E. 1981, ARA&A, 19, 137
- Rees (1988) Rees, M. J. 1988, Nature, 333, 523
- Roth et al. (2016) Roth, N., Kasen, D., Guillochon, J., & Ramirez-Ruiz, E. 2016, ApJ, 827, 3
- Sari et al. (2010) Sari, R., Kobayashi, S., & Rossi, E. M. 2010, ApJ, 708, 605
- Sa̧dowski & Narayan (2016) Sa̧dowski, A., & Narayan, R. 2016, MNRAS, 456, 3929
- Sa̧dowski et al. (2016) Sa̧dowski, A., Tejeda, E., Gafton, E., Rosswog, S., & Abarca, D. 2016, MNRAS, 458, 4250
- Shen & Matzner (2014) Shen, R.-F., & Matzner, C. D. 2014, ApJ, 784, 87
- Shiokawa et al. (2015) Shiokawa, H., Krolik, J. H., Cheng, R. M., Piran, T., & Noble, S. C. 2015, ApJ, 804, 85
- Sigurdsson & Rees (1997) Sigurdsson, S., & Rees, M. J. 1997, MNRAS, 284, 318
- Stone et al. (2013) Stone, N., Sari, R., & Loeb, A. 2013, MNRAS, 435, 1809
- Stone & Metzger (2016) Stone, N. C., & Metzger, B. D. 2016, MNRAS, 455, 859
- Strubbe & Quataert (2009) Strubbe, L. E., & Quataert, E. 2009, MNRAS, 400, 2070
- Tchekhovskoy et al. (2014) Tchekhovskoy, A., Metzger, B. D., Giannios, D., & Kelley, L. Z. 2014, MNRAS, 437, 2744
- Tejeda et al. (2017) Tejeda, E., Gafton, E., & Rosswog, S. 2017, ArXiv e-prints, arXiv:1701.00303 [astro-ph.HE]
- Ulmer (1999) Ulmer, A. 1999, ApJ, 514, 180
- van Velzen & Farrar (2014) van Velzen, S., & Farrar, G. R. 2014, ApJ, 792, 53
- van Velzen et al. (2016) van Velzen, S., Mendez, A. J., Krolik, J. H., & Gorjian, V. 2016, ApJ, 829, 19
- van Velzen et al. (2011) van Velzen, S., Farrar, G. R., Gezari, S., et al. 2011, ApJ, 741, 73
- Wang & Merritt (2004) Wang, J., & Merritt, D. 2004, ApJ, 600, 149
- Zalamea et al. (2010) Zalamea, I., Menou, K., & Beloborodov, A. M. 2010, MNRAS, 409, L25