Role of Structural Morphology in Urban Heat Islands at Night Time
J.M. Sobstyl
Concrete Sustainability Hub, Department of Civil and Environmental Engineering, Massachusetts Institute of Technology, Cambridge, Massachusetts, 02139, USA
T. Emig
MultiScale Materials Science for Energy and Environment, Joint MIT-CNRS Laboratory (UMI 3466), Massachusetts Institute of Technology, Cambridge, Massachusetts 02139, USA
Laboratoire de Physique Theorique et Modeles Statistiques, CNRS UMR 8626, Universite Paris-Saclay, 91405 Orsay cedex, France
M.J. Abdolhosseini Qomi
The Henry Samueli School of Engineering, University of California, Irvine, Irvine, CA 92697
R. J.-M. Pellenq
Concrete Sustainability Hub, Department of Civil and Environmental Engineering, Massachusetts Institute of Technology, Cambridge, Massachusetts, 02139, USA
MultiScale Materials Science for Energy and Environment, Joint MIT-CNRS Laboratory (UMI 3466), Massachusetts Institute of Technology, Cambridge, Massachusetts 02139, USA
Centre Interdisciplinaire des Nanosciences de Marseille, CNRS and Aix-Marseille Universite, Campus de Luminy, Marseille, 13288 Cedex 09, France
F.-J. Ulm
Concrete Sustainability Hub, Department of Civil and Environmental Engineering, Massachusetts Institute of Technology, Cambridge, Massachusetts, 02139, USA
MultiScale Materials Science for Energy and Environment, Joint MIT-CNRS Laboratory (UMI 3466), Massachusetts Institute of Technology, Cambridge, Massachusetts 02139, USA
Abstract
We study the dependence of the intensity of the urban heat island (UHI) on urban geometry. UHI is a urban climate phenomenon referring to the air temperature difference between rural and urban areas. We use multi-year data for urban-rural temperature differences, combined with building footprint data and a simple heat radiation scaling model to demonstrate for more than 50 cities world-wide that structural morphology – measured by a building distribution function and the sky view factor – explains city-to-city variations in nocturnal UHI. Our results show that the relation between UHI and the morphology is significantly stronger than the one with population, which in the past has been considered as the dominant factor.
In the century of pullulating global urbanization with 55% of people living in cities Grimmet al. (2008), there is a pressing exigency for establishing quantitative means for controlling climate change 2. One of the most substantial local climate changes 3, which has a profound impact on health 4; 5 and energy consumption 6 is Urban Heat Island (UHI). While it is well known that the release of solar irradiance heat at night is the inducement of intensified temperatures in cities 7, the precise role of urban parameters that define the magnitude of UHI remains unknown 9. Changes in material properties 13, or morphology of infrastructure 14; 15 instigate an alternation of various physical processes at Earth’s surface leading to notable climate changes (i.e. UHI). These processes reveal geographical and periodic (i.e. hourly, daily, seasonal) influences on UHI 16; 17. Detailed periodic hourly variations have been found to be related to changes in convection efficiency in the lower atmosphere between different climate zones for the day-time UHI 18. At night-time, however, it is dominated by two factors: (1) the ability of materials to store solar radiation during the day, and (2) the rate at which this energy is released at night 7. Additional energy may come in the form of anthropogenic heat 19, but at night it is reasonable to assume its significance to be negligible. Energy release of urban morphologies has been related to the sky view from street level, but mostly limited to single street canyons 20. Contrary to this geometric interpretation, fluctuations of UHI among different cities is considered to be controlled by the population 18.
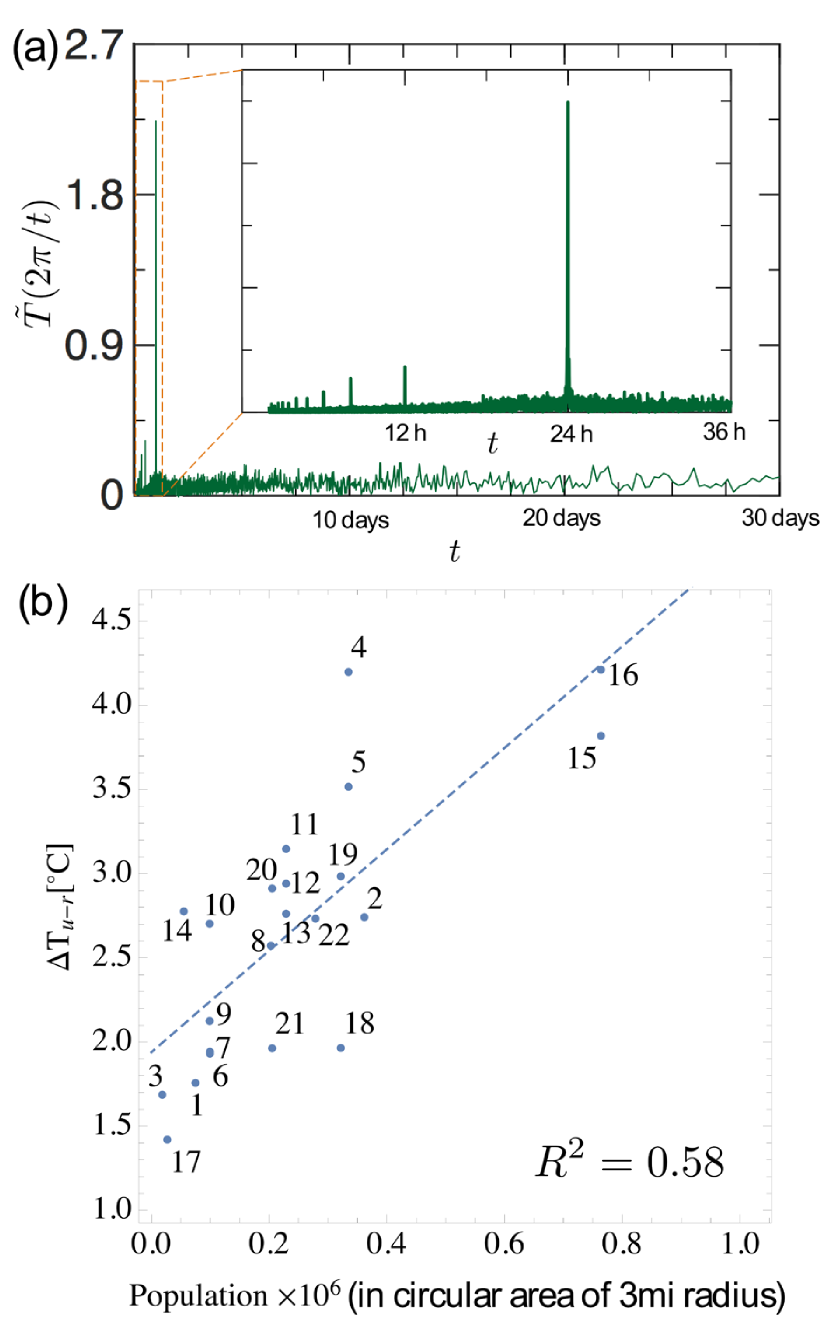
While these factors have been known for several decades, a quantitative understanding of the impact that city texture promulgates on the night-time itensity of UHI, , remains an open question 9. In order to study the impact of structural morphology on UHI, we analyze the hourly night-time peak of for twenty-two US urban air temperature time series (in the follwing labelled group A cities) for a period of multiple years 111See Supplemental Material Tab. I for the group A cities. The hourly temperature data unveil large fluctuations due to changing weather conditions that superimpose the UHI. However, Fourier transformed temperature series depict distinct maximal peaks at the period of 24 hours (see Fig. 1(a), 222See Supplemental Material Fig. 1 for temperature Fourier transforms for group A cities.). The sum of this peak and the time-averaged temperatures constitutes a reliable measure of the nocturnal .
Figure 1: (color online) UHI intensity from Fourier analysis of temperature time series and population influences. (a) Fourier transformed temperature time series (Boston). (b) Relation between and population with 3-mile radius around urban weather station.
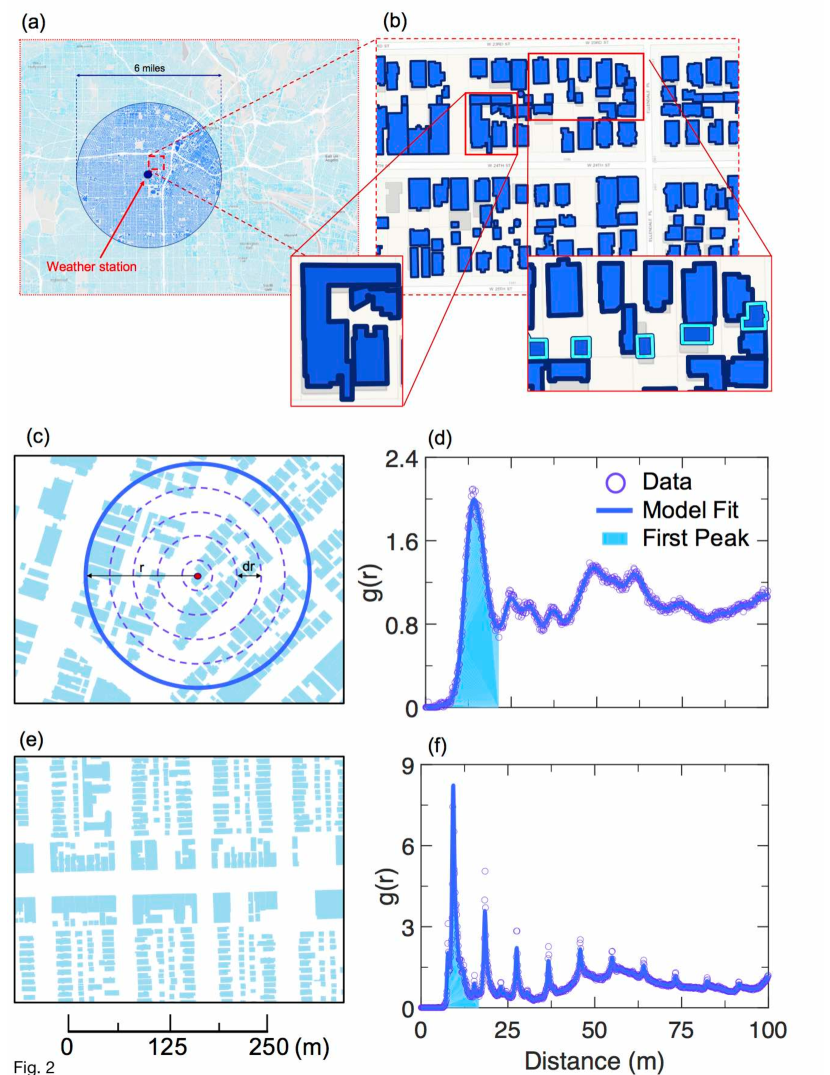
We resort to the device of a radial distribution function, , to extract the prevailing geometrical patterns in cities, defined by the set of building footprints in a three-mile radius around the urban weather station (see Fig. 2(a)). Early UHI studies have established empirically a scaling of UHI for thirty-one cities (in the following labelled group B cities, located in North America, Europe and Australia) with population 11 - a common hypothesis for the nocturnal UHI 18. While our data for (see Fig. 1(b), 333See Supplemental Material Tab. II for analysed data.) are indeed correlated with the population (coefficient of determination , Fig. 1(b)), we find that with urban geometry encoded in there is a much stronger correlation, which matches the robust linear scaling that has been observed between urban geometry for cities of group B and the open sky view factor (, Fig. 4a) 20.
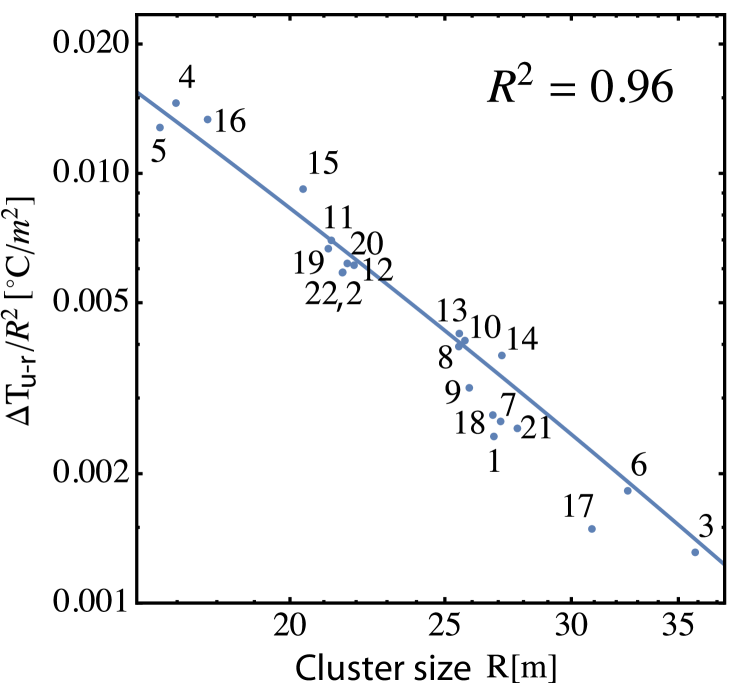
Figure 2: (color online) Radial distribution function, , for an urban morphology that depicts visualization of data editing, analysis and results. (a) Buildings within a 3-mile radius of the urban weather station are extracted. (b) Any buildings that share a wall are merged and any unoccupied buildings (i.e. garages) are removed from the sample of buildings transformed into a set of single points. (c) City morphology of Los Angeles, CA showing a comparable absence of order of buildings caused by dispersed streets, which is captured by (d) the smooth and outspread peaks in , which generally are characteristic properties of liquids. (e) City morphology of Chicago, IL showing structure and periodicity, reflected in (f) the sharp and very distinctive peaks of that are known to be the hallmark of highly ordered and stable crystalline materials. Figure 3: (color online) Relationship between and the cluster size . Measured and model-predicted relationship of urban morphologies obtained from the limits of the integral of the first peak of shows a strong negative correlation, scaling of which is captured with a power law.
Intuitively, a relationship of this kind is consistent with the reduced efficiency at which street canyons release the heat at night 21. However, our detailed analysis of buildings footprints supports a more complex dependence of UHI itensity on urban morphology. More specifically, utilizing to quantify urban structure, we find that cities have distinct morphologies resembling structures of crystals, liquids, or other equivalents of other states of matter. For example, we observe that the spatial order varies from liquid-like (Los Angeles, CA, Figs. 2c, d) to almost a perfect crystal (Chicago, IL, Figs. 2e, f). We use the position of the first minimum of (Figs. 2d, f, 444See Supplemental Material Fig. 3 for of group A cities.) to define the local cluster size and find that its relation to the ratio of for the cities in group A 555See Supplemental Material Tab. I for the group A cities. is consistent with a power law (Fig. 3). To reconcile this scaling with the previously established correlation with the sky view, it is instructive to construct a simple heat radiation model. Such a model considers that at night time only long wavelength infrared (IR) radiation emitted from urban surfaces contributes to UHI 22. To demonstrate that a simple scaling theory accounts for UHI variations with urban structure measured by , we separate contributions of non-geometric origin to . For that we assume that flat urban surfaces have an average temperature that is different from the corresponding temperature of rural surfaces, , due to increased sensible heat storage, decreased evapotranspiration and increased absorption of ultra-violet (UV) radiation at day-time 23. The cumulative effect of the urban-rural difference between the latter processes is summarized by a phenomenological factor with for flat surfaces. For a quantitative description of the reduced nocturnal heat release from urban areas due to their increased “roughness” we resort to the device of an effective temperature that is often used for a body as an estimate of its surface temperature when the emissivity is unknown 24. is defined as the temperature of a perfect black body that radiates the same power as the actual body according to the Stefan-Boltzmann law, ( is the surface area of the body and the Stefan-Boltzmann constant, 666See Supplemental Material sections D and E for the description of the heat radiation model.). By analogy, we apply this concept to cities. Since the wave length of IR radiation is much shorter than all relevant urban length scales, diffraction effects can be neglected and an increase in surface area attributed to buildings (when compared to rural areas) determines . Assuming buildings of size , and mean height , separated by an average distance 777See Supplemental Material sections D and E for the description of the heat radiation model., our model predicts
(1)
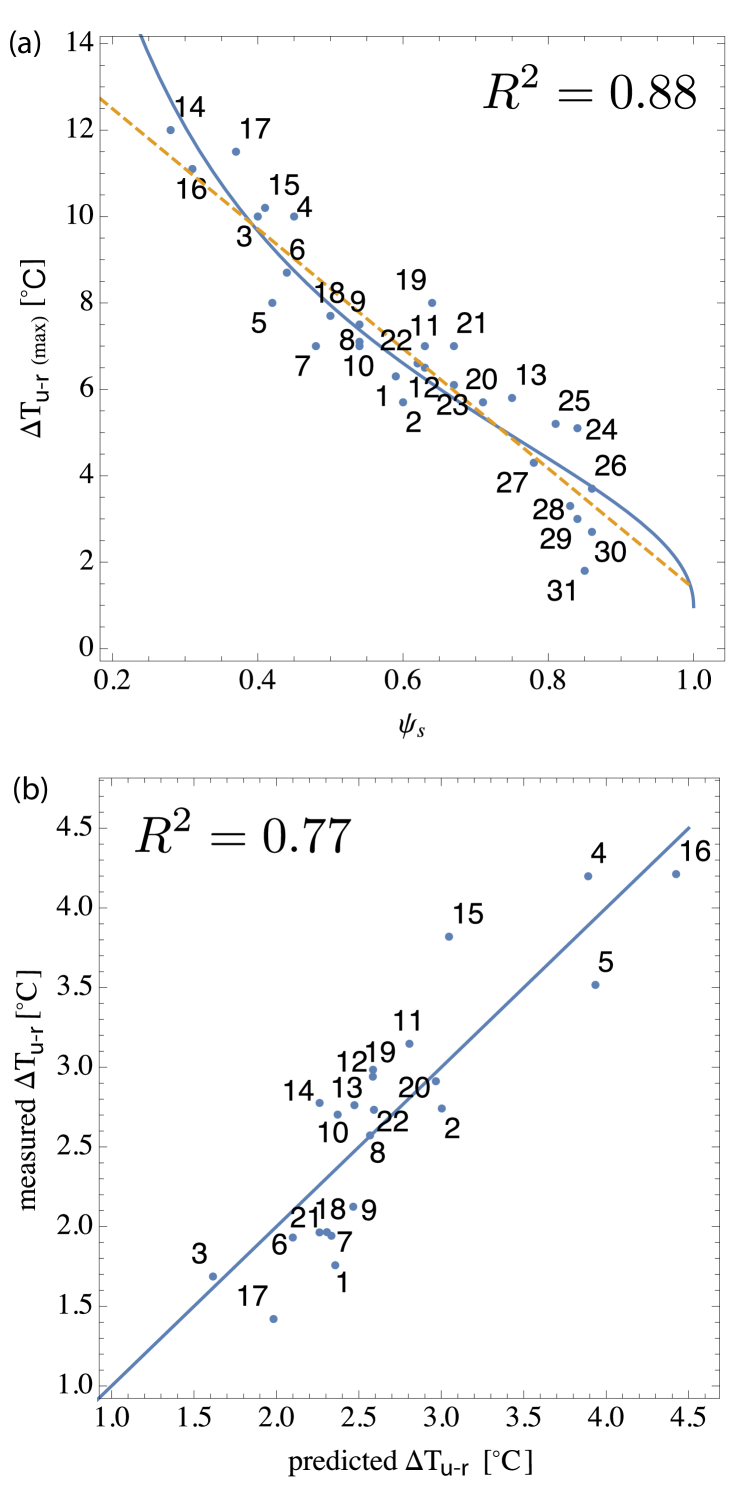
Figure 4: (color online) Relationship between measured and model-predicted . (a) maximal of city group B as function of the sky view factor from Oke 25 together with the linear fit of Oke (dashed line) and the fit to our model (solid curve), see Eq. (2). The numbers refer to the numbering of cities in the work of Oke 25. (b) Comparison of measured and predicted for cities of group A, see Eq. (1).
This prediction can be probed by field data in different ways, which is important since the availability of geometric data for most cities are either incomplete (i.e. building heights are missing), or only sky view factors are available. For the data set A, there is no information on building heights. However, detailed information on building footprints is available, thus allowing us to compute and 888See Supplemental Material Tab. II for analysed data.. We compare these values to our theoretical model by minimizing (with respect to , , and ) the squared deviations between the data for of all twenty-two cities and the corresponding prediction of Eq. (1) with and . We find a convincing agreement with the parameters C, , and m, yielding a coefficient of determination, (see Fig. 4b). Since most of the analyzed urban areas are mainly residential, we conclude that the result for the mean building height is reasonable. However, we have estimated the correction factors for the mean buildings heights that would yield an ideal agreement with our model, showing that corrections of only compared to would be needed for a perfect agreement with Eq. (1). Knowing the mean height and building size d = 0.71RΔT_u-r/R^2ΔT_u-rRT_rR^2=0.96T_r=24.4^∘C999See Supplemental Material sections D and E for the description of the heat radiation model.ΔT_u-r¯h/dψ_s¯h/d = 12tan[arccos(ψ_s)]T_r,γL/dΔT_u-rψ_sT_r=40.4^∘C,γ= 1.024L/d = 1.0R^2=0.88ΔT_u-r
Conversion to HTML had a Fatal error and exited abruptly. This document may be truncated or damaged.