Coevality in Young Eclipsing Binaries
Abstract
The ages of the components in very short period pre-main sequence (PMS) binaries are essential to an understanding of their formation. We considered a sample of 7 PMS eclipsing binaries (EBs) with ages 1 to 6.3 MY and component masses 0.2 to 1.4 M⊙. The very high precision with which their masses and radii have been measured, and the capability provided by the Modules for Experiments in Stellar Astrophysics (MESA) to calculate their evolutionary tracks at exactly the measured masses, allows the determination of age differences of the components independent of their luminosities and effective temperatures. We found that the components of 5 EBs, ASAS J052821+0338.5, Parenago 1802, JW 380, CoRoT 223992193, & UScoCTIO 5, formed within 0.3 MY of each other. The parameters for the components of V1174 Ori, imply an implausible large age difference of 2.7 MY and should be reconsidered. The 7th EB in our sample, RX J0529.4+0041 fell outside the applicability of our analysis.
1 Introduction
The components of binaries are thought to form together and the differences in their ages are usually assessed by placing the components on a Hertzsprung-Russel Diagram (HRD). Using this approach Kraus & Hillenbrand (2009) showed that angularly resolvable binaries in the Taurus star-forming region (SFR) are coeval to dex corresponding to an age difference of about 0.9 MY at age 2 MY. Eclipsing binaries (EBs) provide precise measurements of their component masses, radii, effective temperatures, and luminosities. These parameters are fundamental and provide inputs for tests of theoretical models of stellar evolution (e.g. Torres et al. (2010)). Stellar masses and radii are the parameters most directly determined by the observations, are model-independent, and can be measured with exquisite precision, sometimes better than . In this paper we use measured masses and radii of pre-main sequence (PMS) EBs to set limits on the age differences of their components that are smaller than previously available.
The radius of a PMS star decreases as it collapses to the main sequence along an evolutionary track that is determined by its mass. We calculate evolutionary tracks of EB components at their measured masses using the Modules for Experiments in Stellar Astrophysics (MESA) (Paxton et al. (2015) and earlier references therein) and determine their ages with reference to the measured radii. We do not regard the ages we derive as absolute because ages derived using other theoretical models could differ. Nonetheless we show that the age differences of the components we derive using the MESA tracks provide an accurate and precise assessment of the components’ age differences. §2 presents our sample of EBs and describes the determination of their masses and radii. §3 describes our analysis and its limitations and §4 presents our results. §5 discusses the 5 EBs we find to be coeval to 0.3 MY on average and the problematic age difference of the components of V1174 Ori. We summarize our results in §6 and suggest future work.
2 EB Sample
EBs are rare and the number of known PMS EBs is small. Stassun et al. (2014) presented a list of 13 well-studied PMS EBs with masses 4 M⊙ or less. Here we study only EBs with masses in the mass range to 1.4 M⊙ because, as we discuss in §3, that is the range in which we validated our use of evolutionary tracks calculated using MESA. Table 1 lists the 7 EBs in our sample. Six are from the compilation by Stassun et al. (2014) and one, UScoCTIO 5 was discovered in the K2 Mission (Kraus et al. (2015); David et al. (2016)). The first 2 columns list the EB name, references for the parameters used, and the component to which the values in cols 3-7 apply. Component masses and radii are the only parameters we need in this work. Cols. 3, 4, and 5 list the measured orbital period (days), component masses, , and photospheric radii, . The masses and radii are listed at the full precision derivable from the observations but the period is listed at far lower precision because its precise value is unimportant here. We list the parameters as given by Stassun et al. (2014) rather than the values in the original discovery papers because Stassun et al. made critical assessments of their precisions. Col. 1 also lists the EB’s discovery paper or one that originally presented its parameters. For UScoCTIO 5 we list the parameters derived by Kraus et al. (2015) and David et al. (2016). We analyze both to explore differences in an assessment of the components’ coevality.
All the EBs in our sample are short period double-lined spectroscopic binaries with well-studied light curves. The orbital periods can be determined from either the photometric or spectroscopic data. Parenago 1802 is the youngest EB in our sample. With P=4.67d and eccentricity , it has not yet circularized its orbit (Gomez Maqueo Chew et al., 2012). UScoCTIO 5 has the longest period, P=34d, and the largest eccentricity (Kraus et al. (2015); David et al. (2016) The other EBs have periods less than and circular orbits. The mass ratios of the components are in the range 0.58 to nearly 1.0.
Masses are derived from an analysis of spectroscopically measured radial velocities, RVs. The RVs provide the velocity amplitudes, and , eccentricity , and the systemic velocity . The velocity amplitudes, , yield the mass ratio directly, and, with and , the values of . The photospheric radii and inclination, , are determined from analysis of the eclipses in the light curve. The ratio of the radii is derived from timing in the eclipses. Using also the the radii measured relative to the orbital semi-major axis are derived. Determination of these parameters is complex because it needs inputs that describe the radiation of the components, particularly their flux ratio. The well-established Wilson-Devinney (WD) code (Wilson & Devinney, 1971) and its descendants (e.g. PHOEBE, Prša & Zwitter (2005)) are often used for this analysis. In the sample we are considering JKTEBOP which needs fewer stellar inputs, (Southworth et al., 2007) and (Popper & Etzel, 1981), was used to analyze the light curves of JW380 (Irwin et al., 2007), CoRoT (Gillen et al., 2014), and UScoCTIO 5 (David et al., 2016). When analysis of the light curves reveals a signal in the eclipse minima that cannot be attributed to the components, it is described as the “Third Light” parameter. Third light can arise in the starlight of a tertiary or of an unrelated star in the photometric aperture. Third light masquerading as a signal can also result from the data processing. Third light has been identified in four of the EBs in our sample: RX J0529.4+0041, V1174 Ori, Parenago 1802, and JW380 (Stassun et al., 2014).
3 Method of Analysis and its Limitations
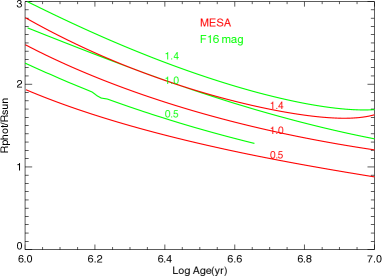
We use the the MESA code to calculate evolutionary tracks because it provides the capability to calculate evolutionary tracks at exactly the measured masses. Thus it avoids the necessity to interpolate between the masses at which published theoretical models (e.g. Baraffe et al. (2015), BHAC15; 2016A&A...593A...99F, F16) are available. Appendix A provides more details about our use of the code. By referring to the dependence of the photospheric radius on age for the particular mass track, we use the measured radius and its values to determine the component’s age and uncertainty.
We compared the tracks calculated by MESA to those of BHAC15 and F16. Fig. 1 shows the dependence of the MESA, BHAC15, and F16 models for stars of mass over the range 1 to 100 MY. The tracks provided by the MESA, BHAC15, and F16 models are very similar for stars older than 1 MY and more massive than . The BHAC15 and MESA tracks agree down to and age greater than 1 MY. Therefore we limited our sample of EBs analyzed to 0.2-1.4 M⊙.
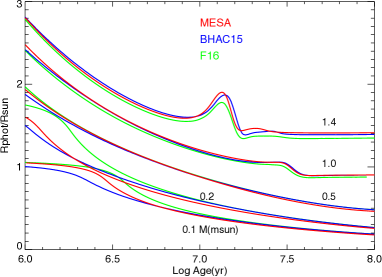
The effects of energy production by the CN cycle manifest themselves as a “puffing up” of the radius at MY in 1 M⊙ stars and earlier for more massive stars (Baraffe, priv. comm.; Feiden, priv. comm. and footnote 1 in Stassun et al. (2014)). This marks the transition from the star’s evolution along the Hayashi track to the Henyey track. The figure shows that these effects do not appear in stars less massive than M⊙. This illustrates one limit on the applicability of this age determination technique: For stars more massive than M⊙ the “puffing up” becomes a problem at ages greater than MY.
Fig. 1 indicates that precision reached in the measurement of the age difference of the components depends on the slope of the track. We can quantify this easily. For an uncertainty in the measurement, the precision of the age estimate, , where is , depends on the slope of as
The relation is approximate because all tracks have some curvature. The slope of the track for a star at = 6.5, at which , is about -0.95 R⊙/MY. A relative uncertainty in the measurement of is representative of the values in Table 1. The relation for an estimate of the age uncertainty yields dex for the star in this example, comparable to the uncertainties presented in §4 and listed in Table 1 Col. 6. As the contraction of the stars slows, the slopes of the tracks flatten; the smaller the slope the greater the uncertainty on the age. Thus the technique is not useful at ages greater than MY either because of the operation of the CN cycle or because of the slowing contraction of the stars or both. At masses and ages dex, the models differ in their rates of decrease of , probably because of differences in their treatment of deuterium burning. The figure suggests that the “sweet spot” for the application of this technique is a region approximately centered on , extending in age dex and over the mass range . The similarity of rates of contraction indicates that the ages, their differences, and uncertainties determined using MESA tracks would be consistent with values obtained using the BHAC15 and F16 models at the same values. We discuss in §5 the effects of including magnetic fields.
4 Results
Fig. 2 shows the analysis of UScoCTIO 5 in the plane using Kraus et al. (2015) and David et al. (2016))’s parameters. The solid horizontal lines indicate the measured values of the radii of the A and B components; the dashed horizontal lines lie at . The solid diagonal lines plot the evolutionary tracks and the dashed lines plot the tracks for and . The component age is given by the intersection of the 2 solid lines. The
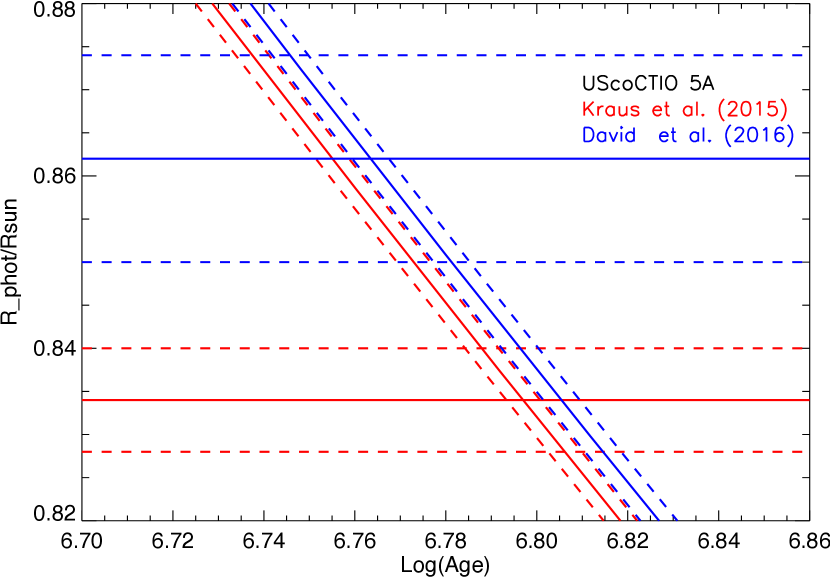
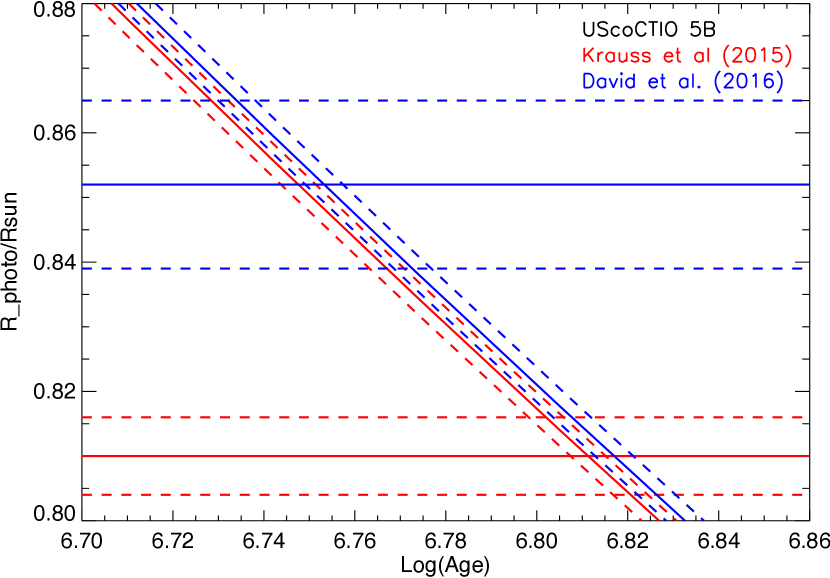
locus of the age uncertainty is described by an oval in the plane. It is unnecesssary to derive the equation of the oval because its extrema at and give the age uncertinty. We list the component age and uncertainty in Col. 6 and age difference in Col. 7. Even though the values of the B component’s radius differ by nearly the effect on an assessment of coevality is nil. Neither result suggests a significant age difference and we can be confident that the ages of the components are within 0.34 MY of each other.
Fig. 3 shows the application of this technique to RX J0529.4+0041 and demonstrates the limits of its usefulness. Again, the straight lines show the measured photospheric radii and their uncertainties. The tracks depart sufficiently from a linear dependence (Fig. 3a) that
it is not possible to specify a unique upper bound on the A component’s age. To provide a wider perspective, Fig. 3c plots the tracks of the A component over the range 6.5 to 8.0. It shows that the “puffing up” in radius discussed in §3, here at about 16 MY, causes the age estimated by our approach to be multivalued.
Fig.4 shows the analysis applied to ASAS J05281+0338.5. Although the masses are close to 1.4 M⊙ (Table 1) the figures show that the ages of the A and B components are young enough, MY, that the curvature of the log(Age) is small and does not compromise estimates of their age and age uncertainties. The difference in ages of the components in the (A-B) sense is -MY. Their ages are probably within 0.85 MY of each other.


Figs. 5, 6, 7, and 8 show the results of this analysis for V1174 Ori, Parenago 1802, JW 380, and CoRoT 223992193. Of our sample of 7 EBs, V1174 Ori is the only EB whose components have, at least formally, a statistically significant age difference. The apparent age difference is such that it would make the B component 2.7 MY older than A. It is important to identify the reasons for the finding and to assess whether the result is misleading. We discuss our results and V1174 Ori in particular in the next section.


5 Discussion
5.1 V1174 Ori A and B
The position of V1174 Ori on the sky, its systemic velocity, and small extinction suggest the EB is a member of the extensive Ori OB1d region and lies in front of Ori OB1c, the Orion Nebula Cluster (Stassun et al., 2004) At face value the apparent age difference between the A and B components, MY in a system of age MY (Table 1), is enough to make the result suspect. Could the age difference be an unexpected artifact of the our technique? Figure 5 shows that curvature of the tracks at the masses and apparent ages of the components is negligible. The mass of V1174 Ori B is similar to that of CoRoT 223992195 A for which the analysis (Fig. 8) does not indicate a problem at age similar to V1174Ori A. The technique seems not to be at fault.
If the components really differ in age, where did they come from? Or, do their radii indicate differences in internal structure possibly caused by tidal effects or heating of attributable to the orbital evolution of an as yet undetected tertiary as Stassun et al. (2014) suggested? Or, are the measured parameters, the masses and radii, at fault and produce the misleading result? We consider these possibilities in turn.
As a member of Ori OB1d the EB’s components must have formed when the cluster was younger and more compact. Owing to a higher stellar density, a young binary or triple could have experienced the scattering events discussed by Reipurth & Mikkola (2012) and evolved into a hierarchical triple consisting of the EB and third member now in the aperture of the observations we have described. This scenario is possible but would not explain the large age difference.
Stassun et al. (2004) suggested two dynamical effects that could produced anomalous parameters of A and/or B: tidal heating at the close orbital separations of the EB, and energy input to the EB components by the orbital evolution of a tertiary. They presented a plausible scenario for the tertiary’s effects but neither this mechanism nor tidal heating would explain why the effects appear in only one of the EBs we analyzed.
Finally we consider the reliability of the masses and radii. The spectral types of A and B are K4.5 and M1.5, respectively (Stassun et al., 2004). The system’s radial velocities yielded velocity semi-amplitudes and hence and . Using and an estimate of the masses from the spectral types we can make an independent estimate that the system’s semi-major axis is and ( Stassun et al. (2004) determined that the actual value is ). If in fact , the component masses would be only larger than the values derived by Stassun et al. (2004). This is comparable to the uncertainties of measurement of . It seems likely that the component mass values are reliable and not responsible for the calculated age difference.
Stassun et al. (2004) used the WD procedure to fit the light curve and thus to derive the component radii. It is beyond the scope of our work to estimate the effects on the radii of the several assumptions necessary to initiate and iterate the WD analysis. We can imagine two approaches to assess whether the measured radii are reliable. One would be to try to determine the origin of the “third light”. The other would be to analyze the V1174 Ori light curves independently with procedures such as JKTEBOP.
5.2 The Coeval EBs
Five EBs in Table 1, ASAS J052821+0338.5, Parenago 1802, JW 380, CoRoT 223992193, & UScoCTIO 5, are truly coeval with an average age difference of only MY. Their ages as indicated by the MESA models lie in the range MY. These results are robust because Fig. 1 indicates that their apparent ages would be similar if they were measured using the BHAC15 and F16 models. Since the slopes of the three models are nearly identical for the masses and ages considered, the diferences in ages would be nearly identical too. The precision of the derived ages, and hence also the difference in component age, is limited only by the precision of the measured radii and the slope of the decrease of stellar radius with time. These results indicate that the accretion events and early orbital evolution of the compnents in these EBs produced and age spread of no more than 0.3 MY.
The rate of contraction of the PMS star is determined by gravity and its internal pressure. In the presence of both gas pressure and magnetic pressure the contraction is slowed (F16; MacDonald & Mullan (2017). Thus at a given age the radius is greater than the case without an internal magnetic field. Fig. 9 shows that the slopes of the magnetic models (F16) and MESA models, which are non-magnetic, are similar for ages 1 - 6.3 MY. Application of the magnetic models to our sample would yield age estimates that are younger but with component age differences that are consistent with the values in Table 1. Thus, the ages given in Table 1 are precise but not necessarily accurate. However, the component age differences are accurate and precise.
ASAS J05281+0338.5, Parenago 1802, and JW 380 have mass ratios close to 1. The stars in Parenago 1802 can be considered “twins” in the sense that their mass ratio is within of 1.0 (Simon & Obbie, 2009). Evidently the processes that produce EBs within a few tenths MY can result in EBs with very nearly equal component masses.
EBs that are actually triples can provide more information on their architectures and hence formation. The triples are presumably stable on at least 1-10 MY time scales with orbital separation of the tertiary much greater than that of the EB. Eggleton & Kiseleva (1995)’s stability criterion provides an estimate of the distance at which the orbit of tertiary is stable. They find that, in terms of the ratio of the periastron distance of the tertiary to the apostron distance of the inner binary
the triple is stable when . For equal masses . Thus, if Parenago 1802 bears out the suspicion provided by its third light and proves to be a triple AU in which the lower bound would be realized if . At Parenago 1802’s distance in the Orion Nebula Cloud, pc (e.g. Jeffries (2007) the separation of the EB and tertiary is if and greater otherwise. This separation is unfortunately unresolvable by the largest aperture ground-based telescopes.
The high precision of the age differences of these EBs is attributable to the very high precision and model independent measurements of their masses and radii. The traditional technique of age determination of EBs by fitting observations to model isochrones on the HRD requires the luminosity and effective temperature. Both are derived quantities and inevitably have uncertainties larger than that of the radii alone. It seems very unlikely that the accuracy and precision component age differences we have achieved could be reached using HRD techniques.
6 Summary and Suggestions for Future Work
There are two main results of our work:
1) Using as inputs only the precision masses and radii of the components of PMS EBs, evolutionary tracks calculated using the MESA software provide accurate and precise values of their age differences.
2) All 5 of the EBs that we could analyze with confidence, ASAS J052821+0338.5, Parenago 1802, JW 380, CoRoT 223992193, and UScoCTIO 5, are coeval to 0.3 MY on average, This means that the complex events such as accretion and orbital evolution associated with the formation of very close binaries produced an apparent age spread of no more than 0.3 MY.
The following observational advances of multiples such as those we studied would contribute significantly to an understanding of their formation:
1) Further study of the systems with “third light” would enable assessment of its physical origin.
2) Suspected circumbinary disks such as in CoRoT 223992193 (Gillen et al., 2014) could be revealed by radio interferometric observations and would open a new channel for the study of EB formation.
3) Analysis of and EB alone does not provide a direct measurent of its distance; instead it is determined from the luminosities and effective temperatures of its components and reference to models of stellar evolution. GAIA parallaxes with microarc second uncertainties will provide distances with unsurpassed precision.
Appendix A MESA information
We used MESA version 7624 to calculate our models. We used metallicity z=0.02 and the default abundances. We set the mixing length parameter to 1.918 which reproduces the Sun at present age. When this paper is accepted we will provide sample inlists at http://mesastar.org/results.
References
- Baraffe et al. (2015) Baraffe, I., Homeier, D., Allard, F., & Chabrier, G., 2015, A&A, 577, 42
- Buser & Kurucz (1992) Buser, R.& Kurucz, R., 1992, A&A, 265, 557
- Covino et al. (2004) Covino, E.; Frasca, A.; Alcala, J.M.; Paladino, R.;& Sterzik, M.F. 2004, A&A, 427, 637
- David et al. (2016) David, T. J., Hillenbrand, L. A., Cody, Anne Marie, et al. 2016, ApJ, 816, 21
- Eggleton & Kiseleva (1995) Eggleton, P. & Kiseleva L. 1995, ApJ, 455, 640
- Feiden, G. (2016) Feiden, G. 2016, A&A, 593, 99
- Gillen et al. (2014) Gillen, E., Aigrain, S., McQuillan, A., et al. 2014, A&A, 562, 50
- Gomez Maqueo Chew et al. (2012) Gómez Maqueo Chew, Y., Stassun K., G., Prša, A. et al., 2012, ApJ, 745, 58
- Irwin et al. (2007) Irwin, J., Aigrain, S., Hodgkin, S. et al., 2007, MNRAS, 380, 541
- Jeffries (2007) Jeffries, R. D., 2007, MNRAS, 376, 1109
- Kraus & Hillenbrand (2009) Kraus, A. & Hillenbrand, L. A. 2009, ApJ, 704, 531
- Kraus et al. (2015) Kraus, A. L., Cody, Anne Marie, Covey, K., R. et al. 2015, ApJ, 807, 3
- MacDonald & Mullan (2017) MacDonald, J. & Mullan, D. J. 2017, ApJ, 834, 67
- Paxton et al. (2015) Paxton, B., Marchant,P., Schwab, J. et al. 2015, ApJS, 220, 15
- Popper & Etzel (1981) Popper, D. M. & Etzel, P.B. 1981, AJ, 86, 102
- Prša & Zwitter (2005) Prša A. & Zwitter, T., 2005, ApJ, 628, 426
- Reipurth & Mikkola (2012) Reipurth, B.& Mikkola, S. 2012, Nature492, 221
- Simon & Obbie (2009) Simon, M. & Obbie, R. C., 2009, AJ, 137, 3442
- Southworth et al. (2007) Southworth, J., Bruntt, H., & Buzai, D.L. 2007, A&A, 467, 1215 Southworth, J., Maxted, P. F. L., & Smalley, B., 2004, MNRAS, 351, 1277
- Stassun et al. (2004) Stassun, K. G., Mathieu, R. D., Vaz, L. P. R. et al. 2004,ApJS, 151, 357
- Stassun et al. (2014) Stassun, K. G., Feiden, G. A., & Torres, G., 2014, New A Rev., 60, 1
- Torres et al. (2010) Torres, G., Anderson, J. & Giménez, A, 2010, A&A Rev., 18, 67
- Wilson & Devinney (1971) Wilson, R. E. & Devinney, E. J., 1971, ApJ, 166, 606
| Derived from Observations | This Work | |||||
|---|---|---|---|---|---|---|
| Name/Ref. | Comp. | P(d) | log Age(y) | Age (A-B) MY | ||
| ASAS J05281+0338.5 | A | 3.87 | ||||
| 1,2 | B | |||||
| RX J0529.4+0041 | A | 3.04 | ||||
| 1,3 | B | |||||
| V1174 Ori | A | 2.64 | ||||
| 1,4 | B | - | ||||
| Parenago 1802 | A | 4.67 | ||||
| 1,5 | B | - | ||||
| JW 380 | A | 5.30 | ||||
| 1,6 | B | |||||
| CoRoT 223992193 | A | 3.88 | ||||
| 1,7 | B | |||||
| USco CTIO5 | A | 34.0 | ||||
| 8 | B | |||||
| USco CTIO5 | A | 34.0 | ||||
| 9 | B | |||||
References: 1) Stassun et al. (2014), 2) Stempels et al. (2008), 3) Covino et al. (2004), 4) Stassun et al. (2004), 5) Gomez Maqueo Chew et al. (2012), 7) Gillen et al. (2007), 8) Kraus et al. (2014), 9) David et al (2014)