New outburst of the symbiotic nova AG Peg after 165 years
Abstract
Context. AG Peg is known as the slowest symbiotic nova, which experienced its nova-like outburst around 1850. After 165 years, during June of 2015, it erupted again showing characteristics of the Z And-type outburst.
Aims. The primary objective is to determine basic characteristics, the nature and type of the 2015 outburst of AG Peg.
Methods. We achieved this aim by modelling the spectral energy distribution using low-resolution spectroscopy (330–750 nm; R = 500–1000), medium-resolution spectroscopy (420–720 nm; ), and photometry covering the 2015 outburst with a high cadence. Optical observations were complemented with the archival HST and FUSE spectra from the preceding quiescence.
Results. During the outburst, the luminosity of the hot component was in the range of 2–11, being in correlation with the light curve (LC) profile. To generate the maximum luminosity by the hydrogen burning, the white dwarf (WD) had to accrete at , which exceeds the stable-burning limit and thus led to blowing optically thick wind from the WD. We determined its mass-loss rate to a few . At the high temperature of the ionising source, K, the wind converted a fraction of the WD’s photospheric radiation into the nebular emission that dominated the optical. A one order of magnitude increase of the emission measure, from a few cm-3 during quiescence, to a few cm-3 during the outburst, caused a 2 mag brightening in the LC, which is classified as the Z And-type of the outburst.
Conclusions. The very high nebular emission and the presence of a disk-like H i region encompassing the WD, as indicated by a significant broadening and high flux of the Raman-scattered O vi 6825 Å line during the outburst, is consistent with the ionisation structure of hot components in symbiotic stars during active phases.
Key Words.:
Stars: binaries: symbiotic – novae, cataclysmic variables – Stars: individual: AG Peg1 Introduction
Symbiotic stars are the widest interacting binary systems comprising a cool giant as the donor star and a hot compact star, mostly a white dwarf (WD), accreting from the giant’s wind (Mürset & Schmid 1999). Their orbital periods run from hundreds of days (S-type systems containing a normal giant) to a few times 10–100 years (D-type systems containing a Mira variable surrounded by a dust shell). The accreting WD represents a strong source of the extreme ultraviolet radiation ( K, ) in the binary that ionises a fraction of the wind from the giant giving rise to the nebular emission (e.g. Seaquist et al. 1984, hereafter STB). This configuration represents the so-called quiescent phase, during which the symbiotic system releases its energy approximately at a constant rate and temperature. The observed luminosities of accreting WDs are powered by two main sources of the energy. In rare cases, low luminosities of are generated solely by the accretion process onto the WD (e.g. EG And, 4 Dra, SU Lyn, see Skopal 2005a; Mukai et al. 2016), when its gravitational potential energy is converted into the radiation by the disk. In most cases, high luminosities of a few times (e.g. Mürset et al. 1991; Skopal 2005b) are generated by stable nuclear hydrogen burning on the WD surface, which requires a certain range of accretion rates (Tutukov & Yungel’son 1976; Paczyński & Żytkow 1978).
Sometimes, the symbiotic system changes its radiation significantly, brightens up in the optical by a few magnitudes and shows signatures of a mass-outflow. We name this stage as the active phase. According to the brightness variation we distinguish two subclasses: (i) The ‘Z And-type’ outbursts with amplitudes of 1–3 mag in the optical, evolving on the timescale of weeks to years. This type of outburst can result from an increase in the accretion rate above that sustaining the stable burning, which leads to expansion of the burning envelope simulating an A–F type pseudophotosphere (Tutukov & Yungel’son 1976; Paczyński & Rudak 1980). (ii) The nova-like outbursts with amplitudes mag that, after prolonged accretion by the WD from the giant’s wind, undergo a thermonuclear outburst. Depending on the WD mass and the accretion rate we observe either very slow novae, whose outbursts last for dozens of years, or very fast novae lasting for several days to months and recurring during several years to decades (see modelling by Livio et al. 1989; Hachisu & Kato 2001; Yaron et al. 2005). The former are called ‘symbiotic novae’ whereas the latter are known as ‘symbiotic recurrent novae’. Their properties have been discussed by many authors (e.g. Allen 1980; Mürset & Nussbaumer 1994; Munari 1997; Mikolajewska 2011).
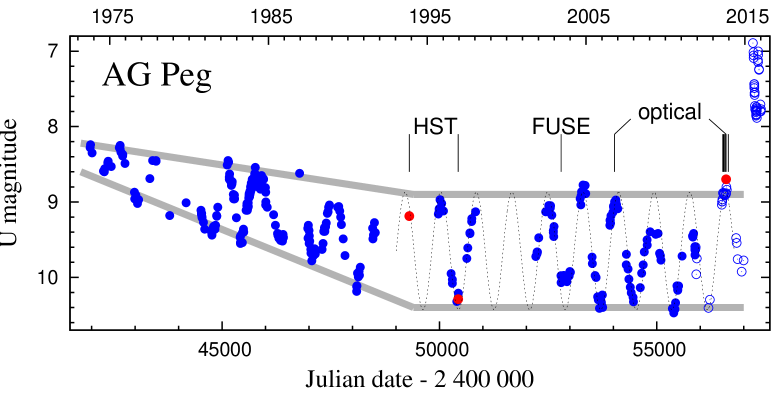
AG Peg is a symbiotic binary comprising a M3 III giant (Kenyon & Fernández-Castro 1987) and a WD on an 818-d orbit (e.g. Fekel et al. 2000). This is a bright (), and thus a well studied object. Measuring its light variations from before 1850 (see Fig. 1 of Boyarchuk 1967) allowed for its classification as a symbiotic nova (Allen 1980). The outburst began in 1850 (Lundmark 1921) when it rose in brightness from to reach a maximum of mag around 1885. Afterwards, AG Peg followed a gradual decline to around 2000, and then, varying between 8.5 and 9.0 mag in , kept its brightness until June 2015. Such an evolution of the LC together with other spectrophotometric parameters represents the slowest nova outburst ever recorded (Kenyon et al. 1993).
The evolution of luminosity and temperature of the burning WD during the whole outburst was described by Mürset & Nussbaumer (1994) and Altamore & Cassatella (1997). The peak luminosity, reached during 1940-50, was followed with a gradual decline to 1993 along a slowly increasing temperature. The following study by Kenyon et al. (2001) confirmed the continuing slow decline of the AG Peg luminosity by a factor of 2–3 from 1980–1985 to 1997.
Similar behaviour was indicated in the mass-loss rate from the hot component, . Based on radio observations performed during 1973–75, Gregory & Kwok (1977) estimated . Using the radio flux at 5 GHz from 1984–87, Kenny et al. (1991) estimated an upper limit of to . During 1978–1993, a decline in from to was suggested by Kenyon et al. (1993).
The presence of strong winds from both the binary components was often used to identify main emission regions in AG Peg within the colliding winds model (e.g. Tomov 1993; Contini 1997, 2003; Tomov & Tomova 2001; Eriksson et al. 2004; Kenny & Taylor 2007). The most direct indication of colliding winds in AG Peg is the detection of X-ray emission from a very hot, optically thin plasma (Mürset et al. 1995). According to the gradual decrease of the hot component luminosity, Zamanov & Tomov (1995) predicted that the colliding-wind stage would end between 1999 and 2004, and accretion from the wind would recommence. From around 1997 to June 2015, AG Peg kept its brightness at a constant level, showing just pronounced wave-like orbitally-related variations (Skopal et al. 2007, 2012, this paper) – the main characteristic of the quiescent phase of a symbiotic star.
During June 2015, AG Peg experienced a new outburst (AAVSO Alert Notice 521 111https://www.aavso.org/aavso-alert-notice-521). On July 1, 2015, Steele et al. (2015) indicated strong emission lines of, namely, H i, He ii, and N iii superposed on nebular continuum with a pronounced Balmer jump in emission on their low-resolution spectrum (320–620 nm). Around a maximum of the optical brightness, from June 28 to July 8, 2015, the Swift/XRT observation detected an increase in the count rate with a factor of 3 with respect to the previous observation on August 16–19, 2013 (Nuñez & Luna 2013; Luna et al. 2015). Following Swift/XRT, monitoring of the 2015 outburst indicated a markedly variable X-ray flux on a time scale of days (Ramsay et al. 2015, 2016). The authors ascribed the origin of the strong and variable X-rays to shocks in the variable ejecta. Analysing the same Swift/XRT observations, Zhekov & Tomov (2016) came to the conclusion that the characteristics of the X-ray emission from the 2015 outburst could not result from colliding stellar winds in a binary system as was indicated by previous ROSAT observations from June of 1993. Using optical spectroscopy and photometry, Tomov et al. (2016) concluded that the 2015 outburst of AG Peg places it among the classical Z And-type symbiotic binary systems.
In this contribution we determine basic characteristics and the nature of the 2015 AG Peg outburst using a high cadence optical spectroscopy and multicolour photometry complemented with ultraviolet spectra from the preceding quiescence. In Sect. 2 we summarise and describe our observations and data reduction. Section 3 describes our analysis and presents the results. Their discussion and summary are found in Sects. 4 and 5, respectively.
2 Observations
2.1 Photometry
Multicolour photometric observations were carried out with two 60cm, f/12.5 Cassegrain telescopes at the Stará Lesná Observatory (G1 and G2 observing pavilions) operated by the Astronomical Institute of the Slovak Academy of Sciences.
1. CCD photometry (G1 pavilion) was obtained in the standard Johnson-Cousins system using the FLI ML3041 CCD camera (20482048 px, pixel size: 15 m 15 m, scale: 0.4 arcsec/px, FoV: ), mounted at the Cassegrain focus. The data were reduced using the IRAF software package222http://iraf.noao.edu as described by Parimucha & Vaňko (2005). All frames were dark-subtracted, flat-fielded and corrected for cosmic rays. Corresponding magnitudes were obtained using the comparison stars ”a”, ”b”, and ”c” of Henden & Munari (2006). To get a better coverage, we complemented our CCD measurements with those from the AAVSO database 333https://www.aavso.org/data-download.
2. Photoelectric photometry was carried out in the G2 pavilion by a single-channel photometer mounted in the Cassegrain focus (see Vaňko et al. 2015a, b, in detail). The star HD 207 933 ( = 8.10, = 1.05, = 0.97) was used as the comparison star. Internal uncertainties of these one-day-mean measurements are of a maximum of a few mag in , but smaller in other filters. Our photometric measurements are summarised in Table 1.
Multicolour photometry was used mainly to convert the relative and/or arbitrary flux units of the low-resolution and/or the medium-resolution spectra to absolute fluxes. To obtain flux-points of the true continuum, we determined corrections for emission lines by using our low-resolution spectra (see Skopal 2007). Magnitudes were converted to fluxes according to the calibration of Henden & Kaitchuck (1982) and Bessel (1979).
2.2 Spectroscopy
Spectroscopic observations were secured at different observatories and/or private stations:
(i) At the Stará Lesná Observatory in the G1 observing pavilion with a 0.6 m Cassegrain telescope equipped with an eShel fiber-fed spectrograph (Shelyak; optical fiber of 50 m) mounted at the f/5 focus. The detector was an ATIK 460EX CCD camera using chip with 4.54 m square pixels and binning. Reduction of the spectroscopy was performed using dedicated scripts written using the IRAF package tasks, Linux shell scripts, and FORTRAN programs (see Pribulla et al. 2015).
(ii) At the Ondřejov Observatory, medium-resolution spectroscopy was performed using the coude single dispersion slit spectrograph of 2 m reflector and the BROR CCD camera with the SITe-005 8002030 pixels chip. The resolution power at the H region was 13 000. Standard initial reduction (bias subtraction, flat-fielding and wavelength calibration) was carried out using modified IRAF packages (MW).
(iii) At the Crimean Astrophysical Observatory with the 2.6 m Shajn telescope, using a SPEM slit spectrograph mounted at the Nasmith focus. The detector was a SPEC-10 CCD camera with the 1340100 pixels chip. Average resolution was R = 1000. The primary reduction of the spectra, including the bias subtraction and flat fielding, was performed with the SPERED code developed by S.I. Sergeev at the Crimean Astrophysical Observatory (TNT).
(iv) At the private station in Rouen with a 0.36 m Schmidt-Cassegrain telescope (Meade) equipped with an eShel spectrograph (Shelyak, optical fiber of 50 m) mounted at the f/d5.2 focus using a reducer. The detector was an ATIK 460EX CCD camera (pixel size of 4.54 m, binning 22 mode; pixel of 9.08 m) (FT).
(v) At the Fujii Kurosaki Observatory with a 0.4 m Schmidt-Cassegrain telescope F10 (Meade), using a FBSPEC-III spectrograph and a CCD camera ML6303E(FLI) (30722048 pixel) as the detector (MF).
(vi) At the Santa Maria de Montmagastrell Observatory, Tàrrega (Lleida) Spain, using a Control Remote Telescope SC16 equipped with a spectrograph B60050-VI. The detector was an ATIK 460EX CCD camera (JG).
(vii) At the Observatory de la Tourbière with a 0.4 m Ritchey-Chrétien telescope (Astrosib RC400) equipped with an eShel spectrograph (Shelyak, optical fiber of 50 m) mounted at the f/d5.5 focus. The detector was an ATIK 460EX CCD camera (pixel size of 4.54 m, binning 22 mode; pixel of 9.08 m) (OG).
(viii) At the private stations, Manhattan (Illinois) and Grand Lake (Colorado), by a 0.25 m LX200 Schmidt-Cassegrain telescope using a Shelyak Alpy 600 spectrograph. The detector was an ATIK 314L CCD camera (KG).
(ix) At the private station Mill Ridge with a 0.31 m Cassegrain telescope equipped with a classical slit spectrograph coupled with an f/d6.6 reducer to the f/d10 focus. The spectrograph was used with a 23 m slit (2.3 arcsec) and a 1800 l/mm grating in the first order. The detector was a QSI583 (KAF8300 chip) binned 12 giving 0.33 Å/pixel (R = 9000 at H) (T. Lester).
(x) At the Observatoire de Haute-Provence with a 0.2 m Newtonian telescope (Orion N200 f/5) equipped with a Shelyak Alpy 600 spectrograph. The detector was an ATIK 460EX CCD camera (Sony ICX694 sensor, binning 11) (VB).
(xi) At the private station Chelles, with a 0.35 m SCT F11 (Celestron) telescope, using the eShell cross-dispersed echelle spectrograph (Shelyak) and a CCD camera ATIK 460EX with ICX694 (Sony) sensor (T. Lemoult).
(xii) At the private station in L’Aquila with a 0.20 m Schmidt-Cassegrain telescope f/10, a custom built spectrograph, equipped with a 600 l/mm grism. The detector was a SBIG ST-8300M CCD camera (US).
(xiii) At the Observatory de la Couyère (CALC UAI code J23) with a 0.355 m Schmidt-Cassegrain telescope (Meade ACF f/d10) equipped with an Alpy 600 Shelyak spectrograph with 23 m slit. The detector was an ATIK 460EX CCD camera (pixel size of 4.54 m, binning 11) (JM).
(xiv) At the West Challow Observatory using a 0.28 m Schmidt-Cassegrain telescope (Celestron C11) at f/5 with a LISA spectrograph (Shelyak) and SXVR-H694 CCD camera (DB).
Our optical spectroscopy was complemented with the UV/optical and far-UV spectroscopy. The former was carried out by the Faint Object Spectrograph (FOS) onboard the Hubble Space Telescope (HST) during November 11, 1993 (spectra: Y1JO0305T, Y1JO0308T, Y1JO0309T, Y1JO0406T) and during December 1996 (spectra: Y3CK530AT, Y3KK040FT, Y3KK040BT, Y3KK0406T, Y3KK0408T). The latter was carried out by the Far Ultraviolet Spectroscopic Explorer (FUSE) on June 5.618, 2003 (the spectrum q1110103). We used the calibrated time-tag spectrum taken through MDRS aperture in the LiF1A (988–1082 Å) channel.
Low-resolution spectra (, Table 2), preferentially those covering the Balmer discontinuity, were used for modelling the SED. Absolute flux calibration and correctness of the spectra were verified with the aid of the (near-)simultaneous photometry and with the reduced quantity of the resulting model. Medium-resolution spectra (, Table 3) served to analyse variations in the line profiles. Absolute fluxes of the used parts of the spectrum were obtained by linear interpolation between models of the two nearest low-resolution spectra. The HST/FOS spectra were used for modelling the SED of the UV/optical continuum, whereas the FUSE spectrum was used to analyse the O vi 1032 Å line. Observations were dereddened with = 0.1 using the extinction curve of Cardelli et al. (1989) and resulting parameters were scaled to a distance of 800 pc (see Kenyon et al. 1993, and Appendix A in detail). Finally, we determine the orbital phase of the binary according to the ephemeris of the inferior conjunction of the cool giant as (see Fekel et al. 2000),
| (1) |
| JD 2 4… | Note1 | |||||
|---|---|---|---|---|---|---|
| 56997.22 | 9.775 | 9.994 | 8.884 | – | – | PP |
| ………………………………………. | ||||||
| 57281.29 | 7.809 | 8.667 | 7.926 | 6.819 | 6.087 | CCD |
| 57395.21 | 7.769 | 8.713 | 8.000 | – | – | PP |
1 A charge-coupled device (CCD) or photoelectric (PP) photometry
| Datea | JD 2 4… | Region | Rb | Observatoryc | |
|---|---|---|---|---|---|
| yyyy/mm/dd.ddd | [nm] | [s] | |||
| 2013/10/27.087 | 56592.587 | 363-740 | 4267 | 500 | (viii) |
| 2015/06/26.955 | 57200.455 | 370-737 | 1936 | 500 | (xii) |
| 2015/07/16.926 | 57220.426 | 330-757 | 40 | 1000 | (iii) |
| 2015/07/22.977 | 57226.477 | 330-757 | 40 | 1000 | (iii) |
| 2015/07/23.937 | 57227.437 | 330-757 | 20 | 1000 | (iii) |
| 2015/07/24.973 | 57228.473 | 330-757 | 60 | 1000 | (iii) |
| 2015/08/02.014 | 57236.514 | 378-747 | 917 | 984 | (vi) |
| 2015/08/17.983 | 57252.483 | 354-831 | 417 | 695 | (x) |
| 2015/08/19.946 | 57254.446 | 333-755 | 90 | 1000 | (iii) |
| 2015/08/20.933 | 57255.433 | 331-758 | 30 | 1000 | (iii) |
| 2015/08/21.890 | 57256.390 | 329-757 | 90 | 1000 | (iii) |
| 2015/09/04.538 | 57270.038 | 355-860 | 500 | 500 | (v) |
| 2015/09/19.846 | 57285.346 | 330-758 | 30 | 1000 | (iii) |
| 2015/09/26.950 | 57292.450 | 370-740 | 1322 | 637 | (xiii) |
| 2015/10/11.539 | 57307.039 | 355-860 | 500 | 500 | (v) |
| 2015/10/12.589 | 57308.089 | 355-860 | 750 | 500 | (v) |
| 2015/10/13.442 | 57308.942 | 355-860 | 600 | 500 | (v) |
| 2015/10/19.804 | 57315.304 | 330-757 | 20 | 1000 | (iii) |
| 2015/10/21.465 | 57316.965 | 355-860 | 600 | 500 | (v) |
| 2015/10/29.724 | 57325.224 | 330-757 | 30 | 1000 | (iii) |
| 2015/10/30.682 | 57326.182 | 330-757 | 90 | 1000 | (iii) |
| 2015/11/08.037 | 57334.537 | 373-738 | 265 | 525 | (viii) |
| 2015/11/15.453 | 57341.953 | 360-860 | 350 | 500 | (v) |
| 2015/11/23.882 | 57350.382 | 378-747 | 344 | 976 | (vi) |
| 2015/11/29.790 | 57356.290 | 378-747 | 282 | 925 | (vi) |
| 2015/12/08.453 | 57364.953 | 360-860 | 600 | 500 | (v) |
| 2015/12/24.790 | 57381.290 | 390-740 | 1012 | 821 | (xiv) |
| 2016/01/02.761 | 57390.261 | 385-753 | 239 | 772 | (vi) |
Notes. (a) Start of the observation in UT, (b) average resolution, c according to the list in Sect. 2.2.
| Dateb | JD 2 4… | Region | Observatoryd | |
|---|---|---|---|---|
| yyyy/mm/dd.ddd | [nm] | [s] | ||
| 2006/10/18.926 | 54027.426 | 641-692 | 2000 | (ii) |
| 2013/08/11.900 | 56516.400 | 427-761 | 1885 | (xi) |
| 2013/08/29.945 | 56534.445 | 641-688 | 1401 | (ii) |
| 2013/09/04.843 | 56540.343 | 641-688 | 301 | (ii) |
| 2013/09/04.855 | 56540.355 | 466-489 | 801 | (ii) |
| 2013/09/27.978 | 56563.478 | 466-489 | 901 | (ii) |
| 2013/10/07.004 | 56572.504 | 641-688 | 901 | (ii) |
| 2013/10/24.874 | 56590.374 | 466-489 | 601 | (ii) |
| 2013/10/26.793 | 56592.293 | 466-489 | 2001 | (ii) |
| 2013/12/17.716 | 56644.216 | 466-489 | 3601 | (ii) |
| 2015/06/27.227 | 57200.727 | 601-711 | 2047 | (ix) |
| 2015/07/01.011 | 57204.511 | 418-731 | 2747 | (vii) |
| 2015/07/09.999 | 57213.499 | 422-710 | 3600c | (i) |
| 2015/07/17.004 | 57220.504 | 422-710 | 3600c | (i) |
| 2015/07/29.942 | 57233.442 | 421-715 | 1106 | (iv) |
| 2015/08/04.971 | 57239.471 | 422-710 | 3600c | (i) |
| 2015/08/11.006 | 57245.506 | 641-688 | 801c | (ii) |
| 2015/08/13.896 | 57248.396 | 641-688 | 601 | (ii) |
| 2015/08/21.896 | 57256.396 | 421-715 | 1262 | (iv) |
| 2015/08/21.953 | 57256.453 | 641-688 | 421 | (ii) |
| 2015/08/23.002 | 57257.502 | 422-710 | 720 | (i) |
| 2015/08/23.983 | 57258.483 | 422-710 | 900 | (i) |
| 2015/08/25.039 | 57259.539 | 422-710 | 600 | (i) |
| 2015/08/28.927 | 57263.427 | 421-715 | 1798 | (iv) |
| 2015/09/06.883 | 57272.383 | 421-715 | 684 | (iv) |
| 2015/09/10.852 | 57276.352 | 421-715 | 710 | (iv) |
| 2015/09/19.875 | 57285.375 | 421-715 | 692 | (iv) |
| 2015/09/25.837 | 57291.337 | 421-715 | 445 | (iv) |
| 2015/10/01.825 | 57297.325 | 421-715 | 1661 | (iv) |
| 2015/10/08.849 | 57304.349 | 421-715 | 985 | (iv) |
| 2015/10/11.779 | 57307.279 | 421-715 | 888 | (iv) |
| 2015/10/12.131 | 57307.631 | 600-710 | 1175 | (ix) |
| 2015/10/13.777 | 57309.277 | 421-715 | 1197 | (iv) |
| 2015/10/20.830 | 57316.330 | 421-715 | 678 | (iv) |
| 2015/10/25.747 | 57321.247 | 421-715 | 1408 | (iv) |
| 2015/10/27.780 | 57323.280 | 422-710 | 1440 | (i) |
| 2015/11/01.771 | 57328.271 | 421-715 | 579 | (iv) |
| 2015/11/01.807 | 57328.307 | 418-731 | 5533 | (vii) |
| 2015/11/01.817 | 57328.317 | 641-688 | 2001 | (ii) |
| 2015/11/01.840 | 57328.340 | 466-489 | 1207 | (ii) |
| 2015/11/13.749 | 57340.249 | 421-715 | 1271 | (iv) |
| 2015/11/25.801 | 57352.301 | 421-715 | 836 | (iv) |
| 2015/12/07.805 | 57364.305 | 421-715 | 679 | (iv) |
| 2015/12/12.803 | 57369.303 | 421-715 | 1214 | (iv) |
| 2015/12/23.735 | 57380.235 | 421-715 | 520 | (iv) |
| 2015/12/29.761 | 57386.261 | 421-715 | 702 | (iv) |
| 2016/01/08.720 | 57396.220 | 422-710 | 1800 | (i) |
| 2016/01/13.723 | 57401.223 | 421-715 | 1458 | (iv) |
Notes. a Average resolution is 11000, b start of the observation in UT, c H saturated, d according to the list in Sect. 2.2.
| Date | ST | /d.o.f. | ||
| Quiescent phase | ||||
| 1993/11/13.463a | 3.5d | 15000 | 0.329 | – |
| 1996/12/12.209b | 3.5 | 28000 | 0.188 | 0.630/1648 |
| 2013/10/27.087 | 2.6 | 17500 | 0.740 | 1.265/1396 |
| Active phase | ||||
| 2015/06/26.955 | 1.4 | 30000c | 9.11 | 0.649/1006 |
| 2015/07/16.926 | 1.4 | 23500 | 5.93 | 1.410/1689 |
| 2015/07/22.977 | 2.2 | 22000 | 4.69 | 1.193/1618 |
| 2015/07/23.937 | 1.5 | 26500 | 4.72 | 0.739/1468 |
| 2015/07/24.973 | 2.3 | 22000 | 4.57 | 1.118/1667 |
| 2015/08/02.014 | 1.7 | 26000c | 3.91 | 0.841/3720 |
| 2015/08/17.983 | 1.8 | 21000 | 1.89 | 1.183/6091 |
| 2015/08/19.946 | 1.8 | 19500 | 2.42 | 1.518/1536 |
| 2015/08/20.933 | 2.5 | 19000 | 2.35 | 1.163/1544 |
| 2015/08/21.890 | 2.3 | 19500 | 2.36 | 1.693/1590 |
| 2015/09/04.538 | 2.1 | 19500c | 2.14 | 1.073/901 |
| 2015/09/19.846 | 2.5 | 20000 | 2.31 | 1.616/1685 |
| 2015/09/26.950 | 1.7 | 22000c | 2.32 | 0.790/4835 |
| 2015/10/11.539 | 1.9 | 24500 | 5.59 | 0.763/1062 |
| 2015/10/12.589 | 2.1 | 26000 | 5.89 | 0.881/1019 |
| 2015/10/13.442 | 2.1 | 26000 | 5.97 | 1.000/1113 |
| 2015/10/19.804 | 1.6 | 26500 | 4.42 | 0.806/1671 |
| 2015/10/21.465 | 1.6 | 26500 | 6.27 | 1.214/1053 |
| 2015/10/29.724 | 1.8 | 23500 | 4.78 | 0.938/1672 |
| 2015/10/30.682 | 2.3 | 23000 | 4.56 | 0.930/1684 |
| 2015/11/08.037 | 2.3d | 23000c | 4.33 | 0.930/2142 |
| 2015/11/15.453 | 1.9 | 24000 | 4.06 | 0.804/979 |
| 2015/11/23.882 | 2.3d | 23000c | 3.90 | 1.449/1312 |
| 2015/11/29.790 | 2.3d | 23000c | 3.19 | 1.020/3716 |
| 2015/12/08.453 | 2.3d | 15000 | 2.30 | 0.734/1109 |
| 2015/12/24.790 | 2.3d | 23000c | 1.82 | 0.755/2640 |
| 2016/01/02.761 | 2.3d | 19000c | 1.53 | 1.275/4322 |
Notes. (a) Hot component: K, , ; (b) K, , . (c) estimated using the photometric flux in ; (d) adopted value.
3 Analysis and results
3.1 Photometric evolution
Figure 1 shows the -LC of AG Peg, which demonstrates that its nova-like outburst terminated around 1997, when the overall decline ended and the orbitally related wave-like variation reached its maximum ( mag), varying around 9.7 mag until June 2015. The pronounced wave like variability in the optical continuum represents a distinctive photometric feature of quiescent phases of symbiotic binaries (e.g. Hoffleit 1968; Pucinskas 1970; Meinunger 1979). This periodic variation is given by apparent changes of the nebular component of radiation as a function of the orbital phase (see Fig. 3 of Skopal 2008, and Sect. 3.2.2 below). According to the STB model, these changes can be caused by the densest parts of the ionised wind from the giant, which is partially optically thick and located in between the binary components (see Skopal 2001). During outbursts stages, the major source of the nebular radiation is represented by the ionised wind from the hot component, whose emissivity is not orbitally related, but follows the mass-loss rate (see Skopal 2006). From this point of view, the increasing amplitude of the wave-like variation along the decline of AG Peg is a result of weakening of the nebular emission from the hot star’s wind, which is consistent with the observed decrease of the mass-loss rate from the hot component (Sect. 1). Transition of AG Peg to quiescent phase at some point during 1995–2000 (see Fig. 1) thus triggered the accretion process – a fundamental condition for the new energetic event.
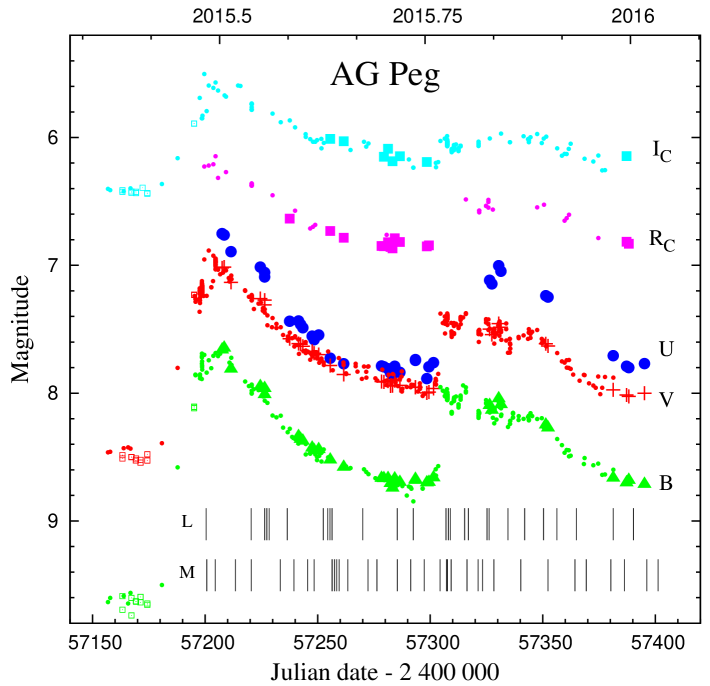
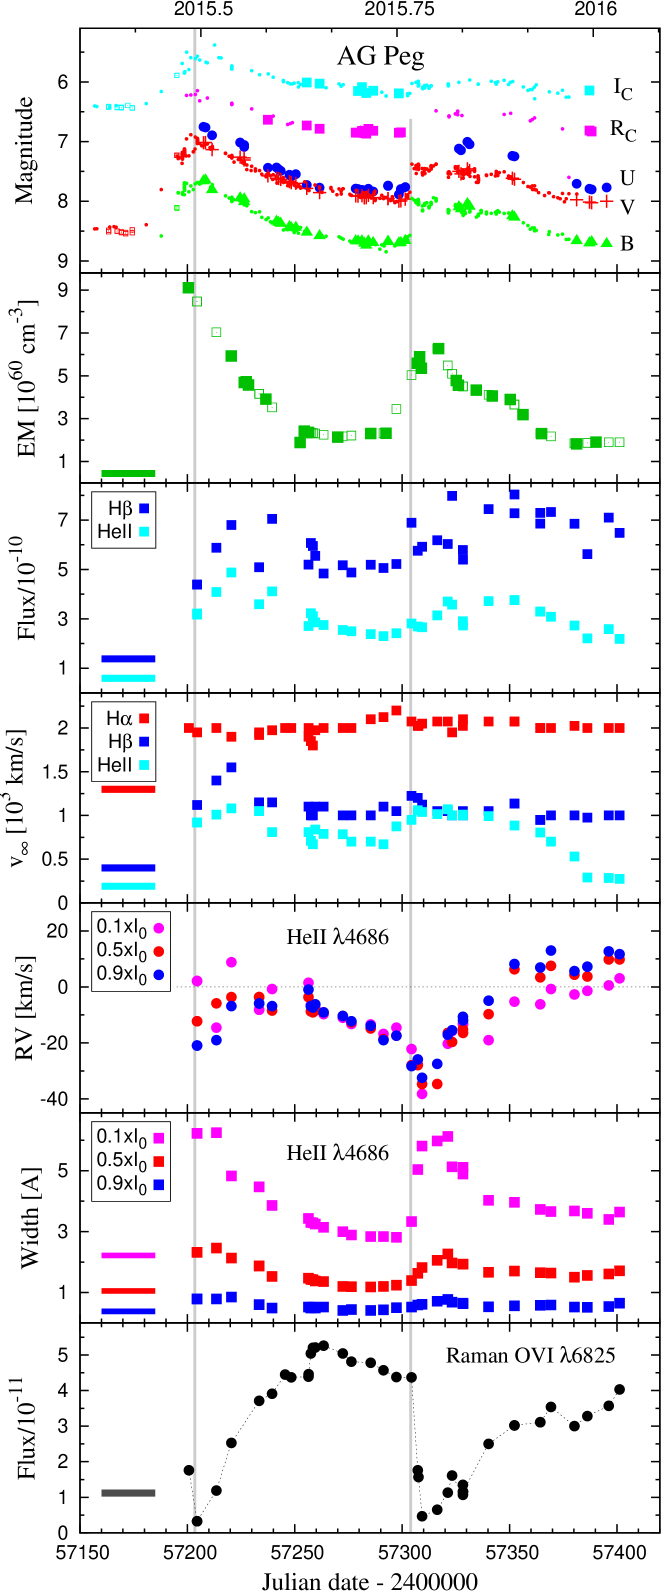
During June of 2015, AG Peg commenced a new active phase (see Figs. 1 and 2). According to and CCD measurements from the AAVSO database and those collected by the VSOLJ observer Hiroyuki Maehara, the brightening started on June 5.10, 2015 (JD 2 457 177.6) at and , and reached a maximum on June 30.0, 2015 (JD 2 457 203.5) at and mag. A three months gradual decline was interrupted by a weaker secondary brightening by , and mag on October 8.5, 2015 (JD 2 457 304.0) on the time-scale of 1 day. Then, the LCs showed a plateau phase until November 23, 2015, after which the brightness gradually decreased to values similar to those prior to the secondary eruption, at the end of the observing season of AG Peg in January 2016 (see Fig. 2). Such evolution in the multicolour LC of symbiotic binaries (brightening, timescale, and multiplicity) is classified as the Z And-type outburst.
3.2 Spectroscopic evolution
In this section we determine physical parameters by modelling the continuum and analysing the line spectrum. We describe their temporal evolution along the outburst. Evolution of the main spectroscopic and physical parameters is depicted in Figs. 5 and 7. Corresponding data are included in Tables 4, 5, and 6.
3.2.1 Modelling the SED
According to properties of symbiotic stars (see Sect. 1), their observed spectrum, , can be expressed as a superposition of its three basic components,
| (2) |
where , and represent radiative contributions from the hot component, nebula, and giant, respectively. Because of the very high temperature of the hot component ( K, Sect. 1), we observe only its long-wavelength tail in the UV/optical range, which can be approximated by a blackbody radiation. The nebular continuum was ascribed to processes of recombination and thermal bremsstrahlung in the hydrogen plasma for Case B, because no feature of the He+ and He+2 nebular continuum was recognisable in the spectrum (e.g. the 2051 Å discontinuity) and all the continua are similar in the profile (Brown & Matthews 1970). Finally, the radiation from the giant was compared with a synthetic spectrum, , according to models of Fluks et al. (1994). Then Eq. (2) can be expressed as (Skopal 2005b),
| (3) |
where the angular radius of the hot component, , is given by its effective radius, (i.e. the radius of a sphere with the same luminosity) and the distance . The factor [cm-5] scales the volume emission coefficient [] of the nebular continuum to observations. Further, the electron temperature, , and thus are assumed to be constant throughout the nebula, which simplifies determination of the emission measure of the nebula to EM = cm-3 (see Eq. (9) of Skopal 2015). Angular radius of the giant, , can be obtained from its observed bolometric flux,
| (4) |
The variables determining the model SED are , , , , and . In the SED-fitting analysis, we compared a grid of models (3) with the observed continuum, and selected the one corresponding to a minimum of the reduced function. More details can be found in Skopal (2005b, 2015).
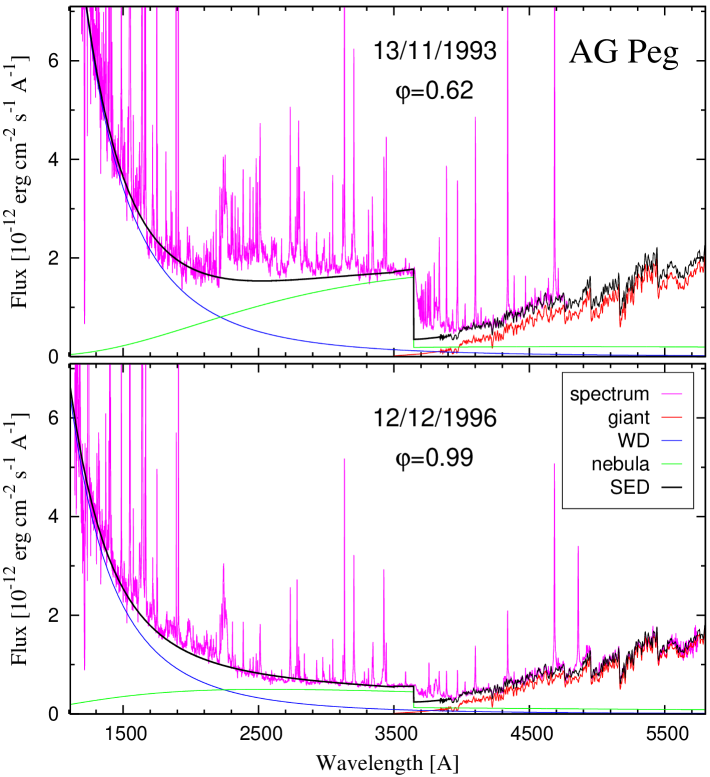
In modelling the UV/optical continuum from 1993 and 1996, we adopted K as indicated during quiescent phase (see Sect. 3.2.4). For the 1996 spectrum, we simultaneously fitted 133 continuum fluxes from 1144 to 3644 Å with 1520 flux-points from 3743 to 5635 Å. In this way we obtained parameters, , , and the spectral type ST (i.e. ) of the giant according to calibration of Fluks et al. (1994). For the 1993 spectrum, we fitted only 15 continuum fluxes between 1280 and 3600 Å, because of very rich emission-line spectrum creating a bump between 2200 and 2600 Å. Here, parameters , and were obtained. To match also a short optical part of the spectrum ( Å), the synthetic spectrum from the 1996 model was scaled to the observed continuum by eye. Therefore, we do not infer the value of for this model SED.
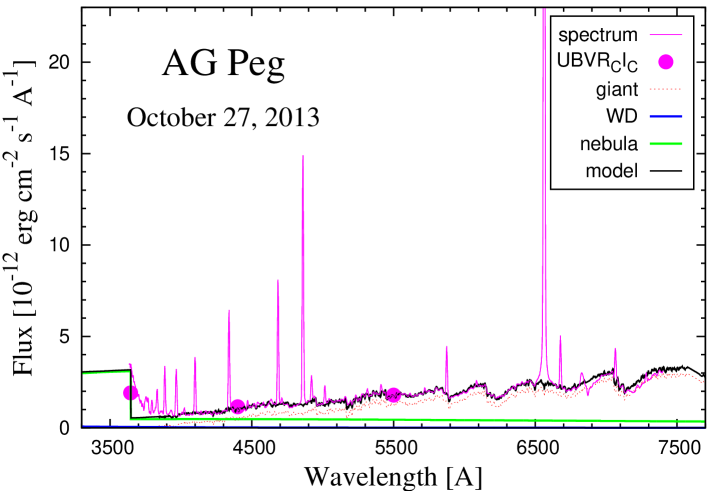
To fit just the optical continuum, the method is able to disentangle contributions only from the nebula and the RG, because the WD radiation is negligibly small in the optical at the observed very high temperatures. Therefore, it was possible to determine only parameters, , , and ST. We also determined a subclass of the ST by a linear interpolation between the neighbouring best-fitting STs. Because the radiation from the giant can vary, the scaling factor of the synthetic spectra represents another parameter in the model SED.
The continuum fluxes were selected by eye. Within the optical, we distinguished the line-free regions with the aid of the synthetic spectrum of the giant. Spectral regions between the Balmer jump and 3800 Å, from 4720 to 4830 Å, and from 6860 to 6960 Å were omitted from modelling because of blends of hydrogen emission lines, a large difference from the synthetic spectrum, and the water vapour absorptions in the Earth’s atmosphere, respectively. A close comparison of the observed and synthetic spectrum revealed uncertainties of the spectral calibration to 5–10% between 4200 and 7100 Å, while the ends of most spectra were inclined from their model prediction up to 20% (see Fig. 4). Considering spectral ranges with a better and worse calibration, and for the sake of simplicity, we adopted uncertainties of selected continuum fluxes at all low-resolution spectra of 7%.
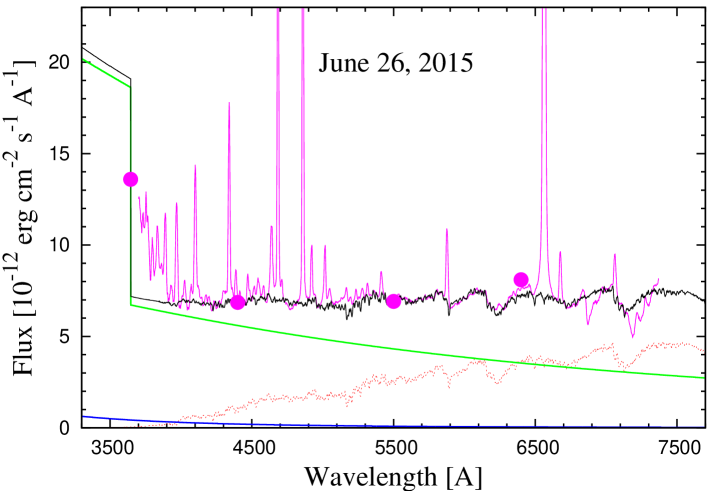
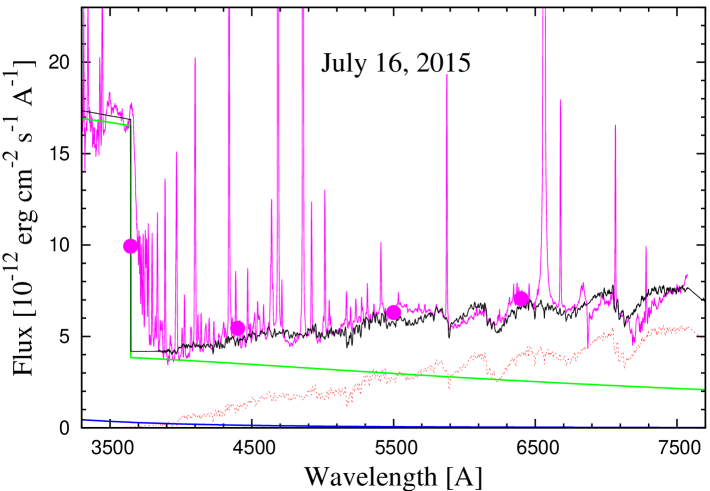
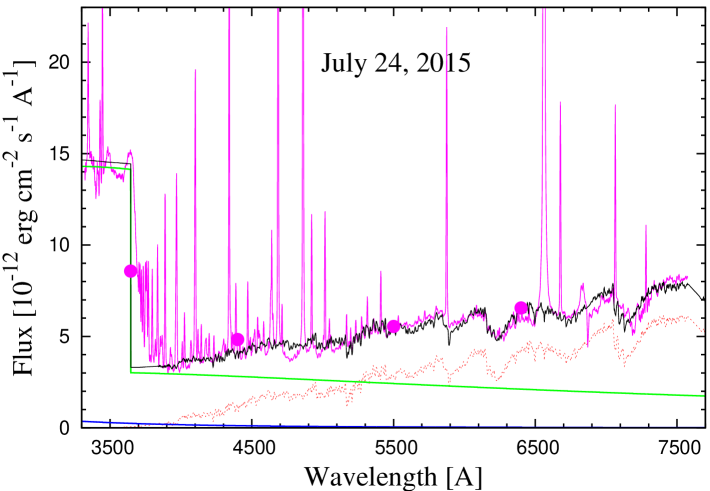
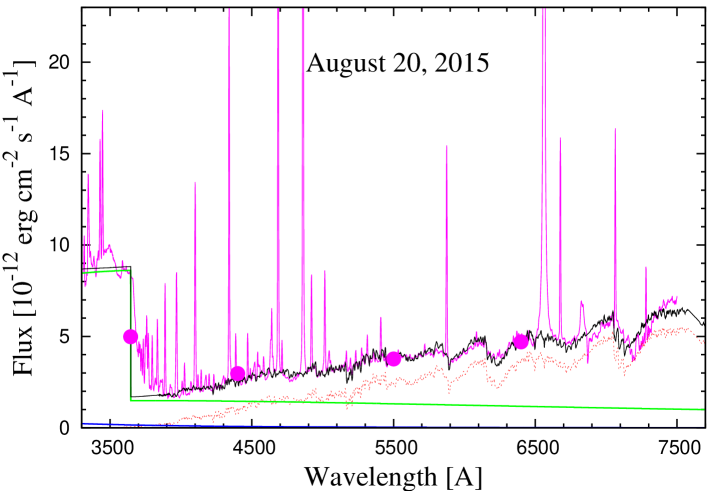
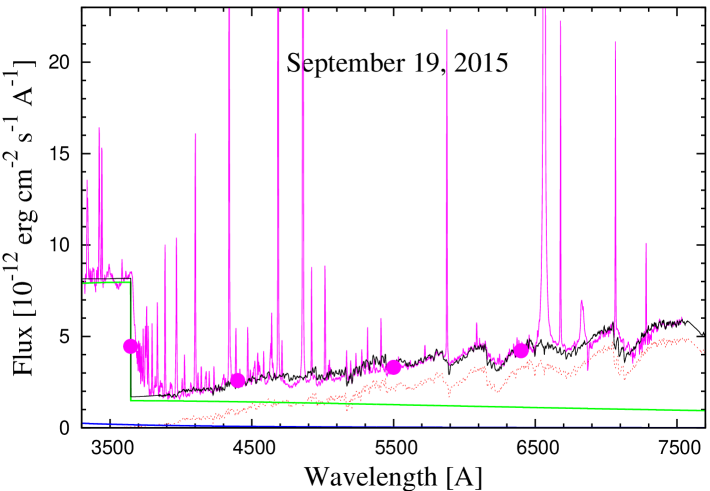
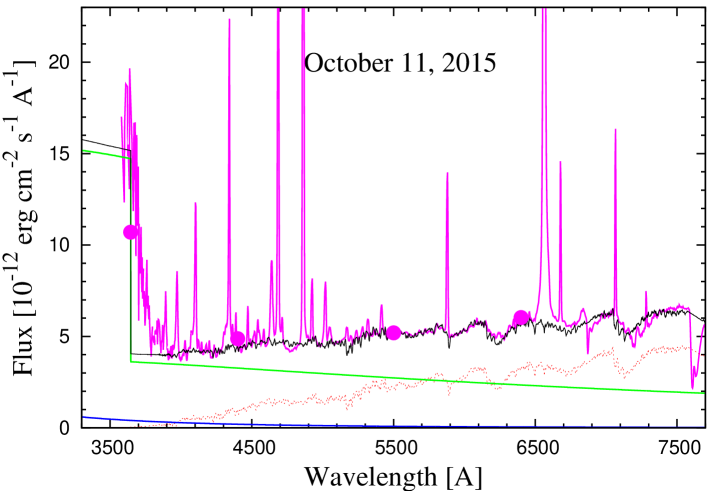
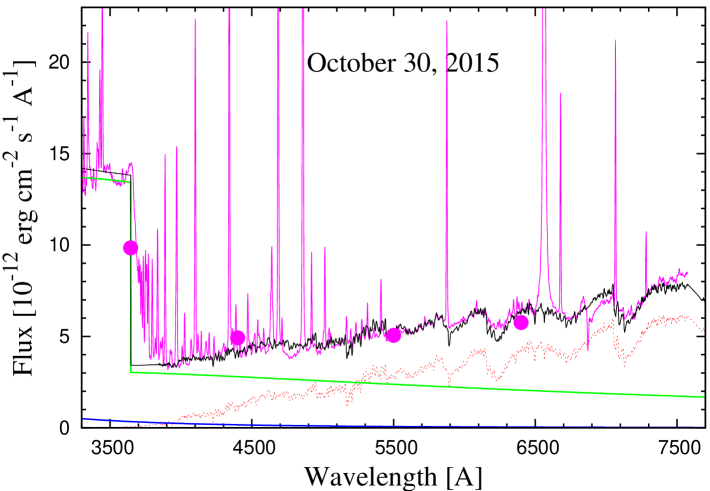
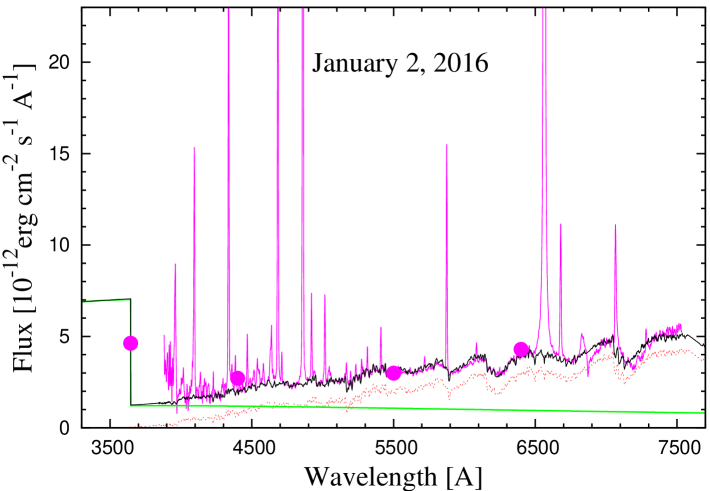
The resulting parameters are listed in Table 4 and examples of model SEDs are depicted in Figs. 3 and 4.
3.2.2 Emission measure
Our model SEDs revealed the presence of a strong nebular component of radiation during both the quiescent and active phase of AG Peg. It dominated the spectrum from the near-UV to around the passband (see Figs. 3 and 4).
During quiescent phase, varies with the orbital phase. This is demonstrated by model SEDs of the HST spectra taken at the orbital phase and 0.99 (Fig. 3, Table 4). If we convert the model fluxes at the band to the scale of the observed magnitudes, we get an excellent agreement with the photometric -LC (see the red points in Fig. 1). To get the proper quantity of the nebular contribution, we considered the emission coefficient as the weighted average of its values from both sides of the Balmer jump, (see Cariková & Skopal 2010), multiplied by the model parameter (Eq. (3)). Adding model contributions from the giant and hot component, we obtained magnitudes corresponding to the true dereddened continuum. To get the observed magnitudes, we added a correction for the emission lines, mag (Skopal 2007) and the reddening of +0.48 mag in the passband. In this way we obtained = 9.18 and 10.29 for the above mentioned orbital phases. Similarly, we obtained from the model SED on October 27, 2013 (). This result confirms that the periodic wave-like variation in the -LC of AG Peg from was caused by the apparent orbital changes in the , similarly to variation during quiescent phases of other symbiotic stars (see Skopal 2001, and Sect. 3.1 above).
During the outburst, increased by a factor of , and its quantity followed the LC profile (see Fig. 5). No orbitally related variation could be recognised. This implies that the large nebular emission was produced by a different source than during quiescence. According to the ionisation structure of hot components during active phases (Cariková & Skopal 2012), and a significant broadening of the H i and He ii line profiles (Fig. 6), the large was generated by the ionised wind from the hot component (Skopal 2006).
3.2.3 He ii 4686 Å and H lines
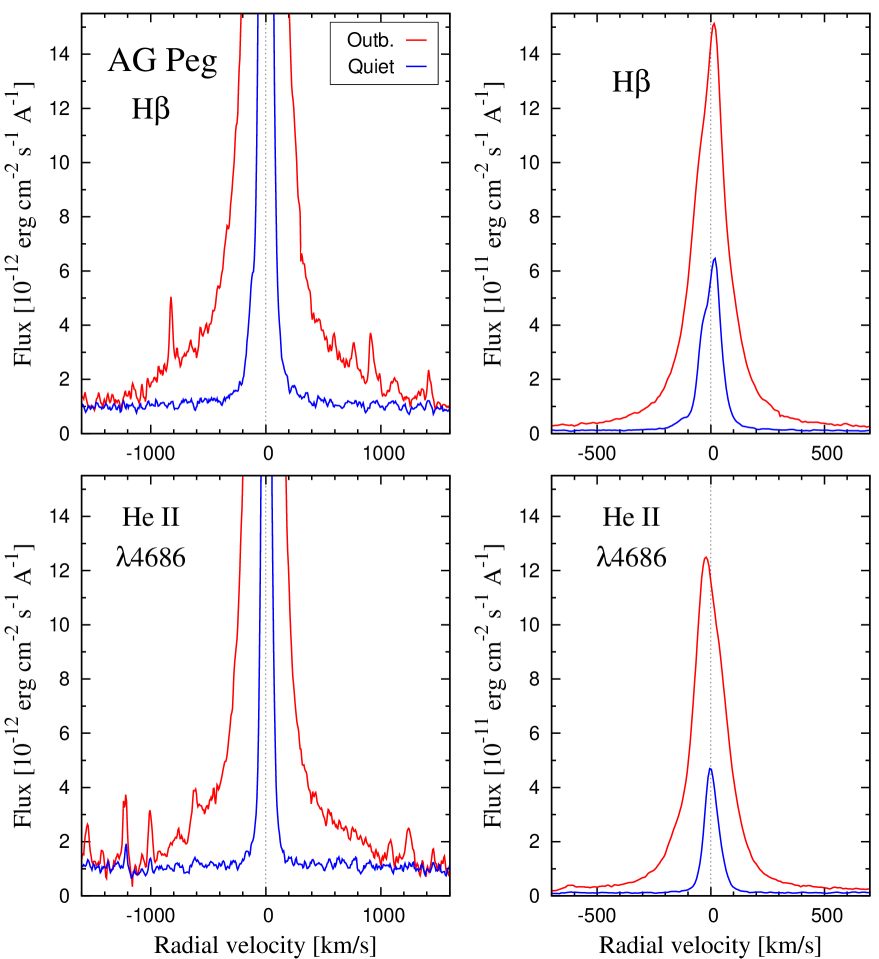
Basic properties of the symbiotic nebula during the outburst – the ionised wind from the hot component – can be probed by analysing recombination lines, He ii 4686 Å and H. The zones of their ions can be different in size, and subject to variation during the outburst. Both lines were well exposed at all our spectra. The He ii 4686 profile was more or less symmetrical, whereas the H emission was attenuated by an absorption component from its blue side. Therefore, to estimate the total emission of the H line, we removed the absorption component by fitting the emission core with Gaussian curves. Evolution of He ii 4686 and H parameters is depicted in Fig. 5, and can be summarised as follows.
(i) During the outburst, fluxes of He ii 4686 Å and H lines increased by a factor of with respect to values from the preceding quiescence. Their variation basically copied that in LCs and EM, but with a less steep increase during the June/July and October 2015 brightening. A significant broadening of their profiles immediately after the optical maximum is depicted in Fig. 6.
(ii) A distinctive change was observed in their broad wings. During quiescence, no broad wings in the He ii 4686 Å profile were clearly seen. We measured just the core emission with HWZI km s-1. In the H profile, weak broad wings terminated at km s-1. During the outburst, broad wings expanding to the terminal velocity km s-1 developed in both the lines. In the H profile, did not change significantly for the whole observing period, whereas of He ii 4686 Å was variable and, at the end of 2015, decreased to values of the quiescent phase. This suggests a variable size of the He+2 zone during the outburst (see Sect. 4.5 in detail).
(iii) Broadening of the whole He ii 4686 Å profile (we measured its width at 0.1, 0.5 and 0.9) was significant at/after the optical maxima. For example, the width at 0.1 increased with a factor of relative to quantities of the quiescent phase. The broadening of the line correlates with the evolution in the EM and (Figs. 5 and 7), which justifies that the nebular emission was produced by the enhanced ionised wind from the WD during the outburst.
(iv) The position of the profile shifted temporarily towards negative radial velocities (RVs) with a maximum of km s-1 just after the October brightening, and returned back to the position of its reference wavelength at the end of November 2015 (third panel from the bottom). This interesting effect is probably connected with the ionisation structure of the hot component and its evolution in the course of the outburst (see Sect. 4.8 in detail).
3.2.4 Temperature of the ionising source
Based on the fact that the presence of ions in the nebula requires the presence of photons with , where is the ionisation energy necessary to ionise to , Mürset & Nussbaumer (1994) found an empirical relation between the temperature of the ionising source, , and the ionisation potential of the ion as
| (5) |
Thus the presence of an ion with the highest ionisation energy, , determines the lower limit of . Using this approach to the spectrum of AG Peg, the presence of the O vi 1032 Å line and/or its Raman scattered counterpart at 6825 Å (see Sect. 3.2.7) requires K, because = (O eV.
Having only optical spectra available, we can use the He ii()/H flux ratio to estimate . Under optically thick conditions, where the nebular flux growths from complete absorption of stellar photons solely by He+ ions, , and the nebular flux results from complete absorption of photons between the frequency and , , a relationship for the flux ratio can be expressed as,
| (6) |
where is the ionising frequency of hydrogen (e.g. Gurzadyan 1997). and are effective recombination coefficients for the given transition, whereas and are total recombination coefficients of He+ and H0 for the Case B. Dominant absorption of photons by He+ ions within the innermost He+2 zone is due to recombinations of He+2 to He+ that produce sufficient quanta to keep the hydrogen ionised (Hummer & Seaton 1964). This procedure was first suggested by Ambartsumyan (1932) and later modified by more authors (e.g. Iijima 1981; Kaler & Jacoby 1989).
The presence of both high and low ionisation species in the spectrum of AG Peg (e.g. O vi, [Fe vii], [O iii], N iii, He ii, H i, He i, Fe ii, [O i] ) suggests that its nebula is rather ionisation-bounded, that is, the stellar radiation above (13.6 eV) is absorbed within the nebula (see Kaler & Jacoby 1989, and references therein). The right side of Eq. (6) assumes that the lines are optically thin. This, however, need not to be satisfied in the very dense symbiotic nebulae (e.g. the decrement of hydrogen Balmer lines usually departs from theoretical prediction). However, the ratio of the fluxes lowers possible deviation from the optically thin case. Applying Eq. (6) to He ii()/H flux ratios in the spectrum of AG Peg (Table 6), we used recombination coefficients from Hummer & Storey (1987) for = 20000 K (Table 4) and electron concentration, cm-3 (see Skopal et al. 2011): , , and cm3 s-1. According to possible large uncertainties of and , it is important to note that the ratio of to (line) depends on and only marginally. Equation (6) then reads as,
| (7) |
where the number of quanta on the left side was calculated for Planck’s function. Resulting runs from K at the beginning of the outburst to K in January 2016 (see Fig. 7 and Table 5).
During the quiescent phase, the nebula is only partly ionisation-bounded, that is, a fraction of ionising photons escapes the nebula. As the H+ zone is always more open than the He+2 zone (in the sense of the STB model, see Fig. 1 of Nussbaumer & Vogel 1987), the relative fraction of the non-absorbed photons capable of ionising hydrogen will always be larger than that capable of ionising He+ ions. As a result, the observed ratio in Eq. (6). Therefore, during quiescent phases, the He ii/H method indicates only the upper limit of . In addition, and thus changes with orbital phase (see Kenyon et al. 2001), because the nebula is partially optically thick (Sect. 3.1). As Eq. (6) assumes that both the lines are optically thin, maximum fluxes at (WD in front) correspond to the most appropriate upper limit of . Our values of 156–168 kK (Table 5) that we obtained during the quiescent phase around , thus represent an upper limit of . Therefore, in modelling the SED during the quiescent phase (Sect. 3.2.1) we adopted a lower value of K.
Kaler & Jacoby (1989) used the Ambartsumyan’s approach and calculated the Zanstra H i and He ii temperatures. In an iteration process, forcing agreement between all temperatures, they derived the so-called ‘crossover temperature’, . For they determined its polynomial approximation as
| (8) |
where . In this way determined values of were higher than those obtained by the He ii()/H method. A larger difference of 15–18% was indicated only at the beginning of the outburst (see Fig. 7).
Independently, a high was suggested by Luna et al. (2015), who detected a supersoft black-body type component in the X-ray spectrum of AG Peg with kT keV by the Swift satellite at the end of June 2015. However, Ramsay et al. (2016) did not mention this result, because they couldn’t find strong evidence to confirm the presence of this supersoft component (Luna 2016, private communication).
3.2.5 Luminosity and radius of the ionising source
Having independently determined values of and , we can estimate the luminosity of the hot component, and thus its effective radius, under the assumption that the total flux of its ionising photons, , is balanced by the total rate of recombinations within the ionised volume , that is,
| (9) |
In this way the ionising photons are converted into the diffuse radiation, which we indicate in the spectrum as the nebular continuum and emission lines. Its amount in the continuum is given by the value of EM, which is determined by the component in the model SED as (see Sect. 3.2.1),
| (10) |
This includes the kinetic energy of free electrons released into the continuum via f–f and f–b transitions. Using the expression for given by Eq. (11) of Skopal (2001), the luminosity of the ionising source, which generates the observed EM, can be expressed as
| (11) |
where the function
| (12) |
determines the flux of ionising photons emitted by 1 cm2 area of the hot component photosphere (cm-2 s-1). Finally, the effective radius of the hot component, , is determined according to Stefan-Boltzmann law as
| (13) |
where is the Stefan-Boltzmann constant.
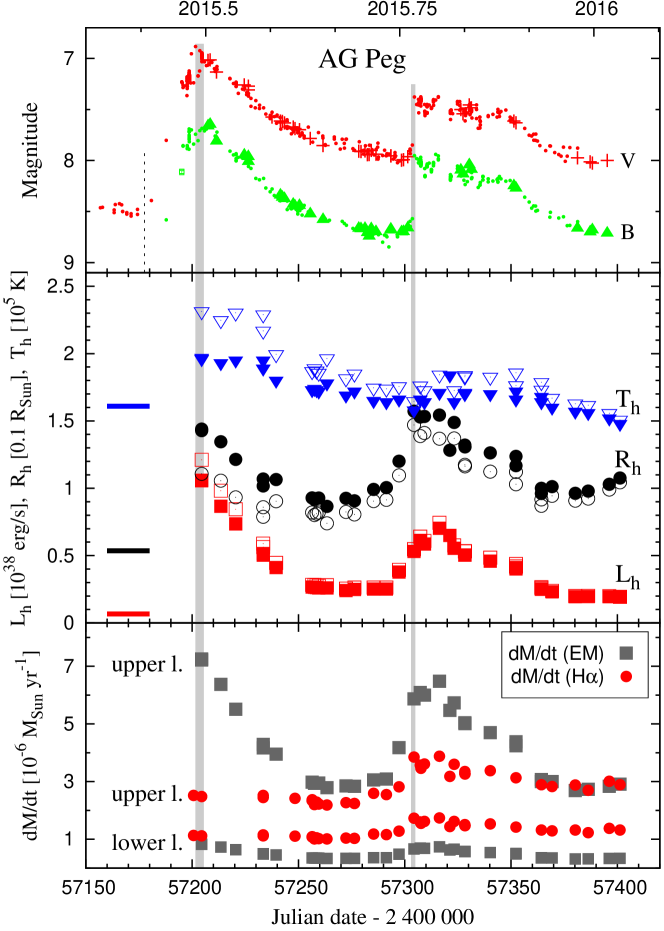
To determine using and EM, we interpolated the original values of EM obtained from the low-resolution spectra to dates of medium-resolution spectra (the source of , see Fig. 5). Temporal evolution of parameters , , and along the outburst is shown in Fig. 7. Corresponding data are in Table 5.
Maximum values of all parameters correspond to the maximum of the star’s brightness, because the nebular emission dominated the optical. As this component was strong and variable (Fig. 4), the evolution in the EM thus governed the profile of both the LC and other dependent parameters in the course of the outburst (see Sect. 4 in detail).
3.2.6 Mass-loss rate from the hot component
It was shown that the nebular emission during active phases of symbiotic stars is generated by the ionised stellar wind from their hot components (Skopal 2006). Hence, the significant increase of the nebular emission in the spectrum of AG Peg, in both the continuum and lines (see Figs. 5 and 6), suggests a significant increase of the mass-loss rate, , from its hot component in the form of ionised wind. Below we estimate from the nebular continuum and the H emission.
We assume a spherically symmetric wind around the hot component with the beginning at the radial distance from the WD centre , that becomes optically thin at . Further, the particle velocity of the wind satisfies the -law wind as introduced by Lamers & Cassinelli (1999),
| (14) |
where determines the acceleration of the wind, is its terminal velocity, and the parameter is given by
| (15) |
where is the initial velocity of the wind at its origin.
Mass-loss rate from the EM. For the ionised wind, as specified above, we can express its EM as (see Appendix C),
| (16) |
where is the mean molecular weight and is the mass of the hydrogen atom. Extension of H wings suggests km s-1 (Fig. 5). According to a model of the broad H wings in the spectra of symbiotic binaries (see Skopal 2006), we adopted and, according to Cariková & Skopal (2012), we adopted = 50 km s-1. We assume that the wind becomes optically thin in the continuum at the WD’s pseudophotosphere, that is, . Following the theory of the so-called optically thick wind in nova outbursts, in which the matter is accelerated deep inside the photosphere (e.g. Kato & Hachisu 1994), we can estimate the lower and the upper limit of the mass-loss rate as follows.
-
•
If the wind begins at the WD’s pseudophotosphere (= the optically thick/thin interface of the wind), that is, , we obtain the lower limit of (see Eq. (16)). The measured values of EM and imply .
-
•
If the wind begins at the WD’s surface, that is, , Eq. (16) provides the upper limit of . Our measurements and correspond to .
In the real case, the wind probably begins somewhere between and . For example, setting = 0.06 results in . Table 5 presents the average of the upper and lower limit of . We note that the method is not applicable for the quiescent phase, because the corresponding EM represents the nebular emission from the ionised wind from the giant.
Mass-loss rate from the H flux. Using the same assumptions as for the continuum radiation, the measured flux in the H line, , allows us to express its luminosity as
| (17) |
where is the effective recombination coefficient for the H transition, and and is the concentration of electrons and protons in the spherical H+ zone with the inner radius , at which the wind becomes optically thin in the H line. This fundamental condition was treated by Leitherer (1988) for stellar winds of OB stars. He found that winds of O stars are optically thin from a distance . Also, modelling the broad H wings in the spectra of symbiotic stars suggested the validity of the optically thin regime from about 1.2 to 1.5 (Skopal 2006). Therefore, we adopted .
Applying Eq. (17), with the expression for the EM given by Eq. (16), to our values of and (Tables 5 and 6), we obtain for , and for . We used the volume emission coefficient .
| Date | ||||
| Quiescent phase | ||||
| 2013/08/11.900 | 0.6 | 0.056 | 1.56 | – |
| 2013/09/04.855 | 0.6 | 0.058 | 1.54 | – |
| 2013/09/27.978 | 0.7 | 0.054 | 1.60 | – |
| 2013/10/24.874 | 0.7 | 0.053 | 1.62 | – |
| 2013/10/26.793 | 0.7 | 0.051 | 1.66 | – |
| 2013/12/17.716 | 0.7 | 0.050 | 1.68 | – |
| Active phase | ||||
| 2015/07/01.011 | 10.6 | 0.143 | 1.97 | 4.0 |
| 2015/07/09.999 | 8.7 | 0.135 | 1.93 | 3.5 |
| 2015/07/17.004 | 7.4 | 0.121 | 1.95 | 3.1 |
| 2015/07/29.942 | 5.0 | 0.107 | 1.89 | 2.4 |
| 2015/07/29.942 | 5.2 | 0.102 | 1.95 | 2.3 |
| 2015/08/04.971 | 4.1 | 0.106 | 1.80 | 2.2 |
| 2015/08/21.896 | 2.7 | 0.093 | 1.73 | 1.7 |
| 2015/08/23.002 | 2.7 | 0.092 | 1.74 | 1.6 |
| 2015/08/23.983 | 2.6 | 0.092 | 1.73 | 1.6 |
| 2015/08/25.039 | 2.6 | 0.093 | 1.72 | 1.6 |
| 2015/08/28.927 | 2.6 | 0.087 | 1.78 | 1.6 |
| 2015/09/06.883 | 2.4 | 0.092 | 1.69 | 1.6 |
| 2015/09/10.852 | 2.5 | 0.091 | 1.72 | 1.6 |
| 2015/09/19.875 | 2.5 | 0.099 | 1.65 | 1.7 |
| 2015/09/25.837 | 2.5 | 0.101 | 1.64 | 1.7 |
| 2015/10/01.825 | 3.8 | 0.120 | 1.66 | 2.3 |
| 2015/10/08.849 | 5.3 | 0.157 | 1.58 | 3.3 |
| 2015/10/11.779 | 6.1 | 0.153 | 1.66 | 3.4 |
| 2015/10/13.777 | 5.9 | 0.153 | 1.64 | 3.3 |
| 2015/10/20.830 | 7.0 | 0.154 | 1.71 | 3.6 |
| 2015/10/25.747 | 6.5 | 0.128 | 1.84 | 3.0 |
| 2015/10/27.780 | 5.5 | 0.149 | 1.64 | 3.2 |
| 2015/11/01.771 | 5.0 | 0.132 | 1.70 | 2.8 |
| 2015/11/01.807 | 5.0 | 0.130 | 1.72 | 2.7 |
| 2015/11/01.840 | 5.0 | 0.131 | 1.71 | 2.8 |
| 2015/11/13.749 | 4.6 | 0.126 | 1.70 | 2.6 |
| 2015/11/25.801 | 4.1 | 0.117 | 1.72 | 2.4 |
| 2015/12/07.805 | 2.5 | 0.100 | 1.64 | 1.7 |
| 2015/12/12.803 | 2.3 | 0.101 | 1.60 | 1.7 |
| 2015/12/23.735 | 1.9 | 0.096 | 1.57 | 1.5 |
| 2015/12/29.761 | 2.0 | 0.098 | 1.56 | 1.5 |
| 2016/01/08.720 | 2.0 | 0.103 | 1.52 | 1.6 |
| 2016/01/13.723 | 1.9 | 0.108 | 1.48 | 1.6 |
Notes. a) According to Eq. (7), b) the method is not applicable for quiescent phase.
3.2.7 Raman-scattered O vi lines
Schmid (1989) first identified broad emission bands at 6830 Å and 7088 Å in symbiotic stars as a result of Raman-scattering of the O vi 1032 Å and 1038 Å line photons on neutral hydrogen atoms. The Raman scattered O vi features were also observed in the spectrum of AG Peg (Schmid et al. 1999, and this paper).
The last observation of the O vi 1032 and 1038 Å doublet was obtained with the FUSE satellite during quiescent phase, on June 5.618, 2003, near to the inferior conjunction of the giant (, see Fig. 1). We estimated the observed flux of the O vi 1032 Å line to , which corresponds to the dereddened flux of (see Appendix B). During the quiescent phase (our spectra from 2006 and 2013), the of the Raman O vi 6830 Å line was 25–30 Å, and its dereddened flux of 12.5. These quantities give the efficiency of the Raman scattering (= ) of %. The width of the Raman line was comparable with that measured during 1993 and 1996, whereas its dereddened flux increased by a factor of and the scattering efficiency by a factor of (see Table 7 of Schmid et al. 1999). The increase of the Raman scattering efficiency was probably caused by an enlargement of the neutral hydrogen region on the sky of the O vi zone located around the WD. This is according to the basic ionisation structure of symbiotic stars during quiescence, where the angular size of the neutral H i region, as seen from the WD, depends on the flux of ionising photons from the WD and on the flux of neutral hydrogen from the giant (STB). Since the hot component luminosity was gradually declining (see Sect. 1) and the mass-loss rate from the giant was presumably constant, the opening angle of the H i region, and thus the Raman conversion efficiency, were increasing. Also, a higher efficiency derived from the 2003 FUSE spectrum could be caused by measuring this spectrum at the orbital phase , where a fraction of the original O vi photons can be attenuated by the neutral wind from the giant.
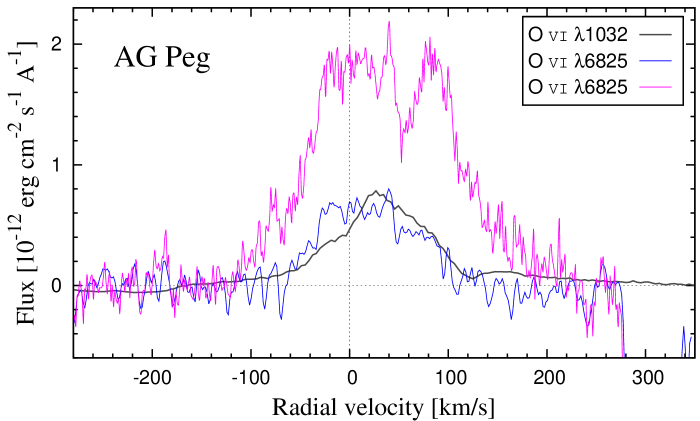
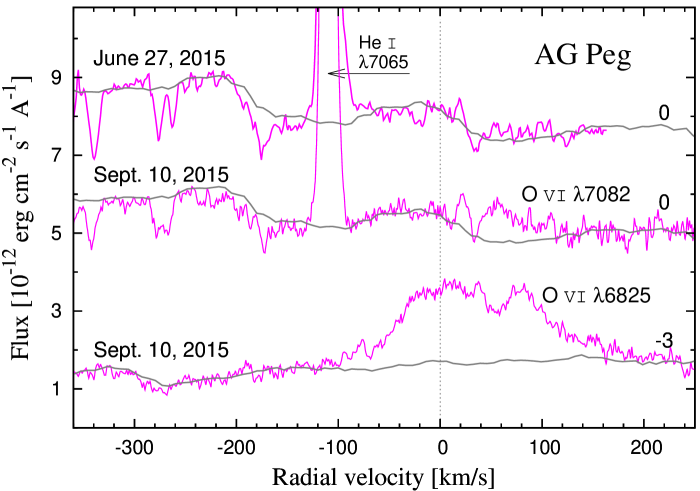
Figure 8 compares profiles of the original O vi 1032 Å line and its Raman scattered fraction. During quiescence, both profiles are nearly overlapped, except a blueward-shifted component in the Raman profile between -30 and 0 km s-1. According to Schmid et al. (1999) this emission can be produced by the densest H i atoms of the giant’s wind around the binary axis, that move against the O vi region. For a steep wind velocity profile of giants in symbiotic binaries, as suggested by Knill et al. (1993) and recently applied by Shagatova et al. (2016) (see their Fig. 5), the edge of this adjacent component at km s-1 can be close to the terminal velocity of the giant’s wind.
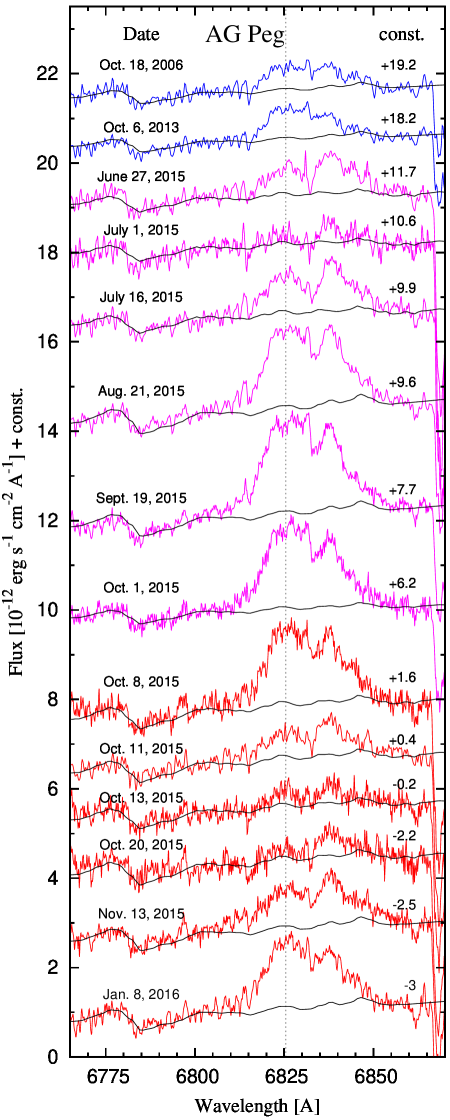
During the outburst, significant variations in the Raman 6825 Å line profile were measured. Figure 5 (bottom panel) shows evolution of its fluxes, whereas Figure 9 compares its profiles along the outburst. Throughout the whole outburst, a redward-shifted component around 6838 Å developed – analogous to Z And during its 2000–2003 and 2006–2007 active phases (see Fig 4 of Skopal et al. 2006) and Fig. 5 of Skopal et al. (2009b). Except for minimum fluxes (around July 1 and October 11) the of the Raman line enlarged to 40 Å, and its flux increased by a factor of 4–5 relative to that from the preceding quiescence. A minimum flux of the Raman line was observed just after the optical maxima (Fig. 5). Finally, a few faint absorption lines of the giant spectrum can be recognised within the Raman 6825 Å feature (e.g. at 6807.2, 6810.3, 6812.5, 6815.1, 6824.8, 6832.7, 6840.0, 6846.9 and 6850.3). However, their influence on major features of the Raman profile is negligible.
Concerning the Raman O vi 7082 Å line, its flux was a factor of smaller than that of the Raman 6825 Å line during their best visibility (mid August – end of September, 2015). Also, profiles of both Raman lines were not comparable. For example, the whole blue part of the 7082 Å profile was difficult to detect (see Fig. 10). This was probably because of its weakness, and partly because the stellar spectrum is very structured around this wavelength. For example, the central part of the profile is strongly affected by an absorption at Å. During the minimum fluxes of Raman line, the Raman emission was not recognisable in our spectra.
Observed variations and possible origin of the Raman 6825 Å emission during the outburst of AG Peg is discussed in Sect. 4.7.
4 Discussion
4.1 The hot component temperature
Following ionisation structure of hot components in symbiotic binaries during active phases, the high temperature of the WD’s pseudophotosphere results from a low orbital inclination of AG Peg. In this case the observer can directly see the hot component in contrast to systems with high orbital inclination, when its hard radiation is blocked by the optically thick disk-like pseudophotosphere, which develops during outbursts (Skopal 2005b). Our values of 150 – 230 kK are comparable to those indicated in other symbiotic systems with the observed supersoft X-ray and far-UV fluxes generated by the WD’s pseudophotosphere. For example, AG Dra (115–180 kK, Greiner et al. 1997; Skopal et al. 2009a), RR Tel (150–180 kK, González-Riestra et al. 2013), and LIN 358 (250 kK, Skopal 2015).
To estimate , Ramsay et al. (2016) used only equivalent widths of He ii 4686 Å and H lines, instead of their fluxes. Despite variation of the continuum level by an amplitude of mag in the passbands over the course of the outburst, the authors obtained values of between 1.8 and K, which are comparable with our quantities. Similar temperatures were also achieved by Tomov et al. (2016) using the same approach to their high-resolution spectra. This is the result of a close vicinity of both the lines in the spectrum ( Å) and the method that uses their ratio.
4.2 The hot component luminosity
The high luminosity of the hot component in AG Peg of a few times , with a maximum of , is a natural consequence of the high value of the EM, measured during the 2015 outburst. For example, EM = 5–9 cm-3 requires the rate of hydrogen-ionising photons, s-1 for cm3 s-1 (see Sect. 3.2.4). Such a high rate of photons requires a powerful source of radiation with between and . For the WD’s mass of (Kenyon et al. 1993), the maximum luminosity of the hot component could temporarily exceed its Eddington limit.
To determine during the 2015 outburst of AG Peg, Tomov et al. (2016) used, in principle, the same approach, but for emission lines. Their values of are a factor of 19–3 below our values. This difference is caused by a larger opacity of the nebula in lines than in the continuum. For example, on July 8, 2015, their corresponds to the emission measure
| (18) |
that is a factor of 18 smaller than our value of determined by modelling the SED. Thus, using the line fluxes gives significantly lower values of , because .
4.3 The hot component radius
During the outburst, the effective radius of the WD’s pseudophotosphere, , varied between and . On average, it was a factor of 2–3 larger than during quiescent phase. Maximum values were reached at/around maxima of the star’s brightness. According to the adopted optically thick wind in nova outbursts (see Sect. 3.2.6), the optically thick/thin interface of the wind represents the WD’s pseudophotosphere. As a consequence, the variations of its radius are caused by the variations in the mass-loss rate, . A correlation between and from the H flux (Fig. 7) supports the plausibility of the wind model.
4.4 The type of the 2015 outburst
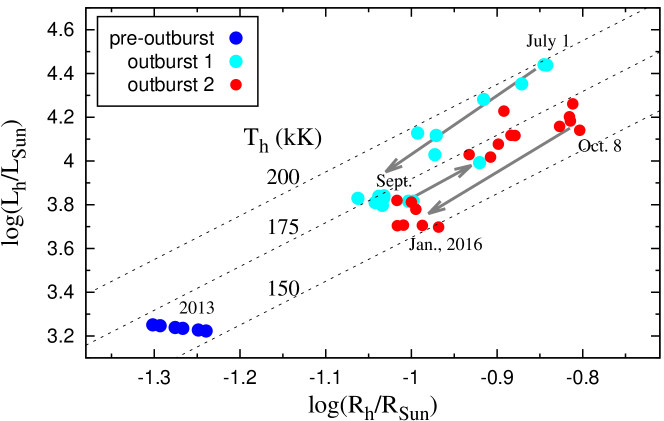
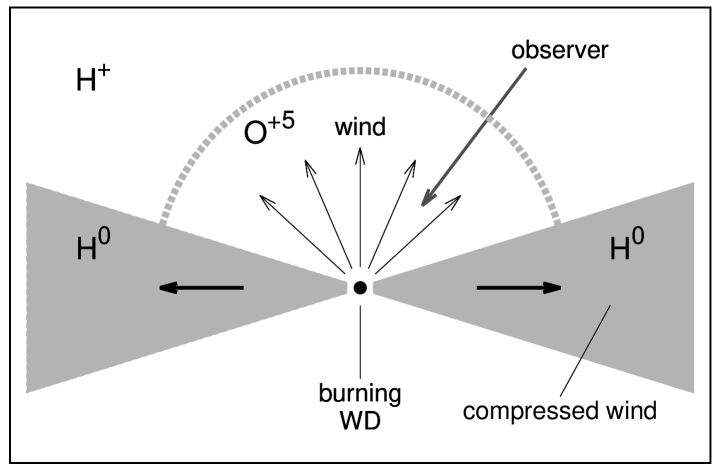
Evolution of parameters , and in the H-R diagram is depicted in Fig. 11. Optical maxima around July 1, 2015 and October 8, 2015 in the LC correspond to maxima in and . During both flares, of the WD’s photosphere was very high; in the first one, significantly higher than during quiescence. Throughout the whole outburst, the optical brightening was governed exclusively by the nebular component of radiation. This represents a rare case of outbursts produced by symbiotic binaries. Skopal (2005b) classified them as 2nd-type, and described them as being explained by a low orbital inclination of the binary, when the observer can directly see the hot WD (Fig. 12), and thus measures its very high , and EM. No warm pseudophotosphere in the optical was indicated by modelling the SED (Fig. 4) – the characteristic feature of the 1st-type of outbursts produced by systems with a high (see Fig. 26 of Skopal 2005b).
4.5 The extension of the He+2 zone
From the middle of August to the end of September, and from November 25 to the end of the observing season of AG Peg (January 2016), a gradual noticeable increase of was observed at a slow gradual decline of (Figs. 7 and 11). The flux and the terminal velocity of the He ii 4686 Å line was decreasing, whereas for the H line these parameters did not change noticeably during these periods (Fig. 5). This implies a shrinking of the He+2 zone, because the wind was always characterised with the same , as indicated by a stable H and H line profile, and with the same (Fig. 7). During December 2015, the broad wings in the He ii profile practically disappeared (Fig. 5).
Leedjärv et al. (2004) found a linear relation between equivalent widths of the He ii 4686 Å and the Raman scattered O vi 6825 Å lines for measurements from quiescent phases and small brightenings. According to this result, the shrinkage of the He+2 zone suggests a shrinkage of the O+5 zone around the hot component in AG Peg during the above mentioned periods. Surprisingly, the flux of the O vi Raman line was a factor of 4.5–3.5 higher than during preceding quiescence (Fig. 5). This suggests a markedly higher Raman conversion efficiency in comparison with the quiescent phase. This is possible only if the H i scattering zone covers a larger fraction of the O+5 sky than in quiescence (see Sect. 4.7.3).
4.6 On the mass-loss rate
Section 3.2.6 presents a method for determining the using the observed EM and H luminosity. The method assumes that the measured emission is produced by the optically thin part of the ionised wind from the hot component during the outburst. Dispersion in the values obtained by the H method is lower than that derived from the EM (see Fig. 7). This is probably a result of a larger opacity of the wind in the H line than in the continuum. For example, at the maximum of EM the H flux was still increasing. From this point of view, the adopted value of the beginning of the optically thin wind in H, , is probably too rough (Sect. 3.2.6).
The upper and lower limits of the correspond to maximum uncertainty of the wind outset – at the WD’s pseudophotosphere or at the WD’s core surface. Their average is as high as a few , which agrees with values obtained independently by fitting the broad H wings that develop during Z And-type outbursts of other systems (Skopal 2006)444This method is applicable only for systems with a high orbital inclination.. The wind is variable, because the observed nebular emission varies during the course of the outburst.
4.7 The Raman-scattered O vi 6825 Å line
From the properties of the Raman-scattering process and its induced feature observed around 6825 Å (Figs. 8 and 9; Sect. 3.2.7) we can infer some characteristics of both the neutral H i and the ionised O vi zone during the outburst.
4.7.1 Minima of the Raman line fluxes
Fluxes of the Raman 6825 Å line, , are in anticorrelation with the EM and thus , because (Eq. (16), Figs. 5 and 7). Observing the minimum of fluxes at a very high temperature rejects its usual interpretation by a cooling of the ionising source. Observations suggest that the transient weakening of the O vi lines is a result of a significant increase of the (Fig. 7), which makes the O+5 zone optically thick, and thus more compact. For example, the optical depth of the electron-scattering layer, . Following decrease of then produces a more transparent O+5 zone and thus leads to an increase of both the and fluxes at similar conditions – a high and the geometry of H i scatterers.
A connection between the radius of the O vi zone, , its , average particle density, , and the EM was indicated for the symbiotic star AG Dra by Skopal et al. (2009a). Having independently determined , the authors inferred (, cm-3, and EM = cm-3) during quiescent phase, and (, cm-3, and EM = cm-3) during the transition from a burst, at high K. However, the theoretical modelling is needed for a better understanding of the connection between , , and EM in the variable wind from active hot components in symbiotic binaries.
4.7.2 Broadening of the Raman line
Energy conservation of the Raman Å conversion implies the broadening of the scattered line with a factor of (Nussbaumer et al. 1989). It is given by the broadening of the original O vi line, which reflects the kinematic of emitting material in the vicinity of the hot WD, and by the relative motions between the source of the original O vi photons and the scattering H i atoms. Firstly, the observed increase of the Raman 6825 Å line width during the outburst was in part caused by a broadening of the direct O vi 1032 Å line as suggested by the broadening of He ii and H i lines in the optical. Secondly, a significant change of the ionisation structure of hot components in symbiotic binaries during outbursts will produce a change in the geometry and motion of H i atoms in the binary, and thus also in the profile of the Raman-scattered lines (see below).
4.7.3 The high flux and profile of the Raman line
The significant increase of the flux, width, and development of the redward-shifted component in the profile of the Raman-scattered O vi line can be qualitatively explained by the presence of a neutral disk-like zone at the equatorial plane, which develops during active phases of symbiotic binaries around the hot WD (see Skopal 2005b; Cariková & Skopal 2012). The following points are relevant.
-
1.
The cross-section of the Raman conversion, cm2 (Lee & Lee 1997) requires the H i column density cm-2 along the incident O vi photons to produce an observable effect (i.e. the optical depth . The throughout the disk-like neutral zone is of a few times (see Fig 4 of Cariková & Skopal 2012), which is consistent with that needed for the O vi 1032 Raman scattering. Thus, the O vi Raman conversion can take place mainly in the densest inner parts of the H i zone.
-
2.
Efficiency of the Raman scattering depends on the geometry of the scattering atoms in the binary. It is proportional to the so-called covering factor , where is a solid angle, under which the initial O+5 line photons, located mostly in the vicinity of the WD, can see the scattering region (see Lee et al. 2003). During the quiescent phase, the H i region has a cone-like shape around the giant (STB). Parameters of AG Peg suggest its opening angle of (i.e. the angle between the binary axis and the asymptote to the ionisation boundary), which corresponds to . In fact, the is smaller, because the scattering region represents only part of the total H i region, which is optically thick for Raman scattering (see Sekeráš & Skopal 2015). During outbursts, location of the O+5 zone above/below the neutral disk suggests that the covering factor can be as high as (see Fig. 12). This makes the Raman scattering more efficient during the outburst, thus producing a strong Raman line. This interpretation is consistent with the conclusion of Sect. 4.5 that the covering factor was larger than during quiescence.
-
3.
Observations of systems with a high orbital inclination often indicate P-Cyg profiles of hydrogen Balmer lines with the absorption component at during outbursts. The neutral disk-like zone thus expands from the central ionising source at/around the orbital plane (see Sect. 4.1 of Skopal et al. 2006, in detail). The centrally symmetric and expanding O+5 wind nebular zone located above/below the neutral disk can cause a significant broadening of the Raman line during the outburst. The expanding disk-like zone of scatterers is likely to be responsible for the pronounced redward-shifted component at 6838 Å (see Fig. 12). However, a quantitative modelling of the Raman profile during outbursts is required to approve or disapprove this theory.
The above sketched interpretation is independently supported by the presence of the Raman-scattered O vi lines in the spectrum of massive luminous B[e] star LHA 115-S 18 discovered by Torres et al. (2012). Because the B[e] supergiants may harbour dense circumstellar disks of neutral hydrogen and dust, the authors suggested that the Raman emission in the spectrum of LHA 115-S 18 could arise from such a disk illuminated by the radiation from the central hot star. Similarity of the Raman 6825 Å profile in AG Peg and in LHA 115-S 18 is striking (see Fig. 2 of Torres et al. 2012, and Fig. 9 here).
4.8 Shift and broadening of the He ii emission core
During the outburst, we measured a blueward shift of the He ii 4686 Å emission core with respect to its reference wavelength (Fig. 5). The effect was indicated at the beginning of the outburst, but mainly between August 23 and November 13, 2015, when the bisectors measured at 0.1, 0.5 and 0.9 had similar RV (Fig. 5, third panel from the bottom). This reflected shifting of the whole line core. This effect was already indicated during outbursts of Z And (Skopal et al. 2006, 2009b), and interpreted as a result of a disk-structured hot object that blocks a fraction of the redward-shifted emission from a relatively small He+2 zone in the direction of the observer. As a result, the blueward shifted emission dominates the profile. The shift depends on the size of both the disk and the He+2 zone.
A significant shrinking of the He ii zone from November 25, 2015 to January, 2016 (Sect. 4.5) with simultaneous shifting of the line core towards the reference wavelength (Fig. 5) can be interpreted as a result of a gradual dilution of the optically thick disk-like zone around the WD, signalling thus the end of the active phase.
4.9 The nature of the outburst
The high luminosity of the hot component during the quiescent phase of (Table 4) requires accretion at a rate of a few times to generate this luminosity by the stable hydrogen burning on the surface of a WD (e.g. Shen & Bildsten 2007; Nomoto et al. 2007). The presence of the shell burning prior to the outburst was also suggested by Ramsay et al. (2016). However, the high accretion rate requires a high mass transfer ratio (i.e. the mass accretion rate divided by the mass-loss rate from the donor). A very efficient wind mass transfer was suggested, for example, by Mohamed & Podsiadlowski (2012), for symbiotic stars with slow and dense winds. Skopal & Cariková (2015) suggested that the high wind-mass-transfer efficiency in symbiotic stars can be caused by compression of the wind from their slowly rotating giants. Direct indication of wind focusing was found by Shagatova et al. (2016) for the symbiotic binary SY Mus.
To increase the luminosity of the burning WD by a factor of 10, to values observed around the maximum of the 2015 outburst, a transient increase of the accretion rate to is needed to generate the luminosity due to hydrogen burning,
| (19) |
where erg g-1 is the energy production of 1 gram of hydrogen due to the nuclear fusion of four protons, and is the hydrogen mass fraction in the accreted matter. The required exceeds the stable-burning limit, which leads to blowing optically thick wind from the WD (Hachisu et al. 1996). The enhanced wind is ionised by the hot WD’s pseudophotosphere, and thus converts a fraction of its stellar radiation to the nebular emission. The corresponding increase of the EM (Fig. 4) then causes a relevant brightening in the LC, which we indicate as the outburst (Fig. 2).
However, the principal question remains as to the origin of this material. Probably, the red giant is responsible for a transient increase of the mass transfer ratio, which temporarily enhances . In general, Bisikalo et al. (2006) found that variations in the velocity of the wind from the giant can cause a disruption of the accretion disk, leading to the infall of a considerable amount of matter ( ) onto the WD surface, thus inducing the outburst. For Z And, Sokoloski et al. (2006) suggested that its 2000-02 outburst was triggered by the influx of hydrogen-rich material from a dwarf-nova-like disk instability at its start that consequently enhanced nuclear shell burning on the WD.
5 Summary
We analysed primarily high cadence optical spectroscopy and multicolour photometry obtained prior to and during the first Z And-type outburst of the symbiotic nova AG Peg that began in June of 2015. We determined the fundamental parameters , and of the WD’s pseudophotosphere and its mass-loss rate, , in the course of the outburst (Fig. 7). Monitoring the evolution of the He ii 4686 Å, H and the Raman-scattered 6825 Å line profiles allowed us to suggest the ionisation structure of the active hot component in AG Peg (Fig. 12) and to outline the nature of its outburst. The main results of our analysis may be summarised as follows.
-
1.
The nova-like outburst of AG Peg terminated around 1997 when a wave-like orbitally-related variation in the LC reached its maximum amplitude and no overall change of the star’s brightness was indicated until the 2015 eruption (Fig. 1). AG Peg thus entered a quiescent phase, when the WD could start to accrete from the giant’s wind (Fig. 3, Sects. 3.1 and 3.2.2).
- 2.
- 3.
- 4.
- 5.
- 6.
- 7.
- 8.
- 9.
-
10.
Significant broadening and high fluxes of the Raman-scattered O vi 6825 Å line (Figs. 5, 8 and 9, Sect. 4.7.3) and probably also the blueward shift of the He ii emission core (Sect. 4.8) indicated indirectly the presence of the neutral disk-like formation encompassing the WD. This finding is consistent with the ionisation structure of hot components in symbiotic stars during active phases.
To ignite the 2015 outburst of AG Peg, a transient increase in the accretion rate to was required to generate the high luminosity ( for a 0.6 WD) at the initial maximum (Sect. 4.9). Such an accretion rate exceeds a critical value for the stable hydrogen burning. Under these conditions, optically thick wind will blow from the WD. At the high temperature of the ionising source, the wind converts a fraction of the WD’s photospheric radiation into a strong nebular emission that dominates the optical (Fig. 4). As a result, we observe a 2 mag brightening in the LC, which is classified as the Z And-type of the outburst (Sect. 4.9).
However, the above sketch of the Z And-type outburst needs to be elaborated in more detail to understand its role in the evolution of accreting WDs in symbiotic stars towards their supposed final stage of SNe Ia type. In this respect, accurate quantities of the total energy output and the mass-loss rate during both quiescent phases and outbursts are required to find if the mass of the WD can reach the Chandrasekhar limiting mass.
Acknowledgements.
We thank the anonymous referee for constructive comments. Daniela Korčáková, Jan Čechura, Jakub Juryšek, Radek Kříček and Petr Zasche are thanked for their assistance in acquisition of some spectra at the Ondřejov observatory. Michaela Kraus is thanked for a discussion on the Raman lines in the spectrum of the B[e] star LHA 115-S 18. HST spectra presented in this paper were obtained from the Mikulski Archive for Space Telescopes (MAST). MAST is located at the Space Telescope Science Institute (STScI). STScI is operated by the Association of Universities for Research in Astronomy, Inc., under NASA contract NAS5-26555. The optical spectra presented in this paper were in part obtained within the Astronomical Ring for Access to Spectroscopy (ARAS), an initiative promoting cooperation between professional and amateur astronomers in the field of spectroscopy, coordinated by Francois Teyssier. We also acknowledge the variable-star observations from the AAVSO International Database contributed by observers worldwide and used in this research. This work was supported by the Czech Science Foundation, grants P209/10/0715 and GA15-02112S, by the RFBR grant No. 15-02-06178 and NSh-9670.2016.2, by the Slovak Research and Development Agency under the contract No. APVV-15-0458, by the Slovak Academy of Sciences grant VEGA No. 2/0008/17 and by the realisation of the project ITMS No. 26220120029, based on the supporting operational Research and development program financed from the European Regional Development Fund.References
- Allen (1980) Allen, D. A. 1980, MNRAS, 192, 521
- Altamore & Cassatella (1997) Altamore, A., & Cassatella, A. 1997, A&A, 317, 712
- Ambartsumyan (1932) Ambartsumyan, V. A. 1932, Pulkovo Obs. Circ., 4, 8
- van Belle et al. (1999) van Belle, Lane, B. F., Thomson, R. R., Boden, A. F., et al. 1999, AJ, 117, 521
- Belyakina (1992) Belyakina, T. S. 1992, Izv. Krym. Astrofiz. Obs., 84, 49
- Bessel (1979) Bessel, M. S. 1979, PASP, 91, 589
- Bisikalo et al. (2006) Bisikalo, D. V., Boyarchuck, A. A., Kilpio, E. Yu., Tomov, N. A., Tomova, M. T. 2006, Astronomy Reports, 80, 722
- Boffin et al. (2014) Boffin, H. M. J., Hillen, M., Berger, J. P. et al. 2014, A&A, 564, A1
- Boyarchuk (1967) Boyarchuk, A. A. 1967, SvA, 11, 8
- Brown & Matthews (1970) Brown, R. L., & Matthews, W. G. 1970, ApJ, 160, 939
- Cardelli et al. (1989) Cardelli, J. A., Clayton, G. C., & Mathis, J. S. 1989, ApJ, 345, 245
- Cariková & Skopal (2010) Cariková, Z., & Skopal, A. 2010, NewA, 15, 637
- Cariková & Skopal (2012) Cariková, Z., & Skopal, A. 2012, A&A, 548, A21
- Contini (1997) Contini, M. 1997, ApJ, 483, 898
- Contini (2003) Contini, M. 2003, MNRAS, 339, 125
- Dumm et al. (1999) Dumm, T., Schmutz, W., Schild, H., & Nussbaumer, H. 1999, A&A, 349, 169
- Eriksson et al. (2004) Eriksson, M., Johansson, S., & Wahlgren, G. M. 2004, A&A, 422, 987
- Fekel et al. (2000) Fekel, F. C., Joyce, R. R., Hinkle, K. H., & Skrutskie, M. F. 2000, AJ, 119, 1375
- Fernández-Castro et al. (1988) Fernández-Castro, T., Cassatella, A., Giménez, A., & Viotti, R. 1988, ApJ, 324, 1016
- Fluks et al. (1994) Fluks, M. A., Plez, B., The, P. S., de Winter, D., Westerlund, B. E., & Steenman, H. C. 1994, A&AS, 105, 311
- González-Riestra et al. (2013) González-Riestra, R., Selvelli, P., & Cassatella, A. 2013, A&A, 556, A85
- Gregory & Kwok (1977) Gregory, P. C., & Kwok, S. 1977, ApJ, 211, 429.
- Greiner et al. (1997) Greiner, J. Bickert, K., Luthardt, R., Viotti, R., Altamore, A. Gonzalez-Riestra, R., Stencel, R. E. 1997, A&A, 322, 576
- Gurzadyan (1997) Gurzadyan G. A., 1997, The Physics and Dynamics of Planetary Nebulae. Springer-Verlag, Berlin
- Hachisu & Kato (2001) Hachisu, I., & Kato, M. 2001, ApJ, 558, 323
- Hachisu et al. (1996) Hachisu, I., Kato, M., & Nomoto, K. 1996, ApJ, 470, L97
- Henden & Kaitchuck (1982) Henden, A. A., & Kaitchuck, R. H. 1982, Astronomical Photometry, (New York: Van Nostrand Reinhold Company), 50
- Henden & Munari (2006) Henden, A. A., & Munari, U. 2006, A&A, 458, 339
- Hummer & Seaton (1964) Hummer, D. G., & Seaton, M. J. 1964, MNRAS, 127, 217
- Hummer & Storey (1987) Hummer, D. G. & Storey, P. J. 1987, MNRAS, 224, 801
- Hoffleit (1968) Hoffleit, D. 1968, Irish Astr. J., 8, 149
- Hric et al. (1996) Hric, L., Skopal, A., Urban, Z., et al. 1996, CoSka, 26, 121
- Iijima (1981) Iijima, T. 1981, in: Photometric and Spectroscopic Binary Systems, Proceedings of the NATO Advanced Study Institute, E. B. Carling and Z. Kopal eds. Dordrecht: D. Reidel Publishing Co., p. 517
- Kaler & Jacoby (1989) Kaler, J. B., & Jacoby, G. H. 1989, ApJ, 345, 871
- Kato & Hachisu (1994) Kato, M., & Hachisu, I. 1994, ApJ, 437, 802
- Kenny et al. (1991) Kenny, H. T., Taylor, A. R., & Seaquist, E. R. 1991, ApJ, 366, 549
- Kenny & Taylor (2007) Kenny, H. T., & Taylor, A. R. 2007, ApJ, 662, 1231
- Kenyon & Fernández-Castro (1987) Kenyon, S. J., & Fernández-Castro, T. 1987, AJ, 93, 938
- Kenyon et al. (1993) Kenyon, S. J., Mikolajewska, J., Mikolajewski, M., Polidan, R. S., & Slovak, M. H. 1993, AJ, 106, 1573
- Kenyon et al. (2001) Kenyon, S. J., Proga, D., & Keyes, Ch. D. 2001, AJ, 122, 349
- Keyes & Preblich (2004) Keyes, Ch. D., & Preblich, B. 2004, AJ, 128, 2981
- Knill et al. (1993) Knill, O., Dgani, R., & Vogel, M. 1993, A&A, 274, 1002
- Lamers & Cassinelli (1999) Lamers, H. J. G. L. M., Cassinelli, J. P. 1999, Introduction to stellar winds, Cambridge University Press
- Lee & Lee (1997) Lee, H.-W., & Lee, K. W. 1997, MNRAS, 287, 211
- Lee et al. (2003) Lee, H.-W., Sohn, Y.-J., Kang, Y. W., & Kim, H.-I. 2003, ApJ, 598, 553
- Leedjärv et al. (2004) Leedjärv, L., Burmeister, M., Mikołajewski, M., Puss, A., Annuk, K., Gałan, C., 2004, A&A, 415, 273
- Leitherer (1988) Leitherer, C. 1988, ApJ, 326, 356
- Livio et al. (1989) Livio, M., Prialnik, D., & Regev, O. 1989, ApJ, 341, 299
- Luna et al. (2015) Luna, G. J. M., Nunez, N. E., Sokoloski, J. L., & Montane, B. 2015, ATel. No. 7741
- Lundmark (1921) Lundmark, K. 1921 AN, 213,93
- Meinunger (1979) Meinunger, L. 1979, IBVS No. 1611
- Mikolajewska (2011) Mikolajewska, J. 2011, arXiv:1011.5657v2
- Mohamed & Podsiadlowski (2012) Mohamed, S., & Podsiadlowski, Ph. 2012, Baltic Astronomy 21, 88
- Mukai et al. (2016) Mukai, K., Luna, G. J. M. Cusumano, G., et al. 2016, MNRAS, 461, L1
- Munari (1997) Munari, U. 1997, in Physical Processes in Symbiotic Binaries, ed. J. Mikolajewska (Warsaw: Copernicus Foundation for Polish Astronomy), 37
- Mürset et al. (1991) Mürset, U., Nussbaumer, H., Schmid, H. M., & Vogel, M. 1991, A&A, 248, 458
- Mürset & Nussbaumer (1994) Mürset, U. & Nussbaumer, H. 1994, A&A, 282, 586
- Mürset et al. (1995) Mürset, U., Jordan, S., & Walder, R. 1995, A&A, 297, L87
- Mürset & Schmid (1999) Mürset, U., & Schmid, H. M. 1999, A&AS, 137, 473
- Nomoto et al. (2007) Nomoto, K., Saio, H., Kato, M., & Hachisu, I. 2007, ApJ, 663, 1269
- Nuñez & Luna (2013) Nuñez, N. E., & Luna, G. J. M. 2013, ATel No. 5323
- Nussbaumer & Vogel (1987) Nussbaumer, H., & Vogel, M. 1987, A&A, 182, 51
- Nussbaumer et al. (1989) Nussbaumer, H., Schmid, H. M., Vogel, M. 1989, A&A, 211, L27
- Paczyński & Żytkow (1978) Pacźynski, B., & Żytkow, A. N. 1978, ApJ, 222, 604
- Paczyński & Rudak (1980) Paczyński, B., & Rudak, R. 1980, A&A, 82, 349
- Parimucha & Vaňko (2005) Parimucha, Š., & Vaňko, M., 2005, CoSka, 35, 35
- Pereira & Landaberry (1996) Pereira, C. B., & Landaberry, S. J. C. 1996, AJ, 111, 1329
- Pribulla et al. (2015) Pribulla, T., Garai, Z., Hambálek, Ľ, Kollár, V., et al. 2015, AN, 336, 682
- Pucinskas (1970) Pucinskas, A. 1970, Bull. Vilniaus Univ. Astr. Obs., 27, 24
- Ramsay et al. (2015) Ramsay, G., , Luna, G. J. M., Nuñez, N. E., Sokoloski, J. L. 2015, ATel No. 7779
- Ramsay et al. (2016) Ramsay, G., Sokoloski, J. L., Luna, G. J. M., Nuñez, N. E. 2016, MNRAS, 461, 3599
- Rauch (2003) Rauch, T. 2003, A&A, 403, 709
- Schmid (1989) Schmid, H. M. 1989, A&A, 211, L31
- Schmid et al. (1999) Schmid, H. M., Krautter, J., Appenzeller, I., et al. 1999, A&A, 348, 950
- Seaquist et al. (1984) Seaquist, E. R., Taylor, A. R., & Button, S. 1984, ApJ, 284, 202 (STB)
- Sekeráš & Skopal (2015) Sekeráš, M., & Skopal, A. 2015, ApJ, 812, A162
- Shagatova et al. (2016) Shagatova, N., & Skopal, A., & Cariková, Z. 2016, A&A, 588, A83
- Shen & Bildsten (2007) Shen, K. J., & Bildsten, L. 2007, ApJ, 660, 1444
- Skopal (2001) Skopal, A. 2001, A&A, 366, 157
- Skopal (2005a) Skopal, A. 2005a, in: The Astrophysics of Cataclysmic Variables and Related Objects, J.-M. Hameury, & J.-P. Lasota, eds., ASP Conf. Ser. 330, San Francisco: ASP, p. 463
- Skopal (2005b) Skopal, A. 2005b, A&A, 440, 995
- Skopal (2006) Skopal, A. 2006, A&A, 457, 1003
- Skopal (2007) Skopal, A. 2007, New Astron., 12, 597
- Skopal (2008) Skopal, A. 2008, JAAVSO, 36, 9
- Skopal (2015) Skopal, A. 2015, New Astron., 36, 116
- Skopal & Shagatova (2012) Skopal, A., & Shagatova, N. 2012, A&A, 547, A45
- Skopal et al. (2004) Skopal, A., Pribulla, T., Vaňko, M., et al. 2004, CoSka, 34, 45
- Skopal et al. (2006) Skopal, A., Vittone, A. A., Errico, L. et al. 2006, A&A, 453, 279
- Skopal et al. (2007) Skopal, A., Vaňko, M., Pribulla, T., et al. 2007, AN, 328, 909
- Skopal et al. (2009a) Skopal, A., Sekeráš, M., González-Riestra, R., & Viotti, R. F. 2009a, A&A, 507, 1531
- Skopal et al. (2009b) Skopal, A., Pribulla, T., Budaj, J., et al. 2009b, ApJ, 690, 1222
- Skopal et al. (2011) Skopal, A., Tarasova, T. N., Cariková, Z., et al. 2011, A&A, 536, A27
- Skopal et al. (2012) Skopal, A., Shugarov, S., Vaňko, M., et al. 2012, AN, 333, 242
- Skopal & Cariková (2015) Skopal, A., & Cariková, Z. 2015, A&A, 573, A8
- Sokoloski et al. (2006) Sokoloski, J. L., Kenyon, S. J., Espey, B. R., et al. 2006, ApJ, 636, 1002
- Steele et al. (2015) Steele, I. A., Jermak, H. E., Marchant, J. M., & Bates, S. D. 2015, ATel No. 7749
- Tomov (1993) Tomov, N. A. 1993, Izv. Krym. Astrofiz. Obs., 88, 22
- Tomov & Tomova (1998) Tomov, N. A., & Tomova, M. T. 1998, IBVS No. 4574
- Tomov & Tomova (2001) Tomov, N. A., & Tomova, M. T. 2001, Ap&SS, 278, 311
- Tomov et al. (2016) Tomov, T. V., Stoyanov, K. A., & Zamanov, R. K. 2016, MNRAS, 462, 4435
- Torres et al. (2012) Torres, A. F., Kraus, M., Cidale, L. S., Barbá, R., Borges Fernandes, M., & Brandi, E. 2012, MNRAS, 427, L80
- Tutukov & Yungel’son (1976) Tutukov, A. V., & Yungel’son, L. R. 1976, Astrofizika, 12, 521
- Vaňko et al. (2015a) Vaňko, M., Komžík, R., Kollár, V., & Sekeráš, M. 2015, CoSka, 44, 77
- Vaňko et al. (2015b) Vaňko, M., Komžík, R., Kollár, V., & Sekeráš, M. 2015, CoSka, 44, 91
- Vogel (1991) Vogel, M. 1991, A&A, 249, 173
- Yaron et al. (2005) Yaron, O., Prialnik, D., Shara, M.M., Kovetz, A. 2005, ApJ, 623, 398
- Zamanov & Tomov (1995) Zamanov, R., & Tomov, N. A. 1995, The Observatory, 115, 185
- Zhekov & Tomov (2016) Zhekov, S. A., & Tomov, T. 2016, MNRAS, 461, 286
Appendix A The distance to AG Peg
Comparing a synthetic spectrum to the flux points of the giant in AG Peg, Skopal (2005b) determined its effective temperature K and angular radius , which corresponds to the flux (see Eq. (4)). Independently, Boffin et al. (2014) measured the interferometric diameter of the giant in AG Peg to mas, which yields the same and K for the given and magnitudes. Using these parameters, elements of the spectroscopic orbit and considering a radius-luminosity relation, Boffin et al. (2014) derived the parameters of the system for the orbital inclination = 90, 50 and 30∘ (see their Table 3). For the rotational velocity of km s-1, mass of the WD of and the assumption of synchronism they preferred solutions for , which correspond to the distance pc.
However, , because there is no Rayleigh scattering attenuation of the continuum around Ly- at (see e.g. IUE spectra SWP03830, SWP52386 and/or the HST spectrum here, taken at ), which is always measured for eclipsing symbiotic stars during quiescent phases (see Vogel 1991; Dumm et al. 1999; Pereira & Landaberry 1996, for EG And, SY Mus, RW Hya and BF Cyg). A constraint for can be obtained from a similarity of the ionisation structure of symbiotic stars during quiescent phases (see Fig. 11 of Kenyon et al. (1993) for AG Peg and Fig. 7 of Fernández-Castro et al. (1988) for Z And). For Z And, Skopal & Shagatova (2012) measured a weak attenuation of the far-UV continuum by Rayleigh scattering at , which restricts its to 59. This suggests that of AG Peg can be even lower than this value, because no Rayleigh attenuation is indicated. Therefore, Boffin et al. solutions for that correspond to pc and are more appropriate than those for . In addition, fundamental parameters of the giant in AG Peg satisfy statistical relations between radii, effective temperatures and spectral types for M giants better than those given by solutions for (e.g. van Belle et al. 1999). Accordingly, for the purpose of this paper, we adopted the distance to AG Peg pc as originally estimated by Kenyon et al. (1993).
Appendix B Comparison of black body and atmosphere models for the hot component
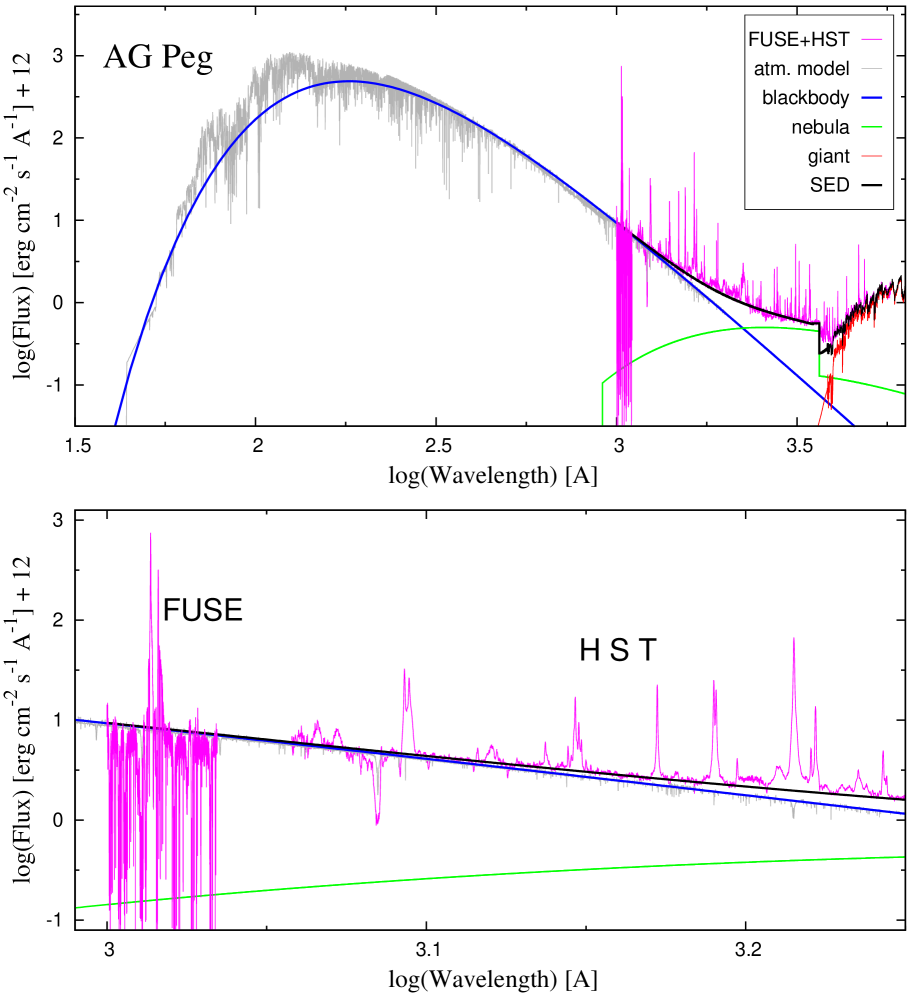
Skopal (2015) elaborated multiwavelength modelling of the global X-ray/IR SED of supersoft X-ray sources. He found that physical parameters of the overall SED do not basically depend on the model used. A black body or an atmosphere model yields a similar luminosity for given temperature (see Sect. 4.4 there).
Top panel of Fig. 13 shows a comparison of the black body and atmosphere models for K scaled to the far-UV fluxes of the HST spectrum from December 12, 1996 (see Fig. 3). We used a publicly available NLTE atmosphere model described by Rauch (2003) with the H-Ni solar abundances and = 6 (solid grey line). Similar profiles of the global SED for both models suggests also a similar quantity of the fluxes of ionising photons. Our illustration in Fig. 13 corresponds to and s-1. This justifies our assumption that the hot component radiates as a black body, which we used in Sects. 3.2.4 and 3.2.5 to estimate fundamental parameters of the hot WD in AG Peg.
Bottom panel of Fig. 13 shows the FUSE LiF1A channel spectrum (1000–1082 Å) from June 5, 2003, dereddened by using the far-UV extrapolation of the Cardelli et al. (1989) extinction curve. Its continuum fits well the model SED at the far-UV as given by the HST spectrum from December 12, 1996. We note that both spectra were obtained at similar orbital phases. This demonstrates the reliability of the extrapolation of the extinction curve to Å for small values of . However, fluxes dereddened with are a factor of 1.5–2 above the predicted model in the wavelength range of 1000–1100 Å (see Sect. 2.2. of Skopal et al. 2006, for Z And).
Appendix C Analytical form of the EM for the spherically symmetric -law wind
Emission measure of the completely ionised hydrogen in the volume is defined as,
| (20) |
For the spherically symmetric ionised wind, whose particle density, , satisfies the mass continuity equation,
| (21) |
and the particle velocity, , obeys the -law wind (14), the EM can be expressed as
| (22) |
is the radial distance from the WD centre, the stellar wind begins at , and are the inner and outer radius of the ionized volume, respectively, and
| (23) |
Using substitutions and then , allow us to rewrite Eq. (22) in the analytic form,
| (24) |
For , Eq. (24) gives Eq. (16) that we used to determine from the observed EM. For ,
| (25) |
Appendix D Table of the used line fluxes
| Date | Julian date | ||||||
| yyyy/mm/dd.ddd | JD – 2 440000 | ||||||
| Quiescent phase | |||||||
| 2006/10/18.926 | 54027.426 | – | – | – | 47.1 | 52.5 | 1.09 |
| 2013/08/11.900 | 56516.400 | 5.24 | 11.9 | 13.5 | 54.4 | 66.4 | 1.21 |
| 2013/08/29.945 | 56534.445 | - | – | – | 60.8 | 68.6 | 1.34 |
| 2013/09/04.843 | 56540.343 | - | – | – | 65.8 | 75.1 | 1.33 |
| 2013/09/04.855 | 56540.355 | 5.14 | 11.9 | 13.7 | – | – | – |
| 2013/09/27.978 | 56563.478 | 5.65 | 11.9 | 13.5 | – | – | – |
| 2013/10/07.004 | 56572.504 | - | – | – | 61.1 | 68.8 | 1.27 |
| 2013/10/24.874 | 56590.374 | 6.22 | 12.6 | 14.2 | – | – | – |
| 2013/10/26.793 | 56592.293 | 6.12 | 11.5 | 13.0 | – | – | – |
| 2013/12/17.716 | 56644.216 | 7.20 | 12.7 | 14.8 | – | – | – |
| Active phase | |||||||
| 2015/06/27.227 | 57200.727 | – | – | – | 140 | 150 | 1.76 |
| 2015/07/01.011 | 57204.511 | 32.2 | 37.1 | 43.9 | 128 | 152 | 0.33 |
| 2015/07/09.999 | 57213.499 | 40.9 | 51.9 | 58.8 | sat | sat | 1.19 |
| 2015/07/17.004 | 57220.504 | 48.8 | 58.4 | 68.0 | sat | sat | 2.53 |
| 2015/07/29.942 | 57233.442 | 35.9 | 45.5 | 50.9 | 195 | 217 | 3.71 |
| 2015/08/04.971 | 57239.471 | 41.1 | 60.0 | 70.5 | sat | sat | 3.91 |
| 2015/08/11.006 | 57245.506 | – | – | – | sat | sat | 4.45 |
| 2015/08/13.896 | 57248.396 | – | – | – | 190 | 216 | 4.37 |
| 2015/08/21.896 | 57256.396 | 27.1 | 43.4 | 52.0 | 192 | 219 | 4.39 |
| 2015/08/21.953 | 57256.453 | – | – | – | 201 | 224 | 4.46 |
| 2015/08/23.002 | 57257.502 | 32.3 | 50.2 | 60.7 | 182 | 197 | 5.04 |
| 2015/08/23.983 | 57258.483 | 31.1 | 48.8 | 59.5 | 189 | 210 | 5.20 |
| 2015/08/25.039 | 57259.539 | 28.6 | 46.1 | 55.5 | 176 | 197 | 5.21 |
| 2015/08/28.927 | 57263.427 | 27.5 | 39.1 | 48.4 | 186 | 208 | 5.26 |
| 2015/09/06.883 | 57272.383 | 25.5 | 41.1 | 51.7 | 186 | 207 | 5.04 |
| 2015/09/10.852 | 57276.352 | 25.0 | 37.9 | 48.8 | 173 | 205 | 4.81 |
| 2015/09/19.875 | 57285.375 | 23.8 | 40.2 | 51.9 | 207 | 249 | 4.78 |
| 2015/09/25.837 | 57291.337 | 23.0 | 41.0 | 50.6 | 204 | 237 | 4.57 |
| 2015/10/01.825 | 57297.325 | 24.2 | 42.9 | 52.2 | 208 | 239 | 4.38 |
| 2015/10/08.849 | 57304.349 | 28.1 | 54.0 | 68.9 | 290 | 334 | 4.37 |
| 2015/10/11.779 | 57307.279 | 26.9 | 45.2 | 57.6 | 255 | 295 | 1.76 |
| 2015/10/12.131 | 57307.631 | – | – | – | 245 | 283 | 1.57 |
| 2015/10/13.777 | 57309.277 | 26.6 | 46.7 | 59.2 | 255 | 301 | 0.47 |
| 2015/10/20.830 | 57316.330 | 31.4 | 50.8 | 61.8 | 289 | 346 | 0.65 |
| 2015/10/25.747 | 57321.247 | 37.0 | 52.9 | 60.3 | 246 | 284 | 1.13 |
| 2015/10/27.780 | 57323.280 | 35.8 | 67.0 | 79.8 | 271 | 309 | 1.61 |
| 2015/11/01.771 | 57328.271 | 29.0 | 48.5 | 57.9 | 260 | 305 | 1.07 |
| 2015/11/01.807 | 57328.307 | 27.2 | 47.6 | 52.9 | 242 | 295 | 1.35 |
| 2015/11/01.817 | 57328.317 | – | – | – | 248 | 294 | 1.16 |
| 2015/11/01.840 | 57328.340 | 27.3 | 47.2 | 54.0 | – | – | 1.16 |
| 2015/11/13.749 | 57340.249 | 37.2 | 67.6 | 74.4 | 278 | 325 | 2.50 |
| 2015/11/25.801 | 57352.301 | 37.6 | 69.5 | 72.8 | 274 | 304 | 3.02 |
| 2015/12/07.805 | 57364.305 | 32.9 | 65.3 | 72.9 | 274 | 308 | 3.11 |
| 2015/12/12.803 | 57369.303 | 30.8 | 62.8 | 73.3 | 260 | 290 | 3.54 |
| 2015/12/23.735 | 57380.235 | 27.3 | 61.1 | 68.5 | 285 | 317 | 3.00 |
| 2015/12/29.761 | 57386.261 | 22.1 | 50.5 | 56.2 | 245 | 274 | 3.28 |
| 2016/01/08.720 | 57396.220 | 25.8 | 58.7 | 71.0 | 285 | 323 | 3.57 |
| 2016/01/13.723 | 57401.223 | 21.9 | 54.8 | 64.8 | 254 | 284 | 4.03 |