Hydrodynamic Simulations of the Central Molecular Zone with a Realistic Galactic Potential
Abstract
We present hydrodynamic simulations of gas clouds inflowing from the disk to a few hundred parsec region of the Milky Way. A gravitational potential is generated to include realistic Galactic structures by using thousands of multipole expansions that describe 6.4 million stellar particles of a self-consistent Galaxy simulation. We find that a hybrid multipole expansion model, with two different basis sets and a thick disk correction, accurately reproduces the overall structures of the Milky Way. Through non-axisymmetric Galactic structures of an elongated bar and spiral arms, gas clouds in the disk inflow to the nuclear region and form a central molecular zone (CMZ)-like nuclear ring. We find that the size of the nuclear ring evolves into pc at Myr, regardless of the initial size. For most simulation runs, the rate of gas inflow to the nuclear region is equilibrated to . The nuclear ring is off-centered, relative to the Galactic center, by the lopsided central mass distribution of the Galaxy model, and thus an asymmetric mass distribution of the nuclear ring arises accordingly. The vertical asymmetry of the the Galaxy model also causes the nuclear ring to be tilted along the Galactic plane. During the first Myr, the vertical frequency of the gas motion is twice that of the orbital frequency, thus the projected nuclear ring shows a twisted, -like shape.
1. Introduction
| ME model | Coordinate | Basis set |
|---|---|---|
| E96 | Cylindrical | |
| HO92 | Spherical | |
| AI78 | Polar | |
Emission from CO molecules reveals that the molecular gas in the Milky Way is abundant along the Galactic plane down to a Galactocentric radius of kpc (Dame et al., 2001). The amount of molecular gas is greatly reduced inside the radius, and a mixed atomic/molecular layer named the “HI nuclear disk” appears instead (Morris & Serabyn, 1996; Ferrière et al., 2007). The molecular gas tends to become concentrated again inside pc with a high number density of , and this region is referred to as the “Central Molecular Zone” (CMZ, Morris & Serabyn 1996).
Migration of gas clouds from the Galactic disk to the central few hundred parsecs is primarily induced by the rotating non-axisymmetric potential, the Galactic bar (Binney et al., 1991). Gas clouds that are moving along the so-called X1 orbit, a family of stable, closed orbits elongated along the bar’s major axis, lose angular momentum near the orbit cusps and plunge to the X2 orbits inside, another a family of stable, closed orbits elongated along the bar’s minor axis in the deeper potential. The infalling gas clouds are compressed when arriving at X2 orbits by collision with resident gas clouds, and are transformed into the molecular form after subsequent cooling. Contrary to the classical view of the CMZ, recently, Kruijssen et al. (2015) and Henshaw et al. (2016a) showed that the observed position-velocity distribution of the dense gas in the CMZ follows an open stream rather than the -type, closed orbits. Many aspects of the CMZ are being explained based on this new point of view (Kruijssen et al., 2015; Krumholz & Kruijssen, 2015; Krumholz et al., 2017; Henshaw et al., 2016a, b).
The accumulated molecular gas in the CMZ is estimated to be , comprising of the total molecular gas in the Galaxy (Launhardt et al., 2002; Pierce-Price et al., 2000; Morris & Serabyn, 1996; Dahmen et al., 1998; Molinari et al., 2011). The high densities of molecular gas in the CMZ lead to high star formation rates (SFRs) of /yr with active star formation sites (Sgr B, and Sgr C) and extraordinary, young, and massive star clusters (Arches and Quintuplet) (Yusef-Zadeh et al., 2008, 2009; Figer et al., 1999; Kim et al., 2006; Immer et al., 2012; Longmore et al., 2013, among others). However, the SFR in the CMZ is an order of magnitude lower than predicted rates at high densities (Longmore et al., 2013). Recent studies suggested that the low SFR in the CMZ is caused by the gas clouds in the CMZ undergoing episodic, bursty star formation, where the current stage is close to a minimum (Kruijssen et al., 2014; Krumholz & Kruijssen, 2015; Krumholz et al., 2017).
Early numerical studies on gas dynamics in the Galactic bulge include two-dimensional (2D) sticky particle simulations by Jenkins & Binney (1994) and 2D smoothed particle hydrodynamics (SPH) simulations by Lee et al. (1999) and Englmaier & Gerhard (1999). They confirmed that the transition of gas motion from X1 to X2 orbits indeed takes place in a bar potential, which was originally suggested by Binney et al. (1991). Rodriguez-Fernandez & Combes (2008) performed 2D sticky simulations using density distribution models of the Galactic bulge, based on the 2MASS star count map. Kim et al. (2011, hereafter Paper I) performed three-dimensional (3D) SPH simulations of the formation of the CMZ in a simple bar with a power-law density profile considering various astrophysical processes such as heating/cooling of the gas, star formation, and supernova (SN) feedback. More recently, Kruijssen et al. (2015) calculated orbital motions of gas clouds in the CMZ under the observed Galactic central mass profile of Launhardt et al. (2002). Krumholz & Kruijssen (2015) showed that acoustic instabilities inside the Galactic inner Lindblad resonance (ILR; kpc) account for the gas migration to the interior of the CMZ, pc. Krumholz et al. (2017) extended this model to include effects of star formation, feedback, and stellar winds and showed that episodic, bursty star formations well reproduce the relatively low SFR in the CMZ compared to that expected in high densities. These numerical studies have widened the knowledge on the formation mechanism and other properties of the CMZ. But these works implemented simplified galactic potentials, narrow radial range of galactic potential and/or did not consider various astrophysical processes in the gas mentioned earlier, and thus were not able to realistically follow the exact gas motions from the Galactic disk to the CMZ region.
Ferrers ellipsoids (Ferrers, 1887) have been commonly adopted in numerical simulations as a density distribution model for the galactic bar component. While Ferrers ellipsoids have, however, a rather unrealistic density cutoff, the exact infalling motion of gas from the galactic disk to the nucleus may be sensitive on the detailed galactic potential in the disk-bulge or disk-bar transition area.
In this paper, we perform 3D SPH simulations that consider gas heating and cooling, star formation, and SN feedback in order to trace the formation and evolution of the CMZ under a realistic density distribution of the Milky Way. Instead of building up the Galaxy with simplified density distribution models individually for the halo, disk, bulge, and bar, we adopt a snapshot from a high-resolution simulation targeted for the Milky Way, which was performed by Baba (2015, hereafter B15)111The simulation of B15 reproduce the 3D structures of the stellar disk, grand-design spiral arms, bar, and also atomic/molecular gas layers of the Milky Way using 6.4 million stellar and 4.5 million gas particles. The dark matter halo component is set to be a static potential following a Navarro-Frank-White (NFW) profile (Navarro et al., 1997). In order to simulate the infalling motion of gas from the Galactic disk to the nucleus with a high spatial resolution and affordable computational overhead, we develop a procedure based on the multipole expansion (ME) technique to describe the detailed density distribution in the snapshot of the B15 simulation. The ME method is advantageous for solving the Poisson equation for a given density distribution from a simulation snapshot, in that one can easily obtain density distributions with bar/bulge masses and elongations that are slightly different from the original density distribution by modifying the expansion coefficients of the ME models.
Since our simulation model is not designed to reproduce detailed structures and realistic kinematics of the dense gas clouds in the CMZ, in this study, we analyze our simulation results focusing on how far the gas clouds in the Galactic disk can reach into the central region under the realistic Galactic structure and how an asymmetric Galactic mass distribution affects the nuclear ring, rather than confining the CMZ to the X2-type nuclear ring or an open stream (e.g., Kruijssen et al. 2015; Krumholz & Kruijssen 2015; Krumholz et al. 2017). This paper is organized as follows. §2 explains how we describe the realistic Galactic structure using the ME method. §3 presents our galaxy models and parameters, and §4 describes the simulation code. Our simulation results on the formation and evolution of the CMZ are analyzed in §5. Summaries and discussions are presented in §6.
2. Realistic Density Distribution Using Multipole Expansion Method
2.1. Test of various multipole expansion models
In the ME method, the density and potential at a position are expressed in terms of a series:
| (1) |
where , , and are quantum numbers for the radial and two angular variables, respectively, is the expansion coefficient, and and are the density–potential basis sets of the ME method.
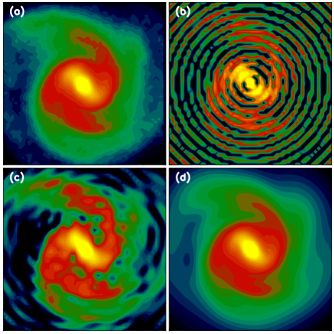
To find the best set (or sets) of basis functions for the density distribution of the adopted simulation snapshot (Figure 1a), we try the following three basis functions: 1) a 3D cylindrical basis set developed by Earn (1996, hereafter E96), which is targeted for disk-like mass distributions with a non-zero thickness, 2) a 3D spherical basis set developed by Hernquist & Ostriker (1992, hereafter HO92), which is optimized for quasi-spherical mass distributions, and 3) a 2D polar basis set developed by Aoki & Iye (1978, hereafter AI78) for a razor-thin disk. These basis sets are listed in Table 1.
First, we try the 3D cylindrical basis set of E96 to describe the density distribution of the B15 snapshot222Hereafter, the B15 snapshot (or model) means the snapshot (or model) at Gyr if not specified otherwise.. Although we attempted many different combinations of maximum values for the three quantum numbers of , , and , the density distribution that best fits the simulation snapshot has radial fluctuations as seen in Figure 1b. The problem appears to stem from the fact that a basis function that is intended for a disk-like structure is used to model a mass distribution having both disk and bulge components.
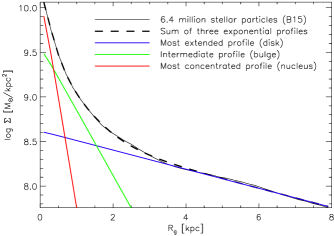
In an attempt to solve this problem, we decompose the mass distribution of the simulation snapshot. We find that the projected density profile of the snapshot is well decomposed into three parts using a double-exponential profile (see Figure 2),
| (2) |
where , , and are the central surface density, scale length, and scale height, respectively. Using the three double-exponential profiles whose combined superpositions best fit the projected density profile of the simulation snapshot, each particle in the simulation is assigned to one of the three groups, disk (most extended), bulge (intermediate), and nucleus (most concentrated), in a probabilistic manner (Table 2). Note that all of the resulting three groups have non-axisymmetric structures (bar and spiral arms) although the fitting functions are axisymmetric.
| Component | |||
|---|---|---|---|
| Disk | 4.05 | 0.39 | |
| Bulge | 0.59 | 0.42 | |
| Nucleus | 0.18 | 0.16 |
We then apply the E96 basis set to the mass distribution made by the particles in the disk group and the 3D spherical basis set of HO92 to the collection of particles in the respective bulge and nucleus groups. Figure 1c presents the projected density distribution reproduced by the ME model with a combination of the E96 and HO92 basis sets. It shows less severe radial fluctuations than those seen in the model with only the E96 basis set. However, the projected density distribution reproduced by the ME model still has unacceptably large discrepancies from that of the simulation snapshot. As in the case of the E96 basis set, we have tried many different combinations of maximum values for , , and and the scale factor for the radial basis function. We find that larger radial scale factors reduce radial fluctuations but describe spiral structures in the disk less effectively.
Finally, we apply the 2D cylindrical basis set of AI78 to the mass distribution of the disk group particles and the HO92 basis set to the distribution of the nucleus+bulge group particles. Figure 1d displays the projected density distribution reproduced by the ME model with a combination of HO92 and AI78 basis sets. It shows an acceptably good match to the projected density distribution of the B15 snapshot. For this reason, we adopt these two basis sets for describing the mass distribution of the simulation snapshot with the ME technique. The two-dimensional limit of the AI78 basis set is alleviated by the implementation of the “thick disk approximation”, which will be described in § 2.3.
2.2. Expansion coefficients
We calculate two sets of expansion coefficients for the particle distribution of the B15 snapshot: one with the HO92 model and the other with the AI78 model. In Appendices A and B, we show how the HO92 and AI78 models describe the density and potential distributions, how the expansion coefficients can be obtained from a given particle distribution, and how the gravitational acceleration can be obtained from these ME models.
Hereafter, and corresponds to radial and azimuthal quantum numbers in both the HO92 and AI78 models, while is polar quantum number in the HO92. Higher quantum numbers represent smaller structures and higher frequencies. However, including higher quantum numbers does not always result in a better description of a given density distribution, because they may yield noisier structures (e.g., Meiron et al. 2014). Furthermore, the use of higher quantum numbers requires significantly longer calculation times to derive the acceleration . Thus, one needs to find the appropriate maximum quantum numbers , , and that can properly describe the fine structures of the given particle distribution and yet do not results in an excessive calculation cost. Among the possible combinations of , , and , we selected the one that satisfied the following criteria: (1) the projected density maps derived with the stellar particles and the ME models (cell side length = 0.2 kpc) have a relative difference smaller than 0.1 in the radial range of kpc, and (2) , , and have the smallest number of coefficients . We tested a few thousand sets of , , and and found that , , and ( and for the AI87 model) were the best choice for describing the nucleus, the bar-like bulge and the spiral-structured disk, with a total number of coefficients of 2783 for the HO92 model and 253 for the AI78 model.
2.3. Thick disk approximation
Since we describe the disk component with the 2D polar model of AI78, effects of the vertical mass distribution on the acceleration, , have thus far been ignored. The disk component is decomposed to follow the exponential disk profile of Equation (2), and thus we can estimate the effect of the vertical structure of the disk on the radial and altitude accelerations, and , following the “thick disk approximation” (Binney & Tremaine, 2008, see Section 2.6 for details). First, we calculate the idealized potentials of razor-thin (2D) and non-zero thickness (3D) exponential disks as
| (3) | |||||
where and are modified Bessel functions, and and are defined as
| (4) |
Then the difference of between the 2D and 3D exponential disks is derived as
| (5) | |||||
By adding to the derived from the AI78 model (Equation (B5)), we can recover the effect of the non-zero disk thickness on . Unlike the calculated with the AI78 model, is not a function of the azimuthal angle , since the idealized exponential disk profile is axisymmetric. Thus, is equally applied for , and we assume that the effect of non-zero disk thickness is negligible on . Meanwhile, due to the non-zero disk thickness can be assigned to be
| (6) |
for .
2.4. Implementation
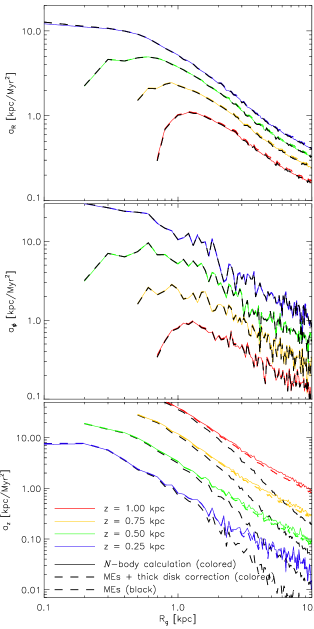
Accelerations derived by the ME method are compared with the -body calculation in Figure 3. To reduce the local fluctuations, , , and are averaged for a given cylindrical shell. The averaged acceleration profiles that are constructed with the ME models with and without the thick disk correction effectively reproduce that of an -body calculation for a wide range of and . The thick disk correction plays an important role in reproducing for kpc. Small discrepancies are observed in at kpc. However, these would influence our scientific results only negligibly, since we focus on the gas motions along the Galactic plane for kpc.
The realistic Galactic structure described with the ME method and the thick disk correction are included in our SPH simulations as a fixed Galactic potential. (The simulation code is described in § 4.) Since our galaxy model contains non-axisymmetric structures such as the elongated bar and spiral arms, we need to consider their rotation. The pattern speed of the bar () of the B15 model is estimated to be km/s/kpc, and the co-rotation radius () is inferred to be kpc. We assume that the spiral arms in all ranges rotate with a constant angular velocity that is the same as . Thus, the whole Galactic structure is considered to rotate with the same pattern speed. A spherically symmetric potential for the halo component is added on top of the rotating non-axisymmetric structures. For this, we adopt the same NFW profile used in B15, which has a total mass of , a scale radius of 280 kpc, and a concentration of 11.2.
3. Galaxy Models
3.1. Bar structure
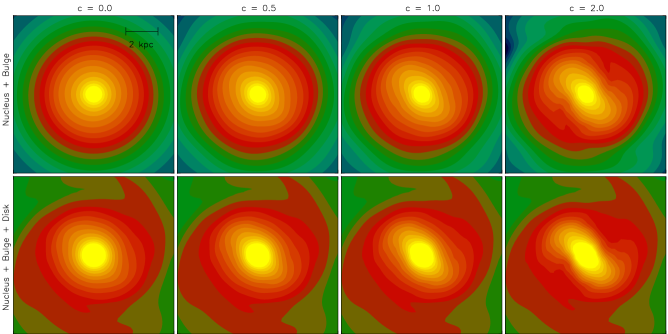
As mentioned earlier, one of the advantages of the ME method is that more and less elongated structures can be easily generated by adjusting the expansion coefficients. In order to vary the bar elongation in our galaxy model, we multiply coefficients of the nucleus+bulge component by a constant . All coefficients for the nucleus+bulge component are then rescaled in a way that reproduces the original total mass. Figure 4 shows the projected density distribution of the nucleus+bulge and nucleus+bulge+disk components, constructed with different values of 0.0, 0.5, 1.0, and 2.0. It is apparent from the figure that the nucleus+bulge component becomes more elongated as the value of increases. At , the nucleus+bulge is not only more elongated than at , but also exhibits spiral patterns. Since the spiral patterns weakly remain in the bulge component even after the decomposition, the nucleus+bulge with the amplified coefficients reveals the spiral patterns. The more/less elongated nucleus+bulges are smoothly connected with the spiral patterns without abrupt density changes (see the bottom panels of Fig 4). However, the bar elongation cannot be completely removed even when , since the disk component includes some of the elongated structure as well.
The bar strength of our models is measured by a dimensionless parameter , which is defined as
| (7) |
(Combes & Sanders, 1981). For computational convenience, and include the nucleus and bulge components only. The galaxy model from B15 (at Gyr) is estimated to have a bar strength of .
In some of our model runs, the bar is set to grow gradually corresponding to the bar growth timescale from the start of the simulations. We imitate the gradual bar growth using a series of coefficient sets that are generated with 20 equally spaced values from 0 to . For a given bar growth timescale, is linearly interpolated with the simulation time-step, and a different coefficient set is adopted accordingly. Bar strength is fully turned on by the end of , and thus the coefficient set of is used for all times after .
| Model | Q | |||||
|---|---|---|---|---|---|---|
| [kpc] | [Myr] | [km/s/kpc] | ||||
| A | 0 - 6 | 0.131 | 1.00 | 0 | 35 | |
| Aq1 | 0 - 6 | 0.081 | 0.50 | 350 | 35 | |
| Aq2 | 0 - 6 | 0.106 | 0.75 | 350 | 35 | |
| Aq3 | 0 - 6 | 0.157 | 1.25 | 350 | 35 | |
| Aq4 | 0 - 6 | 0.184 | 1.50 | 350 | 35 | |
| At1 | 0 - 6 | 0.131 | 1.00 | 175 | 35 | |
| At2 | 0 - 6 | 0.131 | 1.00 | 350 | 35 | |
| At3 | 0 - 6 | 0.131 | 1.00 | 700 | 35 | |
| Ap1 | 0 - 6 | 0.131 | 1.00 | 350 | 30 | |
| Ap2 | 0 - 6 | 0.131 | 1.00 | 350 | 40 | |
| B | 1 - 6 | 0.131 | 1.00 | 0 | 35 | |
| Bq1 | 1 - 6 | 0.081 | 0.50 | 350 | 35 | |
| Bq2 | 1 - 6 | 0.106 | 0.75 | 350 | 35 | |
| Bq3 | 1 - 6 | 0.157 | 1.25 | 350 | 35 | |
| Bq4 | 1 - 6 | 0.184 | 1.50 | 350 | 35 | |
| Bt1 | 1 - 6 | 0.131 | 1.00 | 175 | 35 | |
| Bt2 | 1 - 6 | 0.131 | 1.00 | 350 | 35 | |
| Bt3 | 1 - 6 | 0.131 | 1.00 | 700 | 35 | |
| Bp1 | 1 - 6 | 0.131 | 1.00 | 350 | 30 | |
| Bp2 | 1 - 6 | 0.131 | 1.00 | 350 | 40 | |
| Ah | 0 - 6 | 0.131 | 1.00 | 0 | 35 | |
| At2h | 0 - 6 | 0.081 | 0.50 | 350 | 35 | |
| Bh | 1 - 6 | 0.131 | 1.00 | 0 | 35 | |
| Bt2h | 1 - 6 | 0.081 | 0.50 | 350 | 35 |
Note. — , , , and are spherical harmonics, Gegenbauer polynomial, cylindrical Bessel function, and Legendre function, respectively. Details are enumerated in Appendices A and B.
Note. — Three double-exponential profiles with these parameters are used to decompose the mass distribution of the simulation snapshot.
Note. — The standard values of , , , and are 0.131, 1.0, 350 Myr, and 35 km/s/kpc, respectively (see text for details).
3.2. Model differences
We construct a number of galaxy models, as listed in Table 3. The models are divided into two types, A and B. In models of type A, gas particles are distributed on the disk all the way down to kpc, the inner boundary of the initial gas distribution, . In models of type B, the gas particles are distributed down to kpc. The reason we test the two different values of is to examine how the initial existence or nonexistence of the inner gas structure affects the evolution of the CMZ. In both types, the outer boundary of the initial gas distribution is set to 6 kpc. This is slightly larger than , the boundary between inward and outward radial motion of particles.
Both types of our models are further divided depending on the different values of bar strength (Aq1(Bq1) through Aq4(Bq4)), the bar growth time scale (At1(Bt1) through At3(Bt3)), and the pattern speed of the bar (Ap1(Bp1) and Ap2(Bp2)). In addition, four of our models are built with a higher resolution (Ah, At2h, Bh, and Bt2h). In said high-resolution models, the number of gas particles (whose individual mass is ) distributed on the disk is . In the other models (except Ah, At2h, Bh, and Bt2h), the number of gas particles, whose is , is . For a given particle number, is adjusted to reproduce the total gas mass of the B15 model, over the range of . Here, of the high-resolution models is slightly smaller than that of the B15 model, . A comparison between our high and low-resolution runs shows a good agreement at Gyr within .
In models A, Ah, B, and Bh, the bar strength and the pattern speed of the bar are respectively set to and km/s/kpc, which are equal to those of the B15 model (“standard” values). The bar strength in these runs is fully turned on at the beginning when (standard value), and the initial positions () and velocities () of the gas particles are adopted from the simulation snapshot of B15. Thus the initial gas distribution reflects the realistic gaseous structures (spiral arms, dust lanes, and nuclear ring) that are hydro-dynamically evolving under the Galactic structure.
Unlike in runs A, Ah, B, and Bh, is gradually turned on for in all the other runs. Three different timescales of 175, 350, and 700 Myr are chosen in runs At1(Bt1), At2(Bt2), and At3(Bt3), respectively. These values correspond to 1, 2, and 4 times the rotation period of Myr for the standard of 35 km/s/kpc. Using four different values of , 0.50, 0.75, 1.25, and 1.5, we generate the more/less elongated bar structure whose full is 0.081, 0.106, 0.157, and 0.184, respectively. These are set in runs of Aq1(Bq1) through Aq4(Bq4), respectively, and are gradually turned on for = 350 Myr. Two different values of 30 and 40 km/s/kpc are tested in runs Ap1(Bq1) and Ap2(Bq2), respectively, while the standard of 35 km/s/kpc is adopted in the others. Since the runs with start with the least elongated bar structure with , the initial conditions from the B15 model are no longer realistic. For these runs, the initial of each gas particle is generated to follow a flat radial profile and a vertical distribution of the Gaussian function with a scale height of 20 pc, which approximates the B15 gas disk. The initial is assigned to follow a circular orbit, while the vertical component is initially set to be zero.
4. Simulation code
For our hydrodynamic simulations, we use a parallel -body/SPH code, Gadget-2 (Springel, 2005). The softening length is fixed to be 30 pc, and the size of the SPH kernel333The size of the SPH kernel is limited to describing gas density only up to . is variable by imposing the smoothed number of neighbors to be . For a higher performance with each time-step, we adopt the “FAST” algorithm of Saitoh & Makino (2010), which assigns separate time-steps for gravitational and hydrodynamical integration. A realistic Galactic structure is considered an external potential using the ME method as described in §2, and thus only the gas disk is initially composed of simulation particles (as described in § 2 and 3).
We implement realistic astrophysical gas processes of 1) radiative heating/cooling, 2) star formation, and 3) stellar feedbacks (Shin et al., 2014). Using the CLOUDY 90 package (Ferland et al., 1998, version 10.10), we calculate the radiative cooling and heating rates for wide density and temperature ranges of and K under a uniform far-ultraviolet radiation (FUV) field of 1 and , where is the observed FUV strength in the solar neighborhood444 is the Habing field (Habing, 1968). The FUV strength is a function of atomic hydrogen column density, stellar number density, and stellar age, and thus it is time-varying and also position-dependent. In this study, we assume that intensive star formation activities in the kpc region produce constant FUV radiation of , while those in the outer region produce constant FUV radiation of .
We transform a gas particle into a star particle when it satisfies all of the following star formation criteria (Saitoh et al., 2008, 2009): 1) a hydrogen number density of , 2) temperature of K, and 3) convergent flow of . The local star formation rate is calculated according to the Schmidt law,
| (8) |
where is the density of newly formed stars for a given time step , is the characteristic star formation efficiency of 0.033, is the local gas density, and is the local dynamical time. Here, each stellar particle represents a star cluster whose stellar population follows the Kroupa mass function in the mass range of (Kroupa, 2001).
Using the stellar evolutionary tracks of Hurley et al. (2000), we calculate the number of massive stars that may eventually end up as SNII explosions. SNII feedback is considered in a probabilistic manner, following the recipe of Okamoto et al. (2008). Energy, mass, and metal ejected by SNII explosions are distributed to neighboring gas particles. To better capture the SN shock front with the individual time-stepping (Springel, 2005), we implement a time-step update algorithm introduced by Durier & Dallar Vecchia (2012), which is a modified version of a time-step limiter of Saitoh & Makino (2009). Stellar winds from less massive stars are treated to continuously eject momentum, mass, and metals into the surrounding neighboring gas particles. The details for the radiative heating/cooling, the star formation and stellar feedback are described in Shin et al. (2014) and references therein.
5. Results of the simulations
5.1. Performance
We run all of our simulations for 2000 Myr. Each of the high-resolution runs takes days for Myr using 32 cores, while the self-consistent Galaxy simulation of B15 takes month for Myr using a thousand cores. Calculation of our high-resolution runs is estimated to be times faster than that of B15, in which is even smaller. The high performance arises mainly because the ME replaces the B15’s 6.4 million stellar particles and the gas distribution is truncated to a much smaller than that of the B15 model, thus reducing the total number of gas particles to of B15. Thanks to the high performance of the ME method, we are able to perform the hydrodynamic simulations under the realistic Galactic structure with various model parameters.
5.2. Overall morphology
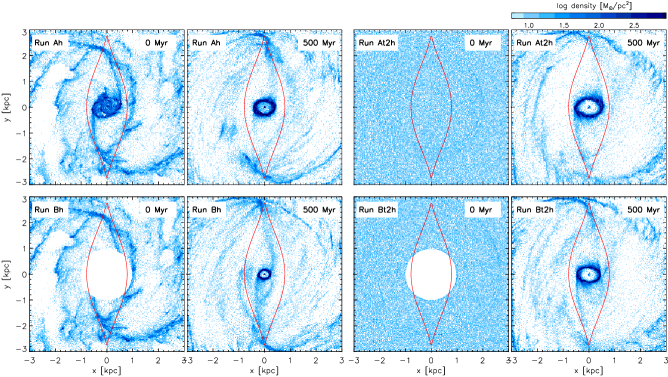
Figure 5 presents the projected density distributions of the gas clouds for the inner 3 kpc rectangular region in the high-resolution runs at and 500 Myr. Since the rotation of the non-axisymmetric Galactic structure is considered in the inertial frame, we redistribute the gas particles in a way that the bar major axis points toward the y-axis. The red curve over-plotted in each panel of the figure indicates the innermost orbit that does not self-intersect. Its long axis is aligned with the bar’s major axis, where its cusps are extended to kpc. The gas distribution at Myr in run Ah shows gaseous structures that have self-consistently evolved with the Galactic structures (B15). The gas streams along the spiral arms are smoothly connected with the dust lanes near kpc, i.e., the contact points with the bar major axis. Due to more significant angular momentum loss near the contact points and the dust lanes, the gas clouds plunge to the nuclear region and form a nuclear ring at pc.
Unlike some claims that a nuclear ring forms near the ILR (Knapen et al., 1995; Regan & Teuben, 2003; Comeron et al., 2010), the radius of the nuclear ring at pc is much smaller than the ILR, which is estimated to be kpc in our Galactic model. According to hydrodynamic simulations performed by Kim et al. (2012), the radius of the nuclear ring is determined by the amount of angular momentum loss at the dust lanes rather than by the resonance. Recently, Krumholz & Kruijssen (2015) showed that gas clouds within the ILR can lose angular momentum due to acoustic instability and thus move closer to the galactic center, down to a stalling radius where shear is at a minimum. Hereafter, a nuclear ring structure produced by our simulations is referred to as a “nuclear ring”, while the real, observed one is referred to as the “CMZ”.
The overall morphologies at Myr in run Ah are quite similar to the initial state, although the dust lanes extend farther and the nuclear ring becomes smaller than at Myr. The slight difference in the morphologies stems from the fact that the gas distribution used as the initial condition is still in the process of adjusting for the time-varying Galactic structure of B15. As the gas clouds are increasingly relaxed under the given Galactic structure, the starting points of the dust lanes become closer to the cusps.
The nuclear structure of kpc is initially removed in model Bh. The inflowing gas clouds do not collide with the nuclear ring structure and thus approach more closely to the Galactic center, first forming an unstable -type orbit for a while. After the -type structure collapses, a stable orbit instead settles down in the nuclear region. Despite the fact that the same Galactic potential is adopted in both models Ah and Bh, the existence/nonexistence of the nuclear ring at the beginning changes the nuclear ring size at Myr.
Results from runs At2h and Bt2h are shown together in Figure 5 as well. The overall morphology at Myr is similar to that of runs Ah and Bh except that the nuclear ring is larger. Since the full is gradually turned on for Myr in runs At2h and Bt2h, the gas clouds infalling before Myr have a larger angular momentum than that of runs Ah and Bh, and thus form the larger-sized nuclear ring. Although the same Galactic potential is adopted for runs At2h and Bt2h, the nuclear ring that forms under run At2h is slightly larger than that of run Bt2h.

5.3. Temporal evolution
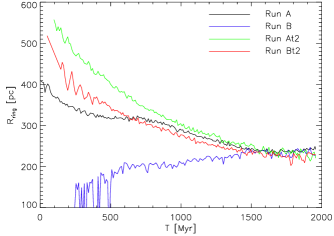
Figure 6 shows the temporal evolution of the typical size of the nuclear ring for runs A, B, At2, and Bt2. Here, is calculated by a Gaussian peak of distribution for the gas clouds located in a range of pc. Hereafter, properties of a nuclear ring are measured in the same radial range. Due to shear viscosity between the resident gas clouds in the nuclear ring and collisions between inflowing gas clouds and the resident gas clouds, the typical angular momentum and/or orbital energy of the nuclear ring change gradually, and varies accordingly. All values of , regardless of the initial value, converge to the same value of pc at Myr, since the amounts of angular momentum of inflowing gas clouds along the dust lanes after Myr are the same. Interestingly, the equilibrated ring size at pc is similar to the stalling radius (Krumholz & Kruijssen, 2015), which is calculated as pc in our Galactic model.
The inflowing gas clouds along the dust lanes are accumulated in the nuclear ring with a typical surface density of . The gas clouds have a clumpy structure with an individual mass of . The mass scales are comparable with those in the outer region of the CMZ (pc) (Stark et al., 1991), but are 10 times larger than those in the inner region of the CMZ (pc), whose surface density is (Walker et al., 2015; Henshaw et al., 2016b). The different mass scale of the gas clouds between the nuclear ring and the inner region of the CMZ might be due to the two facts that: 1) the mass scale for gravitational collapse against thermal pressure and shear force is different, since is different (Henshaw et al., 2016b), and 2) our simulation model does not realistically describe clumpy structures, since the minimum size of the SPH kernel is set to smooth the high-density clumpy structures of .
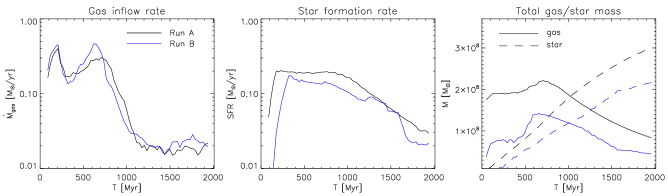
The evolution of the gas inflow rate to the nuclear ring (), the SFR in the nuclear ring, and the total masses of the gas and the stars within the nuclear ring ( and ) in runs A and B are shown in Figure 7. During the first Myr, unrelaxed gas clouds under the given Galactic structure inflow to the nuclear ring (Paper I). After the initial relaxation period, is enhanced again as the gas clouds located in the outside orbit inflow to the inside through the spiral shocks (Kim & Kim, 2014; Seo & Kim, 2014). After the second peak, the inflowing of gas clouds in the nuclear region is rapidly decreased, and equilibrates to yr at Myr in both runs. Without additional fresh gas supplements to the gas disk, such as gas recycling from stellar mass loss (Segers et al., 2016), galactic fountains (Oppenheimer & Davé, 2008; Oppenheimer et al., 2010; Kereš et al., 2009), and cosmic accretion of primordial gas (Dekel et al., 2009; Richter, 2012), the gas reservoir supplying the nuclear ring is depleted; thus, remains steady at yr until the end of the runs.
Star formation activities in the nuclear ring show milder changes as compared to those of (Figure 7). Since is proportional to (Equation (8)), SFR integrated for the entire nuclear ring is more correlated with than . As the accumulated gas clouds in the nuclear ring are consumed to form stars at an SFR of , the gas densities in the nuclear ring decrease. Consequently, the SFR is decreased below .
5.4. Asymmetry & Tilt of the CMZ
The Galaxy model used in this study reflects the realistic mass distribution that self-consistently reproduces the 3D structure of the Galactic stellar disk, the grand-design spiral arms, and the bar (B15). The realistic Galactic structures of B15 are found to have a lopsided central mass distribution, which leads the density peak of the central mass distribution to be off-centered from the Galactic center. Since the nuclear ring is centered on the off-centered density peak, not on the Galactic center, the center of the nuclear ring wanders around the Galactic center with the Galaxy’s rotational period (Baldwin et al., 1980; Haynes et al., 1998; Fux, 2001; Bouranud et al., 2005). The off-centered nuclear ring with respect to the Galactic center brings an asymmetric mass distribution , which is defined as the ratio of with to that with , where the -axis is directed toward the Galactic center along the bar’s major axis, the -axis is along the Galactic plane, and the -axis is perpendicular to the Galactic plane. As the center of the nuclear ring wanders around the Galactic center, a projected nuclear ring onto the - plane goes back and forth along the -axis. Thus, oscillates accordingly with a period of Myr, which is the same as the period of Galactic rotation, 175 Myr (Figure 8). The amplitude of gradually grows as decreases to pc. However, the observed asymmetry of the CMZ is reported to have originated from a discontinuous, lopsided gas mass distribution whose one side of contains much more gas than the other side of , rather than from the off-centered nuclear ring (Bally et al., 2010; Henshaw et al., 2016a).
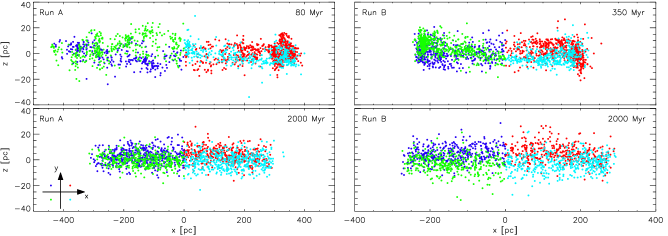
The vertical asymmetry of the central mass distribution, although much weaker than the asymmetries in the - and -directions, causes the gas clouds infalling to the nuclear ring to have vertical components of motion. Through collisions between the gas clouds orbiting in the nuclear ring, the -directional oscillations are likely synchronized to locally have the same phase and frequency. Thus, the nuclear ring projected onto the - (or -) plane exhibits a swirling shape. Interestingly, during the first Myr for type A ( Myr for type B), the vertical frequency of the gas motion is twice that of an orbital frequency, thus the projected nuclear ring shows a twisted , -like shape (top panels of Figure 9), which is similarly observed in the CMZ (Molinari et al., 2011). However, the -like feature does not last for a long time in our simulations, and the vertical oscillations of the whole nuclear ring are synchronized to have the same frequency as that of the orbital motion due to self-interactions of the gas clouds. Since the gas clouds in the nuclear ring follow an X2-type closed orbit, the tilted nuclear ring precesses with the same pattern speed as the Galactic structures (bottom panels of Figure 9). Figure 10 shows that the azimuthal angle of the tilted nuclear ring oscillates with a period of Myr, the rotation period of the Galactic structures. Meanwhile, the tilted angle from the Galactic rotational axis is nutating with a period of Myr.

5.5. Parametric variations
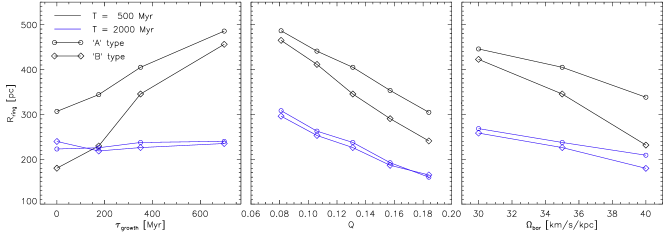
We examine the dependence of on the parameters , , and (Figure 11). By considering the four runs in each type A(B) and At1(Bt1) through At3(Bt3) where the four different periods of are adopted, we find that a longer results in a larger at Myr (leftmost panel). However, since the full of these runs are given to be the same, the increasing tendency of with is dissipated at Myr. From this, we infer that the current size of the CMZ does not reflect the early stage of the Galactic bar.
The more strongly barred galaxies have been reported to possess a smaller-sized nuclear ring (Comeron et al., 2009, 2010; Mazzuca et al., 2011; Kim et al., 2012). Likewise, our runs A(B) and Aq1(Bq1)Aq4(Bq4) show that decreases with increasing (middle panel). While the standard results in the equilibrated nuclear ring of pc, a stronger causes a smaller-sized nuclear ring of pc, which better resembles the CMZ. The Galactic structure of B15 is measured to be in process of varying from 30 to 40 km/s/kpc for Gyr, while the typical is km/s/kpc. Our runs A(B) and At1(Bt1)At2(Bt2) show that as increases from 30 to 40 km/s/kpc, the equilibrated decreases from pc to pc (rightmost panel).
6. Summary & Discussion
In this paper, we performed high-resolution SPH simulations to trace the formation and evolution of the CMZ under the influence of realistic Galactic structures. For this, we adopted a snapshot of the self-consistent Galaxy simulation that reproduces the Galactic stellar disk, grand-design spiral arms, and bar (B15)555It is worth noting that formation/evolution of the realisitic Galactic structures can be described with series of snapshots and their ME coefficient sets.. The ME method was utilized to efficiently include the realistic Galactic structures of B15 into our SPH simulations. We found that the Galactic structure is best reproduced when: 1) stellar particles are decomposed into nucleus+bulge and disk components using three exponential disk profiles, 2) the 3D spherical ME model (HO92) is adopted for describing the nucleus+bulge component, while the 2D polar ME model (AI78) is used for the disk component, and 3) the non-zero thickness of the disk component is corrected by the thick disk correction (Binney & Tremaine, 2008). Our method not only accurately reproduces the overall distribution of the stellar particles, but also reduces the calculation time by a factor of compared to that of the full -body calculation of B15. Furthermore, by modifying the ME coefficients, we can easily enlarge/diminish the bar elongation and thus imitate the gradual bar growth.
Our SPH simulations reproduce the following overall gaseous structures: 1) the gas clouds in the disk region inflow to the kpc region along the spiral streams, 2) the gas clouds collide with themselves near the cusps and plunge into the nuclear region along the dust lanes, and 3) the inflowing gas clouds form the nuclear ring. Depending on and , the size of the nuclear rings are different as pc at first. Regardless of the initial , they converge to pc at Myr.
The balanced at pc is slightly larger than the outer boundary of the CMZ, pc (Morris & Serabyn, 1996) but is significantly larger than the typical radii for the dense gas clouds of the CMZ, pc (Kruijssen et al., 2015; Henshaw et al., 2016a). The size difference between the nuclear ring (by simulations) and the CMZ (by observations) indicates that our Galactic model lacks an accurate central mass distribution (e.g., Launhardt et al. 2002).
Recent works by Sormani et al. (2015) and Krumholz & Kruijssen (2015) showed that the CMZ resides at much smaller radii than the Galactic ILR, kpc. Similarly, the nuclear ring in our simulations forms at farther inside than the ILR. The balanced at pc is quite similar to the stalling radius (Krumholz & Kruijssen, 2015), which is estimated as pc in our Galactic model. In this study, we cannot accurately determine the correlation of the balanced with the stalling radius and/or with the angular momentum loss of the inflowing gas clouds at the dust lanes, but it is clear that an type nuclear ring can settle in farther inside than the ILR.
Interestingly, a very compact nuclear ring is produced when the nuclear structure of kpc is initially removed; thus, the inflowing gas clouds do not collide with the nuclear ring structure. The inflowing gas clouds to the nuclear region form a very compact nuclear ring of pc during the first few hundred Myr. We have hypothesized that a small merging galaxy approaching close to the galactic center might disperse the existing nuclear structure and perturb the gaseous disk (Lang et al., 2013). In a follow-up study, we aim to study how a minor merging event affects the redistribution of gaseous nuclear structures.
As the gas clouds in the disk are depleted after Myr, the gas inflow rate to the nuclear ring is equilibrated at , which is insufficient to maintain the SFR in the nuclear ring at . Thus, additional mechanisms that can continuously feed the gas reservoirs, such as gas replenishment from stellar mass loss, galactic fountains, and cosmic accretion (Segers et al., 2016; Oppenheimer & Davé, 2008; Oppenheimer et al., 2010; Kereš et al., 2009; Dekel et al., 2009; Richter, 2012), are necessary to trace the realistic gas to the central region over a few Gyr timescale. This issue will be discussed in a follow-up study.
Unlike the low SFR of the CMZ compared to predicted rates (Longmore et al., 2013), the nuclear ring in our simulations overproduces stars relative to the SFR-gas density relation of the CMZ. This occurs because our star formation model is implemented to reproduce the Schmidt law (Equation 8). Meanwhile, the episodic star formation activity whose current stage is at a minimum is suggested to explain the low SFR of the CMZ (Kruijssen et al., 2014; Krumholz & Kruijssen, 2015; Krumholz et al., 2017). However, in our simulations, stars in the nuclear ring form consistently rather than in a burst-like manner (see the middle panel of Fig. 7). This difference might be due to the limits of our numerical model that: 1) the minimum size of the SPH kernel is set to smooth high-density clumpy structures, 2) the standard SPH with density-entropy formulation used in our simulations does not adequately address dynamical instabilities and contact discontinuities (Agertz et al., 2007), and 3) our feedback models do not reflect radiation feedback from stars, such as position-dependent photoionization and radiation pressure (Hopkins et al., 2014).
Thanks to our Galaxy model, which is found to have a lopsided mass distribution, the nuclear ring reproduced by our simulations consistently shows: 1) periodic variation in the asymmetric mass distribution, 2) a twisted, -like shape, and 3) tilt with respect to the Galactic plane. The effect of a lopsided mass distribution on the CMZ should be revisited using a more realistic central mass distribution of the Galaxy (e.g., Launhardt et al. 2002; Kruijssen et al. 2015).
Appendix A A. 3D spherical multipole expansion model of Hernquist & Ostriker (1992)
For a computational convenience, density and potential in a position of are rewritten as
| (A1) |
where is a Legendre function, and , , , and are
| (A2) |
Here, , , , and are
| (A3) |
where is a Gegenbauer polynomial, and is a normalization constant of
| (A4) |
The expansion coefficients of and are calculated with a collection of th particles by,
| (A5) |
Similar to and , accelerations , , and are derived by
| (A6) |
where and are
| (A7) |
Appendix B B. 2D disk multipole expansion model of Aoki & Iye (1978)
Surface density and potential in a cylindrical coordinate for the disk system are given by
| (B1) |
where
| (B2) |
Here, , , and are
| (B3) |
The expansion coefficients and can be calculated with a collection of th particles by,
| (B4) |
Similar to and , acceleration and can be expressed as
| (B5) |
where and are
| (B6) |
References
- Aoki & Iye (1978) Aoki, S., & Iye, M. 1978, PASJ, 30, 519
- Agertz et al. (2007) Agertz, O., Moore, B., Stadel, J., Potter, D., Miniati, F., Read, J., Mayer, L. et al. 2007, MNRAS, 380, 963
- Baba (2015) Baba, J. 2015, MNRAS, 454, 2954 (B15)
- Baldwin et al. (1980) Baldwin, J. E., Lynden-Bell, D., & Sancisi, R. 1980, MNRAS, 193, 313
- Bally et al. (2010) Bally, J., Aguirre, J., Battersby, C., Bradley, E, T., Cyganowski, C., Dowell, D., Drosback, M. et al. 2010, ApJ, 721, 137
- Binney & Tremaine (2008) Binney, J., & Tremaine, S. 2008, Galactic Dynamics, 2nd edn, Princeton Univ. Press, Princeton, NJ
- Binney et al. (1991) Binney, J., Gerhard, O. E., Startk, A. A., Bally, J., & Uchida, K. I. 1991, MNRAS, 252, 210
- Bouranud et al. (2005) Bournaud, F., Combes, F., Jog, C. J., & Puerari, I. 2005, A&A, 438, 507
- Combes & Sanders (1981) Combes, F.& Sanders, R. H. 1981, A&A, 96, 164
- Comeron et al. (2009) Comerón, s., Martínez-Valpuesta, I., Knapen, J. H., & Beckman, J. E. 2009, ApJ, 706, 256
- Comeron et al. (2010) Comerón, S., Knapen, J. H., Beckman, J. E., Laurikainen, E., Salo, H., Martínez-Valpuesta, I.,& Buta, R. J. 2010, MNRAS, 402, 2462
- Dahmen et al. (1998) Dahmen, G., Huttemeister, S., Wilson, T. L., & Mauersberger, R. 1998, A&A, 331, 959
- Dame et al. (2001) Dame, T. M., Hartmann, D., & Thaddeus, P. 2001, ApJ, 547, 792
- Dekel et al. (2009) Dekel, A., Sari, R., & Ceverino, D. 2009, ApJ, 703, 785
- Durier & Dallar Vecchia (2012) Durier, F., & Dallar Vecchia, C. 2012, MNRAS, 419, 465
- Earn (1996) Earn, D. J. D. 1996, ApJ, 465, 91
- Englmaier & Gerhard (1999) Englmaier, P., & Gerhard, O. 1999, MNRAS,304,512
- Ferland et al. (1998) Ferland, G. J., Korista, K. T., Verner, D. A., Ferguson, J. W., Kingdon, J. B.,& Verner, E. M. 1998, PASP, 110, 761
- Ferrers (1887) Ferrers, N. M. 1887, Q. J. Pure Appl. Math., 14, 1
- Ferrière et al. (2007) Ferrière, K., Gillard, W., & Jean, P. 2007, A&A, 467, 611
- Figer et al. (1999) Figer, D. F., Kim, S. S., Morris, M., Serabyn, E., Rich, M., & Mclean, I. S. 1999, ApJ, 525, 750
- Fux (2001) Fux, R. 2001, A&A, 373, 511
- Habing (1968) Habing, H. J. 1968, Bull. Astron. Inst. Neth., 19, 421
- Haynes et al. (1998) Haynes, M. P., van Zee, L., Hogg, D. E., Roberts, M.S.,& Maddalena, R. J. 1998, AJ, 115, 62
- Henshaw et al. (2016a) Henshaw, J. D., Longmore, S. N., Kruijssen, J. M. D., Davies, B., Bally, J., Barnes, A., Battersby, C., & Burton, M. et al. 2016, MNRAS, 457, 2675
- Henshaw et al. (2016b) Henshaw, J. D., Longmore, S. S., & Kruijssen, J. M. D. 2016, MNRAS, 463, L122
- Hernquist & Ostriker (1992) Hernquist, L. & Ostriker, J. P. 1992, ApJ, 386, 375
- Hopkins et al. (2014) Hopkins, P. F.; Kereš, D., Oñorbe, J., Faucher-Giguère, C., Quataert, E., Murray, N., & Bullock, J. S. 2014, MNRAS, 445, 581
- Hurley et al. (2000) Hurley, J. R., Pols, O. R., & Tout, C. A. 2000, MNRAS, 315, 543
- Immer et al. (2012) Immer, K., Schuller, F., Omont, A., &Menten, K. M. 2012, A&A, 537, 121
- Jenkins & Binney (1994) Jenkins, A., & Binney, J. 1994, MNRAS,270, 703
- Kereš et al. (2009) Kereš D., Katz N., Davé R., Fardal M., & Weinberg D. H., 2009, MNRAS, 396, 2332
- Kim et al. (2006) Kim, S. S., Figer, D. F., Kudritzki, R. P., & Najarro, F. 2006, ApJ, 653, L113
- Kim et al. (2011) Kim, S. S., Saitoh, T. R., Jeon, M., Figer, D. F., Merritt, D., & Wada, K. 2011, ApJ, 735, 11 (Paper I)
- Kim et al. (2012) Kim, W.-T., Seo, W.-Y., Stone, J. M., Yoon, D., & Teuben, P. J. 2012, ApJ, 747, 60
- Kim & Kim (2014) Kim, Y., & Kim, W.-T. 2014, MNRAS,440, 208
- Knapen et al. (1995) Knapen, J. H., Beckman, J. E., Heller, C. H., Shlosman, I., & de Jong, R. S. 1995, ApJ, 454, 623
- Kruijssen et al. (2014) Kruijssen, J. M. D., Longmore, S. N., Elmegreen, B. G., Murray, N., Bally, J., Testi, L., & Kennicutt, R. C. 2014, MNRAS, 440, 3370
- Kruijssen et al. (2015) Kruijssen, J. M. D., Dale, J. E., & Longmore, S. N. 2015, MNRAS, 447, 1059
- Krumholz & Kruijssen (2015) Krumholz M. R., Kruijssen J. M. D. 2015, MNRAS, 453, 739
- Krumholz et al. (2017) Krumholz M. R., Kruijssen J. M. D., & Crocker, R. M. 2017, MNRAS, 466, 1213
- Kroupa (2001) Kroupa, P. 2001, MNRAS, 322, 231
- Lang et al. (2013) Lang, M., Holley-Bockelmann, K., Bogdanović, T., Amaro-Seoane, P., Sesana, A., & Sinha, M. 2013, MNRAS, 430, 2574
- Launhardt et al. (2002) Launhardt, R., Zylka, R., & Mezger, P. G. 2002, A&A, 384, 112
- Lee et al. (1999) Lee, C. W., Lee, H. M., Ann, H. B., & Kwon, K. H. 1999, ApJ, 513, 242
- Longmore et al. (2013) Longmore, S. N., Bally, J., Testi, L., Purcell, C. R., Walsh, A. J., Bressert, E., et al. 2013, MNRAS, 429, 987
- Mazzuca et al. (2011) Mazzuca, L. M.. Swaters, R. A.. Knapen, J. H., & Veilleux, S. 2011, ApJ, 739, 104
- Meiron et al. (2014) Meiron, Y., Li, B., Holley-Bockelmann, K., & Spurzem, R. 2014, ApJ, 792, 98
- Molinari et al. (2011) Molinari, S., Bally, J., Noriega-Crespo, A., Compiegne, M., Bernard, J. P.,Martin, P., Testi, L., et al. 2011, ApJ, 735, 33
- Morris & Serabyn (1996) Morris, M., Serabyn, E. 1996, ARA&A, 34, 645
- Navarro et al. (1997) Navarro, J. F., Frenk, C. S., & White, S. D. M. 1997, ApJ, 490, 493
- Okamoto et al. (2008) Okamoto, T., Neummen, R. S., & Bower, R. G. 2008, MNRAS, 385, 161
- Oppenheimer & Davé (2008) Oppenheimer B. D., & Davé R., 2008, MNRAS, 387, 577
- Oppenheimer et al. (2010) Oppenheimer B. D., Davé R., Kereš D., et al. 2010, MNRAS, 406, 2325
- Pierce-Price et al. (2000) Pierce-Price, D., Richer, J. S., Greaves, J. S., Holland, W. S., Jenness, T., Lasenby, A. N., White, G. J., et al. 2000, ApJ, 545, 121
- Richter (2012) Richter, P. 2012, ApJ, 750, 165
- Regan & Teuben (2003) Regan, M. W., & Teuben, P. J. 2003, ApJ, 582, 723
- Rodriguez-Fernandez & Combes (2008) Rodriguez-Fernandez, N. J. & Combes, F. 2008, A&A, 489, 115
- Saitoh & Makino (2010) Saitoh, T. R., & Makino, J. 2010, PASJ, 62, 301
- Saitoh et al. (2008) Saitoh, T. R., Daisaka, H., Kokubo, E.,; Makino, J., Okamoto, T., Tomisaka, K., Wada, K., & Yoshida, N. 2008, PASJ, 60, 667
- Saitoh & Makino (2009) Saitoh, T. R.,& Makino, J. 2009, ApJ, 697, 99
- Saitoh et al. (2009) Saitoh, T. R., Daisaka, H., Kokubo, E., Makino, J., Okamoto, T., Tomisaka, K., Wada, K., & Yoshida, N. 2009, PASJ, 61, 481
- Segers et al. (2016) Segers M. C., Crain R. A., Schaye J., et al. 2016, MNRAS, 456, 1235
- Seo & Kim (2014) Seo, W.-Y., & Kim, W.-T. 2014, ApJ, 792, 47
- Shin et al. (2014) Shin, J., Kim, J., Kim, S. S., & Park, C. 2014, JKAS, 47, 87
- Sormani et al. (2015) Sormani, M. C., Binney, J., & Magorrian, J. 2015, MNRAS, 454, 1818
- Springel (2005) Springel, V. 2005, MNRAS,364, 1105
- Stark et al. (1991) Stark, A. A., Bally, J., Gerhard, O. E., & Binney, J. 1991, MNRAS, 248, 14
- Walker et al. (2015) Walker, D. L., Longmore, S. N., Bastian, N., Kruijssen, J. M. D., Rathborne, J. M., Jackson, J. M., Foster, J. B.,& Contreras, Y. 2015, MNRAS, 449, 715
- Yusef-Zadeh et al. (2008) Yusef-Zadeh, F., Braatz, J., Wardle, M., & Roberts, D. 2008, ApJ, 683, 147
- Yusef-Zadeh et al. (2009) Yusef-Zadeh, F., Hewitt, J. W., Arendt, R. G., Whitney, B., Rieke, G., Wardle, M., Hinz, J. L., et al. 2009, ApJ, 702, 178