Network-based coverage of mutational profiles reveals cancer genes
Abstract
A central goal in cancer genomics is to identify the somatic
alterations that underpin tumor initiation and progression. This task
is challenging as the mutational profiles of cancer genomes exhibit
vast heterogeneity, with many alterations observed within each
individual, few shared somatically mutated genes across individuals,
and important roles in cancer for both frequently and infrequently
mutated genes. While commonly mutated cancer genes are readily
identifiable, those that are rarely mutated across samples are
difficult to distinguish from the large numbers of other infrequently
mutated genes. Here, we introduce a method that considers
per-individual mutational profiles within the context of
protein-protein interaction networks in order to identify small
connected subnetworks of genes that, while not individually frequently
mutated, comprise pathways that are perturbed across (i.e., “cover”)
a large fraction of the individuals. We devise a simple yet intuitive
objective function that balances identifying a small subset of genes
with covering a large fraction of individuals. We show how to solve
this problem optimally using integer linear programming and also give
a fast heuristic algorithm that works well in practice. We perform a
large-scale evaluation of our resulting method, nCOP, on 6,038
TCGA tumor samples across 24 different cancer types. We demonstrate
that our approach nCOP is more effective in identifying cancer genes than both
methods that do not utilize any network information as well as
state-of-the-art network-based methods that aggregate mutational
information across individuals. Overall, our work demonstrates the
power of combining per-individual mutational information with
interaction networks in order to uncover genes functionally relevant
in cancers, and in particular those genes that are less frequently
mutated.
Software download: http://www.cs.princeton.edu/mona/software/ncop.html
Introduction
Large-scale cancer genome sequencing consortia, such as The Cancer Genome Atlas (TCGA) [35], the International Cancer Genome Consortium (ICGC) [37] and other smaller, cancer-specific studies have sequenced the protein-coding regions of thousands of tumor samples across tens of different cancer types. Initial analyses of these data have revealed that while there may be numerous somatic mutations in a tumor that result in altered protein sequences, very few are likely to play a role in cancer development [2, 41, 14]. Therefore, a major challenge in cancer genomics is to develop methods that can distinguish the so-called “driver” mutations important for cancer initiation and progression from numerous other “passenger” mutations.
Early statistical approaches have identified cancer-driving genes by highlighting those genes that are mutated more frequently in a cohort of patients than expected by chance according to some background model [44, 10, 25]. However, the genetic underpinnings of cancer are highly heterogeneous: even when considering a single cancer type, very few genes are found to be somatically mutated across large numbers of individuals [18]. Further, genes altered only in a few individuals may also be important for tumorigenesis and cancer progression [34]. Clearly, these rarely mutated but cancer-relevant genes cannot be detected by purely frequency-based approaches.
A promising alternative viewpoint is to consider somatic mutations in the context of pathways instead of genes. In particular, it has been proposed that alterations within any of several genes comprising the same pathway can have similar consequences with respect to cancer development, and that this contributes to the mutational heterogeneity evident across cancers. Consistent with this, numerous analyses of TCGA data have shown that certain known pathways are frequently altered across tumor samples of a particular cancer via mutations in different genes [36, 28]. Early studies have leveraged this observation by analyzing known pathways for enrichment of somatic mutations [21, 4] and pinpointing those that are significantly mutated across patients [42, 40]. The power of these studies is somewhat limited, however, as our knowledge of pathways is incomplete and new pathways cannot be identified by these approaches.
De novo discovery of cancer-relevant pathways using large-scale protein interaction networks has thus been the focus of several newer methods (e.g., [39, 4, 7, 29, 5]). In particular, since protein-protein interaction networks have a modular organization [15, 32], proteins taking part in the same pathways and processes tend to be close to each other in the network. One prominent class of techniques leverages this modular structure by propagating mutational information through protein interaction networks and deriving pathways from the induced subnetworks [39, 26, 20, 1]. For instance, Vandin et al. [39] diffuse a “heat” signal arising from the frequency with which proteins are somatically mutated across a cohort of samples to uncover cancer-relevant modules while Hofree et al. [17] approach the problem from a different angle, using biological network information to stratify cancer subtypes. A recent pan-cancer network analysis [26] affirms the power of diffusing mutational data across protein interaction networks, especially for uncovering rarely mutated cancer genes. However, such diffusion approaches can be highly influenced by frequently mutated genes [26], and further, these methods do not consider whether most patients have mutations in any of the identified pathways.
Here we present a novel network-based approach to tackle cancer mutational heterogeneity by utilizing per-individual mutational profiles. Our method is based on the expectation that if a pathway is relevant for cancer, then (1) many individuals will have a somatic mutation within one of the genes comprising the pathway and (2) the genes comprising the pathway will interact with each other and together form a small connected subcomponent within the larger network. Therefore, given a biological network as well as patient sample data consisting of somatic point mutations, the goal of our approach is to find a set of candidate genes that both “cover” the most patients (i.e., individuals have mutations in one or more of these genes) and are connected in the network (i.e., these genes are likely to participate in the same cellular pathway or process). In contrast to network diffusion approaches, our framework focuses on per-individual mutational profiles and as a result, the “influence” of frequently mutated genes is not spread through the network. We note that network-based coverage approaches have been previously introduced to uncover pathways that are dysregulated [38, 6, 23] or mutated [9, 24] across cohort of samples. However, either patients were required to be covered by these approaches [38, 6, 23, 24], in some cases multiple times (which is especially relevant for dysregulated genes, since there many of them), or these approaches were designed for data sets with significantly fewer mutations [9]; both cases lead to very different optimizations and algorithms that are not effective for the task at hand.
We devise a simple yet intuitive objective function that balances identifying a small subset of genes with covering a large fraction of individuals. Our objective has just a single parameter that is automatically set using a series of cross-validation tests, eliminating the need of many previous approaches to manually select values for various thresholds and parameters. We develop an integer linear programming formulation to solve this problem and also give a fast heuristic algorithm. We apply our method—network-based coverage of patients (nCOP)—to 24 cancer types from TCGA and uncover both well-known cancer driver genes as well as new potential cancer-related genes. We compare nCOP to previous methods that do not use network information, including a state-of-the-art frequency-based method [25] and a “set cover” version of our approach that attempts to find a set of genes that covers cancer samples without considering network connectivity, and demonstrate nCOP’s superior power in detecting known cancer genes and in zooming in on rarely mutated ones. Finally, we compare nCOP to a recent network-based method that aggregates mutational information [5] and show that our per-patient approach readily outperforms it.
Methods
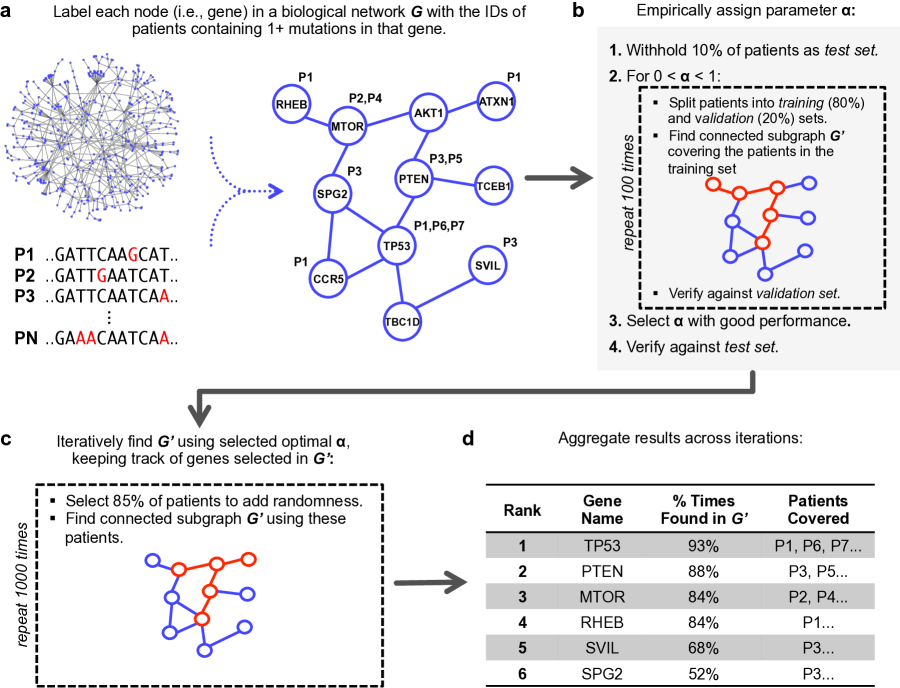
Overview. In this section, we give an overview of our methodology (see also Supplementary Figure 1); each part is described in more detail in the subsequent sections.
The biological network is modeled as an undirected graph where each vertex represents a gene, and there is an edge between two vertices if an interaction has been found between the corresponding proteins. We annotate each node in the network with the IDs of the individuals having one or more mutations in the corresponding gene. Our goal is to find a relatively small connected component such that most patients have mutations in one of the genes within it. A small subgraph is more likely to consist of functionally related genes and is less likely to be the result of overfitting to the set of individuals whose diseases we are analyzing. However, we would also like our model to have the greatest possible explanatory power—that is, to account for, or cover, as many patients as possible by including genes that are mutated within their cancers. We formulate our problem to balance these two competing objectives with a parameter that controls the trade-off between keeping the subgraph small and covering more patients.
For a fixed value of , we have developed two approaches to solve the underlying optimization problem. One is based on linear programming and the other is a fast greedy heuristic (see below). We use the greedy heuristic in the context of a carefully designed cross-validation procedure to automatically select a value for that results in good coverage of patients but avoids overfitting to them. Once is selected, this value is used within our objective function and we next analyze the entire patient cohort. In particular, multiple independent trials using are run on randomly chosen subsets of the patient data, as we have found that introducing a little bit of randomness helps increase performance as compared to a single run on the full data set. Each trial outputs a subgraph, and our final aggregated output is an ordered list of candidate genes ranked by how frequently each has been selected over the trials.
General formulation. Each vertex is associated with a set containing the IDs of the individuals who have somatic mutations in the corresponding gene. A patient with ID is covered if , and uncovered otherwise. We formulate our problem as that of finding a connected subgraph of so as to minimize
where is the fraction of patients that do not have an alteration in a gene included in (i.e., they are uncovered), is the size of the subgraph, and is a fixed parameter controlling the trade-off between keeping the subgraph small and covering more patients. We note that our problem is similar, though not identical, to the Minimum Connected Set Cover Problem [31], a NP-hard problem.
A simple and natural measure for the size of a subnetwork is its number of nodes (i.e., ). However, longer genes may tend to acquire more mutations simply by chance. We correct for that by associating with each node a weight that is equal to the ratio of the length of the gene to the total number of mutations it has. The size of the subcomponent is then defined as . This way, genes having longer length will be weighted more, correcting for a possible bias towards selecting longer genes. We note that since our objective function balances the fraction of uncovered patients with the size of the graph, we would like the size of the graph to be between 0 and 1; thus, we normalize each node weight by dividing by the unnormalized size of what we call a fully covering subgraph —a connected subgraph of that covers all patients. (In practice, we compute using the greedy heuristic described below, with ).
Integer linear programming formulation. The problem of finding a minimum connected subgraph that covers as many patients as possible can be solved using constraint optimization. Let be the number of patients in our sample. For each patient , we define a binary variable that is set to 1 if patient is covered by the chosen subgraph , and 0 otherwise. For each vertex (or gene) , we define a binary variable that is set to 1 if the vertex is included in the chosen subgraph , and 0 otherwise. It is straightforward to set up constraints to ensure that a patient is considered uncovered if none of its mutated genes are part of , and covered if at least one of its mutated genes is selected as part of (see Equations (1) and (2) below).
The challenging part of the ILP is setting up constraints to ensure that the chosen nodes form a connected subgraph . For this task, we employ a flow of commodity technique [11], which we now briefly describe. We inject units of flow into (i.e., we inject units of “flow” into a vertex that is included in the chosen subnetwork). Flow can move from one vertex to any of its neighbors in the network, and each vertex removes exactly one unit of flow as the flow passes through it. All flow must be removed from the subnetwork, and we set the constraints so that this is possible only if the subnetwork is connected. For the source of the flow we use an artificial external node . The main issue is that we do not know which node should be connected to, as we do not know the nodes of in advance. To resolve this, we decide that connects to the node that covers the largest number of patients ; this is equivalent to determining in advance that , though as an alternate approach we could also decide to choose this node probabilistically and run the ILP several times. Finally, to handle the flow constraints, for each edge , we introduce integer variables and to represent the amount of flow from node to node and from node to node , respectively. The full integer linear program is:
minimize
subject to
| (1) | |||||
| for each patient | (2) | ||||
| for each vertex | (3) | ||||
| for each vertex | (4) | ||||
| (5) | |||||
| for all such variables | (6) | ||||
Equation (1) ensures that a patient is considered covered if one of his or her or somatically mutated genes is included in . Equation (2) ensures that a patient is not considered covered if none of his or her somatically mutated genes is chosen to be part of the subgraph. Equations (3), (4) and (5) enforce the connectivity requirement. Equation (3) requires that the flow going out of each vertex in the chosen subnetwork is 1 less than the flow coming in. Equation (4) requires that if a vertex is not part of the chosen subgraph, the flow going through it is 0. Equation (5) sets the amount of flow injected into the subgraph to be equal to the number of chosen nodes.
Greedy heuristic. Solving the ILP yields an exact solution but is computationally difficult. Thus, we have also developed an efficient greedy heuristic. Our heuristic procedure initializes by randomly choosing the first gene from among the five most mutated genes, with probability proportional to the number of patients it is found mutated in. It then expands the subgraph iteratively as follows. At each iteration, all vertices that are at most distance 2 from a vertex in are examined and the one that improves the objective function the most is chosen; any ties are broken uniformly at random. If this vertex is not directly adjacent to the nodes in the subnetwork, the intermediary node is also added. The heuristic terminates when no improvement to the objective is possible. We repeat this heuristic multiple times, as it is probabilistic.
In practice, the greedy heuristic finds a solution that is on average 90% of the best value for the objective function as determined by the ILP formulation using CPLEX [19]. For example, on the glioblastoma dataset of 277 individuals, the ILP finds 61 genes covering 90% of the patients when using =0.5. In comparison, for this value of , the greedy heuristic finds on average 66 genes covering 88% of the patients. In the rest of the paper, we use the greedy optimization as it has comparable performance to the ILP, while being much faster.
Parameter selection and solution aggregation. Our approach to uncover a subnetwork of mutated genes that covers many patients has a single parameter, . Large values of result in a larger number of selected genes that cover more patients, yet may contain more irrelevant genes; this may especially be a factor in the current analysis if there are many samples where missense mutations are not the driving event. We devised a simple but effective data-driven cross-validation technique to choose an appropriate for a set of cancer samples. In particular, we split our samples into training, validation and test sets [16]. A test set of (10%) of the patients is completely withheld. While varying in small increments in the interval , the remaining data is repeatedly split (100 times for each value of ) into training (80%) and validation (20%) sets. For each split, the greedy heuristic algorithm is run on the training set to find . The fractions of patients covered (by the selected ) in the training and validation sets are compared. The parameter is selected where performance on the validation sets deviates as compared to the training sets. While this can be done visually, for all results reported here we do this automatically using a simple two-rule procedure that selects the smallest for which the difference in average coverage between the training and validation set exceeds and for which average performance on the validation set is within from the maximum observed one for any . Finally, the coverage of patients on the (completely withheld) test set is computed to ensure it is similar to the one on the validation set.
Once is chosen for a set of cancer samples, we repeatedly (1000 times) run the algorithm on this set, each time withholding a fraction () of the patients in order to introduce some randomness in the process. Genes are then ranked by the number of times they appear in . In practice, we have found that this improves performance as compared to running the algorithm once on the full data set.
Data sources and pre-processing. We downloaded all level 3 cancer somatic mutation data from The Cancer Genome Atlas (TCGA) [35] that was available as of October 1, 2014. This data consists of a total of 19,460 genes with somatic point mutations across 24 cancer types. For each cancer, samples that are obvious outliers with respect to their total number of mutated genes are excluded. See Supplementary Table 1 for a list of the cancer types, the cancer-specific thresholds to determine outlier samples, the number of patient samples considered for each cancer type, and other statistics about the TCGA somatic mutation dataset.
We use two different biological networks in our analysis: HPRD [30] (Release 9_041310) and BioGrid (Release 3.2.99, physical interactions only) [33]. Biological networks can exhibit several nodes with very high connectivity, often due to study bias. As such high connectivity destroys the usefulness of the network information, we remove all nodes whose degrees are clear outliers. For BioGrid, this removes UBC, APP, ELAVL1, SUMO2, CUL3. For HPRD, this removes no nodes. For both networks, we exclude the nine longest genes (TTN, MUC16, SYNE1, NEB, MUC19, CCDC168, FSIP2, OBSCN, GPR98) as they tend to acquire numerous mutations by chance while covering many patients.
To further handle the connectivity arising within the networks due to high-degree nodes, we filter edges using the diffusion state distance (DSD) metric introduced in [3]; the DSD metric captures the intuition that edges between nodes that also share interactions with low degree nodes are more likely to be functionally meaningful than edges that do not (and thus are assigned closer distances). For each edge, the DSD scores (as computed by the software of [3]) between the corresponding nodes are Z-score normalized, and edges with Z-scores are removed. We note that the overall performance of our approach improves when performing this filtering (data not shown), supporting the claim of [3] that preprocessing a biological network in this manner is an important step. The final number of nodes and edges, respectively, for the filtered networks are 9,379 and 36,638 for HPRD; and 14,326 and 102,552 for BioGrid.
Other approaches. To ascertain the contribution of network information, we compare nCOP to two approaches that do not use network information: (1) MutSigCV 2.0 [25], a state-of-the-art method that identifies genes that are mutated more frequently than expected according to a background model, and (2) a set cover approach that tries to find mutated genes that simply cover as many patients as possible. We formulate the set cover approach as an ILP that tries to find a good cover consisting of vertices. Using the same notation as for nCOP, the set cover objective is to maximize , subject to Equations (1) and (2) of nCOP, and with the additional constraints that and . We also compare nCOP to HOTNET2 [26] and Muffinn [5], two recent network-based approaches that aggregate mutational information. All comparisons are made when running on exactly the same cancer and (if used) network data. MutSigCV 2.0, Hotnet2 and Muffinn are run with default parameters.
Performance evaluation. To evaluate the gene rankings of all the tested methods, we use the curated list of 517 cancer census genes (CCGs) available from COSMIC [13]. All genes in this list are considered as positives, and all other genes are considered as negatives. Though we expect that there are genes other than those already on the CCG list that play a role in cancer, this is a standard approach to judge performance (e.g.,see [20]) and gives us an idea of how methods are performing as cancer genes should be highly ranked by methods that perform well. Since only the top predictions by any method are relevant for cancer gene discovery, we judge performance by computing the area under the precision-recall curve (AUPRC) using the top 100 genes predicted by each method. If a method returns less than 100 genes, we extend the precision-recall curve to 100 genes assuming that it performs as a random classifier. We note that reasonable changes to the number of predictions considered does not change our overall conclusions (data not shown).
Results
We run nCOP, using the greedy heuristic algorithm, on somatic point mutation data from 24 different TCGA cancer types. Results in the main paper use the HPRD network [30] for all analysis and show some results using kidney renal clear cell carcinoma (KIRC) with 416 samples as an examplar.
Increasing patient coverage while preventing overfitting. We first demonstrate that, across the 24 cancer types, our training-validation-test set framework is a highly effective approach for choosing an that balances patient coverage with subnetwork size. For all cancers, when using somatic missense mutation data, as increases, the total number of genes in the chosen subnetwork increases (as expected), as does the fraction of patients in the training set that are covered by these genes (Figure 1a and Supplementary Figure S2). For smaller values of , coverage on the validation sets closely matches that obtained on the training sets; that is, the sets of genes chosen using patients in the training sets are also effective in covering patients in the corresponding validation sets. For KIRC, when , genes chosen using the training sets cover on average nearly 70% of patients in the corresponding validation sets. The fact that a small subnetwork can be found that covers a large fraction of previously unseen patients is consistent with the hypothesis that a shared pathway or process plays a role in most (but not all) of these patients’ cancers.
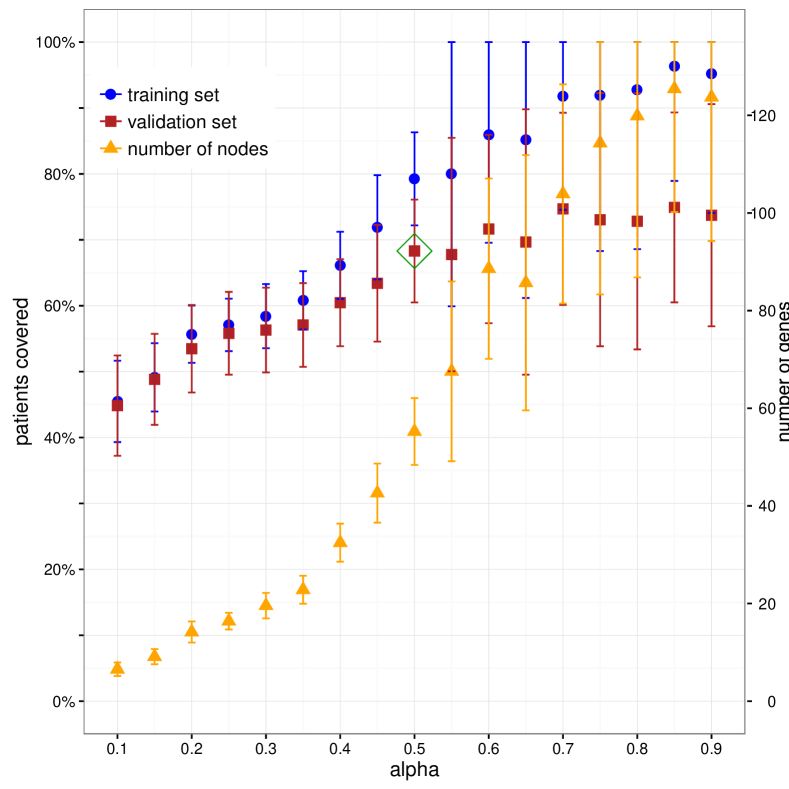
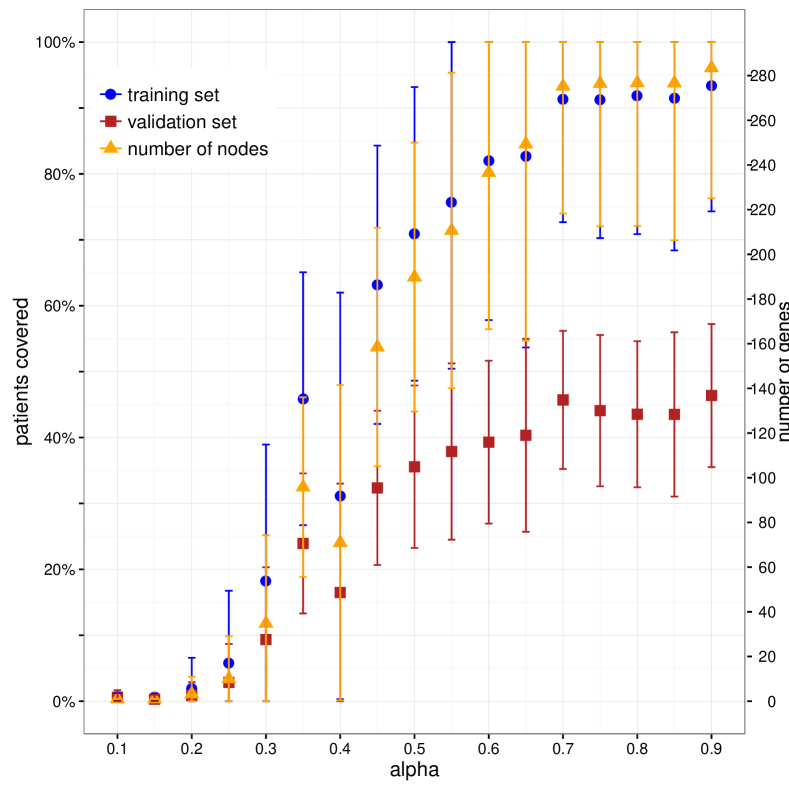
For larger values of ( for KIRC), however, coverage on the validation sets lags behind that observed on the training sets. For even larger values of ( for KIRC), the algorithm selects many genes, and eventually increases the coverage for most cancers on the training sets to nearly 100%. However, larger values of do not substantially increase coverage of the withheld patients. This difference between the training and validation curves captures the overfitting of the model and also illustrates the trade-off between covering more patients and keeping the solution parsimonious. We note that the eventual plateau of the validation curve is consistent across cancer types (Supplementary Figure S2) and on different networks (data not shown). For each cancer type, values of are selected by our automated procedure (see Methods); this value is for the KIRC dataset shown in Figure 2a.
As a control, we repeat the same procedure using only synonymous mutations (Figure 1b). We observe that the coverage on the validation sets is much poorer. Though coverage of course increases as more nodes are added, it never exceeds even when is increased to or when we have nearly perfect coverage on the training set, despite adding many more nodes. This poor performance is consistent with the expectation that synonymous mutations do not result in altered protein sequences and do not disturb cellular pathways. Hence, given the differences observed between using missense versus silent mutation data when varying settings for and comparing training and validation sets, our formulation appears to be well-suited for extracting cancer-relevant information from mutational profiles and interaction networks.
nCOP effectively uses network information to uncover known cancer genes. Having shown in the previous section how to select a value for the only parameter in the model and having demonstrated that our formulation is effective in choosing genes that are mutated in previously unobserved patient samples, we next evaluate nCOP’s performance in predicting cancer genes.
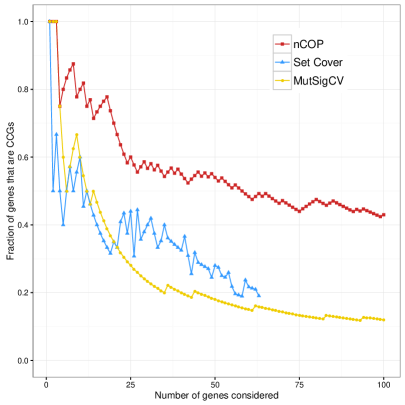
We first consider how well nCOP recapitulates known cancer genes (CCGs) [12]. We find that on KIRC, our top predictions include a high fraction of CCG genes (Figure 2). For example, genes that are always output are VHL, PTEN, and BAP1, three well-known cancer genes. Other known cancer genes such as JUN, BLM and ARID1A, are also highly ranked.
We next illustrate the power of our network-based method by comparing its performance on the KIRC data set to approaches that do not consider network information (Figure 2). First, we consider a set cover version of our approach that does not use network information at all. We find that for the same number of predicted genes, our approach consistently has a larger fraction of CCGs, demonstrating the advantage of using network information. We also considerably outperform a state-of-the-art frequency-based approach, MutSigCV 2.0 [25].
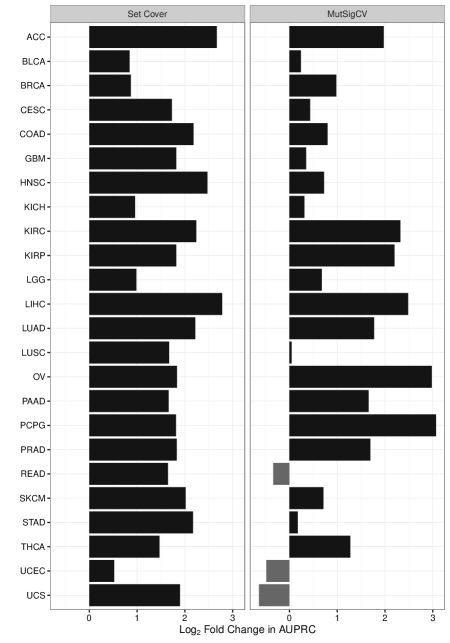
We next compare nCOP to these two non-network approaches across all 24 cancer types. In particular, we compute the ratio of the area under the precision recall curve (AUPRC) of our approach versus each of the other approaches on each cancer type (Figure 3). We outperform MutSigCV 2.0 in 21 of the 24 cancers and the set cover approach in all cancers, demonstrating the clear advantage of using network information; the performance improvement of nCOP over the set cover approach is particularly notable as the main difference of these approaches is the additional use of network information by nCOP. In several cancers, the performance improvements of nCOP are substantial. For example, nCOP shows a four-fold improvement over MutSigCV 2.0 in predicting cancer genes for liver hepatocellular carcinoma (LIHC) and a nearly eight-fold improvement over MutSigCV 2.0 on pheochromocytoma and paraganglioma (PCPG). Importantly, nCOP uncovers rarely mutated CCGs genes that network-agnostic methods fail to. For instance, KLF6 and TCF7L2, mutated respectively in only one and two individuals in LIHC, and WT1, mutated in two individuals in PCPG, are all uncovered by nCOP because of their proximity to other mutated genes in the network. In contrast, frequency-driven MutSigCV 2.0 and network-agnostic set cover both fail to uncover these CCG genes. We note that the suboptimal performance of nCOP in the case of uterine carcinosarcoma (UCS) is due to the fact that for this particular data set, two genes TP53 and FBXW7 cover of the patients, with only four genes being sufficient to cover of the patients. This renders nCOP incapable to effectively leverage network information as it returns only four genes. Nevertheless, the overall superior performance of nCOP as compared to these two non-network based approaches on the vast majority of cancers demonstrates its considerable power.
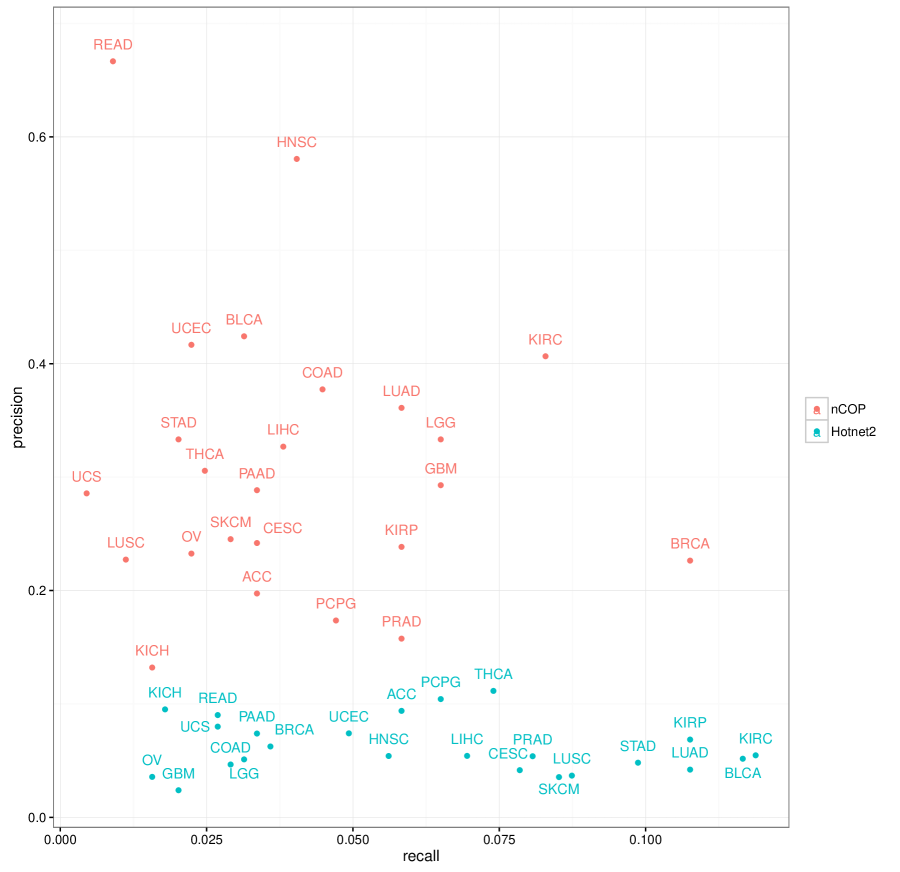
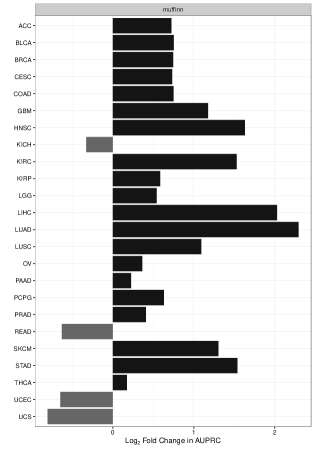
Having shown that nCOP better identifies cancer-relevant genes than two approaches that do not use network information, we next consider whether the specific way in which nCOP uses network information is beneficial. Towards this end, we compare the effectiveness of nCOP in uncovering cancer genes to Muffinn [5], a method published within the last year that considers mutations found in interacting genes. We find that in 20 out of the 24 cancer types, nCOP outperforms Muffinn (Figure 4). We also compare nCOP to Hotnet2 [26], a cutting-edge network diffusion method. As Hotnet2 does not output a ranked list of genes, we could not compute the area under the precision recall curve. Instead, examining the complete list of genes highlighted by both methods, we observe that nCOP exhibits significantly better precision while trailing slightly in recall (Supplementary Figure S3).
nCOP reveals novel genes, including those that are rarely mutated. In addition to ranking known cancer genes highly, nCOP also gives high ranks to several non-CCG genes that may or may not be implicated in cancer, as our knowledge of cancer-related genes is incomplete. We observe that non-CCG that are highly ranked by nCOP tend to be less frequently mutated. For example, among these novel predictions for KIRC are SALL1, NR5A2, and UBE2A which have all recently been implicated to play a role in cancers [43, 27, 45].
When we consider the proteins output by our procedure in at least half the runs for KIRC, we find that they are enriched in many KEGG and GO pathways relevant for cancer, including MicroRNAs in cancer, Choline metabolism in cancer, Central carbon metabolism in cancer and PI3K-Akt signaling pathway (Bonferroni-corrected , hypergeometric test). When we remove all known CCG genes and consider only new predictions, thus performing a much harder test, only one pathway, Thyroid hormone signaling pathway, is enriched. Interestingly, it has been shown that thyroid hormones play a role in kidney growth and development [22] and four of our non-CCG predictions are part of that pathway, together with four known cancer genes. Interestingly, two of the non-CCG genes we find in this pathway are rarely mutated, and are not highlighted by MutSigCV 2.0 or set cover. This illustrates the power of nCOP to zoom in on potentially cancer-relevant modules consisting of rarely mutated genes.
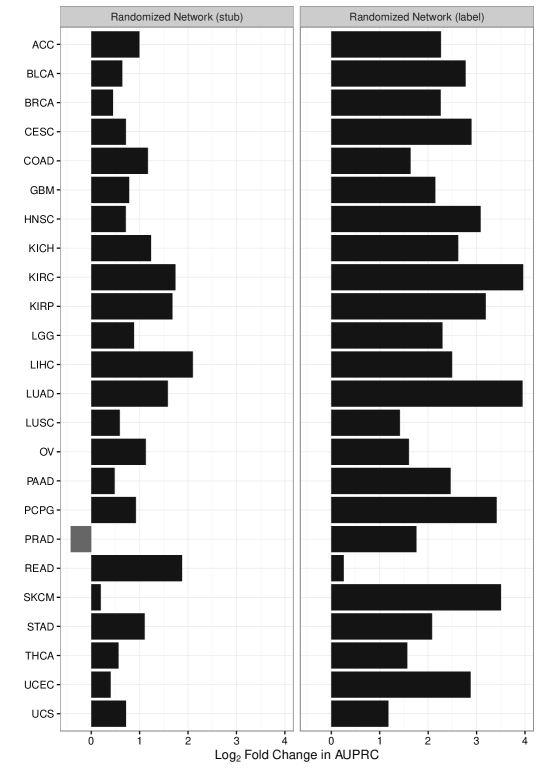
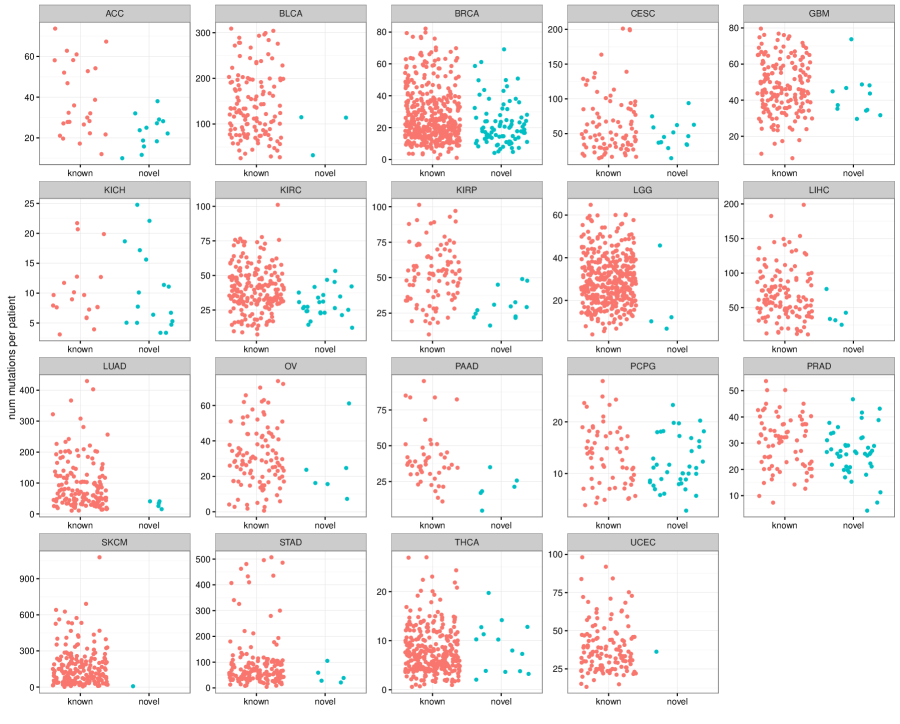
Potential biases, performance on randomized data, and robustness. Due to space and time constraints, we briefly describe some additional tests we performed to show that nCOP is robust and well-behaved. First, we have tested nCOP on another network and have shown that it remains effective in identifying CCGs (Supplementary Figures S4). Second, to confirm the importance of network structure to nCOP, we have run nCOP on two types of randomized networks, degree-preserving and label shuffling, and have shown that (as expected) overall performance deteriorates across the cancer types (Supplementary Figure S5); we note that though network structure is destroyed, per-gene mutational information is perserved, and so highly mutated genes are still output. Third, to make sure that the novel genes we uncover are not driven by patients with large numbers of passenger mutations (i.e., that the novel genes are not likely to be passenger genes), we have compared the overall number of mutations for patients having missense mutations only in CCG genes but not in any predicted non-CCG (or novel) genes to the total number of such mutations for patients having missense mutations only in novel genes but not in any CCG genes (Supplementary Figure S6), and have found that patients with only mutations in novel genes do not harbor more mutations. Finally, to make sure that genes are not more likely to be picked because they have higher degree, we have confirmed that newly predicted do not tend to exhibit higher degree than known cancer genes; indeed, among all novel genes found across all cancer types, most have degree between , and there are only a couple with high degree ().
Discussion
In this paper, we have shown that nCOP, a method that incorporates individual mutational profiles with protein–protein interaction networks, is a powerful approach for uncovering cancer genes. Our method is based on an intuitive mathematical formulation and demonstrates higher precision than other state-of-the-art methods in detecting known cancer genes. Further, our approach is particularly beneficial in highlighting infrequently mutated genes that are nevertheless relevant for cancer. Our approach therefore complements existing frequency-based methods (e.g., [25]) that generally rely on comparisons to background mutational models and lack the statistical power to detect genes mutated in fewer individuals.
In the future, nCOP can be extended in a number of natural ways. First, while nCOP currently analyzes only mutations within genes that affect protein coding, other alterations are also commonly observed in cancers. For example, copy number variants (CNVs) are found frequently in cancers and can play critical functional roles [46]. Although nCOP does not currently use CNV information, our framework can be extended to incorporate this data. Indeed, as the numbers of CNVs and point mutations found within each cancer genome appear to be inversely related [8], considering both types of alterations will increase the power of our approach. Second, nCOP may also benefit from incorporating gene weights that reflect its likelihood to play a role in cancer; in our current work, we consider a gene’s length but no other gene-specific attributes are considered. Such gene weights may be derived from existing approaches to detect frequency of mutation or to assess the functional impact of mutations. Finally, while nCOP can output groups of genes that are not part of a single connected component due to our randomized aggregation procedure, extending nCOP’s core algorithms to explicitly consider multiple subnetworks corresponding to distinct pathways may be a particularly promising avenue for future work.
We conclude by noting that researchers can use our framework to rapidly and easily prioritize cancer genes, as nCOP requires only straightforward inputs and runs on a desktop machine. Indeed, nCOP’s efficiency, robustness, and ease of use make it an excellent choice to investigate cancer as well as possibly other complex diseases. As sequencing costs plummet and cancer and other disease sequencing mutational data become more abundant, the predictive power of our method should only increase. In sum, we expect that our method nCOP will be of broad utility, and will represent a valuable resource for the cancer community.
References
- Babaei et al. [2013] S. Babaei, M. Hulsman, M. Reinders, and J. de Ridder. Detecting recurrent gene mutation in interaction network context using multi-scale graph diffusion. BMC Bioinformatics, 14:29, 2013.
- Bozic et al. [2010] I. Bozic, T. Antal, H. Ohtsuki, H. Carter, D. Kim, S. Chen, R. Karchin, K. W. Kinzler, B. Vogelstein, and M. A. Nowak. Accumulation of driver and passenger mutations during tumor progression. Proc Natl Acad Sci U S A, 107(43):18545–50, 2010.
- Cao et al. [2013] M. Cao, H. Zhang, J. Park, N. M. Daniels, M. E. Crovella, L. J. Cowen, and B. Hescott. Going the distance for protein function prediction: a new distance metric for protein interaction networks. PloS one, 8(10):e76339, 2013.
- Cerami et al. [2010] E. Cerami, E. Demir, N. Schultz, B. S. Taylor, and C. Sander. Automated network analysis identifies core pathways in glioblastoma. PLoS ONE, 5(2):e8918, 2010.
- Cho et al. [2016] A. Cho, J. E. Shim, E. Kim, F. Supek, B. Lehner, and I. Lee. Muffinn: cancer gene discovery via network analysis of somatic mutation data. Genome Biology, 17(1):129, 2016.
- Chowdhury and Koyuturk [2010] S. Chowdhury and M. Koyuturk. Identification of coordinately dysregulated subnetworks in complex phenotypes. In Pac Symp Biocomput, pages 133––144, 2010.
- Ciriello et al. [2012] G. Ciriello, E. Cerami, C. Sander, and N. Schultz. Mutual exclusivity analysis identifies oncogenic network modules. Genome Res., 22(2):398–406, Feb 2012.
- Ciriello et al. [2013] G. Ciriello, M. Miller, B. Aksoy, Y. Senbabaoglu, N. Schultz, and C. Sander. Emerging landscape of oncogenic signatures across human cancers. Nature Genetics, 45:1127–1133, 2013.
- Dand et al. [2013] N. Dand, F. Sprengel, V. Ahlers, and T. Schlitt. BioGranat-IG: a network analysis tool to suggest mechanisms of genetic heterogeneity from exome-sequencing data. Bioinformatics, 29(6):733–741, 2013.
- Dees et al. [2012] N. Dees, Q. Zhang, C. Kandoth, M. Wendl, W. Schierding, D. Koboldt, et al. MuSiC: Identifying mutational significance in cancer genomes. Genome Res., 22:1589––1598, 2012.
- Even and Tarjan [1975] S. Even and R. E. Tarjan. Network flow and testing graph connectivity. SIAM journal on computing, 4(4):507–518, 1975.
- Forbes et al. [2010] S. A. Forbes, N. Bindal, S. Bamford, C. Cole, C. Y. Kok, D. Beare, M. Jia, R. Shepherd, K. Leung, A. Menzies, et al. Cosmic: mining complete cancer genomes in the catalogue of somatic mutations in cancer. Nucleic acids research, page gkq929, 2010.
- Futreal et al. [2004] P. A. Futreal, L. Coin, M. Marshall, T. Down, T. Hubbard, R. Wooster, N. Rahman, and M. R. Stratton. A census of human cancer genes. Nat Rev Cancer, 4(3):177–83, 2004.
- Garraway and Lander [2013] L. A. Garraway and E. S. Lander. Lessons from the cancer genome. Cell, 153(1):17–37, 2013.
- Hartwell et al. [1999] L. Hartwell, J. Hopfield, S. Leibler, and A. Murray. From molecular to modular cell biology. Nature, 402:C47–52, 1999.
- Hastie et al. [2009] T. Hastie, R. Tibshirani, J. Friedman, T. Hastie, J. Friedman, and R. Tibshirani. The elements of statistical learning, volume 2. Springer, 2009.
- Hofree et al. [2013] M. Hofree, J. P. Shen, H. Carter, A. Gross, and T. Ideker. Network-based stratification of tumor mutations. Nature methods, 2013.
- Hudson et al. [2010] T. J. Hudson, W. Anderson, A. Aretz, A. D. Barker, C. Bell, R. R. Bernabé, M. Bhan, F. Calvo, I. Eerola, D. S. Gerhard, et al. International network of cancer genome projects. Nature, 464(7291):993–998, 2010.
- [19] ILOG CPLEX. ILOG CPLEX 7.1, 2016. http://www.ilog.com/products/cplex/.
- Jia and Zhao [2014] P. Jia and Z. Zhao. Varwalker: personalized mutation network analysis of putative cancer genes from next-generation sequencing data. PLoS Comput Biol, 10(2):e1003460, 2014.
- Jones et al. [2008] S. Jones, X. Zhang, D. W. Parsons, J. C.-H. Lin, R. J. Leary, P. Angenendt, P. Mankoo, H. Carter, H. Kamiyama, A. Jimeno, et al. Core signaling pathways in human pancreatic cancers revealed by global genomic analyses. Science Signaling, 321(5897):1801, 2008.
- Katz et al. [1975] A. Katz, D. Emmanouel, and M. Lindheimer. Thyroid hormone and the kidney. Nephron, 15(3-5):223–249, 1975.
- Kim et al. [2011] Y. Kim, S. Wuchty, and T. Przytycka. Identifying causal genes and dysregulated pathways in complex diseases. PLoS Comput Biol, 7:e1001095, 2011.
- Kim et al. [2015] Y.-A. Kim, D.-Y. Cho, P. Dao, and T. M. Przytycka. Memcover: integrated analysis of mutual exclusivity and functional network reveals dysregulated pathways across multiple cancer types. Bioinformatics, 31(12):i284–i292, 2015.
- Lawrence et al. [2013] M. S. Lawrence, P. Stojanov, P. Polak, G. V. Kryukov, K. Cibulskis, A. Sivachenko, S. L. Carter, C. Stewart, C. H. Mermel, S. A. Roberts, et al. Mutational heterogeneity in cancer and the search for new cancer-associated genes. Nature, 499(7457):214–218, 2013.
- Leiserson et al. [2015] M. D. M. Leiserson, F. Vandin, H.-T. Wu, J. R. Dobson, J. V. Eldridge, J. L. Thomas, A. Papoutsaki, Y. Kim, B. Niu, M. McLellan, M. S. Lawrence, A. Gonzalez-Perez, D. Tamborero, Y. Cheng, G. A. Ryslik, N. Lopez-Bigas, G. Getz, L. Ding, and B. J. Raphael. Pan-cancer network analysis identifies combinations of rare somatic mutations across pathways and protein complexes. Nature Genetics, 47:106–114, 2015.
- Lin et al. [2014] Q. Lin, A. Aihara, W. Chung, Y. Li, Z. Huang, X. Chen, S. Weng, R. I. Carlson, J. R. Wands, and X. Dong. Lrh1 as a driving factor in pancreatic cancer growth. Cancer letters, 345(1):85–90, 2014.
- McLendon et al. [2008] R. McLendon, A. Friedman, D. Bigner, E. G. Van Meir, D. J. Brat, G. M. Mastrogianakis, J. J. Olson, T. Mikkelsen, N. Lehman, K. Aldape, et al. Comprehensive genomic characterization defines human glioblastoma genes and core pathways. Nature, 455(7216):1061–1068, 2008.
- Paull et al. [2013] E. O. Paull, D. E. Carlin, M. Niepel, P. K. Sorger, D. Haussler, and J. M. Stuart. Discovering causal pathways linking genomic events to transcriptional states using Tied Diffusion Through Interacting Events (TieDIE). Bioinformatics, 29(21):2757–2764, Nov 2013.
- Prasad et al. [2009] T. K. Prasad, R. Goel, K. Kandasamy, S. Keerthikumar, S. Kumar, S. Mathivanan, D. Telikicherla, R. Raju, B. Shafreen, A. Venugopal, et al. Human protein reference database—2009 update. Nucleic acids research, 37(suppl 1):D767–D772, 2009.
- Shuai and Hu [2006] T.-P. Shuai and X.-D. Hu. Connected set cover problem and its applications. In International Conference on Algorithmic Applications in Management, pages 243–254. Springer, 2006.
- Spirin and Mirny [2003] V. Spirin and L. A. Mirny. Protein complexes and functional modules in molecular networks. Proc. Natl. Acad. Sci. USA., 100:12123–12128, 2003.
- Stark et al. [2006] C. Stark, B.-J. Breitkreutz, T. Reguly, L. Boucher, A. Breitkreutz, and M. Tyers. Biogrid: a general repository for interaction datasets. Nucleic acids research, 34(suppl 1):D535–D539, 2006.
- Stratton et al. [2009] M. R. Stratton, P. J. Campbell, and P. A. Futreal. The cancer genome. Nature, 458(7239):719–24, 2009.
- [35] TCGA Research Network:. http://cancergenome.nih.gov/.
- The Cancer Genome Atlas Network [2012] The Cancer Genome Atlas Network. Comprehensive molecular characterization of human colon and rectal cancer. Nature, 487:330–337, 2012.
- The International Cancer Genome Consortium [2010] The International Cancer Genome Consortium. International network of cancer genome projects. Nature, 464:993–998, 2010.
- Ulitsky et al. [2010] I. Ulitsky, A. Krishnamurthy, R. M. Karp, and R. Shamir. Degas: de novo discovery of dysregulated pathways in human diseases. PLoS one, 5(10):e13367, 2010.
- Vandin et al. [2011] F. Vandin, E. Upfal, and B. J. Raphael. Algorithms for detecting significantly mutated pathways in cancer. Journal of Computational Biology, 18(3):507–522, 2011.
- Vaske et al. [2010] C. J. Vaske, S. C. Benz, J. Z. Sanborn, D. Earl, C. Szeto, J. Zhu, D. Haussler, and J. M. Stuart. Inference of patient-specific pathway activities from multi-dimensional cancer genomics data using PARADIGM. Bioinformatics, 26(12):i237–245, Jun 2010.
- Vogelstein et al. [2013] B. Vogelstein, N. Papadopoulos, V. E. Velculescu, S. Zhou, J. Diaz, L. A., and K. W. Kinzler. Cancer genome landscapes. Science, 339(6127):1546–58, 2013.
- Wendl et al. [2011] M. C. Wendl, J. W. Wallis, L. Lin, C. Kandoth, E. R. Mardis, R. K. Wilson, and L. Ding. PathScan: a tool for discerning mutational significance in groups of putative cancer genes. Bioinformatics, 27(12):1595–1602, Jun 2011.
- Wolf et al. [2014] J. Wolf, K. Müller-Decker, C. Flechtenmacher, F. Zhang, M. Shahmoradgoli, G. Mills, J. Hoheisel, and M. Boettcher. An in vivo rnai screen identifies sall1 as a tumor suppressor in human breast cancer with a role in cdh1 regulation. Oncogene, 33(33):4273–4278, 2014.
- Youn and Simon [2011] A. Youn and R. Simon. Identifying cancer driver genes in tumor genome sequencing studies. Bioinformatics, 27(2), 2011.
- Yu et al. [2016] X. Yu, Z. Li, and J. Shen. Brd7: a novel tumor suppressor gene in different cancers. American journal of translational research, 8(2):742, 2016.
- Zack et al. [2013] T. I. Zack, S. E. Schumacher, S. L. Carter, A. D. Cherniack, G. Saksena, B. Tabak, et al. Pan-cancer patterns of somatic copy number alteration. Nat. Genet., 45(10):1134–1140, Oct 2013.
Supplementary Tables and Figures
The following pages contain a table summarizing the TCGA data we use along with 6 supplementary figures that support the findings of the main paper.
![[Uncaptioned image]](/html/1704.08544/assets/x6.png)
![[Uncaptioned image]](/html/1704.08544/assets/x8.png)
![[Uncaptioned image]](/html/1704.08544/assets/x9.png)