Properties of Strong and Weak Propellers from MHD Simulations
Abstract
We investigate the properties of magnetized stars in the propeller regime using axisymmetric numerical simulations. We were able to model the propeller regime for stars with realistically large magnetospheres ( stellar radii) and relatively thin accretion disks, , so that our results could be applied to different types of magnetized stars, including Classical T Tauri stars (CTTSs), cataclysmic variables (CVs), and accreting millisecond pulsars (MSPs). A wide range of propeller strengths has been studied, from very strong propellers (where the magnetosphere rotates much more rapidly than the inner disk and most of the inner disc matter is redirected into the wind) to very weak propellers (where the magnetosphere rotates only slightly faster than the inner disc, and only a small part of the inner disc matter is redirected into the wind). In both the strong and weak propellers, matter is accumulated at the inner disc for the majority of the time, while episodes of accretion onto the star and ejection into the wind are relatively brief. The efficiency of the propeller, which characterizes the part of inner disk matter flowing into the wind, strongly depends on the fastness parameter , which is the ratio of the stellar angular velocity to the inner disc Keplerian velocity: propeller efficiency increases with . The properties of the winds are different in strong and weak propellers. In the strong propellers, matter is accelerated rapidly above the escape velocity and flows at a relatively small opening angle of degrees. This matter leaves the system, forming the large-scale outflows. In the weak propellers (during episodes of ejection into the wind), matter may flow faster or slower than the escape velocity and at a large opening angle of degrees. Most of this matter is expected to either fall back to the disk or form a magnetic turbulent corona above the disk. A star-disk system loses energy and angular momentum. A part of the rotational energy of the star is ejected to the magnetically-dominated (Poynting flux) jet, which is only present in the strong propellers. The other part of the energy flows from the inner disk into a propeller-driven wind. A star spins down partly due to the flow of angular momentum from the star to the corona (in weak propellers) or to the Poynting flux jet (in strong propellers) along the open field lines, and partly due to the flow of angular momentum to the inner disk along the closed field lines.
keywords:
accretion; accretion disks; MHD; stars: neutron; stars: magnetic; magnetohydrodynamics1 Introduction
Different magnetized stars are expected to be in the propeller regime if the magnetosphere rotates more rapidly than the inner disk (e.g., Illarionov & Sunyaev 1975; Lovelace et al. 1999). This regime is expected, e.g., when the accretion rate decreases and the magnetosphere expands. If the inner disk matter penetrates through the magnetosphere, then it acquires angular momentum and can be ejected from the disk-magnetosphere boundary in the form of a wind. Signs of the propeller regime have been observed in Classical T Tauri stars (CTTSs) (e.g., Donati et al. 2010; Grinin et al. 2015; Cody et al. 2017), in cataclysmic variable AE Aqr (e.g., Mauche 2006; Wynn et al. 1997), and in a few accreting millisecond pulsars (MSPs) at the ends of their outbursts, when the accretion rate decreases and the disk moves away from the star (e.g., van der Klis et al. 2000; Patruno et al. 2009; Patruno & D’Angelo 2013; Bult & van der Klis 2014). Recently, transitional millisecond pulsars were discovered, where a millisecond pulsar transits between the state of an accreting MP, where the accretion disk moves close to the star, and that of a radiopulsar, where the accretion disk moves to larger distances from the star (e.g., Papitto et al. 2013; Ferrigno et al. 2014; Linares 2014; Patruno et al. 2014) 111Transitional MSPs were predicted long ago (e.g., Bisnovatyi-Kogan & Komberg 1974; Alpar et al. 1982), but were not discovered until recently.. In these types of stars, the propeller regime is inevitable. In fact, different observational properties of transitional MSPs may possibly be connected with the propeller state, such as the highly variable X-ray radiation (e.g., Ferrigno et al. 2014; Patruno et al. 2014; Archibald et al. 2015), ray flares (e.g., De Martino et al. 2010) and radiation in the radio band with a flat spectrum, which indicates the presence of outflows or jets (e.g., Bogdanov et al. 2015; Deller et al. 2015). Many observational properties of propeller candidate stars were not well-understood, such as the accretion-induced pulsations observed at very low accretion rates in some transitional MSPs and the CV AE Aqr. According to theoretical estimates, at low accretion rates the inner disk should be far away from the star and accretion should be blocked by the centrifugal barrier of the propelling star (e.g., Archibald et al. 2015; Papitto & Torres 2015; Papitto et al. 2015). However, observations show that a small amount of matter accretes in spite of the centrifugal barrier. This and other issues require further understanding, so the propeller regime should be studied in greater detail.
The propeller regime has been studied in a number of theoretical works and numerical simulations. Illarionov & Sunyaev (1975) and Lovelace et al. (1999) investigated the strong propeller regime analytically. They suggested that the propelling star ejects all of the accreting matter into the wind, and no matter accretes onto the star.
In other analytical works and 1D numerical simulations it was suggested that the magnetosphere rotates only slightly faster than the inner disk, that is, the propeller is relatively weak, and there are no outflows (e.g., Sunyaev & Shakura 1977; Spruit & Taam 1993; D’Angelo & Spruit 2010, 2012). In their models, the excess angular momentum is transferred back to the disk, forming a dead disk, and matter of the inner disk accretes onto the star quasi-periodically due to the cyclic process of matter accumulation and accretion.
The propeller regime has been studied in a number of axisymmetric (2.5D) simulations, where a magnetized, rapidly rotating star interacts with an accretion disk (e.g., Romanova et al. 2005; Ustyugova et al. 2006; Lii et al. 2014). Simulations have shown that
-
1.
In the propeller regime, both accretion and outflows are present. Matter accretes onto the star in cycles. For the major part of the cycle, matter accumulates in the inner disk and slowly moves inward. Then, it partially accretes onto the star and is partially ejected into the wind. Subsequently, the magnetosphere expands. Therefore, both accretion and outflows occur in brief episodes (spikes);
-
2.
Accretion onto the star is typically accompanied by outflow of matter from the inner disk. However, the outflows may also be present at other times, such as when accretion is blocked by the centrifugal barrier;
-
3.
In strong propellers, a two-component outflow has been observed: a relatively slow and dense, conically shaped inner disk wind, which carries away most of the inner disk matter, and a low-density, high-velocity collimated jet, which carries away significant energy and angular momentum;
-
4.
A star spins down due to the outward flow of angular momentum along the open and closed field lines.
In earlier models, accretion from laminar disks (Shakura & Sunyaev, 1973) had been considered, where the accretion rate in the disk was regulated by the parameter of viscosity, , while the rate of the field line diffusion through the disk was regulated by a similar parameter, (Romanova et al., 2004, 2005; Ustyugova et al., 2006; Romanova et al., 2009). More recently, simulations were performed for turbulent disks (Lii et al., 2014), where the turbulence is driven by the magneto-rotational instability (MRI, e.g., Balbus & Hawley 1991). Also, in contrast with the earlier works, simulations were performed in both the top and bottom hemispheres (no equatorial symmetry). These simulations show similar results to those obtained with the disks. However, the accretion funnels are not symmetric about the equatorial plane, and the outflows are typically one-sided.
In these earlier studies, only stars with relatively small magnetospheres were modeled (, where is the stellar radius) 222Note that modeling the propeller regime is numerically challenging and time-consuming, because the magnetic and velocity gradients can be large compared with the cases of slowly-rotating stars. It is somewhat easier to model stars with smaller magnetospheres.. However, most of the propeller candidate stars have larger magnetospheres, so the earlier models could only be applied to a limited range of stars. This is why we adjusted the model in such ways as to allow us to model the stars with larger magnetospheres, .
In addition, the earlier numerical simulations were mainly focused on very strong propellers, where the magnetosphere rotates much more rapidly than the inner disk, (e.g., Romanova et al. 2005, 2009). However, propellers of lower strengths have not been systematically studied. Some of the major questions are: (1) What are the properties of outflows in propellers of different strengths? In particular, (2) Which parts of the inner disk matter flow into the winds? (3) What is the velocity of matter in the wind? (4) What is the opening angle of the wind? (5) How much energy flows into the inner disk wind and the Poynting flux jet? (6) What is the rate of stellar spin-down? (7) How do these properties depend on the strength of the propeller ?
To answer these questions, we performed a number of axisymmetric simulations of propellers of different strengths, ranging from very weak propellers to very strong propellers, and studied the properties of matter, energy and angular momentum flow. As a base case, we used a model with a turbulent disk similar to that used by Lii et al. (2014). However, compared with Lii et al. (2014), we (1) took the disk to be a few times thinner, with an aspect ratio of , which is closer to realistic (thin) disks; (2) considered magnetospheres of larger sizes, (compared with in Lii et al. (2014)), so that the model could be applied to propelling stars with larger magnetospheres; (3) suggested that the 3D instabilities are efficient at the disk-magnetosphere boundary and added a diffusivity layer at , where the diffusivity is high. The diffusivity is very low (numerical) in the rest of the disk. 333Note that in Lii et al. (2014) the diffusivity has been very low (numerical) in the entire simulation region, excluding a few test cases where the diffusive layer was added, as in our current simulations (see Appendix in Lii et al. 2014). (4) investigated the properties of propellers of different strengths. Our simulations show that the properties of strong versus weak propellers are qualitatively different, and are expected to provide different observational properties.
The main goal of this new research was to develop a series of models with parameter values similar to those expected in propeller candidate stars, such as transitional millisecond pulsars, intermediate polars, and Classical T Tauri stars. The results of the simulations are presented in dimensionless form and can be applied to all types of stars. We also provide convenient formulae for the conversion of dimensionless values to dimensional values in application to these stars. We plan to apply the results of our models to particular propeller candidate stars in future papers.
The plan of the paper is the following. In Sec. 2 we discuss the theoretical background of the problem. We describe our numerical model in Sec. 3 and show the main results of simulations and analysis in Sec. 3-8. In Sec. 9 we provide examples of applications and convenient formulae for different types of stars. We conclude in Sec. 10. A and B provide the details of the numerical model and the variation of different variables with time for a number of representative models.
2 Theoretical background
For investigation of propellers of different strengths, it is important to find the main parameters which determine the strengths of propellers and which determine the main properties of propellers. In case of slowly-rotating (non-propelling) magnetized stars, such a parameter is the fastness parameter (e.g., Ghosh 2007; Blinova et al. 2016). In the study of the propeller regime, we also use the fastness parameter as the main parameter of the problem.
2.1 Fastness parameter
The fastness parameter is determined as the ratio between the angular velocity of the star and the angular velocity of the inner disk at the disk-magnetosphere boundary (e.g., Ghosh 2007):
| (1) |
where, is the Keplerian angular velocity of the inner disk at .
An importance of the fastness parameter can also be shown through the simplified analysis of forces. In case of a thin (cold) accretion disk, the matter pressure force is small, and the main forces acting on the matter of the inner disk are the gravitational, centrifugal and magnetic forces. In case of strong propellers () the centrifugal force is often the main force driving matter to the outflows (e.g., Romanova et al. 2009; Lii et al. 2014), so that the total force acting to the unit mass of the disk is dominated by the effective gravity:
where and are the gravitational and centrifugal acceleration, respectively. Taking into account that at the inner disk, , , we obtain
| (2) |
One can see that in stars of the same mass and the same magnetospheric radius , the main force acting onto the inner disk matter depends only on the fastness parameter: . In cases of relatively strong propellers, , the power-law dependence is expected. We should note that the magnetic force also contributes to driving and acceleration/collimation of matter in the wind, so that the above power-law dependence on can be different in real situation.
Above analysis shows that the strength of propeller and processes at the disk-magnetosphere boundary should depend on the fastness parameter . That is why we chose this parameter as the main parameter of the model and investigate different properties of propellers as a function of .
2.2 Convenient form for fastness parameter
In the case of a Keplerian disk, , and the fastness parameter can be presented in the form:
| (3) |
where is the corotation radius at which the angular velocity of the star matches the Keplerian angular velocity in the inner disk, :
| (4) |
The magnetospheric radius is the radius at which the magnetic stress in the magnetosphere is equal to the matter stress in the disk:
| (5) |
Here, is density, is thermal pressure, , and , are the poloidal and azimuthal components of velocity and the magnetic field, respectively.
In cases of slowly-rotating stars (not propellers), the magnetospheric radius has been derived theoretically from the balance of the largest components of the stresses : , where is the magnetic field of the star which is suggested to be a dipole field, and is the Keplerian angular velocity in the inner disk:
| (6) |
where is the magnetic moment of the star with a surface field of , is the accretion rate in the disk, and and are the mass and radius of the star, respectively (e.g., Lamb et al. 1973) 444Comparisons of the magnetospheric radii obtained in the axisymmetric simulations with Eq. 6 provided the values (Long et al., 2005) and (Zanni and Ferreira, 2013). 3D simulations of multiple cases have shown a slightly different power (1/10 instead of 1/7) in Eq. 6 due to the compression of the magnetosphere (Kulkarni & Romanova, 2014)..
However, in the propeller regime, the magnetosphere departs from the dipole shape and the poloidal velocity may become comparable to or larger than the azimuthal velocity . In addition, the process of disk-magnetosphere interaction is non-stationary, so all variables vary in time. This is why we calculate the magnetospheric radius using the general equation for balance of stresses (Eq. 5), where both poloidal and azimuthal components of velocity and magnetic field are taken into account.
3 The numerical model
We performed axisymmetric simulations of disk accretion onto a rotating magnetized star in the propeller regime. The model is similar to that used in the simulations of Lii et al. (2014), but with a few differences. Below, we briefly discuss the main features of the numerical model and also the differences between our model and that of Lii et al. (2014). More technical details of the model are described in A.
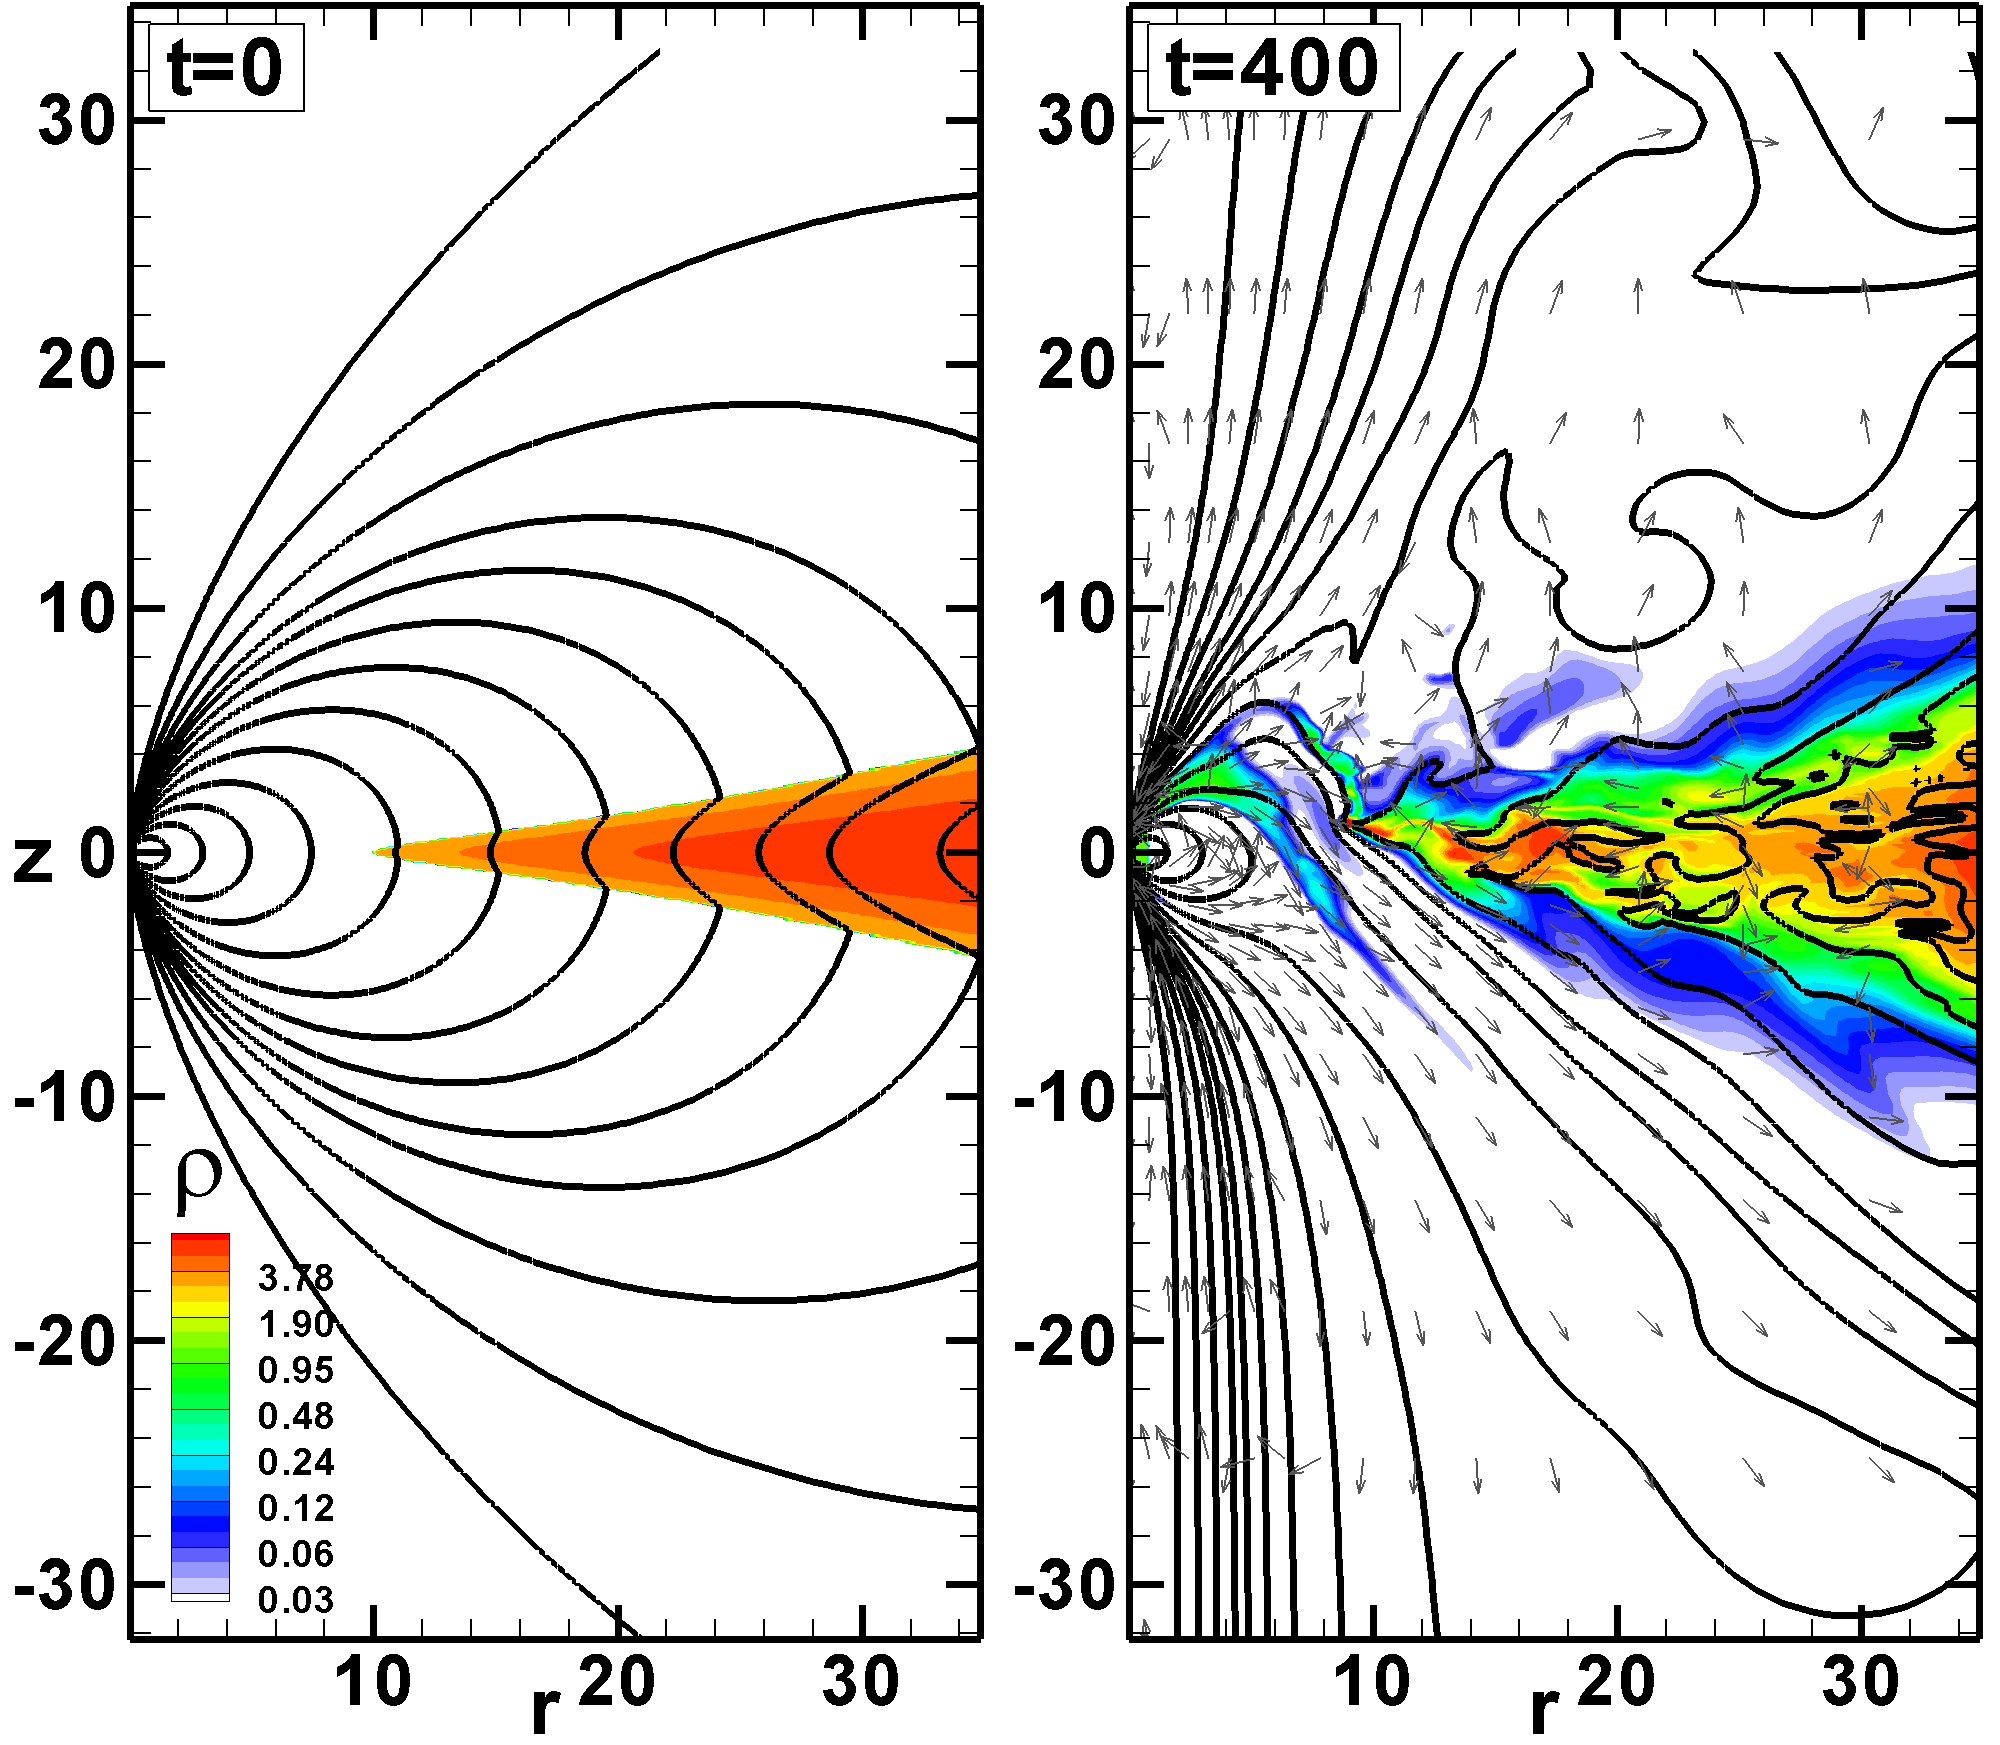
We consider accretion onto a magnetized star from a turbulent accretion disk, where the turbulence is driven by the magneto-rotational instability (MRI, e.g., Balbus & Hawley 1991), which is initiated by a weak poloidal magnetic field placed inside the disk (see Fig. 1). The accretion disk is cold and dense, while the corona is hot and rarefied. The disk is 3,000 times cooler and denser than the corona. The disk is geometrically thin, with an aspect ratio of , where is the semi-thickness of the disk. This disk is about 2.7 times thinner than that used in Lii et al. (2014). To achieve an accretion rate in the new thin disk comparable with that in the Lii et al. (2014) thicker disk, we increased the reference density in the disk by a factor of three. 555Note, that the first set of simulations was performed for the thicker disk and only later was recalculated for the thinner disk. Comparisons did not show any significant differences between the results. However, the current paper is based on the simulations of accretion from the thinner disk, because a thinner disk is closer to realistic disks expected in different accreting magnetized stars.

A star with an aligned dipole magnetic field is placed at the center of the coordinate system. The disk is placed at a distance of 10 stellar radii from the center of the star, which rotates slowly, with the Keplerian angular velocity corresponding to corotation radius . Then, we gradually spin up the star (over the period of 100 rotations of the inner disk at ) to a higher angular velocity, , corresponding to the propeller regime. The corresponding corotation radius, , is a parameter of the model. See A.1 for details of initial and boundary conditions.
The disk-magnetosphere interaction in the propeller regime requires some kind of diffusivity, so that matter of the inner disk can penetrate through the rapidly-rotating layers of the stellar magnetosphere. This type of penetration may be connected with the magnetic Rayleigh-Taylor (magnetic interchange) instability (e.g., Arons & Lea 1976). The magnetic interchange instability has been observed in 2D simulations of propellers, performed in polar coordinates (Wang & Robertson, 1985), as well as in global three-dimensional (3D) simulations of accretion onto slowly-rotating stars (e.g., Kulkarni & Romanova 2008; Romanova et al. 2008; Blinova et al. 2016) and in the local 3D simulations (e.g., Stone & Gardiner 2007a, b). However, in our current 2.5D axisymmetric simulations, this instability is suppressed by the axisymmetry of the problem. This is why we added a diffusivity term into the code and suggested the presence of large diffusivity at the disk-magnetosphere boundary. We determined the coefficient of diffusivity in analogy with the coefficient of viscosity in the disk model: , where is the local sound speed, and is the coefficient of diffusivity. We chose the largest value, permitted by the disk theory, (Shakura & Sunyaev, 1973) (see details in A.1). This is different from the Lii et al. (2014) simulations, where no diffusivity term was added in most of the simulation runs, and where a small numerical diffusivity was responsible for the disk-magnetosphere interaction. Test simulation runs have shown that, when such a diffusive layer is added, more matter is ejected into the outflows (see Appendix in Lii et al. 2014). In the current paper, we suggest high diffusivity in all simulation runs.
The equations were solved in dimensionless units, so that the model could be applied to different types of stars, from young stars to neutron stars (see A.3 and Tab. 6 for details of the dimensionalization procedure). The results of simulations are shown in dimensionless units, excluding those in Sec. 9.
One of the important dimensionless parameters is , which determines the typical size of the dimensionless magnetosphere, . Simulations of Lii et al. (2014) were performed at a relatively small value of (), which provided typical values of the magnetospheric radius, . 666Note that in application of the model to realistic stars, Lii et al. (2014) suggested that the inner boundary , that is a star is located inside the inner boundary. These provided the twice as larger efficient magnetosphere of the star, . In current paper, stars with larger magnetospheres are calculated, and we take during dimensionaliztion procedure.. In the current paper, we consider larger values of : , and , which provide larger sizes of the magnetosphere, . Larger magnetospheric sizes are needed to model the propeller regime in different types of stars, some of which may have relatively large magnetospheres.
A fine grid resolution is used, with grid compression in the regions of the disk and the magnetosphere. A Godunov-type numerical code in cylindrical coordinates has been developed by Koldoba et al. (2016), which incorporates an HLLD numerical solver of Miyoshi & Kusano (2005). See A.2 for details of our numerical model.
| Model | |||||||||||
|---|---|---|---|---|---|---|---|---|---|---|---|
| 30 | 1.3 | 5.1 | 4.0 | 7.9 | 0.12 | 0.76 | 0.86 | 3.2 | 0.12 | 0.19 | |
| 30 | 1.5 | 5.0 | 3.4 | 6.1 | 0.14 | 0.76 | 0.85 | 2.9 | 0.091 | 0.13 | |
| 30 | 2 | 5.0 | 2.5 | 4.0 | 0.17 | 0.76 | 0.82 | 1.7 | 0.069 | 0.053 | |
| 30 | 3 | 4.6 | 1.5 | 1.9 | 0.29 | 0.59 | 0.67 | 1.0 | 0.039 | 0.028 | |
| 30 | 4.2 | 4.7 | 1.1 | 1.2 | 0.35 | 0.55 | 0.61 | 0.62 | 0.039 | 0.019 | |
| 60 | 1.3 | 5.9 | 4.6 | 9.7 | 0.23 | 1.49 | 0.87 | 7.6 | 0.30 | 0.48 | |
| 60 | 1.5 | 5.8 | 3.9 | 7.6 | 0.31 | 1.43 | 0.82 | 6.5 | 0.19 | 0.30 | |
| 60 | 2 | 5.9 | 2.9 | 5.1 | 0.22 | 1.24 | 0.85 | 4.9 | 0.13 | 0.20 | |
| 60 | 3.1 | 5.5 | 1.8 | 2.3 | 0.30 | 0.82 | 0.73 | 1.8 | 0.041 | 0.036 | |
| 60 | 3.7 | 5.4 | 1.5 | 1.8 | 0.46 | 0.87 | 0.66 | 1.7 | 0.051 | 0.039 | |
| 60 | 4.2 | 5.4 | 1.3 | 1.5 | 0.59 | 0.77 | 0.57 | 1.2 | 0.043 | 0.040 | |
| 60 | 5 | 5.8 | 1.2 | 1.3 | 0.60 | 0.85 | 0.59 | 1.1 | 0.056 | 0.037 | |
| 100 | 1.5 | 7.1 | 4.7 | 10.2 | 0.58 | 2.46 | 0.81 | 16.8 | 0.58 | 1.01 | |
| 100 | 2 | 7.1 | 3.5 | 6.7 | 0.54 | 1.44 | 0.73 | 8.6 | 0.28 | 0.34 | |
| 100 | 2.5 | 6.0 | 2.4 | 3.8 | 0.34 | 1.12 | 0.77 | 5.4 | 0.11 | 0.091 | |
| 100 | 3 | 5.9 | 2.0 | 2.7 | 0.42 | 0.76 | 0.64 | 3.5 | 0.052 | 0.047 | |
| 100 | 3.7 | 6.1 | 1.7 | 2.1 | 0.49 | 0.95 | 0.66 | 3.1 | 0.051 | 0.049 | |
| 100 | 4.3 | 6.2 | 1.4 | 1.7 | 0.60 | 1.19 | 0.67 | 2.4 | 0.063 | 0.047 | |
| 100 | 5 | 6.1 | 1.2 | 1.3 | 0.75 | 1.10 | 0.59 | 2.1 | 0.067 | 0.035 |
4 Variability and time-averaged values
We investigated the properties of propellers of different strengths, from very weak propellers (in which the magnetosphere rotates only slightly faster than the inner disk) to very strong propellers (where the magnetosphere rotates much more rapidly than the inner disk). To achieve different strengths of propeller, we varied the corotation radius in the range of . We also varied the magnetospheric parameter (which determines the dimensionless size of the magnetosphere, ), and performed calculations for three values, and . Table 1 shows parameters for a number of representative models and also results of simulations.
The disk-magnetosphere interaction in the propeller regime is a non-stationary process, where the inner disk radius oscillates, and the matter fluxes to the star, , and to the wind, , are also strongly variable. The variability is connected with the cycle of matter accumulation, accretion/ejection, and magnetosphere expansion.
4.1 A cycle of accumulation-accretion/ejection-expansion
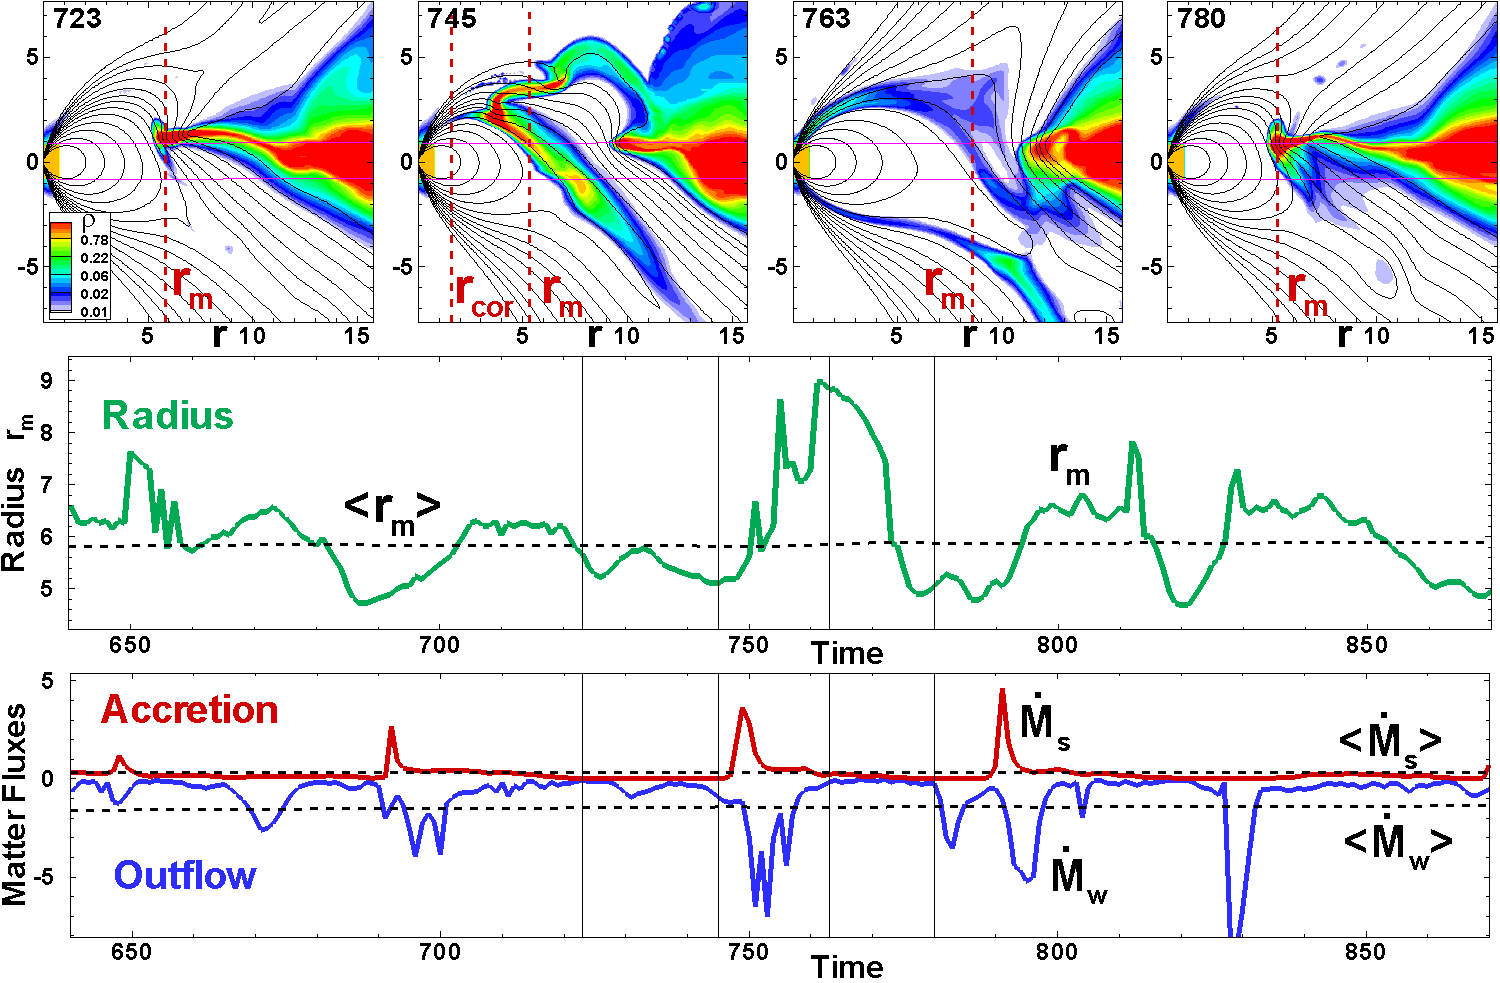
To demonstrate the non-stationary nature of the propeller regime and our procedure for time-averaging, we show the results obtained for one of our models of a strong propeller, . The top panels of Fig. 2 show a close-in view of the inner part of the simulation region during one episode of the accumulation-accretion/ejection-expansion cycle. (1) At , matter is accumulated at the inner disk, which gradually moves inward (towards the star). The stellar field lines threading the disk inflate and expand. Inflation is stronger in the part of the magnetosphere that is below the equator. (2) At , part of the matter starts accreting onto the star above the magnetosphere, while another part starts flowing away from the star below the magnetosphere. It is very typical for matter to accrete on one side of the magnetosphere while forming outflows on the other side of the magnetosphere. The magnetosphere is slightly compressed on the accreting side, while the field lines strongly inflate on the outflowing side. One can see that a significant part of the magnetic flux inflates in the direction away from the star below the equatorial plane. (3) After an accretion/ejection event, the magnetosphere expands (see 3rd panel at ). (4) Subsequently, the inner disk gradually moves inward (see 4th panel at ) and the process repeats. At stage (2), accretion is possible because only a part of the magnetosphere (where the field lines are closed) rotates more rapidly than the inner disk and represents a centrifugal barrier 777 We should note that some matter is also ejected into the outflows without significant accretion onto the star (see, e.g., a burst to an outflow at in Fig. 2). In this type of outflow, matter of the inner disk penetrates through the magnetosphere, acquires sufficient angular momentum and flows away from the star.
4.2 Magnetospheric radius
We calculated the position of the inner disk (magnetospheric) radius using Eq. 5. To calculate the magnetospheric radius at some moment in time, we take the values of density, pressure and components of velocity and magnetic field in the equatorial plane from the simulations, and find the radius , at which the balance of stresses (Eq. 5) is satisfied. The magnetosphere is often asymmetric about the equatorial plane. To take this issue into account, we initially calculated the magnetospheric radius at the surfaces , which are above and below the equatorial plane, and then took the half-averaged value as the main magnetospheric radius in the model. We observed from the simulations that at this radius, , the density in the disk drops from the high values in the disk down to very low values in the magnetosphere, while the angular velocity changes from the Keplerian angular velocity in the disk to the angular velocity of the magnetosphere.
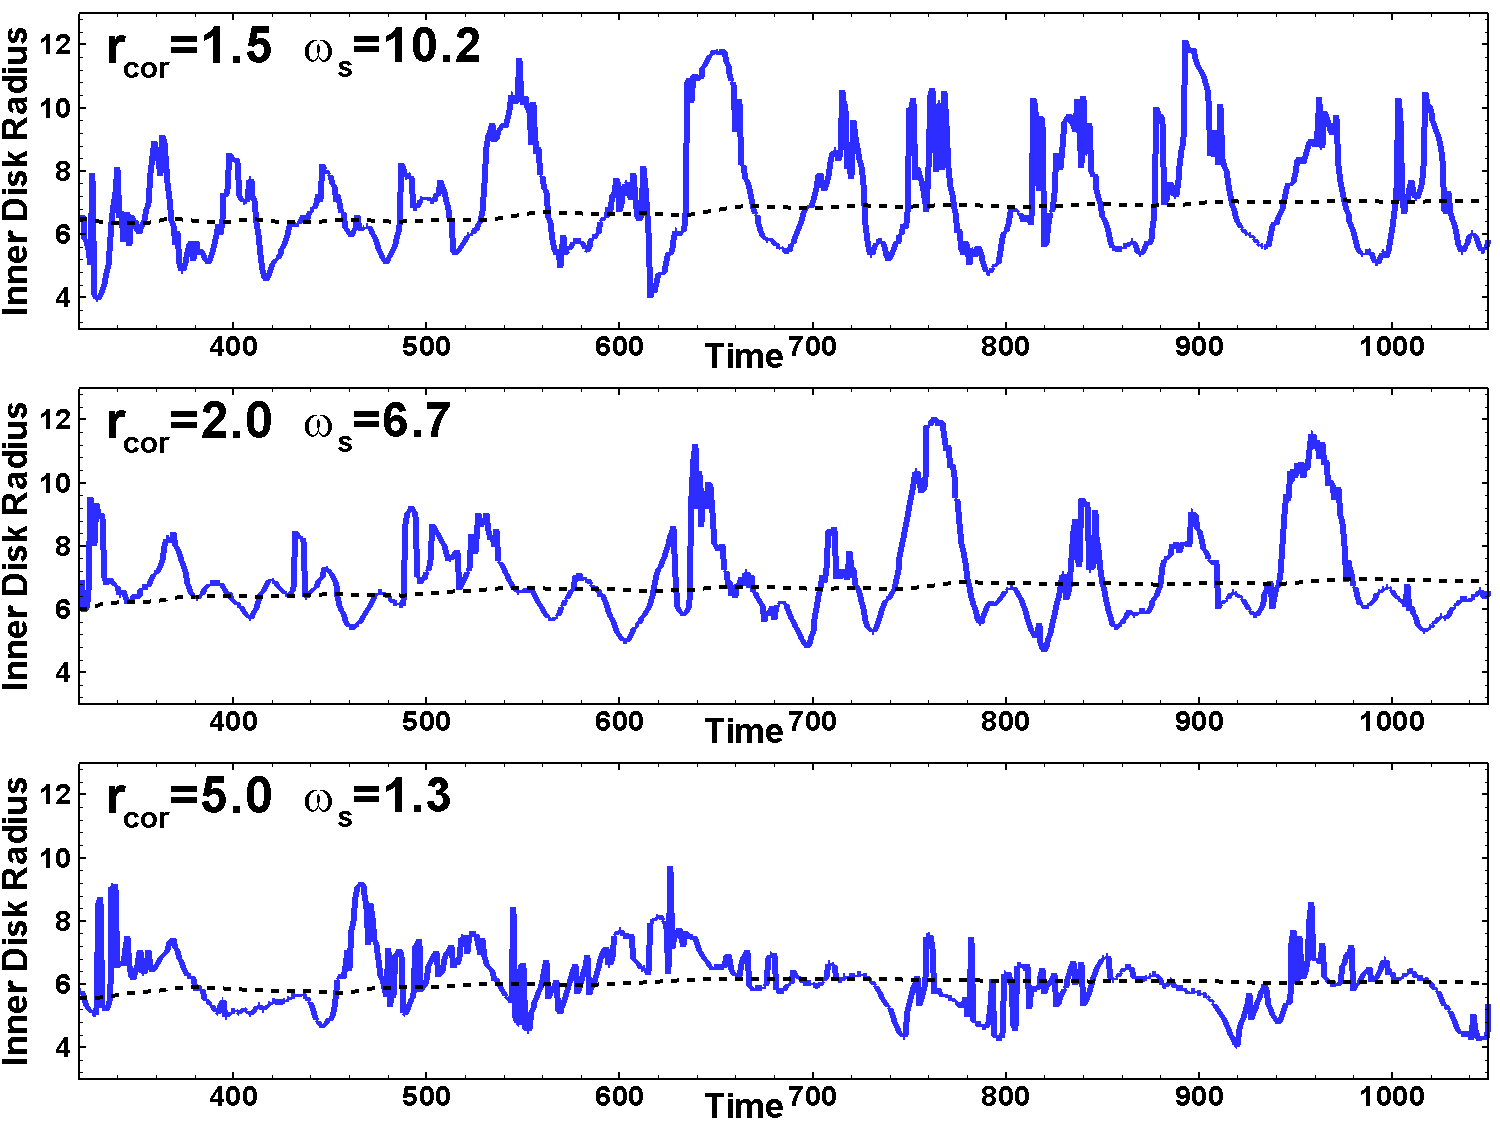
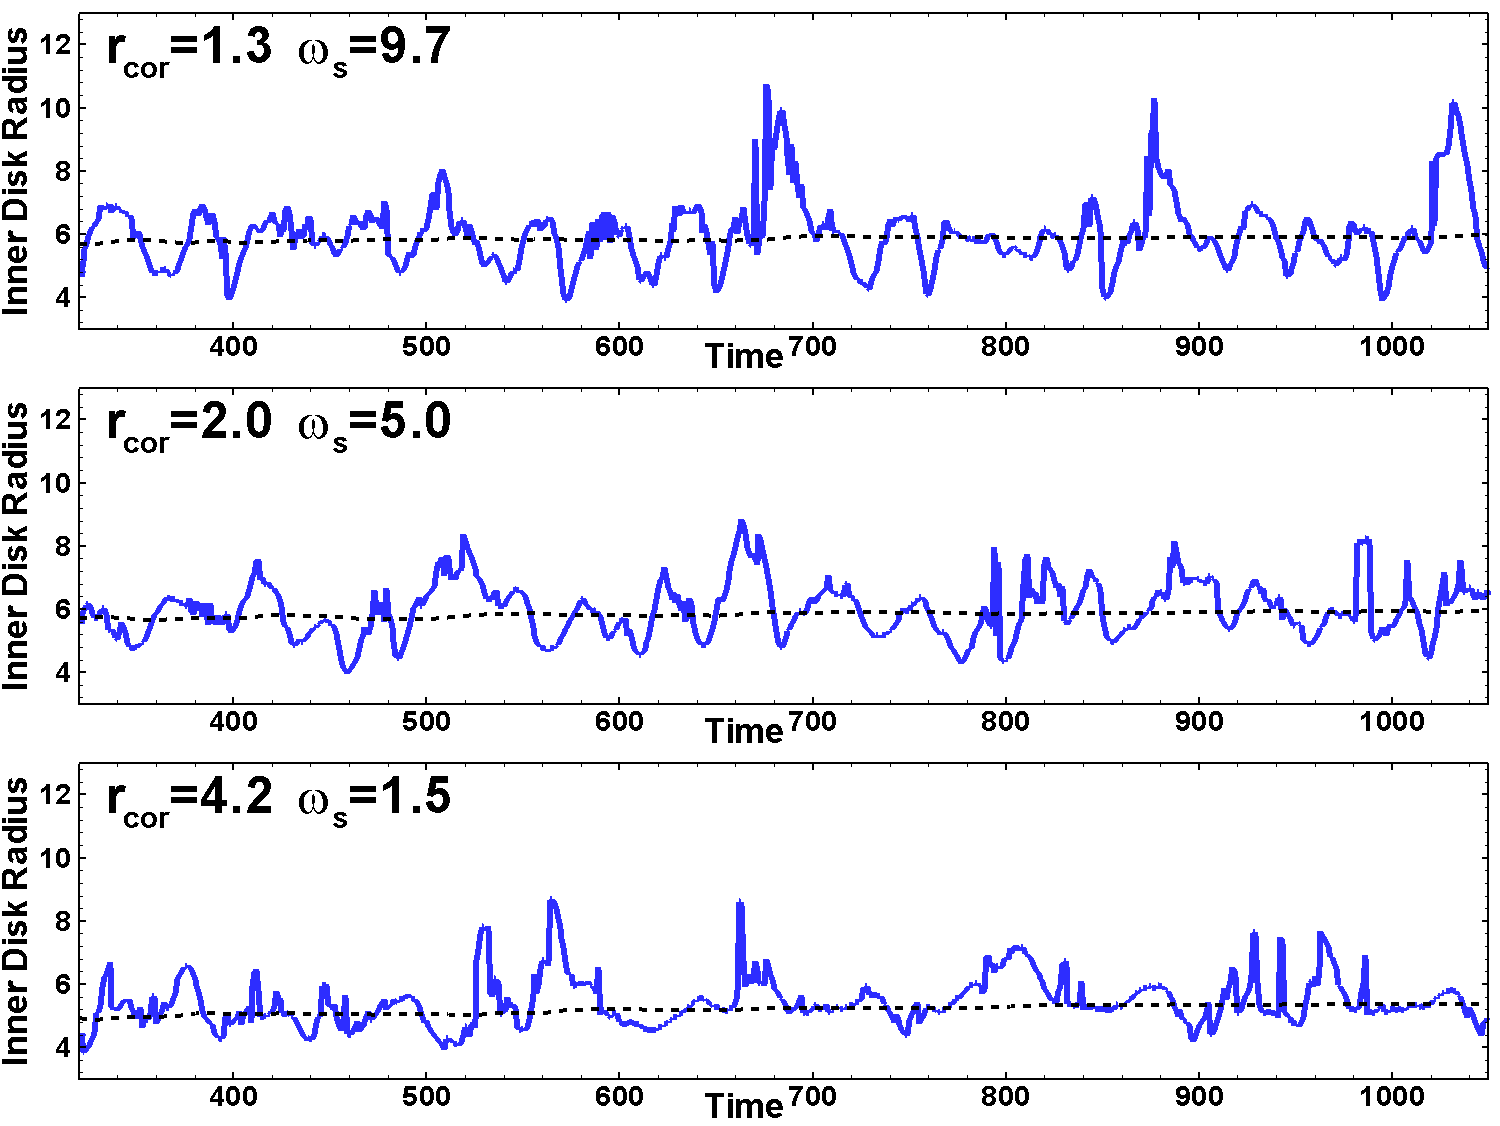
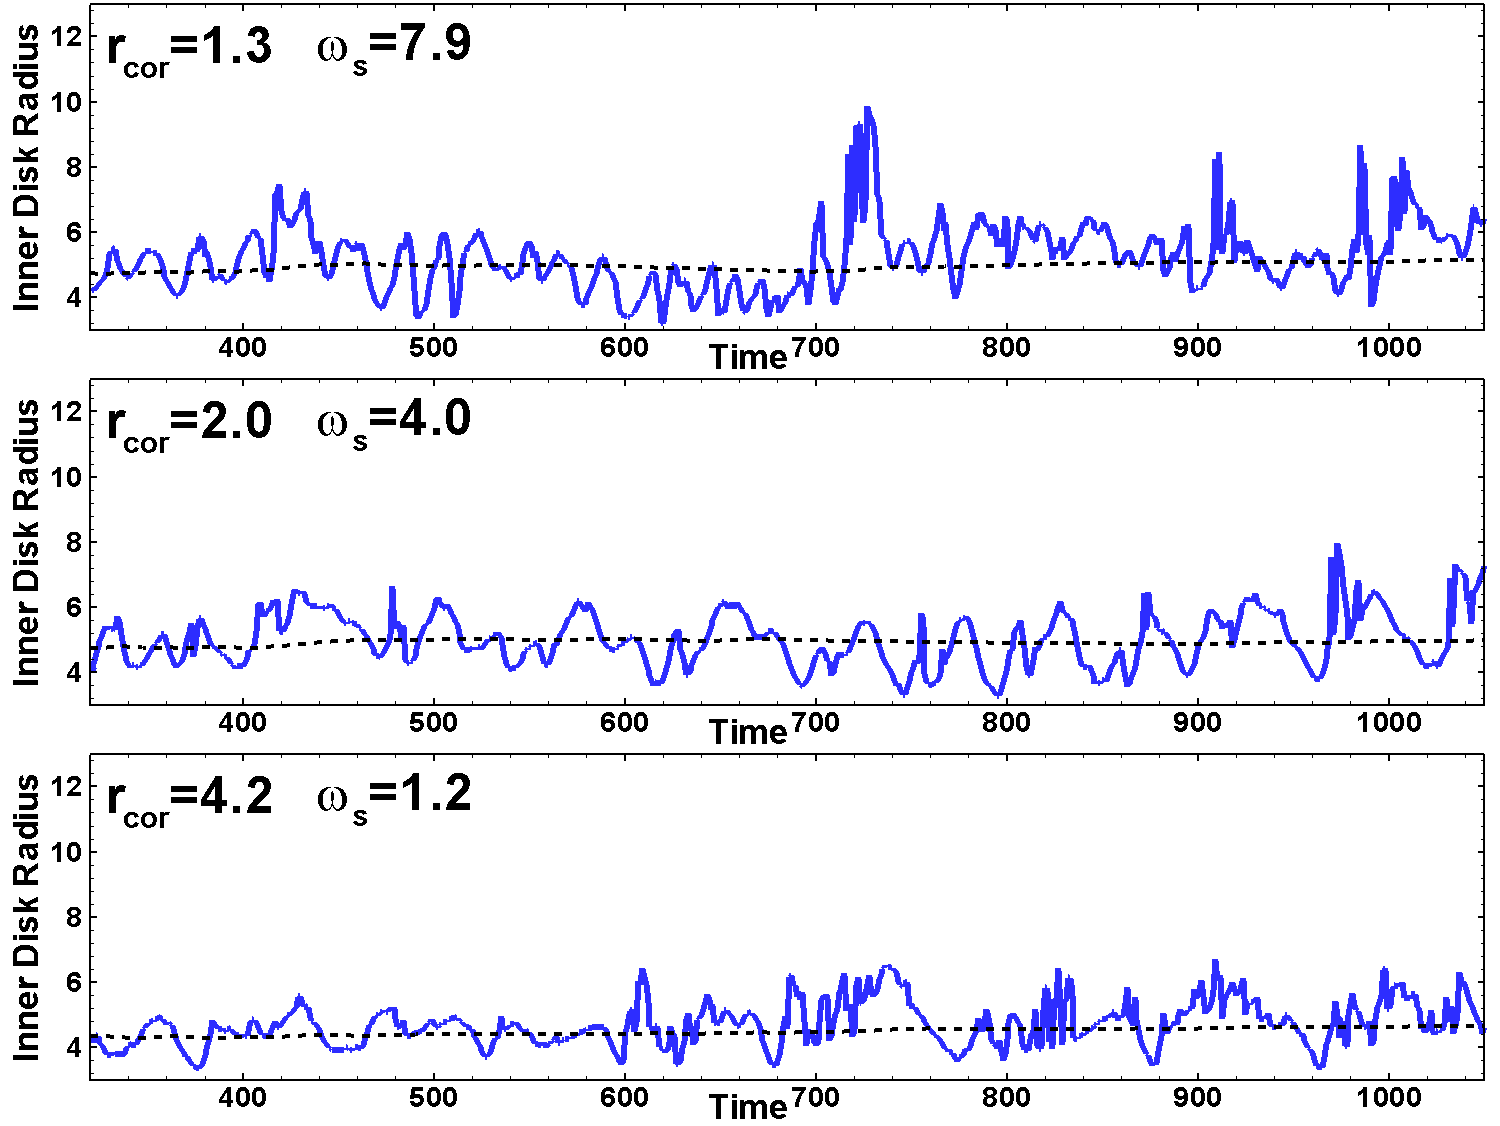
Simulations show that the magnetospheric radius varies in time. The middle panel of Fig. 2 shows that it varies between and . To characterize the magnetospheric radius in each model, we introduce the time-averaged magnetospheric radius:
| (7) |
We show this time-averaged radius as a dashed line in Fig. 2. This radius slightly varies in time. For consistency, we start averaging at moment in each simulation run (so as to exclude the effects of the initial conditions) and take this radius at moment for each model. In the model shown in Fig. 2, we obtain .
The right panels of Figs. 18, 19 and 20 show variation of the inner disk radius in our representative models. The figures show that the amplitudes of disk oscillations are larger in models with larger values (strongest propellers) and also increase with the magnetospheric parameter . In the weaker propellers, the amplitude of the oscillations is much smaller, and the radius varies only slightly. Tab. 1 shows the time-averaged magnetospheric radii for our representative models.
Fig. 3 shows the density distribution in three models with the same corotation radius, , but different values of the magnetospheric parameter : , at the times when the magnetospheric radius is approximately equal to the time-averaged radius. These radii are approximately twice as large as the radii in the models of Lii et al. (2014),
4.3 Time-averaged fastness parameter
We use the time-averaged radius to calculate the time-averaged fastness parameter:
| (8) |
Subsequently, in this paper, we use this parameter, as the main parameter of the model. For convenience, we remove the brackets and simply use the variable . Tab. 1 shows the values of the time-averaged fastness parameter for our representative models. One can see that the fastness parameter ranges from very low values, , to very high values, .
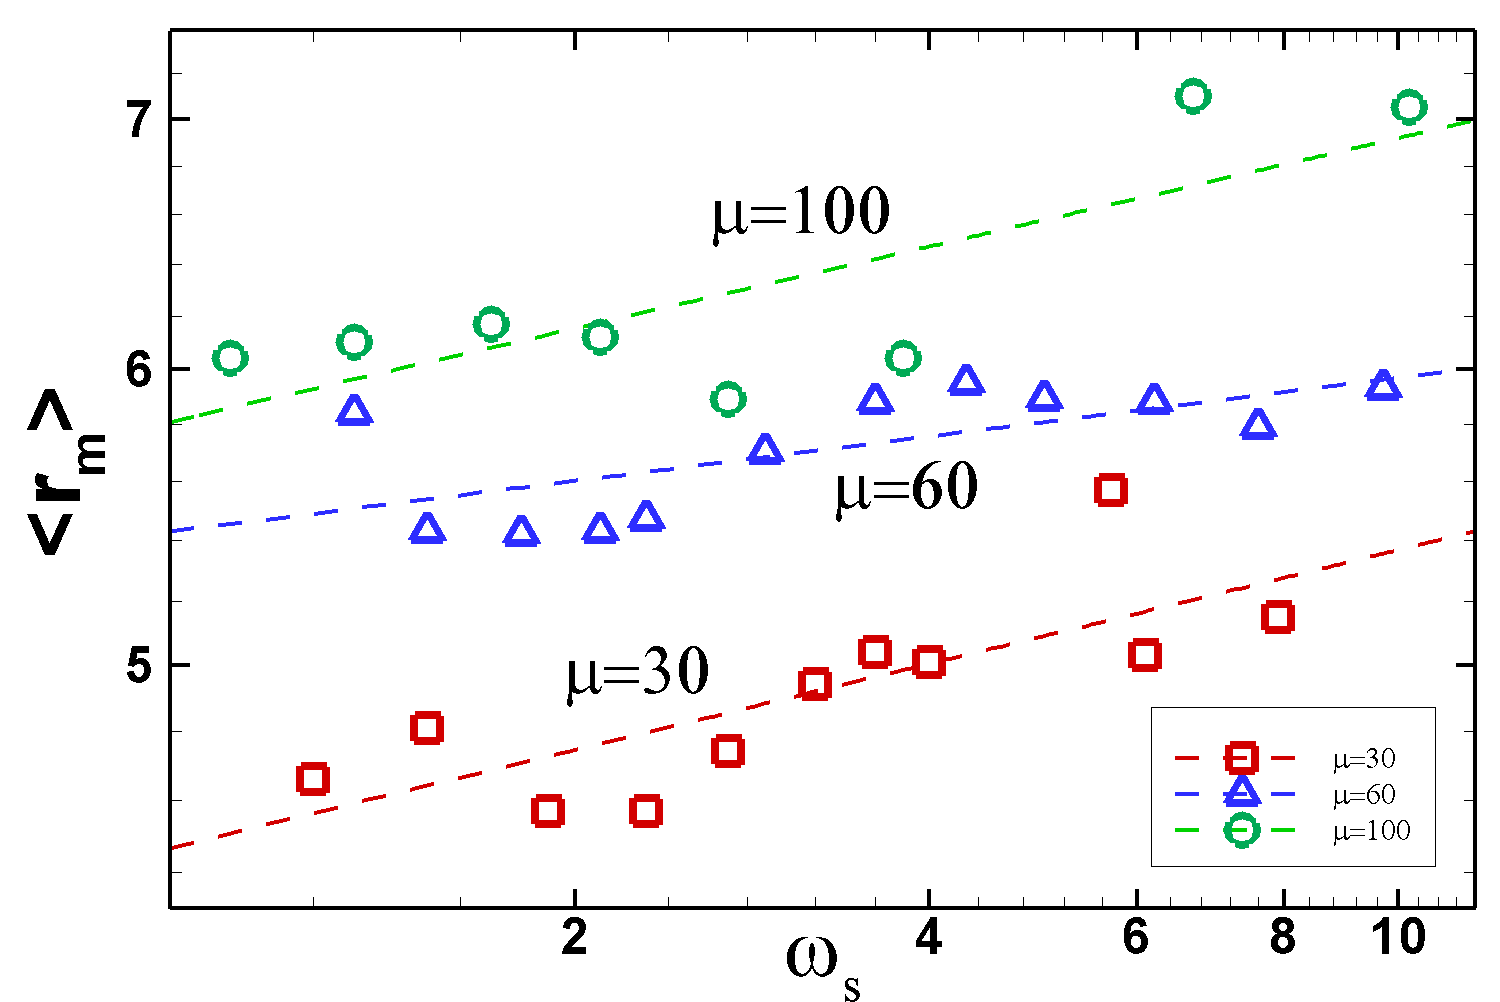
Fig. 4 shows the dependence of the time-averaged magnetospheric radius, , calculated for all models, on the time-averaged fastness parameter . One can see that in a set of models with the same parameter , the magnetospheric radius slightly increases with . The dependencies are the following: (1) at , ; (2) at , ; (3) at , . In each set, the radii are larger at larger values of . We took the dependence on corresponding to and , and found an approximate general relationship for all models:
| (9) |
where . A comparison of the radii obtained with this formula with the values of observed in the simulations shows that the typical deviation of the observed radii from those obtained with the formula is .
4.4 Why does matter accrete in the propeller regime?
In the sample model shown in Fig. 2, the magnetospheric radius is always larger than the corotation radius, , and the time-averaged magnetospheric radius, , is also larger than the corotation radius, . In spite of this, matter accretes onto the star. In all other models, matter also accretes onto the star (see Tab. 1 for ). This is different from the generally-accepted definition that, in the propeller regime, accretion is possible if and is completely forbidden otherwise. Below, we describe the main reasons why accretion becomes possible even in the cases of very strong propellers:
-
1.
In theoretical studies and one-dimensional models, it is suggested that the centrifugal barrier is an infinite vertical wall (e.g., Sunyaev & Shakura 1977; Spruit & Taam 1993). However, two-dimensional simulations show that only the closed part of the magnetosphere rotates more rapidly than the inner disk and represents the centrifugal barrier. That is why, at favorable conditions, matter can flow above or below the magnetosphere and accrete onto the star at condition .
-
2.
The process is non-stationary. Most of the time, accretion is blocked by the centrifugal barrier and matter does not accrete onto the star. However, when the disk comes closer to the star, conditions become favorable for accretion and matter accretes onto the star in a brief episode. This explains why the time-averaged matter flux to the star can be so low (much lower than the matter flux to the wind).
These two-dimensional, non-stationary propeller models help explain why propellers can accrete a part of the disk matter, in spite of the fact that their magnetospheres rotate more rapidly than their inner disks.
4.5 Matter fluxes
We also calculated the matter fluxes onto the star and to the wind:
| (10) |
The matter flux to the star has been calculated through the stellar surface, which is a cylinder with radius and height centered on the star, while the matter flux to the wind has been calculated through cylindrical surface with radius and height 888The surface is located relatively close to the star, at a distance that is only slightly larger than the time-averaged values of the magnetospheric radii in our models, (see Tab. 1). It helps us select the propeller-driven wind from the disk-magnetosphere boundary and deselect the slow winds from the other parts of the disk. . To exclude the slow motions in the turbulent disk, we placed the condition that the poloidal velocity in the wind should be larger than some minimum value , where is the local escape velocity, and . Our simulations show that only in strong propellers is matter ejected from the disk-magnetosphere boundary with a velocity comparable to the local escape velocity. In most cases, the initial outflow velocity is low. It can be as low as . In spite of that, matter flows away from the simulation region, driven mainly by the magnetic force of the inflating field lines. That is why we chose the condition for the calculation of the outflows. Using this condition, we take into account both the fast and slow winds from the disk-magnetosphere boundary.
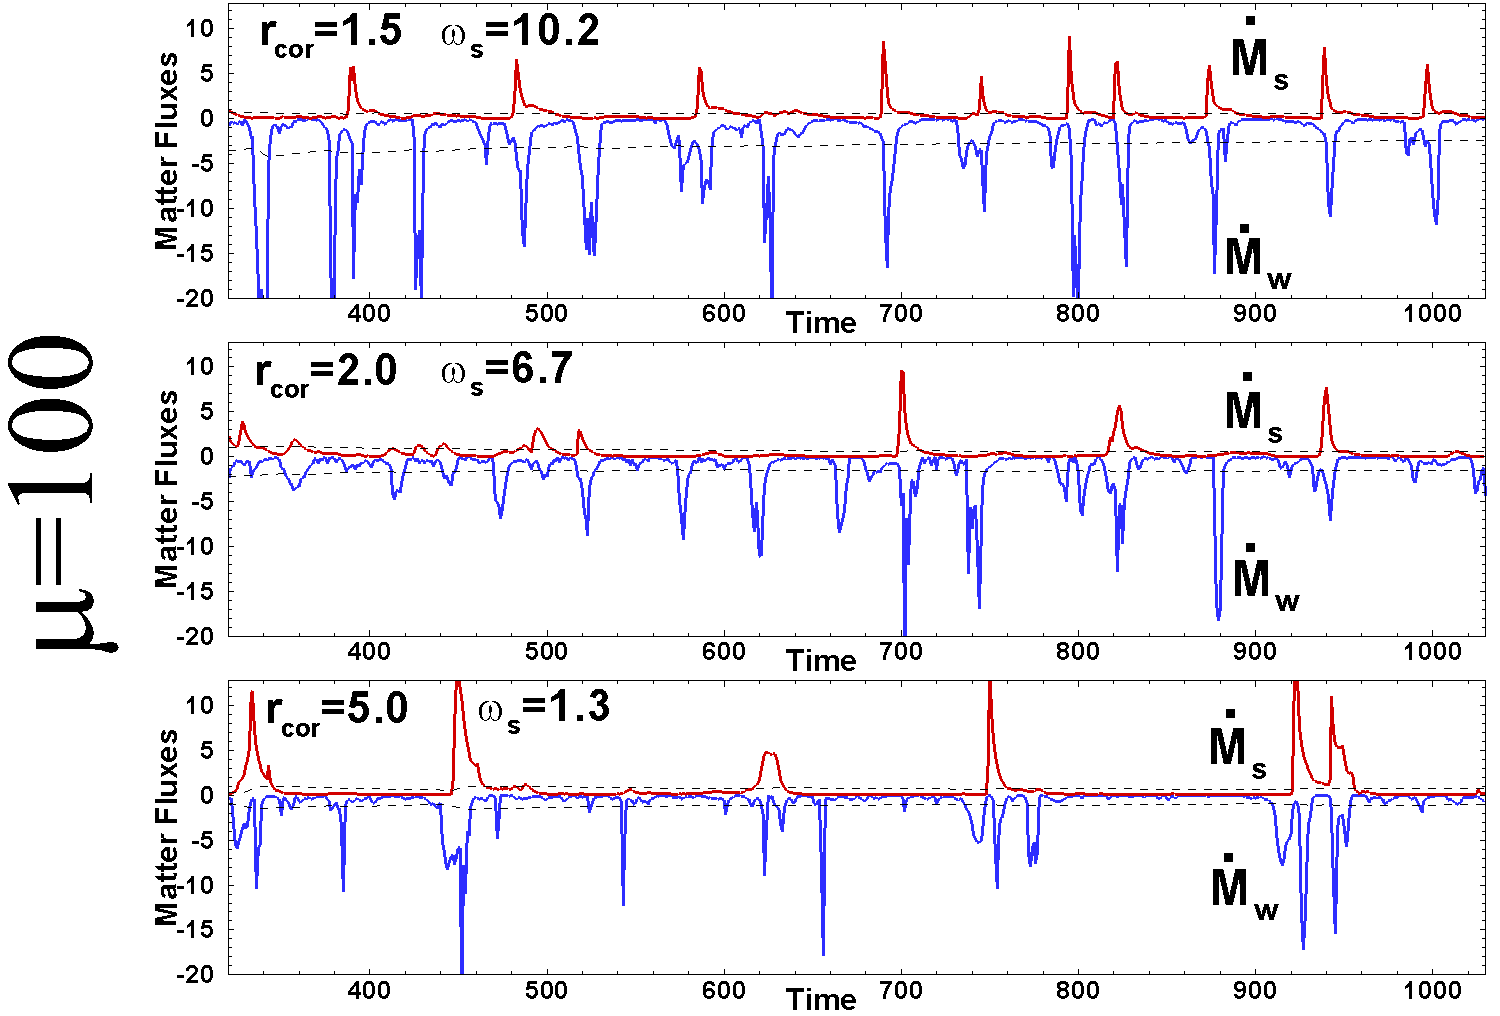
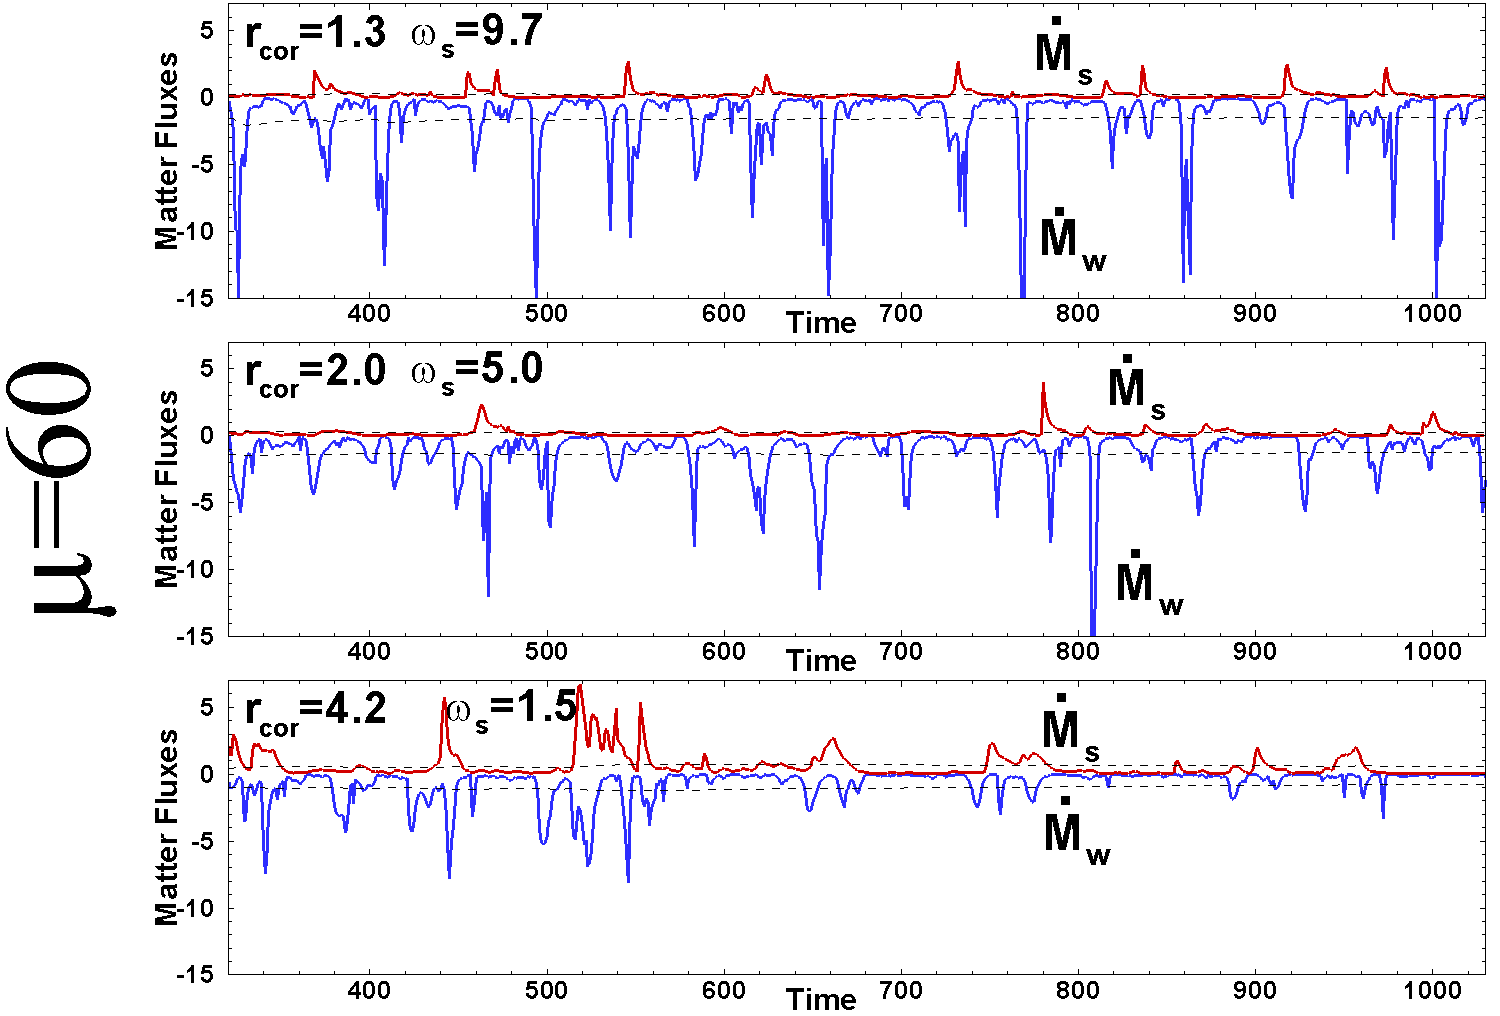
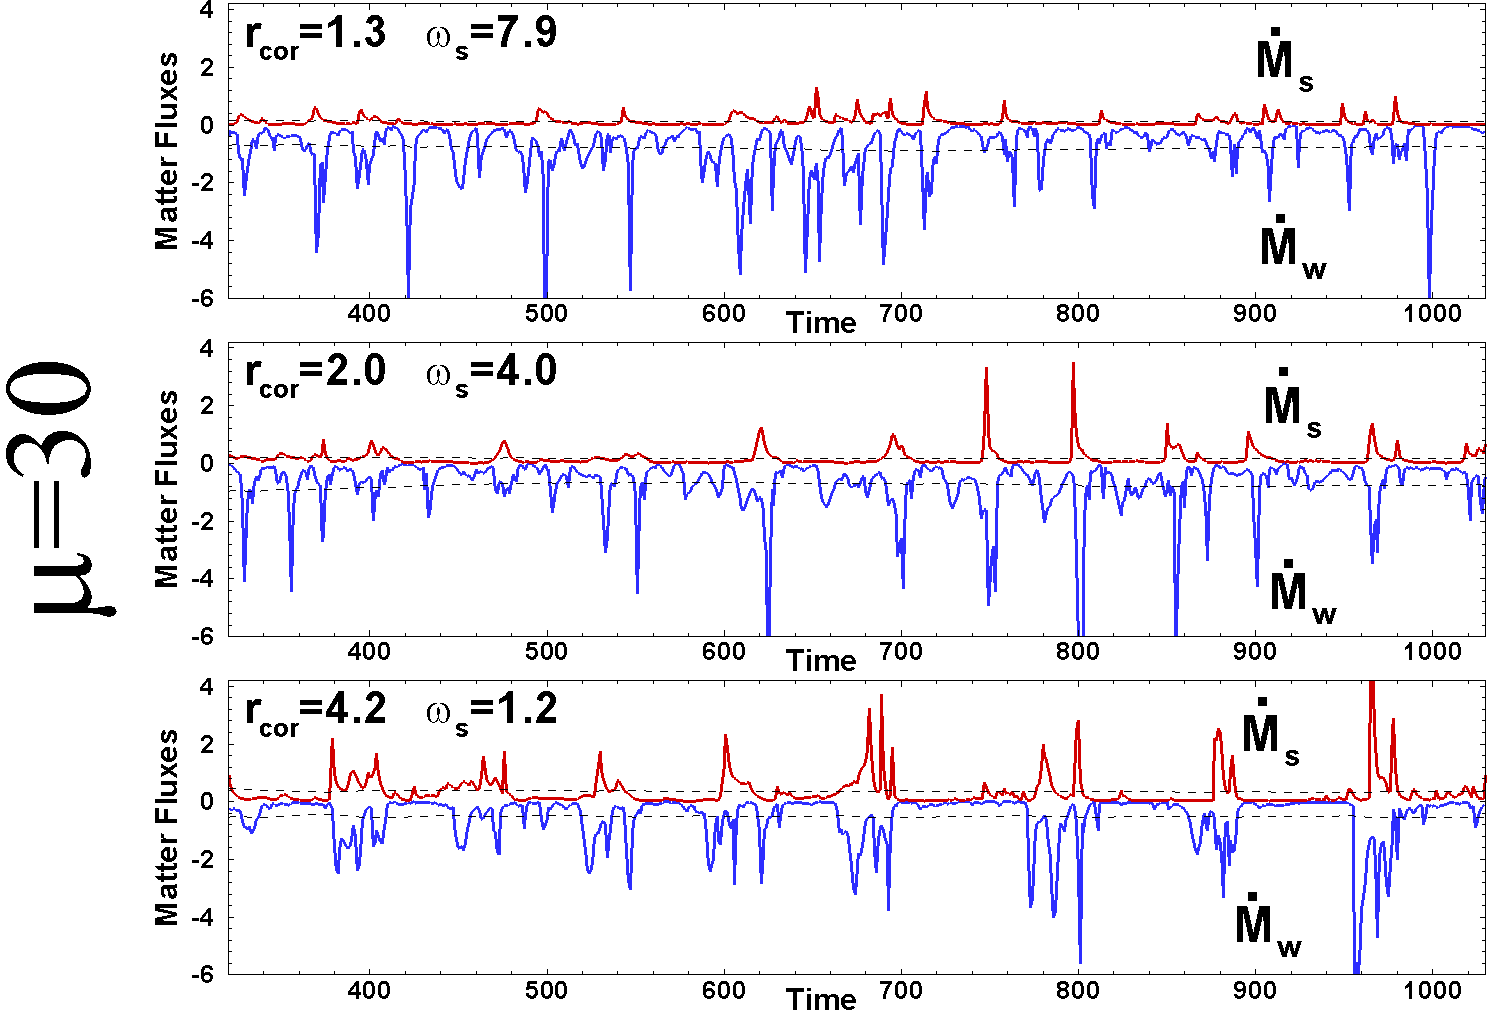
The bottom panel of Fig. 2 shows the flux onto the star (in red) and the flux to the wind (in blue). One can see that the fluxes are “spiky”, because most of the time accretion onto the star is stopped by the centrifugal barrier of the propelling star. The left panels of Figs. 18, 19 and 20 show variation of the matter fluxes in our representative models. To characterize fluxes in each model, we introduced the time-averaged matter fluxes:
| (11) |
The dashed lines in the bottom left panel of Fig. 2 show the time-averaged matter fluxes onto the star and to the wind .
We observed that the matter fluxes are affected by the initial conditions during the first 200 rotations, which is why we calculated the time-averaged values of the fluxes starting at . We observed that the time-averaged fluxes vary only slightly in time. We chose a late moment in time, , which is near the end of most simulation runs 999Much longer simulation runs were performed in a few test cases. However, they did not show new information compared with shorter runs. That is why most of simulations were stopped shortly after time (to save computing time). , and took the flux values at this moment to be the typical averaged fluxes for any given model. The values of these averaged fluxes are and in the sample model shown in Fig. 2.
Left panels of Figures 18, 19 and 20 of B) show examples of the fluxes in our representative models. The dashed lines show their time-averaged values. Tab. 1 shows the time-averaged matter fluxes for a number of calculated models.
| Averaged | ||||
|---|---|---|---|---|
4.6 Propeller Efficiency
Propellers of different strengths eject different amounts of matter into the wind. To characterize the relative matter flux ejected into the wind, we introduce propeller efficiency:
| (12) |
where and are the time-averaged matter fluxes to the wind and to the star, respectively.
For each model, we calculated the time-averaged matter fluxes and the value of propeller efficiency using Eq. 12. We also calculated the time-averaged value of the fastness parameter for each model using eq. 8.
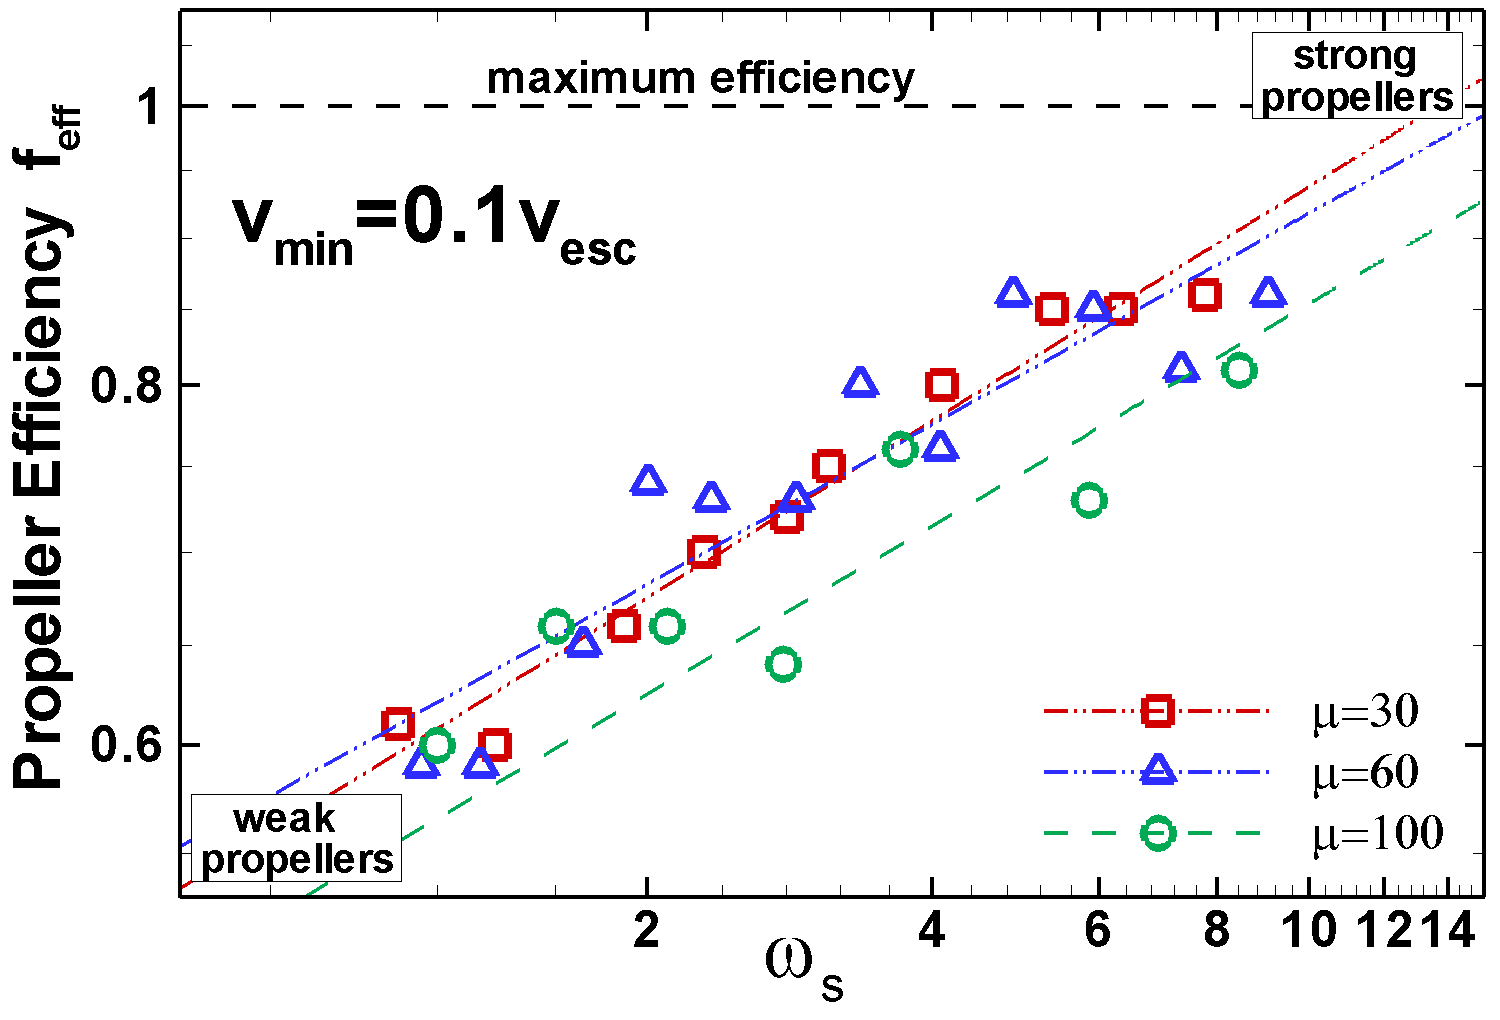
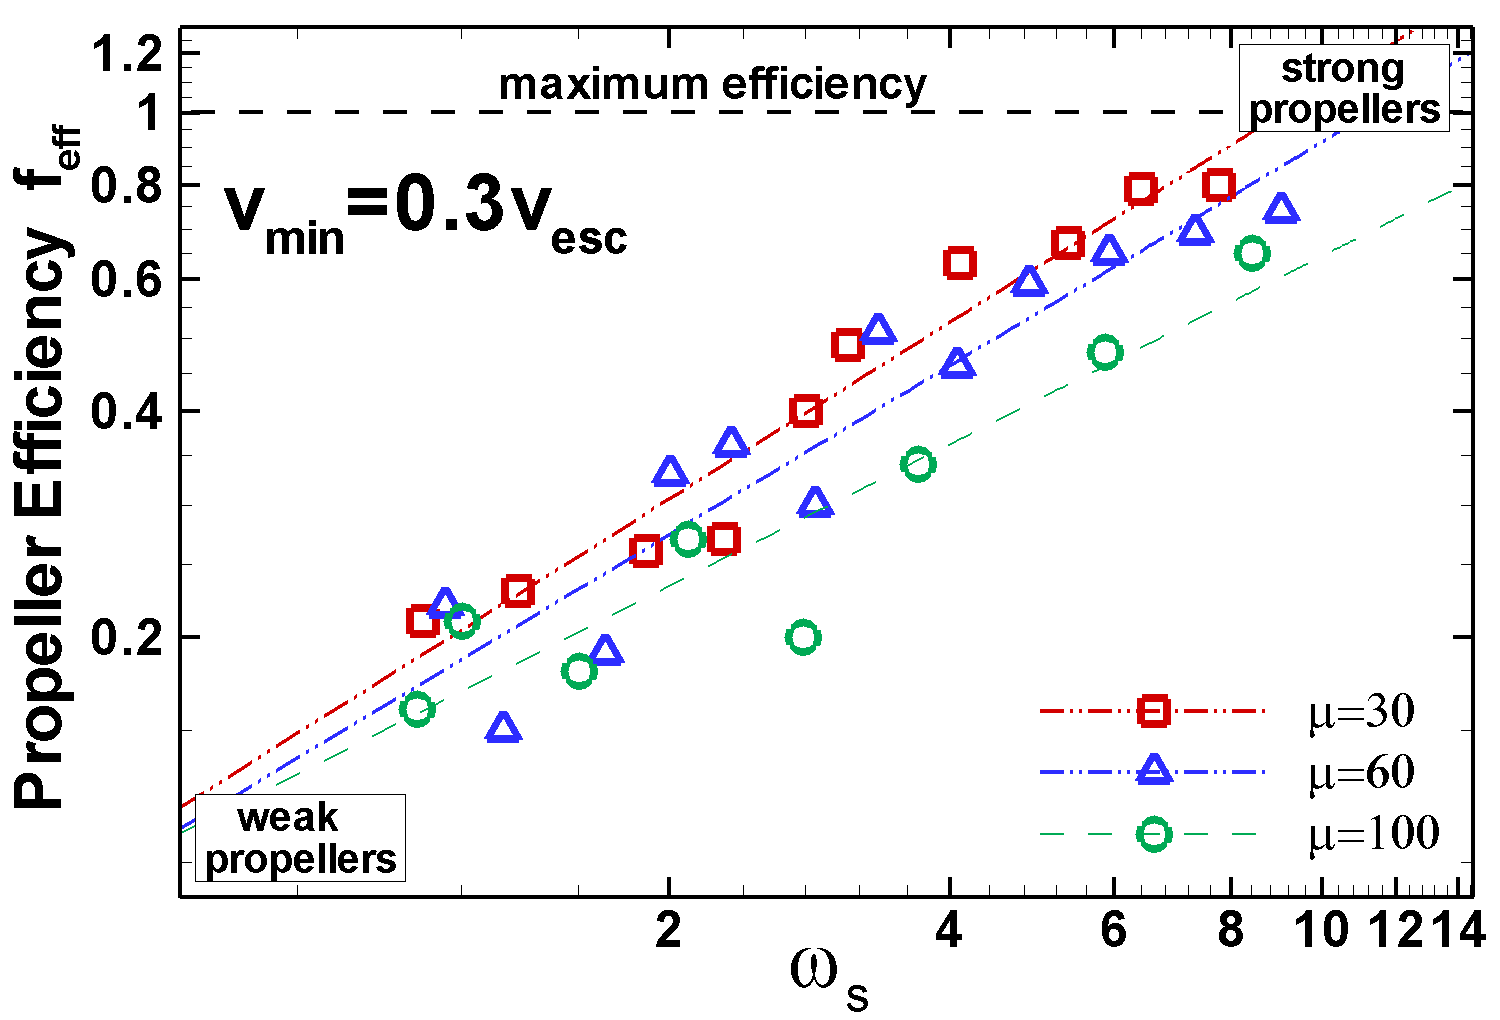
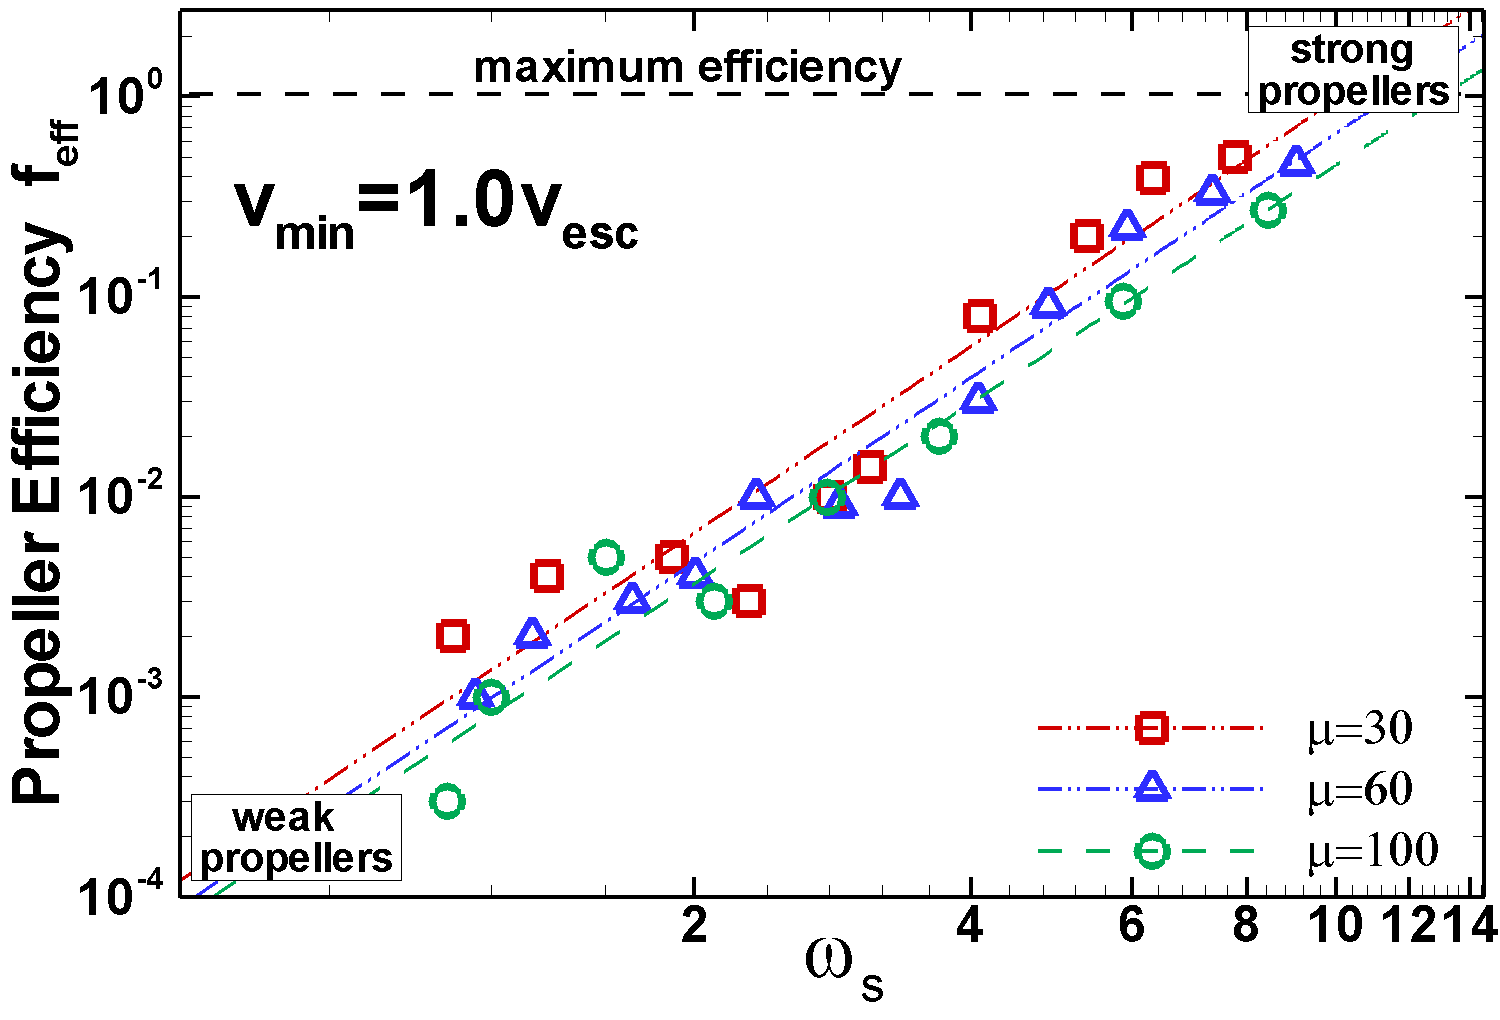
Fig. 5 shows the plot of efficiency versus the averaged fastness, , for all models, where each point corresponds to a single model. The set of models includes a wide variety of propeller strengths, from very weak propellers (bottom left corners of the plots) to very strong propellers (top right corners of the plots), and different values of magnetospheric parameter , which correspond to different magnetospheric sizes, , from relatively small magnetospheres (, marked as squares) to large magnetospheres (, marked as circles). The triangles show models with intermediate magnetospheric sizes ().
We calculated the propeller efficiency taking into account only the faster component of the outflowing matter (to exclude the slow motions in the inner disk), with poloidal velocities , where , , and (see top, middle and bottom panels of Fig. 5).
The top panel of Fig. 5 shows that, at condition , efficiency is high in both the strong propellers, (see top right corner of the plot), and the weak propellers, (bottom left corner of the plot). This means that, in propellers of different strengths, most of the inner disk matter flows into the wind. This wind can be slow in the cases of weak propellers and much faster in the strong propellers (see Sec. 5.2). The middle panel of Fig. 5 shows that, if we only include the relatively fast outflows, with , then efficiency becomes lower, , in the weak propellers. The bottom panel of Fig. 5 shows that, if we only consider the outflows with super-escape velocities (), then, in the weak propellers, efficiency becomes very low, , but increases sharply with . One can see that, in all three cases, the dependency on can be approximated as a power law: . Tab. 2 shows these dependencies for different values and different values of . One can see that, at and , the efficiency is slightly lower for larger magnetospheres () compared with the smaller magnetospheres ( and ).
The above analysis shows that, in propellers of different strengths, a significant amount of the inner disk matter is lifted above the disk plane and flows into the wind. However, the fate of this wind is different in the cases of strong and weak propellers. Below, we analyze the properties of the wind.
5 Properties of propeller winds
5.1 Matter flow in strong and weak propellers
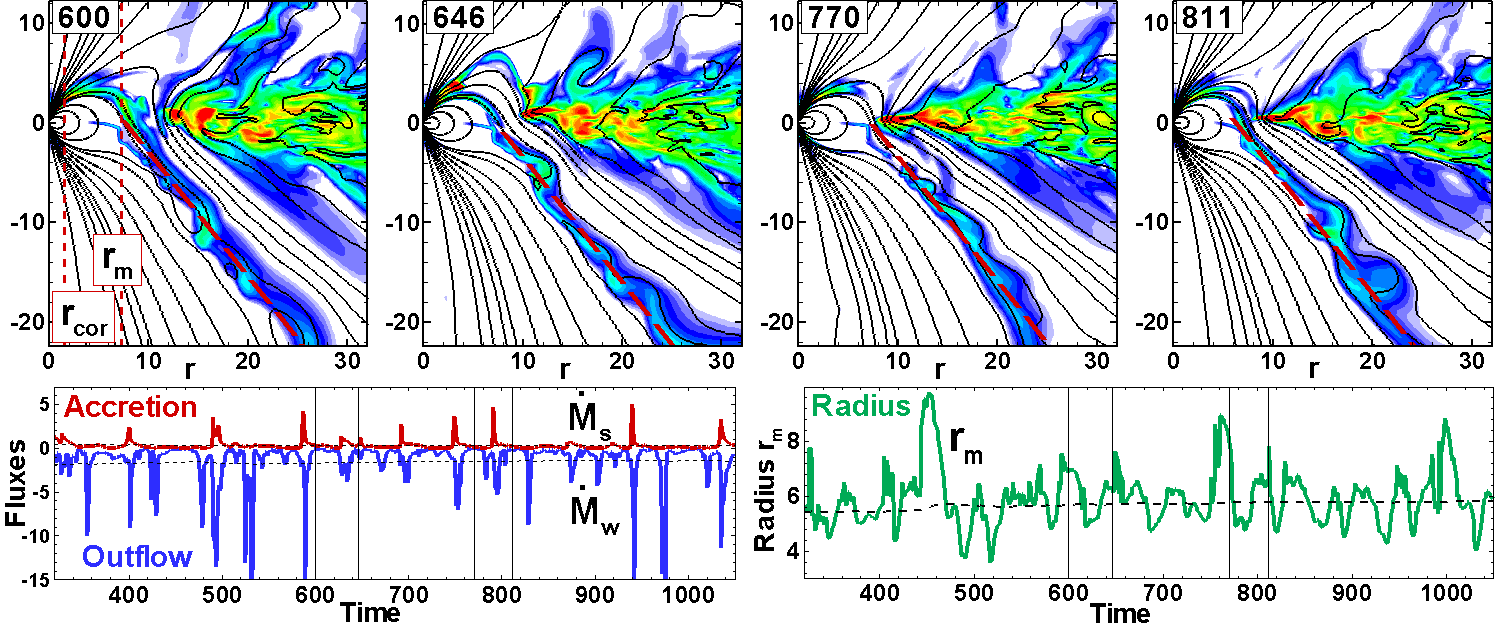
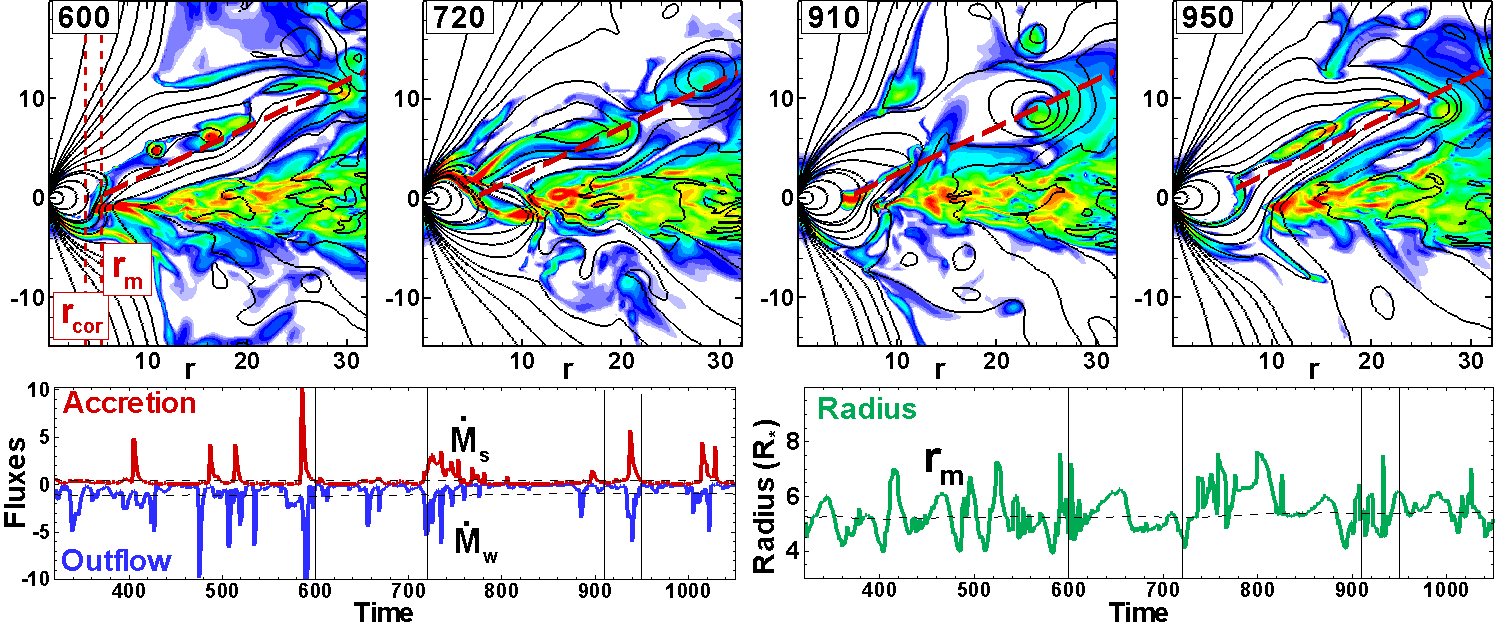
To demonstrate typical matter flow in strong and weak propellers, we took two models ( and ) with the same magnetic moment, , but different corotation radii and .
Fig. 6 shows several snapshots of matter flow in the strong propeller regime, taken during or after an episode of matter outflow. The color background shows matter flux density and the lines are sample poloidal field lines. One can see that most of the external field lines are open and matter flows into conical-shaped wind at an angle of . The dashed red line shows an approximate direction of the outflow.
The bottom left panel shows the matter fluxes to the star, , and to the wind, , and their time-averaged values (dashed lines), which were used to calculate the efficiency of the propeller, . The bottom right panel shows variation of the inner disk radius and its time-averaged value , which was used to calculate the fastness parameter: .
Fig. 7 shows matter flow to the wind in a relatively weak propeller (model ) during several outbursts to the wind. One can see that the magnetic field lines connecting the inner disk with the star inflate and matter is ejected into the wind at a larger opening angle, , compared with the case of the stronger propeller. The bottom left panel shows that the matter fluxes to the star and to the wind look somewhat similar to those of the strong propeller shown in Fig. 6. The efficiency of the weaker propeller, , is only slightly lower than that of the stronger propeller. This similarity is due to the fact that, in both models, the outflows include any matter that flows through surface with velocity . However, in the weak propeller, the velocity of matter flow into the wind is much lower than in the strong propeller (see Sec. 5.2). The bottom right panel of Fig. 7 shows that the magnetospheric radius oscillates and the time-averaged value , which is only slightly smaller than that in the above example of the strong propeller 101010This approximate equality of the radii is due to the fact that the magnetospheric radius is determined by the balance between the magnetic and matter pressures, where term dominates over term at the disk-magnetosphere boundary.. Note, however, that the fastness parameter, , is much smaller than that of the strong propeller. The fastness parameter is one of the main factors contributing to the differences in the properties of the winds in strong versus weak propellers.


5.2 Velocities in the wind
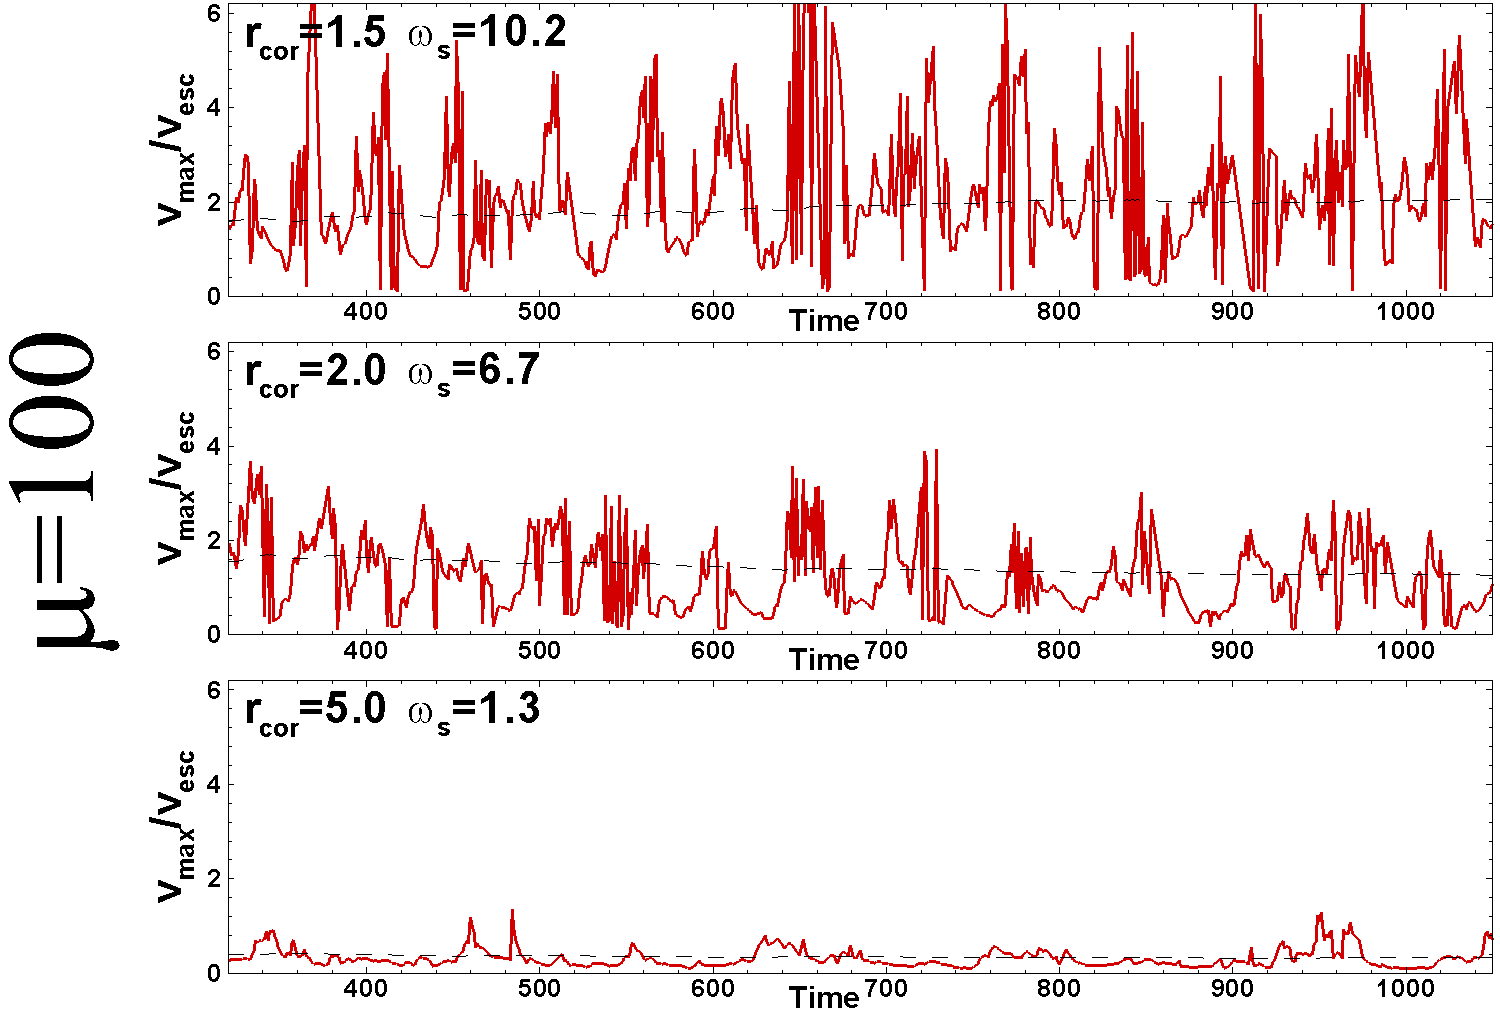
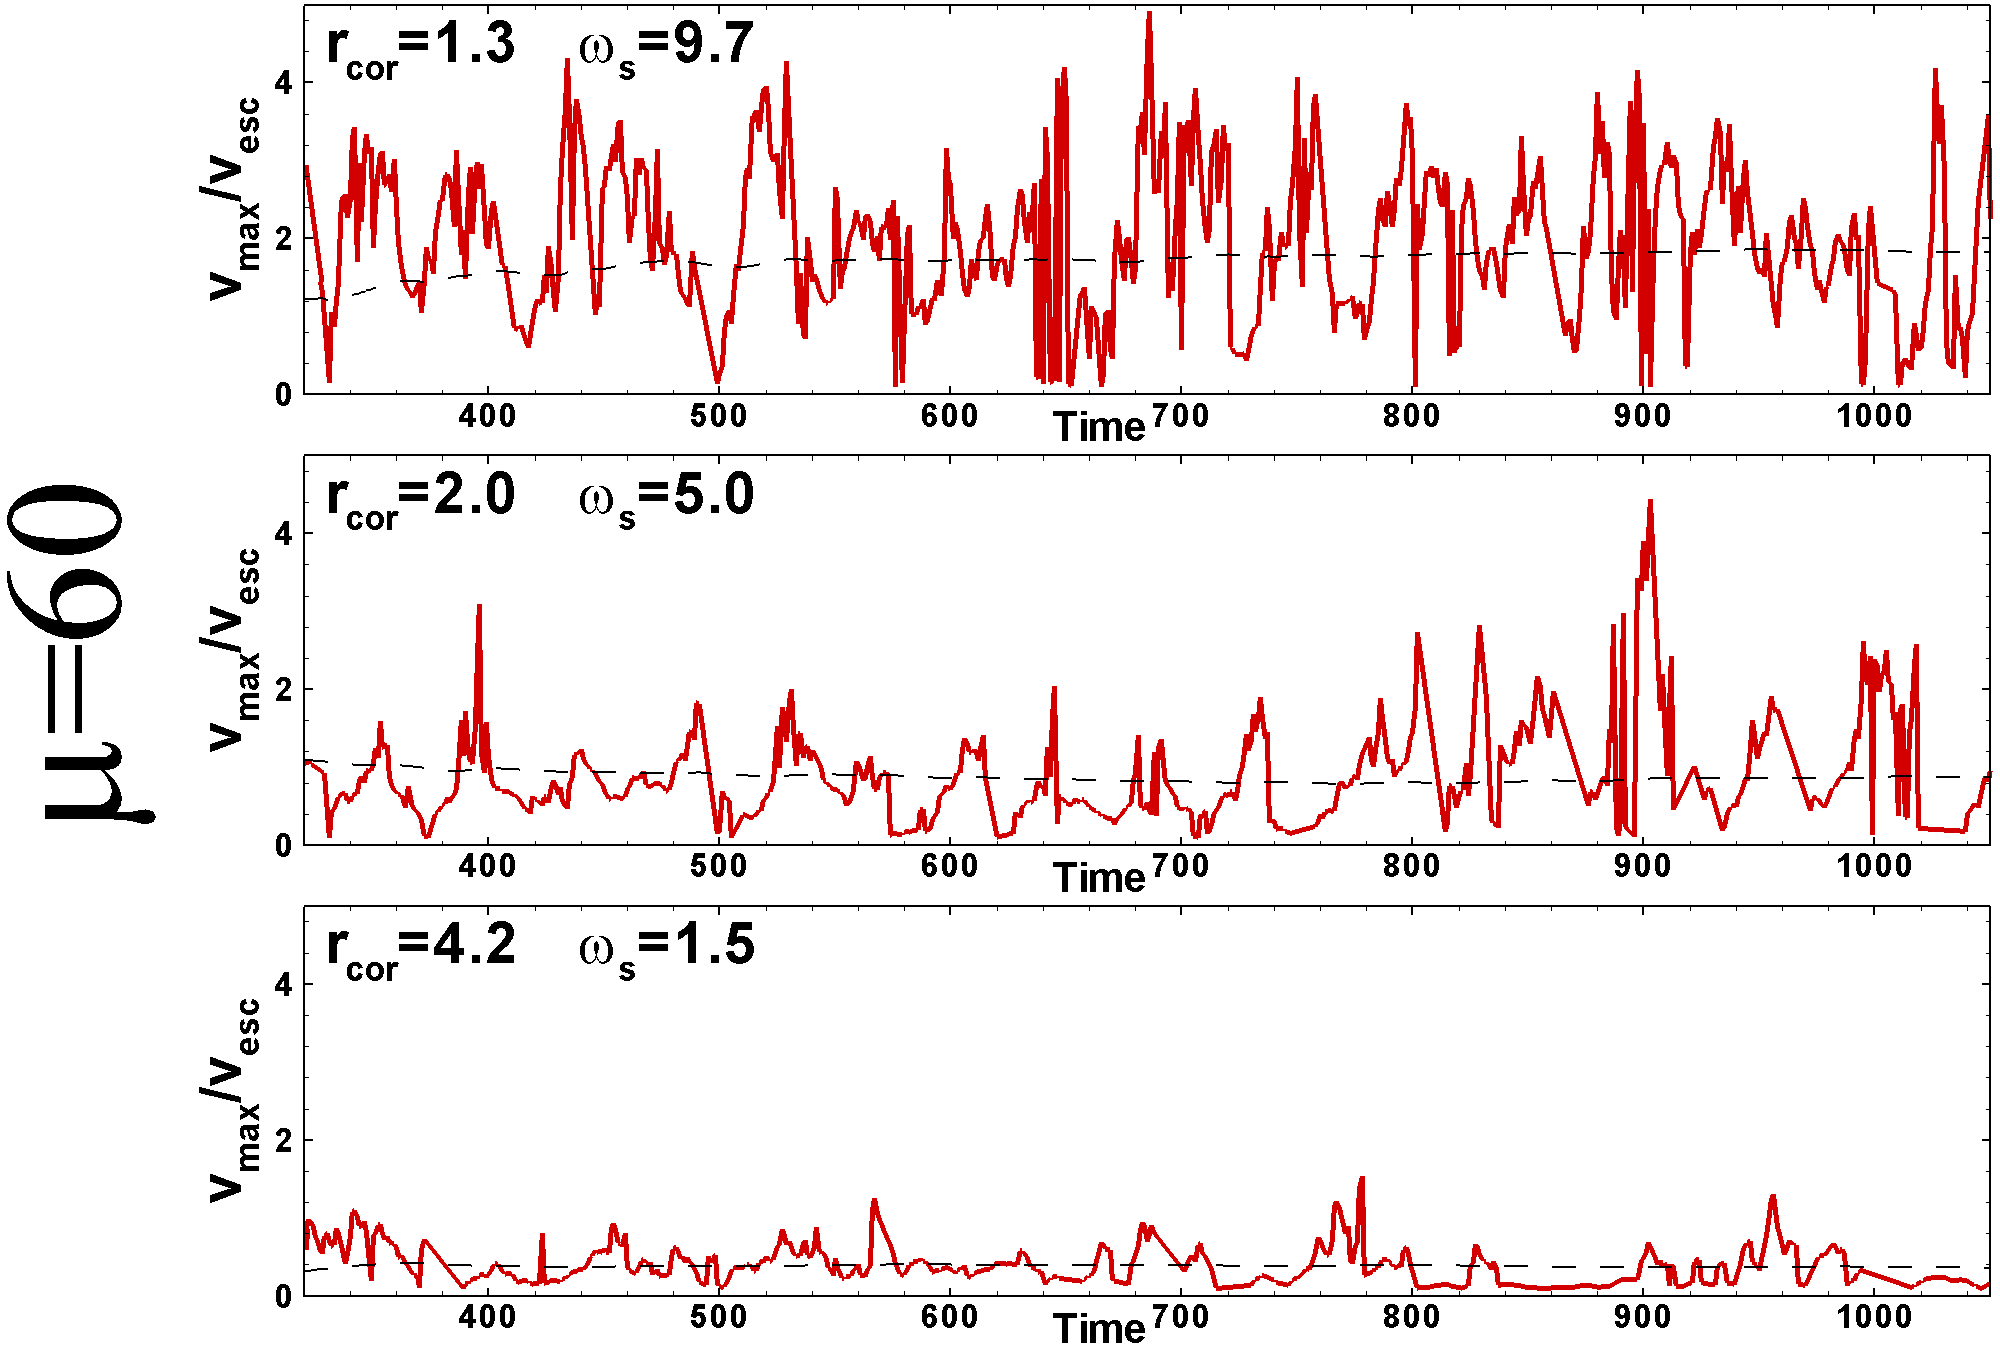
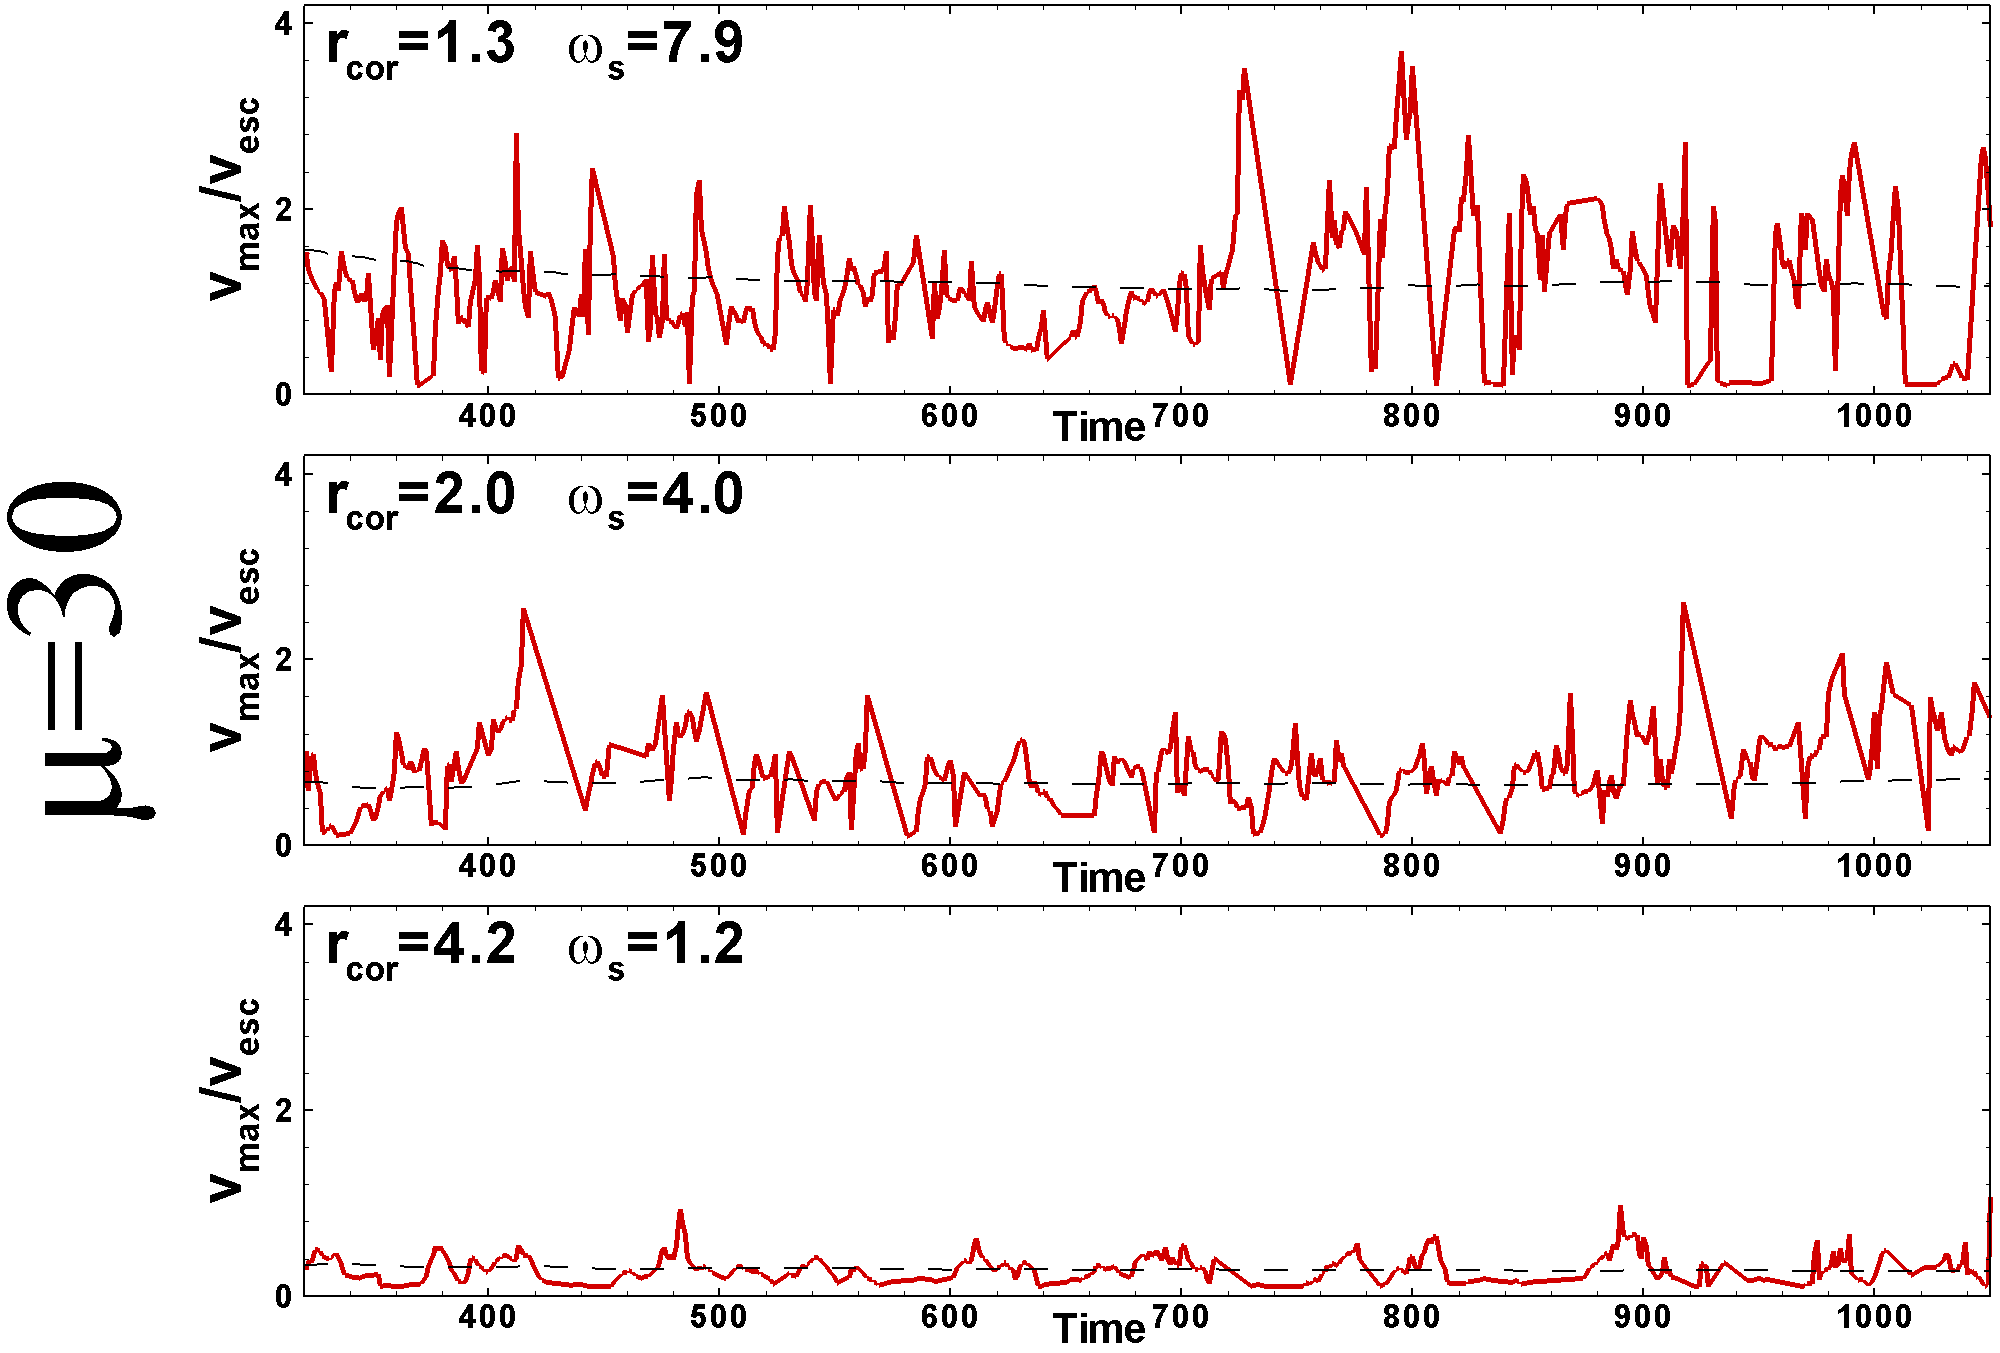
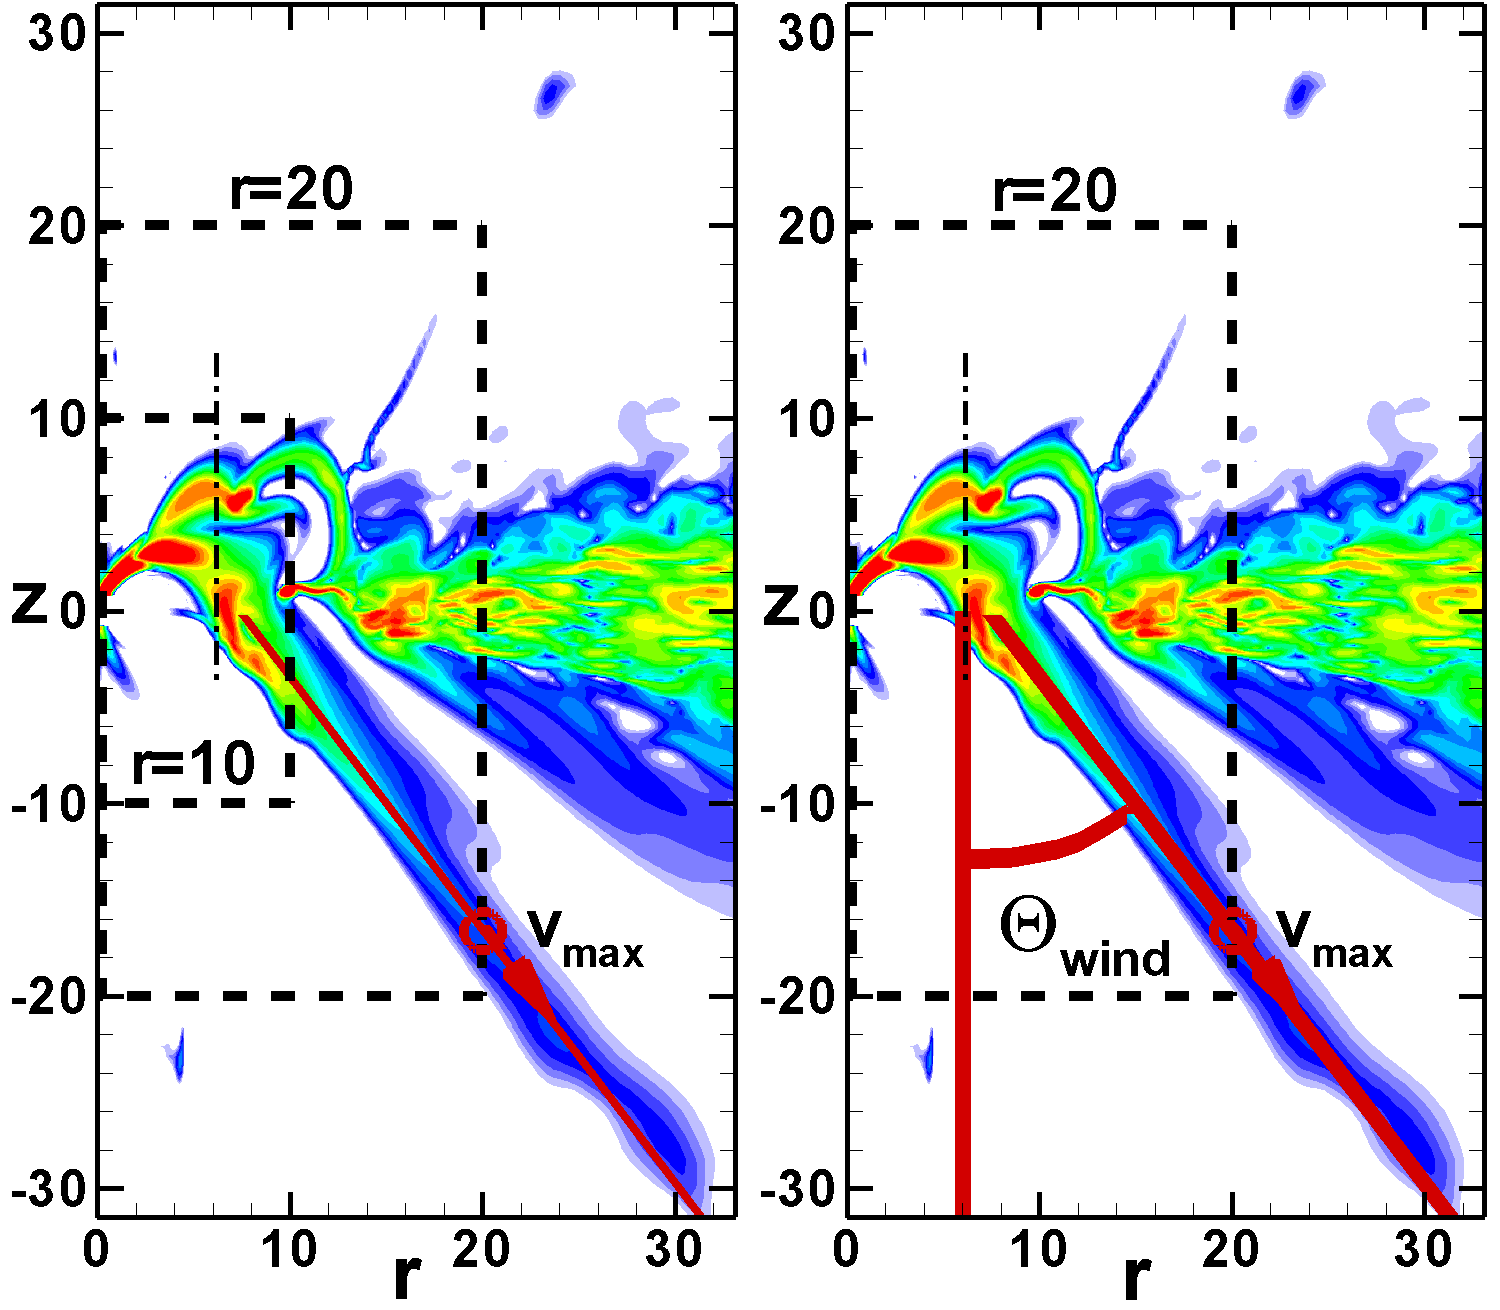
We investigated the velocities of matter in the wind component of propellers of different strengths. Most of the matter flows from the disk-magnetosphere boundary into the conical wind. To find the typical velocity of matter flow in each model, we chose a surface , which is a cylinder with dimensions and (see Fig. 8) 111111Note, that this cylinder is larger than that used for the calculation of matter fluxes, because matter in the wind often has low velocities at the disk-magnetosphere boundary, but is accelerated at larger distances from the star due to the magnetic force, and searched for the maximum poloidal velocity at this surface. The maximum velocity was calculated for the parts of the wind where the density is not very low (), so as to deselect the regions of very low density and high velocity flow in the axial regions. We also deselected the matter which moves at low velocities in the disk by the condition . We calculated the ratio , which shows whether the maximum poloidal velocity in the wind is larger or smaller than the local escape velocity .
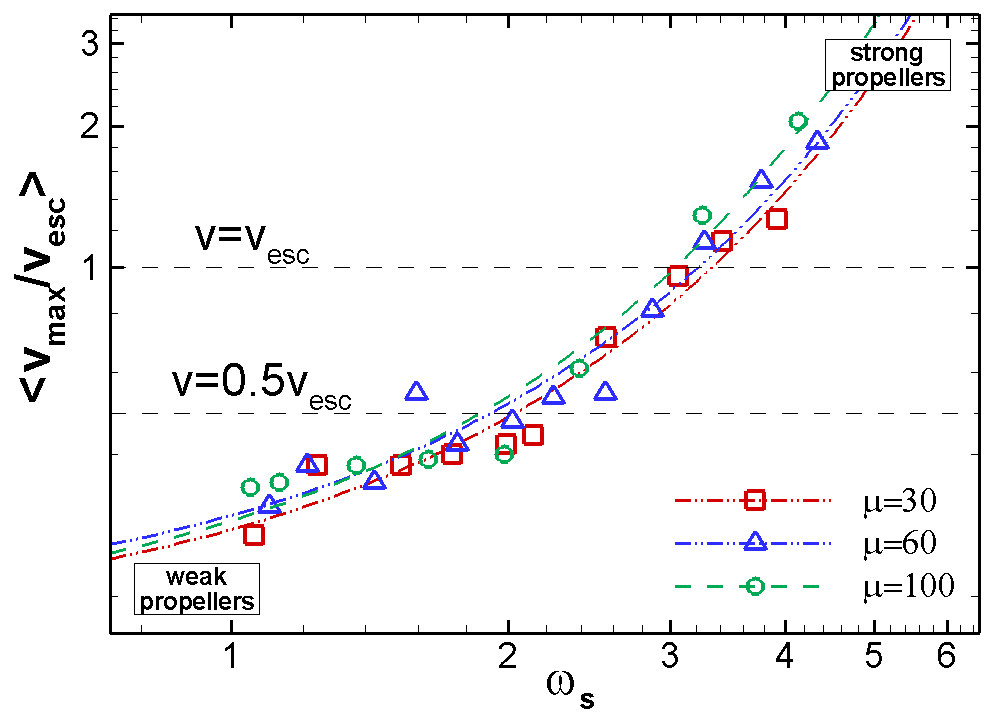
Fig. 9 (top panels) shows variation of the ratio with time in a strong (left panel) and weak (right panel) propeller. One can see that in the case of a strong propeller, this ratio varies in the range of during the bursts. In the case of a relatively weak propeller, the maximum velocity during the bursts is either slightly larger or slightly smaller than the escape velocity, so that . Some of this matter escapes the star’s gravity, while some of it returns back to the star or falls onto the disk at some distance from the star. In even weaker propellers, the maximum velocity in the wind is lower than the escape velocity, so that matter will fall back onto the star. Alternatively, it may contribute to the slowly-expanding turbulent magnetic corona. The left panels of Figs. 21, 22, and 23 from B show the variation of with time for some of the representative models.
To characterize the velocity of the outflows in each model, we calculated the time-averaged maximum velocity
| (13) |
These averaged velocities are approximately 2-3 times lower than the maximum velocities during the bursts to the wind (compare the dashed lines in top panels of Fig. 9 with the velocity maxima). For each model, we take the averaged velocity at time and use it for comparisons with other models.
5.3 Opening Angle of the wind
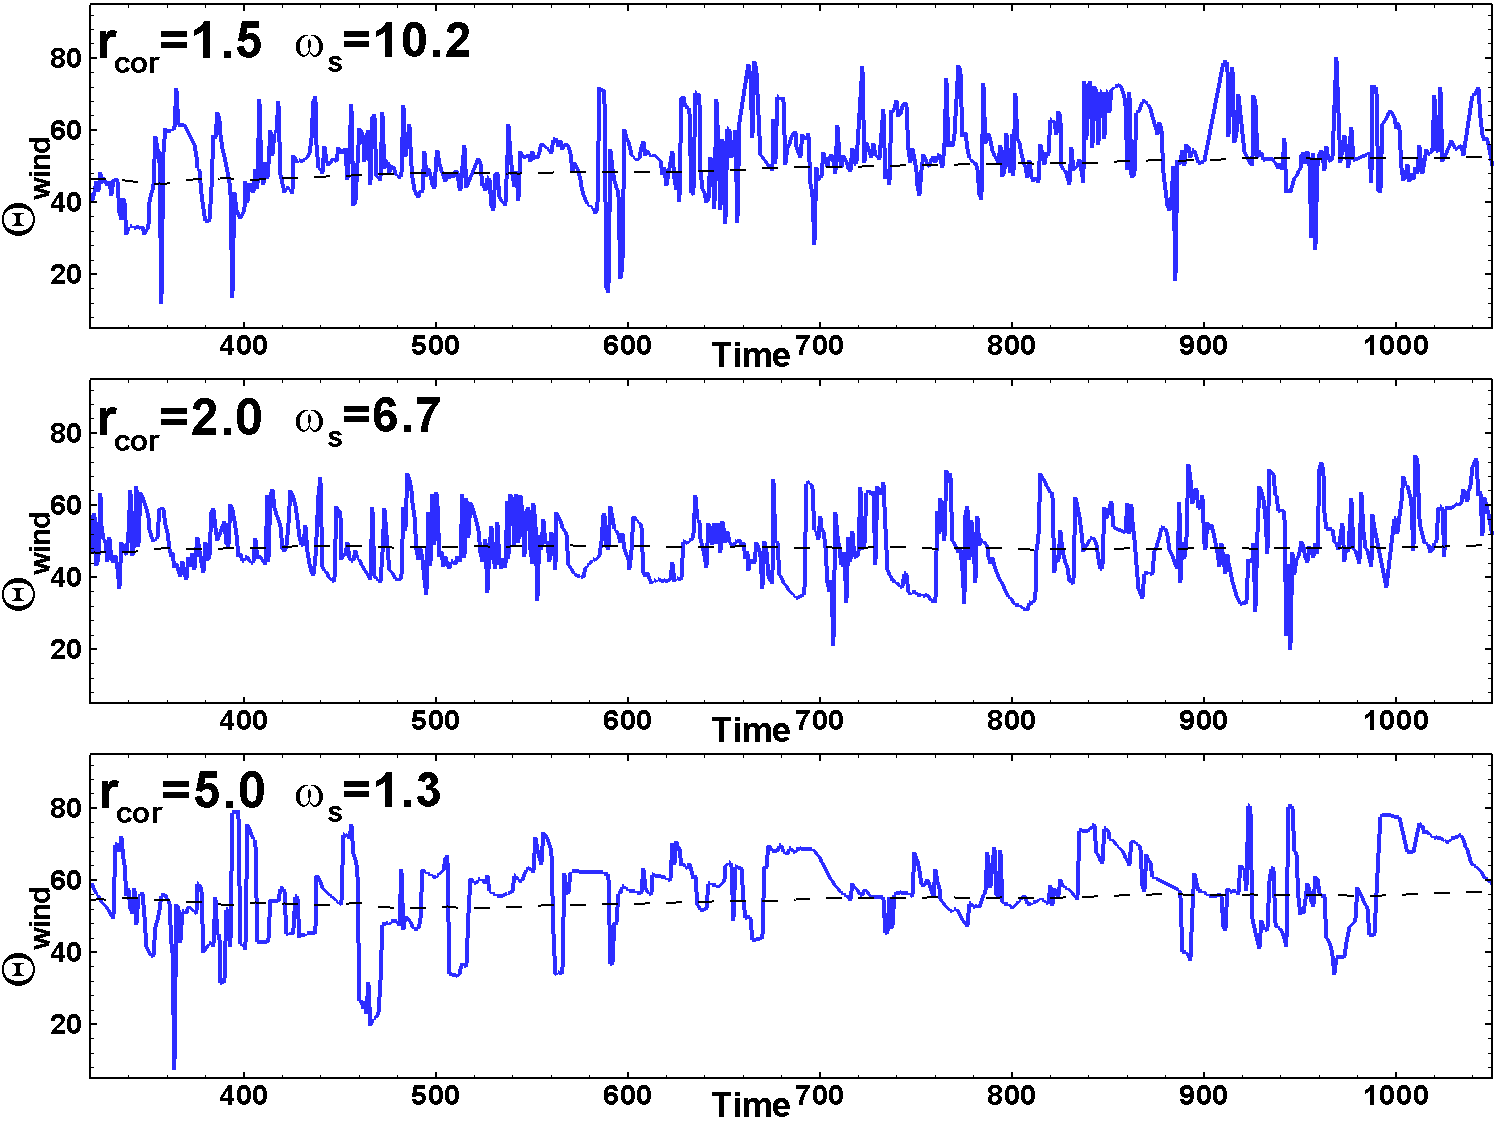
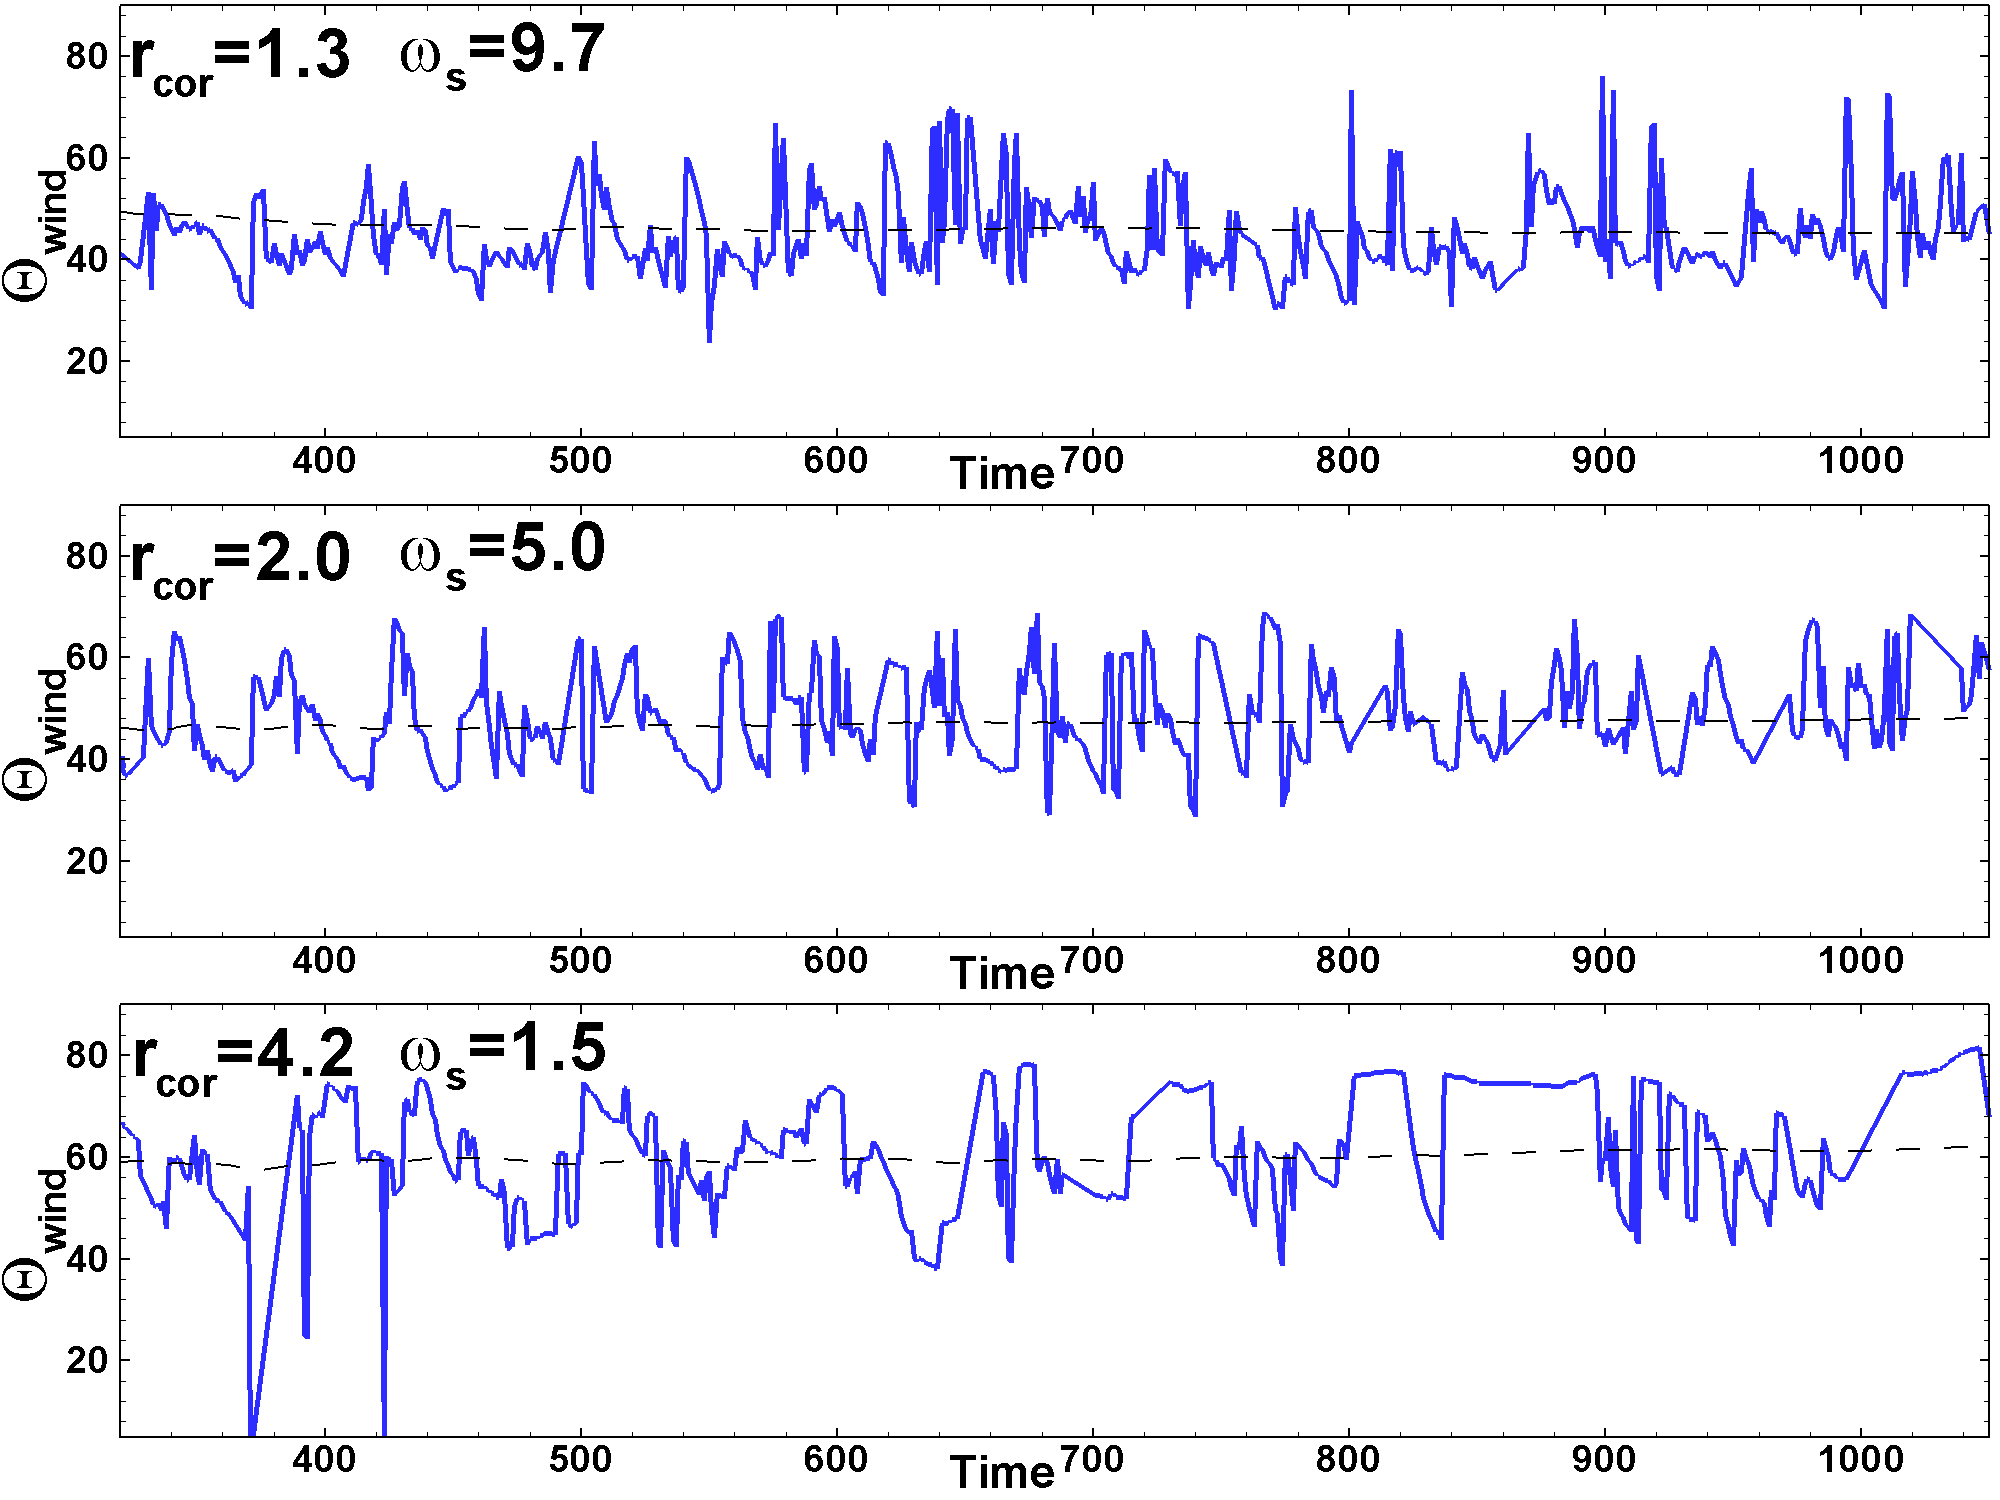
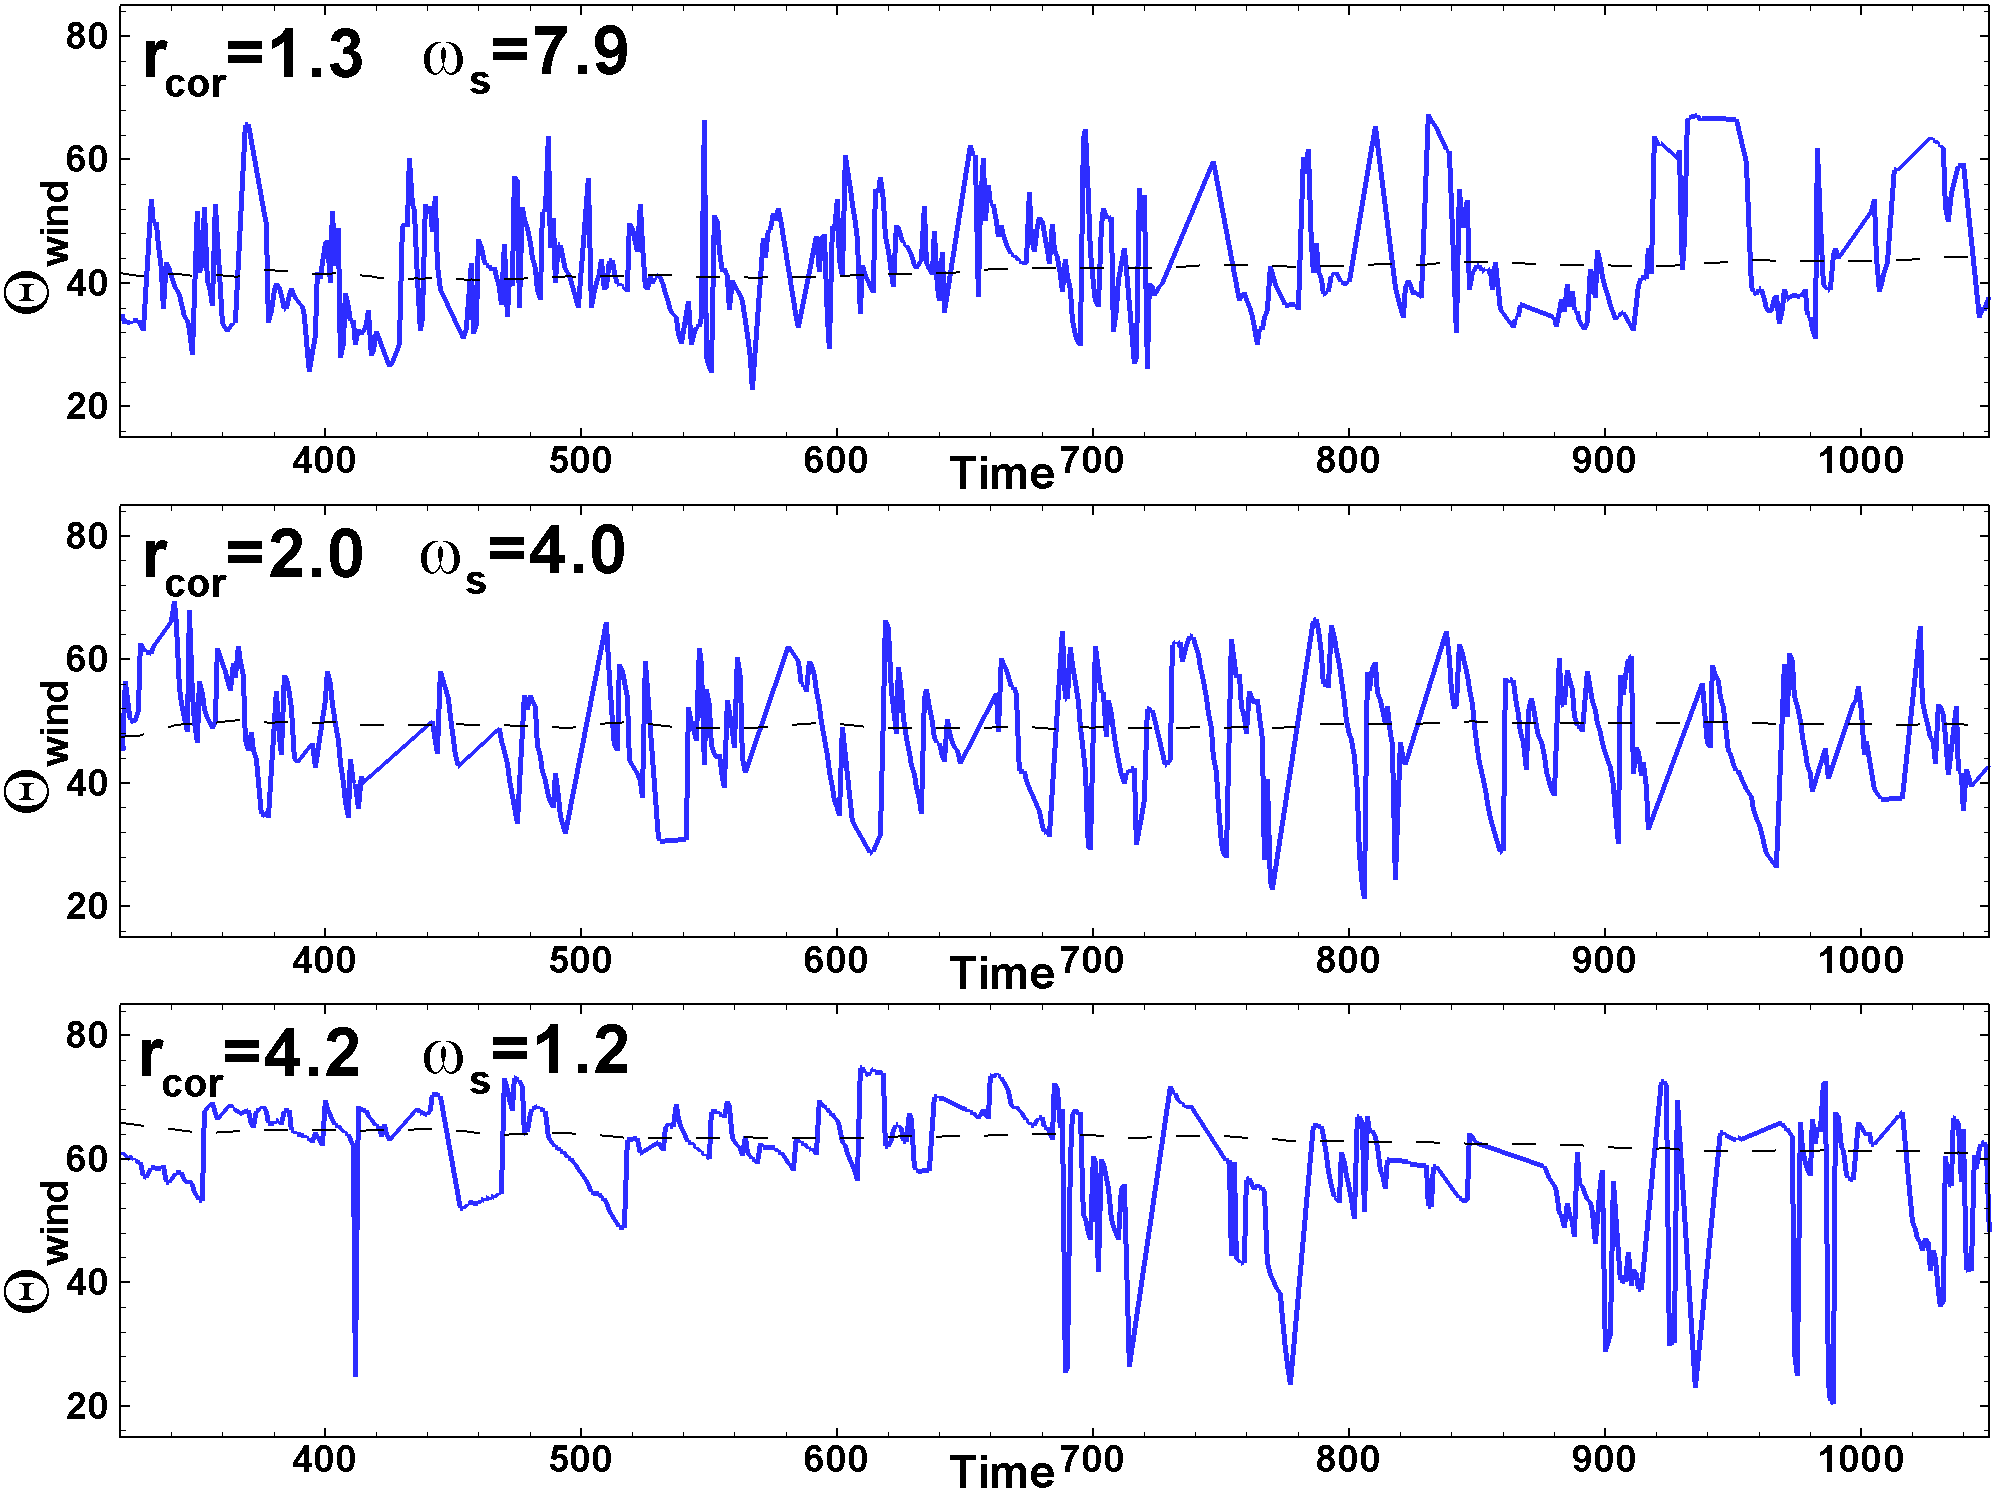
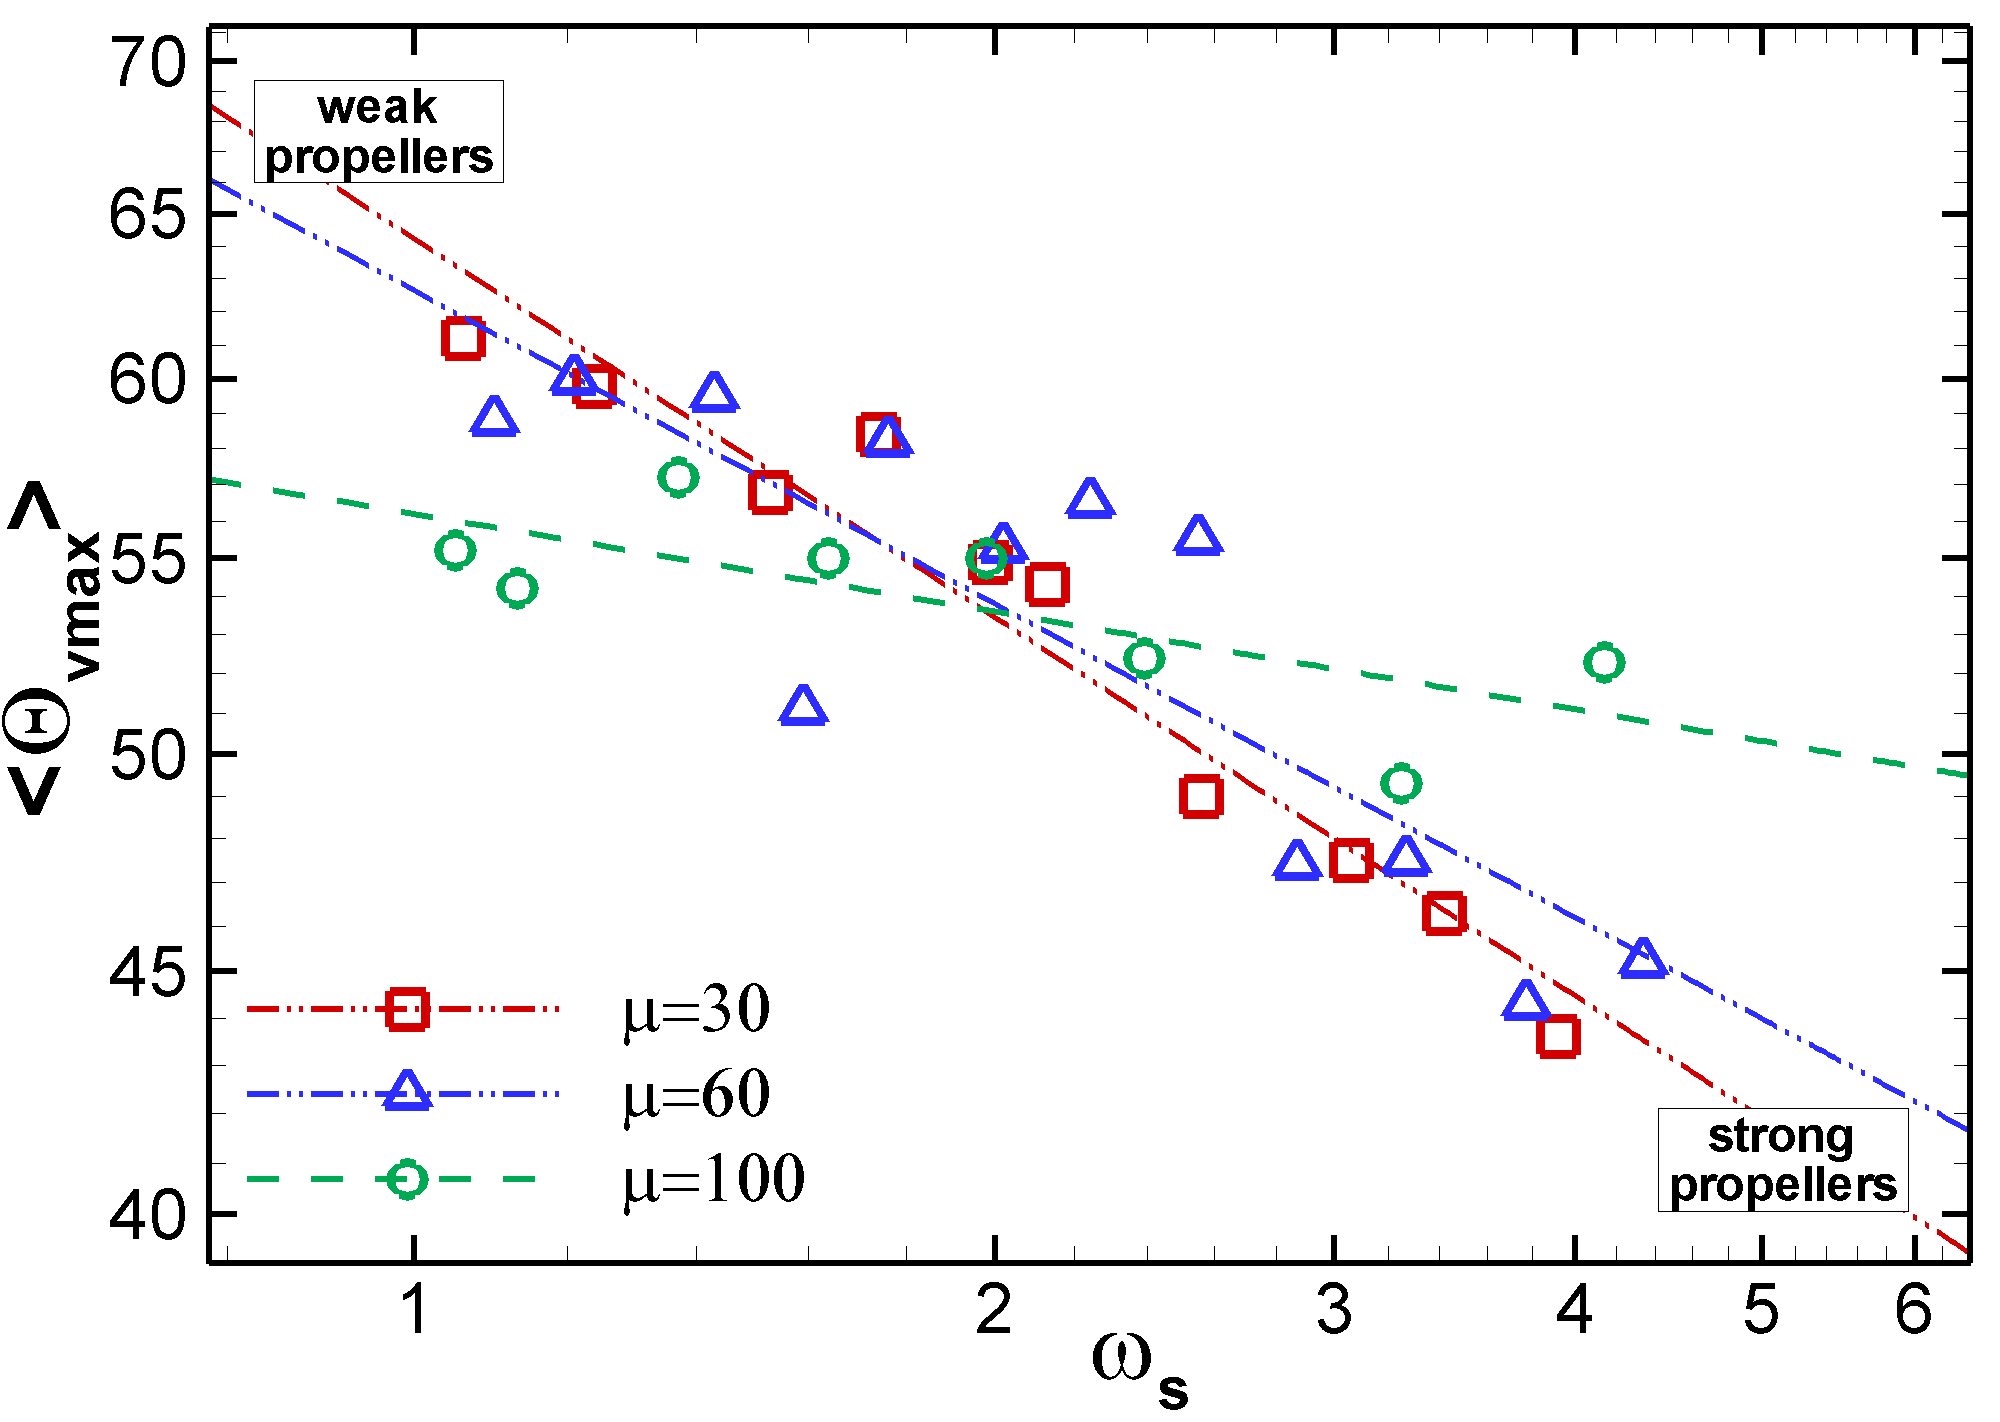
We also calculated the opening angle of the wind, , which we determined as the angle between the line connecting the inner disk to the point of maximum wind velocity (, located at the surface ) and the vertical line crossing the inner disk, (see right panel of Fig. 8). Simulations show that, in both the strong and weak propellers, the opening angle strongly oscillates (see Fig. 9, bottom panels). This angle is smaller in the cases of stronger propellers. Figures 21, 22, and 23 from B show the variation of with time in our representative models.
We calculated the time-averaged value of the opening angle for each model:
| (14) |
The dashed horizontal lines in Fig. 9 (bottom panels) show the time-averaged opening angles in our sample cases of strong and weak propellers. One can see that the time-averaged angle is approximately and in our examples of strong and weak propellers, respectively.
Fig. 10 (right panel) shows the dependence of the time-averaged opening angles, , taken for all models (at ), on the fastness parameter, . One can see that decreases with . The dependencies can be approximated by a power law (see Tab. 3). One can see that the dependencies are similar for and . However, in the models with the largest magnetospheres, , the slope is not as steep as in the other two cases.
The opening angle is large, , in the weak propellers. Velocities of outflows into the wind are also lower in the weak propellers, and, during the outbursts, can be comparable to or lower than the escape velocity. This wind matter may fall back to the disk at some distance from the star. In the weak propeller regime, a significant amount of matter may be recycled through the process of ejection from the inner disk boundary, the fall of this matter onto the disk at larger distances from the star, and subsequent inward accretion in the disk.

6 Angular momentum and energy
In the propeller regime, a star-disk system loses angular momentum and energy.
6.1 Angular momentum flow and the spin-down rate
In the propeller regime, a star loses its angular momentum and spins down (e.g., Lovelace et al. 1999). Angular momentum flows from the surface of the star along the field lines connecting the star with the disk and the corona. In addition, angular momentum flows from the inner parts of the accretion disk along the open field lines of the dipole, which have foot-points at the disk.
The angular momentum flux is calculated by integrating the angular momentum flux densities through some surface :
| (15) |
where and are the angular momentum flux densities carried by matter and magnetic field, respectively, and given by
| (16) |
Here, the normal vector to the surface points inward towards the star. To estimate the rate of stellar spin-down, , we calculated the angular momentum flux through the surface of the star, . We observed that the angular momentum flux is carried from the stellar surface by the magnetic field 121212We forbid the outflow of matter from the stellar surface and therefore the flux carried by matter is zero.. The red lines in Fig. 11 show variation of this flux in the cases of strong and weak propellers. We also calculated the fluxes carried by matter, , and by the field, , through surface 131313Here, we place the surface close to the inner disk, so that to take into account angular momentum which flows back to the disk along the closed field lines.. Fig. 11 shows these fluxes in blue and green, respectively. All fluxes strongly vary with time. Comparisons with the matter fluxes show that angular momentum fluxes are the largest during episodes of matter outflow.
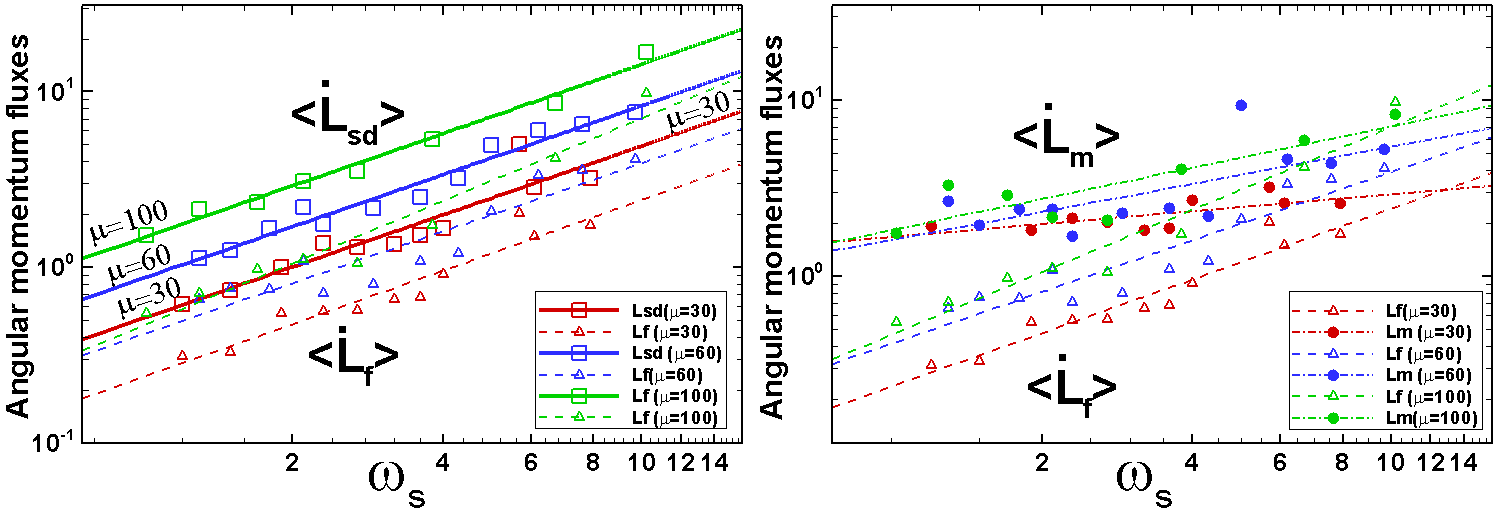
To compare the fluxes calculated for different models, we calculated the time-averaged values using a formula similar to Eq. 11. We calculated separately the fluxes of angular momentum carried from the surface of the star, , and the fluxes carried through surface by the magnetic field, , and by matter, . Fig. 12 shows these fluxes (taken at ) as a function of the fastness parameter, . The dependencies can be approximately described by power laws (see solid lines in Fig. 12 and dependencies in Tab. 4). One can see that the angular momentum fluxes are larger at larger values of . The left panel of Fig. 12 and Tab. 4 show that, in the models with the same values of , the angular momentum carried from the star, , is approximately twice as large as the angular momentum carried by the field, , through surface . This means that only a part of the angular momentum flows from the star to the inflated field lines. The other part (approximately half of ) flows into the disk along the closed field lines 141414This result is in agreement with that obtained by Ustyugova et al. (2006)..
In the weak propellers, magnetic angular momentum flux is associated with the inflation of the field lines and the outward propagation of magnetic flux. However, in the strong propellers, the magnetic flux acquires the form of a magnetic (Poynting flux) jet, where magnetic pressure accelerates the low-density plasma to high velocities inside the simulation region. This jet is magnetically-driven and also magnetically-collimated. The matter component of the flux through surface , , is associated with the centrifugally-driven conical component of the wind coming from the inner disk. The right panel of Fig. 12 shows that, at small values of , the angular momentum flux associated with matter, , is larger than that associated with the field, . However, at large values of they become comparable. In summary, the magnetic field carries angular momentum away from the star, while both matter and magnetic field carry angular momentum away from the star-disk system.
| Ang. mom. flux | |||
|---|---|---|---|
6.2 Energy fluxes
Propeller-driven winds and jets also carry energy out of the system. We calculated the energy fluxes carried by matter and magnetic field through surface :
| (17) |
where and are the energy flux densities carried by matter and magnetic field, given by
| (18) |
Here, the normal vector to the surface points inward towards the star. Fig. 13 shows an example of the temporal variations of energy fluxes in strong and weak propellers. One can see that the energy fluxes strongly vary in time, that is, energy is ejected into the outflows in the form of bursts.
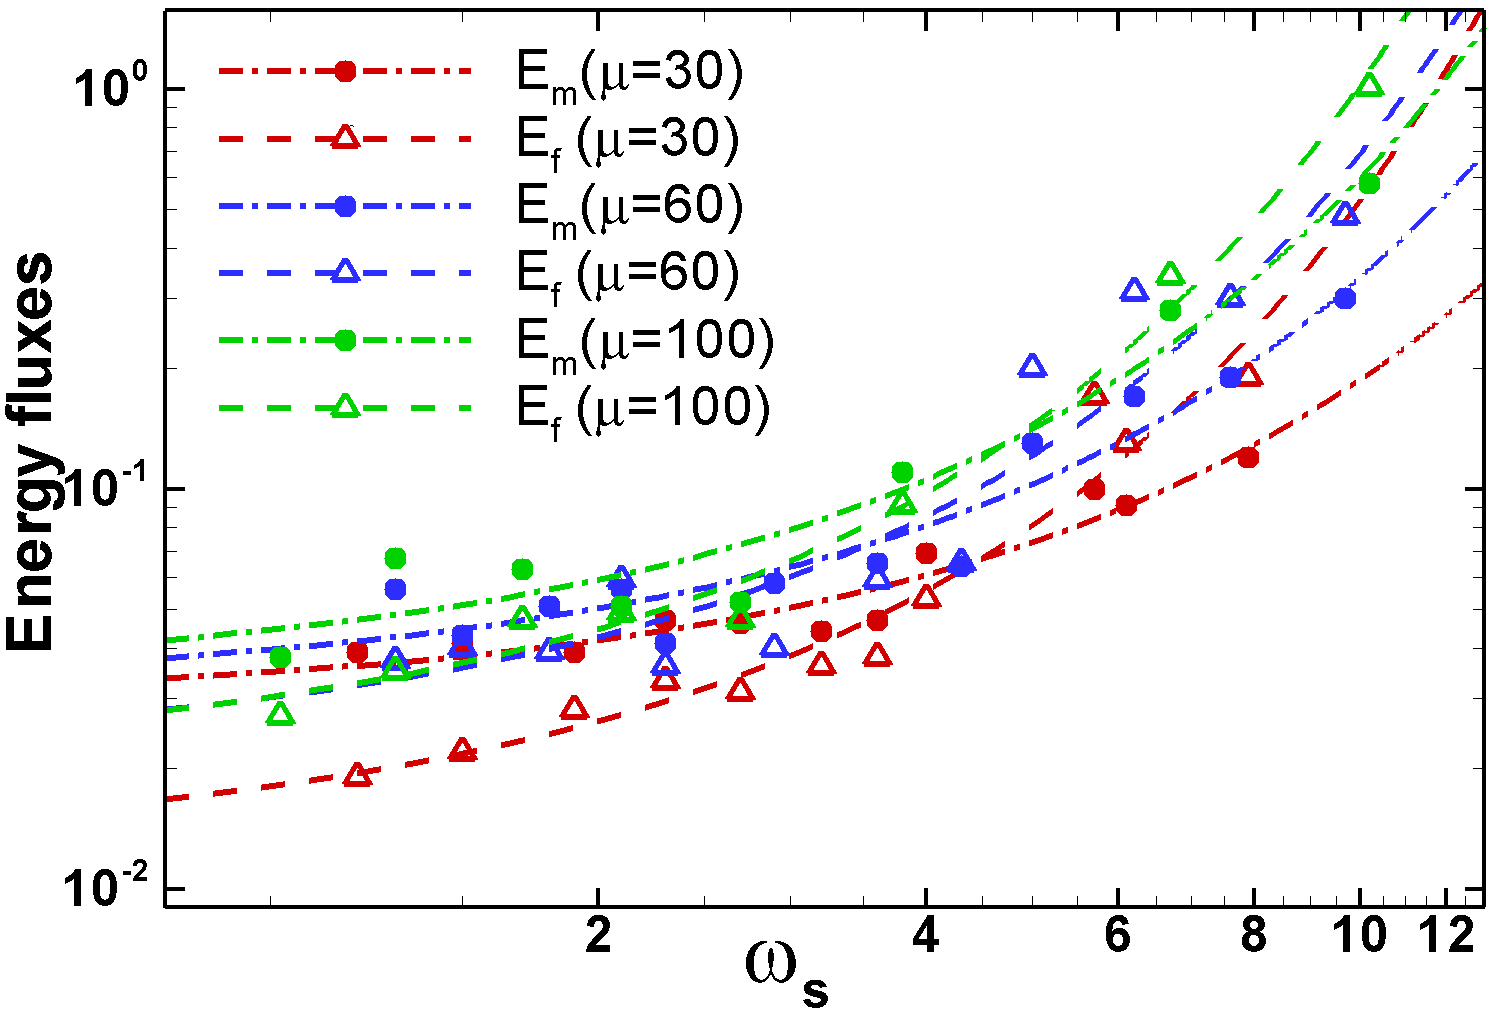
Fig. 14 shows the time-averaged energy fluxes and (taken at ) for all models. One can see that the fluxes increase with and are larger at larger values of . Table 5 shows the power law dependencies for fluxes at different values of .
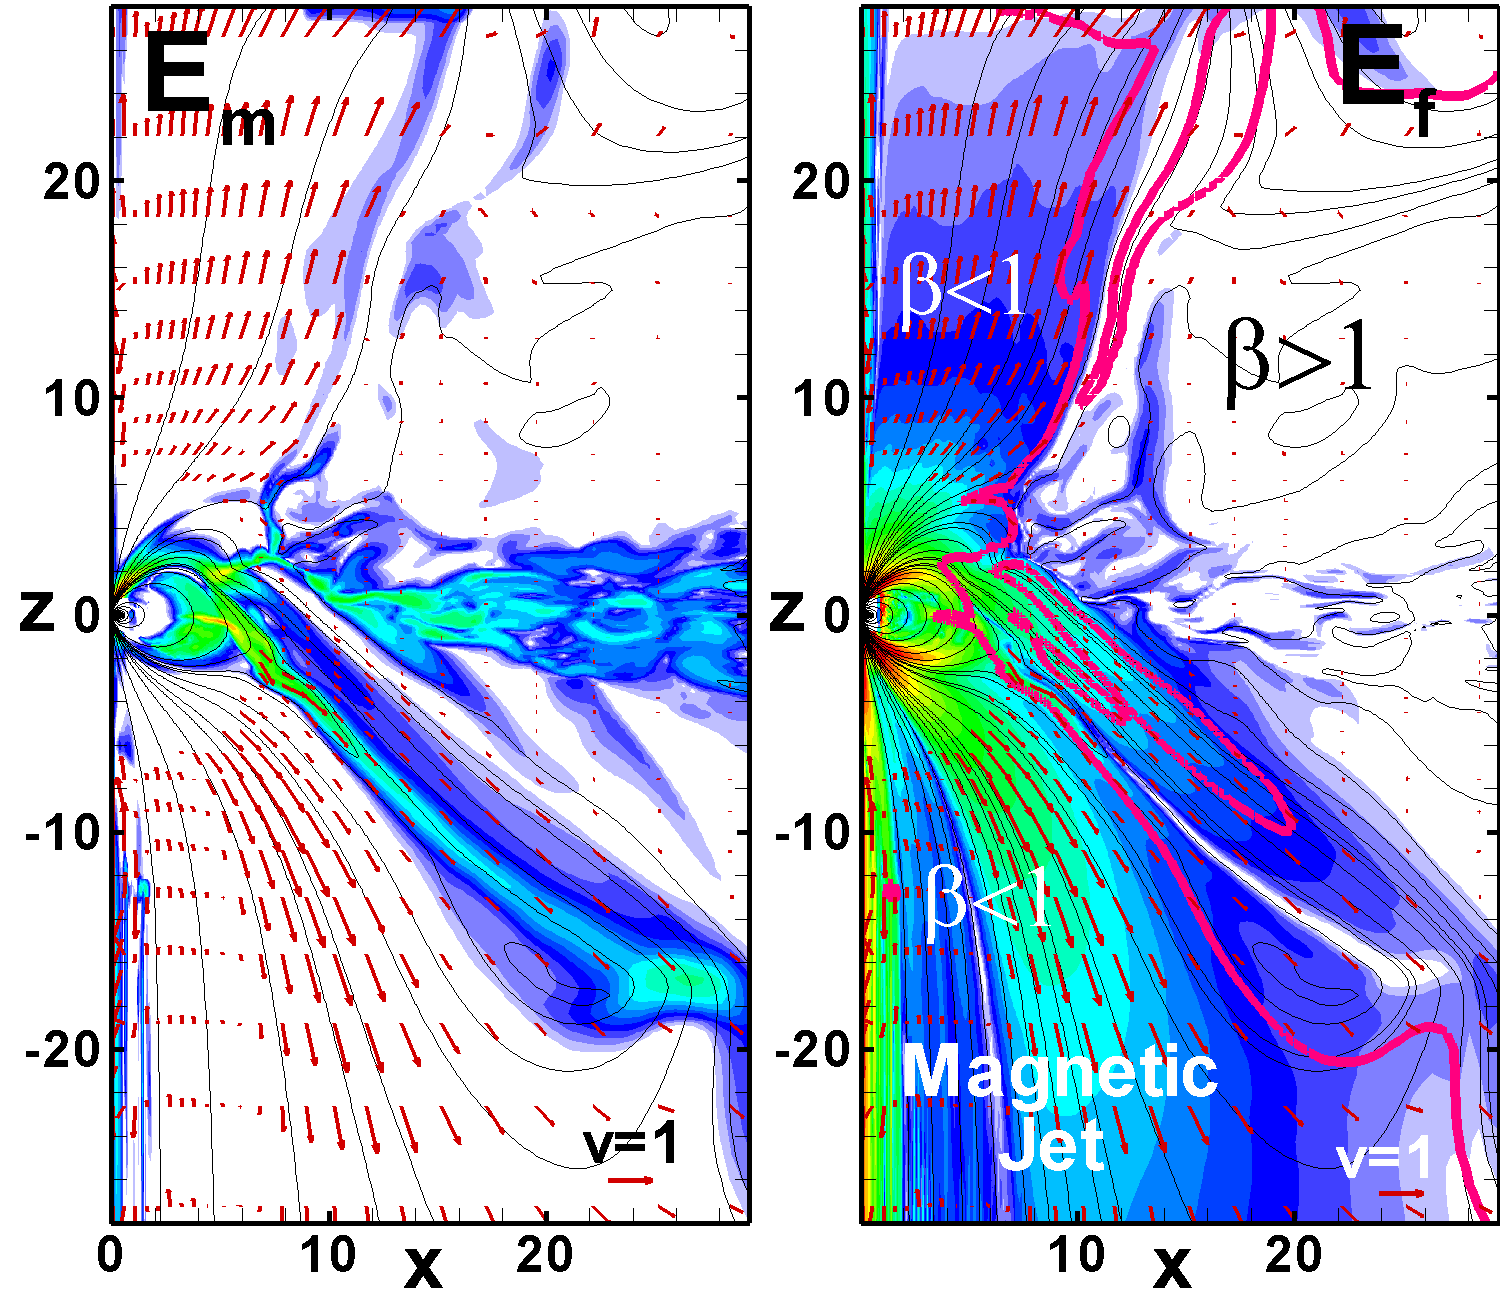
In both the strong and weak propellers, some energy is carried by matter from the inner disk into a conically-shaped wind. Additionally, in both cases, inflation of the field lines leads to the flow of magnetic energy out of the star. However, in the strong propellers, magnetic energy also flows into a non-stationary, magnetically-driven and magnetically-collimated low-density jet. Fig. 15 shows the distribution of energy flux density in a strong propeller (model ). The left panel shows that the energy carried by matter flows into the conically-shaped wind. The right panel shows the energy flux density associated with the magnetic field. One can see that this energy flux is large and is more collimated than the matter energy flux. This is the magnetically-dominated (Poynting flux) jet, where matter is accelerated and collimated by the magnetic field.

| Energy flux | |||
|---|---|---|---|
7 Summary of wind properties in strong and weak propellers
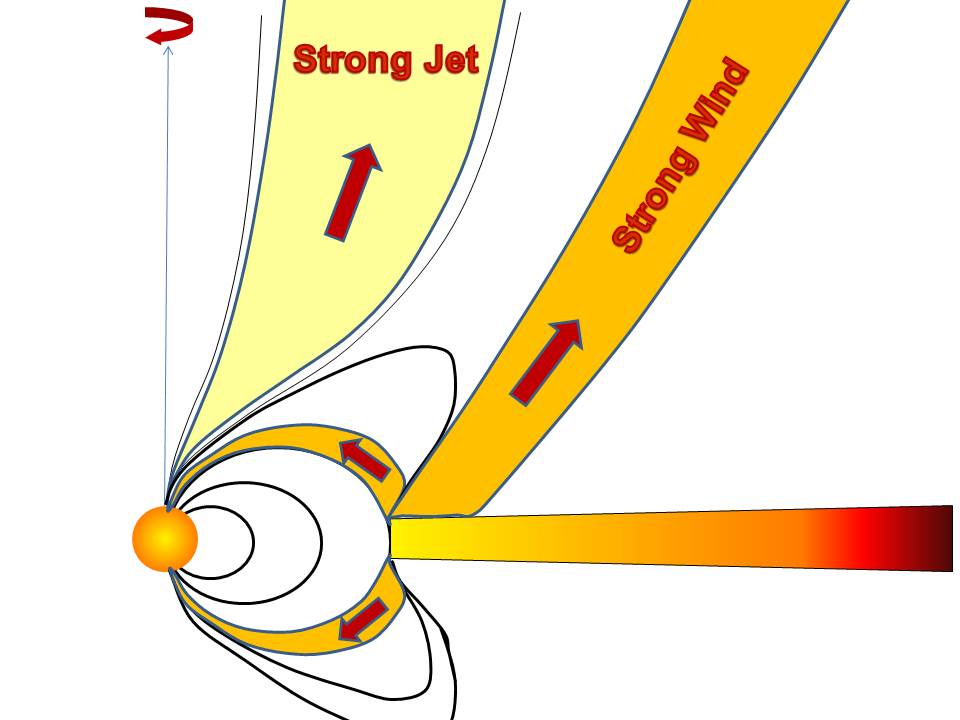
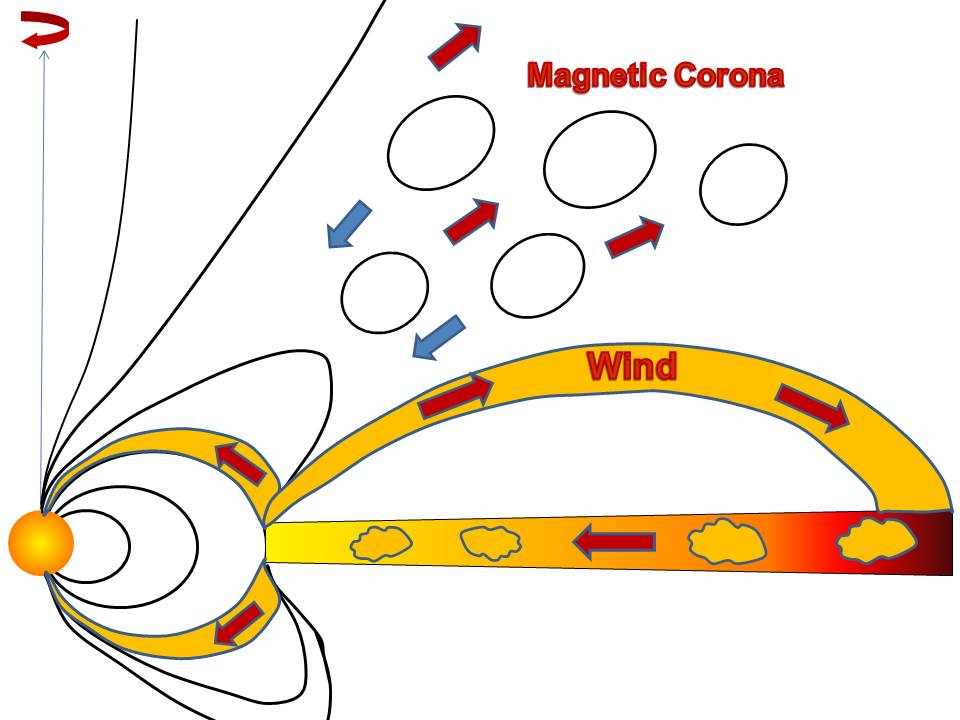
To summarize the specifics of matter flow in propellers of different strengths, we show two sketches that demonstrate the properties of strong and weak propellers during accretion/outburst events (see left and right panels of Fig. 16).
-
1.
In the strong propeller regime (left panel), matter flows from the inner disk into the disk wind along the open field lines connecting the disk with the corona. This wind has high super-escape velocities and relatively small opening angles, . Such a wind may flow to large distances from the star, forming large-scale wind structures. Alternatively, it may be collimated by the external medium, forming a jet. There is also a low-density, high-velocity, magnetically-dominated and magnetically-driven Poynting flux jet, whose matter flows along the stellar field lines. This jet carries a significant amount of energy and angular momentum away from the star. In a typical case of non-stationary ejections, shock waves are expected to form along the flow, where particles may be accelerated to high energies. In summary, a strong, two-component outflow is expected in strong propellers.
-
2.
In the weak propeller regime (right panel), matter flows from the inner disk into the low-velocity wind, where the maximum velocity is comparable with or lower than the local escape velocity. Matter flows into the conical wind at large opening angles, . This wind partly forms the large-scale outflow structures, and partly falls back onto the disk at some distance from the star. The fallen matter then accretes back towards the disk-magnetosphere boundary and is again ejected into the slow, conically-shaped wind. Such recycling of inner disk matter is expected in many weak propellers. In addition, inflation and reconnection of the field lines lead to the formation of magnetic islands, which are ejected at low, sub-escape velocities, forming the slow, magnetically-dominated wind. Some of this matter may accrete back to the star, driven by gravitational force.
We should note that, in both the strong and weak propellers, matter accretes (and is ejected) during brief episodes, and the inner disk strongly oscillates. Therefore, in both cases, strong variability in the light curves is expected.
8 Time intervals between accretion/ejection events
Here, we estimate the characteristic time intervals between accretion/ejection events. Simulations show that accretion/ejection events are typically associated with a cycle in which (1) Matter accumulates at the inner disk and slowly moves inward, (2) Matter of the inner disk penetrates through the external regions of the magnetosphere and the field lines begin to inflate, (3) Matter partly accretes onto the star and partly flows into the wind, (4) The magnetosphere expands and the cycle repeats. An outflow becomes possible when the field lines inflate and open.
Here, we consider two possible scenarios: (1) The diffusivity at the disk-magnetosphere boundary is relatively high, and matter penetrates through the disk-magnetosphere boundary rapidly (we observe this in most of our simulation runs); (2) The diffusivity is low, so that the inner disk matter gradually penetrates through the magnetosphere.
8.1 High Diffusivity Scenario
Let’s suggest that, after an event of accretion/ejection, the magnetosphere is “empty” and the inner disk is located at some radius . Then, matter of the inner disk gradually penetrates through the external layers of the magnetosphere due to some 3D instabilities. The depth of the penetration is unknown. However, we can suggest that this matter penetrates into the magnetosphere up to some depth and then stops at some distance from the star due to an even stronger centrifugal barrier of the propelling star 151515This scenario is observed in most of our simulation runs. In parallel, new matter comes in from the disk to its inner parts with an accretion rate . It carries the angular momentum flux
| (19) |
The dipole magnetic field of the star inflates due to the difference between the angular velocity of the star, , and the disk, . Angular momentum flows from a unit length of the disk at radius to the inflating field lines. Its value (per unit length) is:
| (20) |
where is the magnetic field at . Inflation occurs when the angular momentum of matter in the disk is larger than the angular momentum required for inflation:
| (21) |
Therefore, the next episode of inflation will occur after an interval of time , if
| (22) |
Taking into account the fact that and definition of fastness, , we obtain:
| (23) |
To find the characteristic time interval between inflation events in our simulations, we re-write this condition in dimensionless form using the dimensionalization procedure from A.3: , (where is the period of rotation at ), etc., and obtain Eq. 23 in dimensionless form:
| (24) |
Here, we take into account the fact that and remove all tildes above the dimensionless variables.
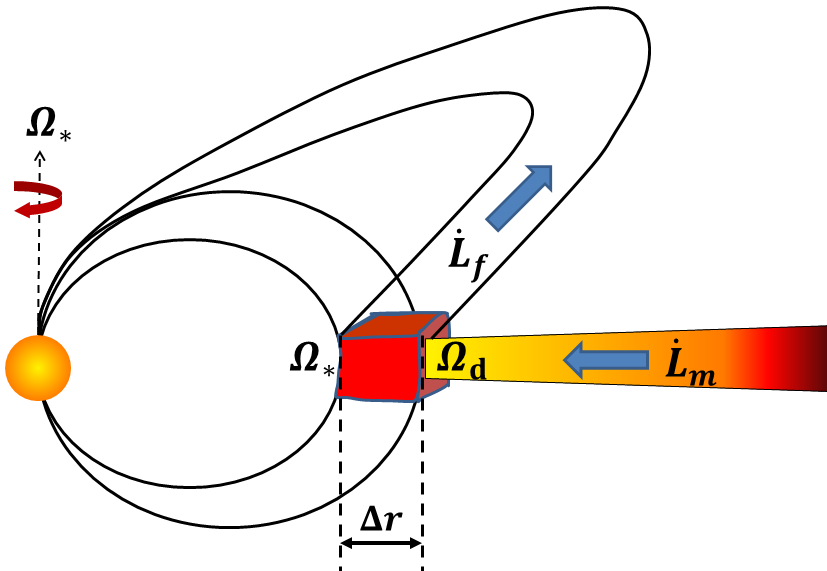
8.2 Low Diffusivity Scenario
At a low diffusivity rate, matter of the inner disk slowly penetrates through the external layers of the magnetosphere (in the direction of the star), and the depth of penetration is proportional to the time interval : , where is the diffusivity coefficient. During this time interval , matter accretes towards the inner disk and is accumulated in the amount of . This matter carries the angular momentum flux described by Eq. 19, and the inflating field lines (which thread the ring with width ) carry away the angular momentum flux described by Eq. 20. Inflation becomes possible when the angular momentum flux carried by matter becomes larger than the angular momentum flux carried by the field:
| (25) |
Therefore, the next episode of inflation occurs after an interval of time , if
| (26) |
Here, we have already converted the time interval to dimensionless units and removed the tilde’s.
One can see that the time interval is proportional to the diffusivity coefficient, , and all the variables that is dependent on have coefficient powers that are twice as high as those in the high-diffusivity scenario (see Eq. 24).
8.3 Comparison with simulations
In our model, the diffusivity is high, so we take Eq. 24 (for the high diffusivity scenario) and compare the time intervals obtained with this formula with the time intervals between episodes of accretion obtained in our simulations.
Eq. 24 shows that in stars with a larger magnetospheric parameter the time interval should be larger. To check the dependence on , we compare the time intervals between the bursts in models with different values of parameter (see left panels of Figures 18, 19 and 20 from B). One can see that, in the models with comparable values of , the time intervals between the main bursts are larger at than at and . This trend is even more clear if we compare the variation of the inner disk radius (compare the right panels of the same figures).
Eq. 24 also shows that the time interval should increase when the difference becomes small. Therefore, the time intervals between bursts of accretion should be larger in the weaker propellers. The left panels of Figures 18, 19 and 20 show that, for each value of , the time interval between accretion/ejection events increases when the fastness parameter decreases. Therefore, Eq. 24 describes the dependence on these two parameters correctly. Eq. 24 also shows that the time interval increases when the accretion rate decreases. In our simulations, we did not vary the initial accretion rate in the disk. However, we observed that in some long simulation runs the accretion rate decreases and the time interval increases, which is consistent with the theoretical dependence.
9 Applications to Different Types of Stars
In this section, we provide convenient estimates and formulae for the application of our model to different types of stars.
9.1 Application to accreting millisecond pulsars
For accreting millisecond pulsars, we take the mass and radius of the star to be and km, respectively, and the magnetic field to be G. Using equations 51, 52 and 53, we obtain the reference values for matter, angular momentum and energy fluxes in the following form:
| (27) |
| (28) |
| (29) |
where , , G, and . For example, to obtain the dimensional matter fluxes to the star, , and to the wind, , one should take the dimensionless values and from Tab. 1 and multiply them by :
| (30) |
Analogously, we can find the energy fluxes to the wind/jet associated with matter and magnetic field:
| (31) |
A star in the propeller regime spins down. The spin-down energy flux (spin-down luminosity) is:
| (32) |
where is the period of a neutron star in milliseconds. The spin-down time scale can be estimated as
| (33) |
where is the angular momentum of the star, is the star’s moment of inertia, . Substituting in , , and taking from Tab. 6, we obtain:
| (34) |
We can re-write the last term of Eq. 34, , in the following way. From Tab. 4 we note that the spin-down flux is proportional to the fastness parameter, , and there is also an approximately linear dependence on : . On the other hand, using the definition of the fastness parameter, , we can re-write as and obtain the following relationship:
| (35) |
and the time scale in the form of
| (36) |
The spin down time-scale does not depend on the angular velocity of the star, , because the faster rotators have larger spin-down rates but also a larger amount of initial angular momentum. Eq. 36 shows that in stars with the same mass, radius and magnetic field, the spin-down time scale is roughly the same in models with the same magnetospheric radius .
Using the values of from Table 1, we obtain the time scales in the range of yrs.
In application to millisecond pulsars, the rate of spin-down is often measured as the rate of variation of frequency with time, (in Hz/s). Taking into account the fact that the angular momentum of the star and the angular momentum flux from the star , we obtain:
| (37) |
where Hz.
The time interval between accretion/ejection events varies in the range of in dimensionless units. To convert to dimensional units of time, we multiply this value by the reference period of rotation, s, and obtain ms.
9.2 Application to cataclysmic variables
For cataclysmic variables, we take the mass and radius of the star to be and km, respectively, and the magnetic field to be G. We obtain the reference values for matter, angular momentum and energy fluxes in the following form:
| (38) |
| (39) |
| (40) |
where where , and G.
We can obtain the spin-down luminosity of the star in a convenient form:
| (41) |
where is the period of the star in seconds.
Using Eq. 33 and the value for the moment of inertia for white dwarf, , we obtain the spin-down time scale in a form similar to that obtained for millisecond pulsars:
| (42) |
Using the values of from Table 1, we obtain the time scales in the range of yrs.
The time interval between accretion/ejection events varies in the range of in dimensionless units. To convert to dimensional units of time, we multiply this value by the reference period of rotation, s, and obtain s.
9.3 Application to CTTSs
In application to Classical T Tauri stars, we take the mass and radius of the star to be and , respectively, and the magnetic field to be G.
We obtain the reference values for matter, angular momentum and energy fluxes in the following form:
| (43) |
| (44) |
| (45) |
where , , and G.
Using Eq. 33 and the value for the moment of inertia of CTTSs, , we obtain the spin-down time scale in a form similar to that obtained for millisecond pulsars and CVs:
| (46) |
Using the values of from Table 1, we obtain the time scales in the range of yrs. These time scales are in agreement with the observations of CTTSs, which show that CTTSs are already slow rotators after 1-10 million years.
The time interval between accretion/ejection events varies in the range of in dimensionless units. To convert to dimensional units of time, we multiply these values by the reference period of rotation, days, and obtain days. A recent analysis of the light-curves of accreting young stars in the Oph and Upper Sco regions of star formation (obtained with the K-2 Kepler mission) has shown that bursts of accretion occur every 3-80 days (Cody et al., 2017). Stars with infrequent bursts may be in the propeller regime.
10 Conclusions and Discussions
We performed axisymmetric simulations of accretion onto rotating magnetized stars in the propeller regime, ranging from very weak to very strong propellers. We used the fastness parameter to characterize the strength of the propellers. We observed that many properties of the propellers depend on the fastness parameter.
10.1 Main conclusions
The main conclusions are the following:
1. Both accretion and outflows are observed in propellers of different strengths. The relative amount of matter ejected into the outflows (propeller efficiency, , see Eq. 12) increases with as a power law.
2. The accretion/ejection cycle is observed at different propeller strengths. In this cycle: (a) Matter of the inner disk slowly moves inward and penetrates through the field lines of the external magnetosphere, (b) The magnetic field lines inflate and open. Matter partly accretes onto the star and is partly ejected into the outflows along the inflated field lines. (c) The magnetosphere expands and the cycle repeats. Most of the time matter accumulates in the inner disk, while the accretion/ejection events occur during brief intervals of time.
3. The inner disk oscillates. The time-averaged inner disk (magnetospheric) radius is larger than the corotation radius . In spite of this, matter accretes onto the star. Accretion is possible due to the fact that (a) only the closed part of the magnetosphere represents the centrifugal barrier, (b) the process is non-stationary: accretion occurs in brief episodes as the inner disk moves closer to the star.
4. The velocity of matter ejected into the wind is different in propellers of different strengths: (a) In strong propellers, the maximum velocity of ejecting matter is a few times larger than the local escape velocity; (b) In weak propellers, the maximum velocity is slightly larger or smaller than the escape velocity; (c) In very weak propellers, matter is ejected at sub-escape velocities, forming a turbulent corona above the disk. The time-averaged velocity of matter ejected into the wind increases with the fastness parameter () exponentially.
5. The time-averaged opening angle of the wind is also different in propellers of different strengths: (a) In strong propellers, this angle is relatively small, . (b) In weak propellers, it is larger, . The opening angle decreases with as a power law.
6. A star in the propeller regime spins down due to the outward angular momentum flow along the field lines. Approximately half of the angular momentum flows to the disk along the closed field lines. The other half flows along the open field lines connecting the star with the corona.
7. A star-disk system loses mass, angular momentum and energy. Most of the matter flows from the inner disk into a conically-shaped wind, which carries the energy and angular momentum associated with that matter. In addition, the inflating field lines carry angular momentum and energy associated with the magnetic field. In the strong propellers, the field lines originating at the star wind up rapidly and form a magnetically-dominated and magnetically-driven (Poynting flux) jet, which accelerates a small amount of matter to high velocities. This jet takes a significant amount of angular momentum out of the star. In addition, it carries angular momentum and energy out of the system. Ejections to the conical wind and Poynting flux jet are strongly non-stationary, so the formation of shocks is expected at some distances from the star.
10.2 Application to propeller candidate stars
Our research shows that our models of propellers can explain the different observational properties of propeller candidate stars:
-
1.
Strong variability in the light-curves, which can be associated with (1) variable accretion rate onto the star, (2) variable ejection rate to the wind, (3) oscillations of the inner disk.
-
2.
Accretion of matter onto the stellar surface in the low-luminosity (low accretion rate) regime, when the magnetospheric radius is larger than the corotation radius . Our models show that a small amount of matter accretes onto a star even in the strongest propeller regime.
-
3.
Outflows from propeller candidates stars. These outflows can be associated with conical winds and more collimated magnetic jets.
-
4.
Flares of high-energy radiation (e.g., the gamma-ray flares observed in some transitional MSPs) can be associated with acceleration of particles in shocks, which form during non-stationary ejections to jets and winds in the strong propeller regime.
In future studies, we plan to model the propeller candidate stars individually (using the known stellar parameters) and to compare our models with observations in detail.
10.3 Comparisons with other models
Our model is somewhat similar to the model of Aly & Kuijpers (1990), who suggested that the field lines connecting the star and the disk should inflate and reconnect quasi-periodically. This model was developed for accreting (non-propelling) stars. However, differential rotation between the foot-points of the field lines and their inflation is expected in both regimes (see also Newman et al. 1992; Lovelace et al. 1995; Uzdensky et al. 2002) 161616Inflation of the field lines has been observed, e.g., in simulations by Miller & Stone (1997). The signs of such inflation were observed in CTTS AA Tau (Bouvier et al., 2007).. Axisymmetric MHD numerical simulations by Goodson et al. 1997, 1999 confirmed this type of instability. In their simulations, they observed several cycles in which matter accumulated, the field lines inflated and subsequently reconnected, matter accreted onto the star and then was ejected into the winds, and the magnetosphere expanded. A similar cycle has been observed in axisymmetric simulations of the propeller regime (Romanova et al., 2004; Zanni and Ferreira, 2013). However, both types of simulations (for slowly and rapidly-rotating stars) have only been performed in the top part of the simulation region (above the equatorial plane). In these models, reconnection of the field lines has been necessary for the subsequent accretion of matter onto the star. More recent simulations by Lii et al. (2014) have shown that modeling the entire simulation region (above and below the equator) leads to a new phenomenon: the magnetic flux inflates in one direction (above or below the disk), but matter accretes onto the star on the opposite side of the equator 171717This phenomenon has been initially observed in simulations by Lovelace et al. 2010, where accretion onto stars with complex fields has been modeled.. This phenomenon leads to the fact that reconnection is not required for accretion: matter of the inner disk accretes above the magnetosphere (on the opposite side of inflation relative to the equator), where the magnetic flux does not block its path (see, e.g., Fig. 2). In our current studies of the propeller regime, we observed a similar phenomenon in the models with larger magnetospheres and thinner disks. We should note that, in the models of slowly-rotating stars (e.g., Goodson et al. 1997), accretion is blocked by the magnetic flux of the inflated field lines, while in the models of propellers the centrifugal barrier of the rapidly-rotating star is a more important factor in blocking accretion.
Our model also has some similarities with the “dead disk” model, proposed by Sunyaev & Shakura (1977); Spruit & Taam (1993) and further developed by D’Angelo & Spruit (2010, 2012): in these models, matter of the inner disk is blocked by the centrifugal barrier for some interval of time, and the periods of matter accumulation alternate with episodes of matter accretion onto the star. However, compared with their models, our model is two-dimensional and takes into account (1) inflation of the field lines, (2) formation of outflows and jets, which can be driven by both centrifugal and magnetic forces, and (3) the possibility of accretion above or below the centrifugal barrier (which has the shape of a closed magnetosphere). Also, in D’Angelo & Spruit (2010), it is suggested that the magnetospheric radius should be near the corotation radius. In our models, the position of the magnetospheric radius does not depend much on the rotation of the star, but is instead determined by the balance of magnetic and matter stresses, while the position of the corotation radius is determined by the period of the star. We modeled propellers with different ratios of these two radii, which are in the range of (see Tab. 1). Moreover, in each model, the magnetospheric radius typically varies strongly. In spite of these differences, cyclic accretion is also observed in our models. However, in our models, we observe several time-scales associated with more complex processes of disk-magnetosphere interaction.
10.4 Restrictions of the model and future work
Current simulations are axisymmetric. This restricts us from modeling instabilities at the disk-magnetosphere boundary, which determine the rate of matter penetration through the external magnetosphere. 3D instabilities are shown to be effective in cases of slowly-rotating magnetized stars (e.g., Kulkarni & Romanova 2005; Romanova et al. 2008; Blinova et al. 2016). In this paper, we suggested that similar instabilities may also operate and provide an effective diffusivity at the disk-magnetosphere boundary. We used the diffusivity approach and took the maximum possible value of (acting only inside the spherical radius , which typically includes the disk-magnetosphere boundary). We observed that this diffusivity provides rapid penetration of matter through the external layers of the magnetosphere. However, the effective diffusivity may depend, for example, on the fastness parameter , and can be high at some values of and low at other values (as in the cases of slowly-rotating stars, see Blinova et al. 2016).
Fortunately, the results of the propeller model do not depend too much on the value of diffusivity. Our earlier studies of propellers, performed at different values of the diffusivity parameter (see Appendix B in Lii et al. 2014), have shown that the process of disk-magnetosphere interaction is similar in the cases of high and low diffusivity. However, at very low diffusivity, , matter is accumulated at the disk-magnetosphere boundary for longer time before it accretes onto the star. In this case, accretion is more “spiky” (see left panel of Fig. B2 of Lii et al. 2014). In the opposite scenario, when the diffusivity is high, , matter of the inner disk penetrates more rapidly through the external layers of the magnetosphere, acquires angular momentum and is ejected into the winds (see right panel of Fig. B2 of Lii et al. 2014). In this case, the accretion rate is smaller. As a result, efficiency is higher at higher diffusivity values. However, the difference in not very large: in the low-diffusivity case versus in the high-diffusivity case. Overall, the results of Lii et al. (2014) obtained at a very low diffusivity 181818Most of results in Lii et al. (2014) simulations were obtained using ideal MHD code with no diffusivity term added, and where only a small numerical diffusivity determined penetration of the disk through the magnetosphere. The numerical diffusivity in the code corresponded to . do not differ qualitatively from the results obtained in the current paper. The issue of diffusivity should be further studied in 3D simulations.
On the other hand, in three dimensions, the magnetic axis of the dipole can be tilted about the rotational axis of the disk. 3D MHD simulations of accreting stars have shown that the magnetospheric radius is approximately the same in stars with different tilts of the magnetic axis (Romanova et al., 2003), and therefore the centrifugal barrier should be located at the same distance as in the 2D simulations. However, the centrifugal barrier will have a slightly different shape, which may be against accretion. On the other hand, the tilted dipole is more favorable for accretion. Therefore, the efficiency of the propeller may be somewhat different compared with the axisymmetric case. Global 3D simulations should be done to determine the difference between 2D and 3D simulations.
Acknowledgments
Resources supporting this work were provided by the NASA High-End Computing (HEC) Program through the NASA Advanced Supercomputing (NAS) Division at the NASA Ames Research Center and the NASA Center for Computational Sciences (NCCS) at Goddard Space Flight Center. The research was supported by NASA grant NNX12AI85G. AVK was supported by the Russian academic excellence project “5top100”. We also acknowledge the International Space Science Institute (ISSI), which funded and hosted an international team devoted to the study of transitional millisecond pulsars, and we thank all the members of the team for fruitful discussions.
References
- Alpar et al. (1982) Alpar, M.A., Cheng, A.F., Ruderman, M.A., Shaham, J. 1982, Nature, 300, 728
- Aly & Kuijpers (1990) Aly, J.J., & Kuijpers, J. 1990, A&A, 227, 473
- Archibald et al. (2015) Archibald, A. M. et al. 2015, ApJ, 807, 62, 9pp
- Arons & Lea (1976) Arons, J. & Lea, S.M. 1976, ApJ, 207, 914
- Balbus & Hawley (1991) Balbus, S.A. & Hawley, J. F. 1991, ApJ, 376, 214
- Bisnovatyi-Kogan & Komberg (1974) Bisnovatyi-Kogan, G.S., & Komberg, B.V. 1974, Soviet Astronomy, 18, 217
- Blinova et al. (2016) Blinova, A. A., Romanova, M. M., Lovelace, R. V. E. 2016, MNRAS, 459, 2354
- Bogdanov et al. (2015) Bogdanov, S. et al., 2015, ApJ, 806, 148, 23pp
- Bouvier et al. (2007) Bouvier J., Alencar, S. H. P., Boutelier, T., Dougados, C., Balog, Z., Grankin, K., Hodgkin, S. T., Ibrahimov, M. A., Kun, M., Magakian, T. Yu., Pinte, C. 2007, A&A, 463, 1017
- Bult & van der Klis (2014) Bult, P. & van der Klis, M. 2014, ApJ, 789, 99
- Cody et al. (2017) Cody A. M., Hillenbrand, L. A., David, T. J., Carpenter, J. M.,Everett, M. E., Howell, S. B. 2016, ApJ, 836,id. 41, 25 pp
- D’Angelo & Spruit (2010) D’Angelo C. R., & Spruit H. C. 2010, MNRAS, 406, 1208
- D’Angelo & Spruit (2012) D’Angelo C. R., & Spruit H. C. 2012, MNRAS, 420, 416
- Deller et al. (2015) Deller, A. T., Mold n, J., Miller-Jones, J. C. A., Patruno, A., Hessels, J. W. T., Archibald, A. M., Paragi, Z., Heald, G., Vilchez, N. 2015, ApJ, 809, article id. 13, 17 pp.
- De Martino et al. (2010) De Martino, D., Falanga, M., Bonnet-Bidaut, J.-M., et al. 2010, A&A, 515, A25
- Donati et al. (2010) Donati, J.-F., Skelly, M.B., Bouvier, J. et al. 2010, MNRAS, 409, 1347
- Ferrigno et al. (2014) Ferrigno, C. et al. 2014, A&A, 567, A77
- Ghosh (2007) Ghosh, P. 2007, Rotation and Accretion Powered Pulsars: World Scientific Series in Astronomy and Astrophysics – Vol. 10. Edited by Pranab Ghosh. Published by World Scientific Publishing Co., Pte. Ltd., Singapore
- Goodson et al. (1997) Goodson, A. P., Winglee, R. M., & Böhm, K.-H. 1997, ApJ, 489, 1099
- Goodson et al. (1999) Goodson, A. P., Böhm, K.-H., & Winglee, R. M. 1999, ApJ, 524, 142
- Grinin et al. (2015) Grinin, V.P., Potravnov, I.S., Ilyin, I., Shulman, S.G. 2015, Astronomy Letters, 41(8), 407
- Hawley (2000) Hawley, J. F. 2000, ApJ, 528, 462
- Illarionov & Sunyaev (1975) Illarionov, A. F., & Sunyaev, R. A. 1975, A&A, 39, 185
- Kuijpers et al. (1997) Kuijpers, J., Fletcher, L., Abada-Simon, M., Horne, K.D., Raadu, M.A., Ramsay, G., Steeghs, D. 1997, A&A, 322, 242
- Koldoba et al. (2016) Koldova A.V., Ustyugova G.V., Lii P.S., Comins M.L., Dyda S., Romanova M.M., Lovelace R.V.E. 2016, New Astronomy, 45, 60
- Kulkarni & Romanova (2005) Kulkarni, A. K., & Romanova, M. M. 2005, ApJ, 633, 349
- Kulkarni & Romanova (2008) Kulkarni, A., & Romanova, M.M. 2008, ApJ, 386, 673
- Kulkarni & Romanova (2014) Kulkarni, A., & Romanova, M.M. 2014, ApJ, 398, 1105
- Lamb et al. (1973) Lamb, F. K., Pethick, C. J., Pines, D. 1973, ApJ, 184, 271
- Lii et al. (2014) Lii, P.S., Romanova, M.M., Ustyugova, G.V., Koldoba, A.V., Lovelace, R.V.E. 2014, MNRAS, 441, 86
- Linares (2014) Linares, M. 2014, ApJ, 795, 72
- Long et al. (2005) Long, M., Romanova, M. M., Lovelace, R. V. E. 2005, ApJ, 634, 1214
- Lovelace et al. (1995) Lovelace, R.V.E., Romanova, M.M., & Bisnovatyi-Kogan, G.S. 1995, MNRAS, 244, 275
- Lovelace et al. (1999) Lovelace, R.V.E., Romanova, M.M., & Bisnovatyi-Kogan, G.S. 1999, ApJ, 514, 368
- Lovelace et al. (2010) Lovelace, R.V.E., Romanova, M.M., Ustyugova, G.V., & Koldoba, A.V. 2010, MNRAS, 408, 2083
- Mauche (2006) Mauche, C.W. 2006, MNRAS, 369, 1983
- Miller & Stone (1997) Miller, K.A., & Stone, J.M. 1997, ApJ, 489, 890
- Miyoshi & Kusano (2005) Miyoshi, T., & Kusano, K. 2005, J. Comp. Phys., 208, 315
- Newman et al. (1992) Newman, W. I., Newman, A. L., & Lovelace, R. V. E. 1992, ApJ, 392, 622
- Papitto et al. (2013) Papitto, A., Ferrigno, C., Bozzo, E., Rea, N., Pavan, L., et al., 2013, Nature, 501, Issue 7468, 517
- Papitto & Torres (2015) Papitto, A., & Torres, D.E. 2015, ApJ, 807, article id. 33, 10 pp.
- Papitto et al. (2015) Papitto, A., de Martino, D., & Belloni, T.M., et al. 2015, MNRAS, 449, L26
- Patruno et al. (2009) Patruno, A., Watts, A.L., Klein-Walt, M., Wijnands, R., van der Klis, M. 2009, ApJ, 707, 1296
- Patruno & D’Angelo (2013) Patruno, A., & D’Angelo, C. 2013, ApJ, 771, 94
- Patruno et al. (2014) Patruno, A., Archibald, A. M., Hessels, J. W. T., Bogdanov, S., Stappers, B. W., Bassa, C. G., Janssen, G. H., Kaspi, V. M., Tendulkar, S., Lyne, A. G. 2014, ApJ, 781, L3
- Romanova et al. (2008) Romanova, M.M., Kulkarni, A.K., Lovelace, R.V.E. 2008, ApJ Letters, 273, L171
- Romanova et al. (2003) Romanova, M. M., Ustyugova, G. V., Koldoba, A. V., Wick, J. V., Lovelace, R. V. E., 2003, ApJ, 595, 1009
- Romanova et al. (2004) Romanova, M. M., Ustyugova, G. V., Koldoba, A. V., Lovelace, R. V. E., 2004, ApJ, 616, 151L
- Romanova et al. (2005) Romanova, M. M., Ustyugova, G. V., Koldoba, A. V., Lovelace, R. V. E., 2005, ApJ, 635, 165L
- Romanova et al. (2009) Romanova, M. M., Ustyugova, G. V., Koldoba, A. V., Lovelace, R. V. E., 2009, MNRAS, 399, 1802
- Shakura & Sunyaev (1973) Shakura, N.I., & Sunyaev, R.A. 1973, A&A, 24, 337
- Spruit & Taam (1993) Spruit H. C., Taam, R. E. 1993, ApJ, 402, 593
- Stone & Gardiner (2007a) Stone J. M., Gardiner T. A., 2007a, Phys. Fluids, 19, 4104
- Stone & Gardiner (2007b) Stone J. M., Gardiner T. A., 2007b, ApJ, 671, 1726
- Sunyaev & Shakura (1977) Sunyaev, R.A., & Shakura, N.I. 1977, Pisma Astron. Zh., 3, 262
- Ustyugova et al. (2006) Ustyugova, G.V., Koldoba, A.V., Romanova, M.M., & Lovelace, R.V.E. 2006, ApJ, 646, 304
- Uzdensky et al. (2002) Uzdensky, D.A., Königl, A., & Litwin, C. 2002, ApJ, 565, 1191
- van der Klis et al. (2000) van der Klis M., Chakrabarti, D., Lee, J. C., et al. 2000, IAU Circ., 7358, 3
- van der Klis (2006) van der Klis M., Compact Stellar X-Ray Sources, Eds. Lewin W. H. G. and van der Klis M. (Cambridge Univ. Press, Cambridge, 2006) 39
- Wang & Robertson (1985) Wang, Y.-M. & Robertson, J.A. 1985, ApJ, 299, 85
- Wynn et al. (1997) Wynn, G. A., King, A. R., & Horne, K. 1997, MNRAS, 286, 436
- Zanni and Ferreira (2013) Zanni, C., & Ferreira, J. 2013, A&A, 550, 99
Appendix A Description of Numerical Model
A.1 Initial and boundary conditions
Initial Conditions:
In this work, the initial conditions for the hydrodynamic variables are similar to those used in our previous works (e.g., Romanova et al. 2009; Lii et al. 2014), where the initial density and entropy distributions were calculated by balancing the gravitational, centrifugal and pressure forces. The disk is initially cold and dense, with temperature and density . The corona is hot and rarified, with temperature and density . In the beginning of the simulations, the inner edge of the disk is placed at = 10, and the star rotates with = 0.032 (corresponding to = 10), so that the magnetosphere and the inner disk initially corotate. This condition helps to ensure that the magnetosphere and the disk are initially in near-equilibrium at the disk-magnetosphere boundary. The star is gradually spun up from to the final state with angular velocity , corresponding to (given in Table 1). The initial pressure distribution in the simulation is determined from the Bernoulli equation:
| (47) |
where is the gravitational potential, is the centrifugal potential, is a Keplerian parameter191919We take slightly greater than unity to balance the disk pressure gradient (k=1+0.003). and
| (48) |
where is the pressure at the boundary that separates the disk from the corona. We assume the system to be initially barotropic, and determine the density from the pressure:
| (49) |
To initialize the MRI, 5% velocity perturbations are added to inside the disk.
Initial magnetic field configuration:
Initially, the disk is threaded by the dipole magnetic field of the star. We also add a small “tapered” poloidal field inside the disk (see left panel in Fig. 1), which is given by
where is the half-thickness of the disk and is a constant of integration in the initial equilibrium equation (see RomanovaEtAl2002; RomanovaEtAl2011). This tapered field helps initialize the MRI in the disk and has the same polarity as the stellar field at the disk-magnetosphere boundary.
Boundary Conditions:
Stellar surface: all the variables on the surface of the star have “free” boundary conditions, such that along the entire surface. We do not allow for the outflow of matter from the star (i.e. we prohibit stellar winds), and adjust the matter velocity vectors to be parallel to the magnetic field vectors. This models the frozen-in condition on the star.
Top and bottom boundaries: all variables have free boundary conditions along the top and bottom boundaries. In addition, we implement outflow boundary conditions on velocity to prohibit matter from flowing back into the simulation region once it leaves.
Outer side boundary: the side boundary is divided into a “disk region” () and a “coronal region” (), with
where is the external simulation radius. The matter along the disk boundary () is allowed to flow inward with a small radial velocity
and a poloidal magnetic field corresponding to the calculated magnetic field at . The remaining variables have free boundary conditions. The coronal boundary () has the same boundary conditions as the top and bottom boundaries.
A.2 Grid and code description
Grid description:
The axisymmetric grid is in cylindrical (, ) coordinates with mesh compression towards the equatorial plane and the -axis, so that there is a larger number of cells in the disk plane and near the star. In the models presented here, we use a non-uniform grid with grid cells corresponding to a grid that is 43 by 82 stellar radii in size At , the number of grid cells that cover the disk in the vertical direction is about 60.
Code description:
We use a Godunov-type numerical method with a five-wave Riemann solver similar to the HLLD solver developed by Miyoshi & Kusano (2005). The MHD variables are calculated in four states bounded by five MHD discontinuities: the contact discontinuity, two Alfvén waves and two fast magnetosonic waves. Unlike Miyoshi & Kusano (2005), our method solves the equation for entropy instead of the full energy equation. This approximation is valid in cases (such as ours) where strong shocks are not present. We ensure that the magnetic fields are divergence-free by introducing the -component of the magnetic field potential, which is calculated using the constrained transport scheme proposed by GardinerStone2005. The magnetic field is split into the stellar dipole and the calculated components, ; we omit the terms of the order which do not contribute to the Maxwellian stress tensor (Tanaka1994). No viscosity terms have been included in the MHD equations, and hence we only investigate accretion driven by the resolved MRI-turbulence. Our code has been extensively tested and has been previously utilized to study different MHD problems (see Koldoba et al. 2016 for tests and some astrophysical examples).
Table 6 shows sample reference values for three different types of accreting stars: to apply the simulation results to a particular class of star, multiply the dimensionless value by the reference value. The dependence on is also shown.
| cTTs | White Dwarf | Neutron Star | |
| initial | |||
| [] | 0.8 | 1 | 1.4 |
| 2 | 5000 km | 10 km | |
| [G] | 1000 | ||
| derived | |||
| [cm] | |||
| [cm s-1] | |||
| 0.37 d | 6.08 s | 0.46 ms | |
| [] | 0.16 | ||
| [] | 1.03 | ||
| [K] | |||
| [K] | |||
| [G] | |||
| [G cm3] | |||
| [g cm-3] | |||
| [ yr-1] | |||
| [g cm2 s-2] | |||
| [g cm2 s-3] |
A.3 Reference units
The simulations are performed in dimensionless units and are applicable to stars over a wide range of scales. There are four free parameters: we choose the values of the stellar mass , radius , magnetic field and dimensionless magnetospheric parameter and derive reference values from these parameters. The magnetic moment is used to initialize the stellar dipole field
| (50) |
where is the radius in spherical coordinates. In this work, we take = 30, 60 and . The reference units are as follows: length , magnetic moment , magnetic field (the equatorial field dipole strength at ) , velocity (the Keplerian orbital velocity at ), time (the Keplerian orbital period at ), angular velocity , pressure , density , temperature where is the mass of hydrogen and is the Boltzmann constant, force per unit mass . Accretion rate , angular momentum flux and energy flux . We should stress out that in our dimensionalization procedure, the reference magnetic field and many other reference variables depend on the parameter . Matter flux and other reference fluxes also depend on this parameter. For practical purposes, we provide a useful form for reference fluxes:
| (51) |
| (52) |
| (53) |
All fluxes depend on parameter as . For example, in case of matter flux, this means that at larger values of , the matter flux is smaller, and (at fixed ) the magnetospheric radius is expected to be larger, because the general dependence is approximately satisfied. That is why in our model we use parameter to regulate the dimensionless size of the magnetosphere: the magnetosphere is largest in case of , and smallest in case of . In Tab. 6, we use the normalized value .
Appendix B Variation of the inner disk radius and matter fluxes in representative runs
Left-hand panels of Figures 18, 19, and 20 show temporal variation of the matter fluxes to the star and to the wind in cases of magnetospheres with different sizes (different parameter ) and different corotation radii (different ). One can see that in all cases accretion occurs in relatively brief bursts. Matter flux to the wind also occurs in bursts. The dashed lines show the time-averaged values and . Right-hand panels show temporal variation of the inner disk radius, . The dashed lines show the time-averaged values .
Left-hand panels of Figs. 21, 22 and 23 show temporal variation of the normalized maximum velocity in the matter-dominated component of the wind. Dashed lines show the time-averaged values, . Figures show that the maximum velocity rapidly decreases.hen increases.
Right-hand panels of Figs. 21, 22 and 23 show variation of the opening angle of the wind, , with time. One can see that the opening angle systematically increases, when increases. Dashed lines show variation of the time-averaged values, . Figures show that the opening angle systematically increases when increases.
