Localization and dynamics of sulfur-oxidizing microbes in natural sediment
Abstract
Organic material in anoxic sediment represents a globally significant carbon reservoir that acts to stabilize Earth’s atmospheric composition. The dynamics by which microbes organize to consume this material remain poorly understood. Here we observe the collective dynamics of a microbial community, collected from a salt marsh, as it comes to steady state in a two-dimensional ecosystem, covered by flowing water and under constant illumination. Microbes form a very thin front at the oxic-anoxic interface that moves towards the surface with constant velocity and comes to rest at a fixed depth. Fronts are stable to all perturbations while in the sediment, but develop bioconvective plumes in water. We observe the transient formation of parallel fronts. We model these dynamics to understand how they arise from the coupling between metabolism, aerotaxis, and diffusion. These results identify the typical timescale for the oxygen flux and penetration depth to reach steady state.
When organic material is buried in sediment Hayes and Waldbauer (2006), its decay by microbes is slowed by the limited diffusive flux of oxygen from the surface Fenchel et al. (2012), thus sequestering a large reservoir of fixed carbon Lal (2008); Bridgham et al. (2006). The burial of organic material contributed to the rise of oxygen in the ancient atmosphere Catling and Claire (2005); Dismukes et al. (2001) and its decay may further destabilize the modern climate Koven et al. (2011). Predicting the quantity carbon sequestered and respired requires an understanding of how complex microbial communities organize and move in nutrient gradients. Although the collective dynamics of simple microbial communities are well studied Wu and Libchaber (2000); Zhang et al. (2010); Platt (1961); Douarche et al. (2009); Petroff and Libchaber (2014); Petroff et al. (2015), the collective dynamics of complex microbial communities—typical of natural sediment— remain poorly understood. Here we observe the dynamics by which a microbial community, collected from a salt-marsh microbial mat and brought into the lab, organizes to fix the oxygen penetration depth. At this depth, sulfur-oxidizing bacteria consume oxygen and H2S (sulfide) Robertson et al. (1992), the waste product of sulfur-reducing bacteria Widdel et al. (1992). As these reducing and oxidizing bacteria exchange sulfur compounds, they maintain a sulfur cycle Fenchel et al. (2012); Gregor et al. (1988). Periodic observations by Garcia-Pichel et al have shown that sulfur-oxidizing bacteria organize into a front that moves through the sediment Garcia-Pichel et al. (1994). We first describe a new experiment that allows one to continuously observe these dynamics in a two-dimensional chamber. We find that microbes self-organize into a thin stable front that moves with constant velocity to a steady-state depth. We then present a model describing how these dynamics arise from the coupling between aerotaxis, metabolism, and diffusion. These results allow us to identify the typical timescale required for the oxygen penetration depth to come to steady-state in natural sediment.
We begin by collecting a cyanobacterial mat from Little Sippewissett Marsh (N W) near Woods Hole Massachusetts Nicholson et al. (1987); Buckley et al. (2008). Bringing this material into the lab, we observe the typical metabolic stratification. A green stratum of photosynthetic microbes lays above purple, white, and dark bands of purple sulfur, sulfur-oxidizing, and sulfur-reducing bacteria, respectively Pierson et al. (1987); Fenchel et al. (2012). Details regarding the collection and maintenance of this mat in the lab are described in reference Petroff et al. (2017).
To continuously observe the motion of the sulfur-oxidizing microbes in a constant environment, we developed a two-dimensional microbial ecosystem in a Hele-Shaw chamber Saffman and Taylor (1958). Figure 1(a) shows a schematic of this experiment. We place sediment between two clear acrylic walls separated by a 2 mm (sand grains) rubber spacer, held together by bolts at the edges of the chamber. We continuously flow fresh saltwater media over the surface of the sediment at a flow rate of cmmin (oxygen Peclet number ), which maintains a constant chemical environment at the surface. The oxygen concentration in the fresh media is in equilibrium with the atmosphere and contains mM SO, typical of natural salt marshes Goldman and McCarthy (1978); Petroff and Libchaber (2014). These oxidants maintain populations of aerobic, sulfur-oxidizing, and sulfur-reducing bacteria in the sediment. To mimic the natural environment, we focus a light sheet (produced from a high powered Thorlabs MCWHL5 led) onto the top surface of the sediment while keeping the edges of the chamber in darkness.
The way the chamber is loaded is critical to the experiment. We take sediment from a microbial mat by making two parallel slices into the sediment mm apart with clean metal knives. We take the sediment from between the slices by pressing the knives together and lifting. We lay this sediment on one of the acrylic walls surrounded on three sides by the rubber spacer. Extra sediment is removed to the height of the rubber spacer. We then place the second acrylic wall onto the sediment. Finally, we bolt the walls together to avoid leaks. This compresses the sediment. Although we are careful to preserve the vertical structure of the sediment as we lay it on the chamber wall, the topmost several millimeters of the mat mix. The thickness of the mixed layer varies between experiments. As a result, there is spurious oxygen in the top most layer of sediment. In these experiments, we observe the dynamics by which this oxygen reservoir is consumed as the oxic-anoxic interface comes to steady state.
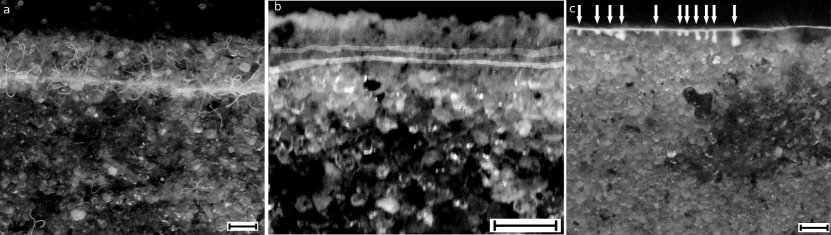
5 to 8 hours after loading the chamber, we observe the formation of an extraordinarily thin front of microbes (fig 1b), with a typical thickness of only m. It extends the entire mm width of the chamber. Due to the presence of sulfur globules Robertson et al. (1992) in the constituent bacteria, this band is clearly visible to the eye, appearing as a thin white band. This allows us to follow the dynamics of this front by photographing its position at minute intervals.
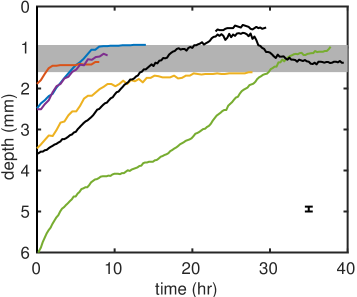
We observe a wide range of initial positions of the front (fig. 2), ranging from mm to mm. We attribute this range of values to the variability in initial conditions imposed by loading the chamber.
To confirm that this front forms at the oxic-anoxic interface, we use the oxygen-sensitive fluorescent dye Tris(4,7-diphenyl-1,10-phenanthroline) ruthenium(II) Dichloride ( pure, American Elements RU-OM-02). The fluorescence of this dye is reversibly quenched by oxygen, allowing one to visualize the distribution of oxygen Glud et al. (1998). The dye is fixed within a porous plastic matrix of polyethylene terephthalate on a cm cm Mylar sheet, as described in ref. Larsen et al. (2011). To improve the signal strength, the detector is coated with mm layer of PDMS containing % TiO2, similar to ref Klimant and Wolfbeis (1995). This sheet is placed flush against the chamber wall. The top of the detector is even with the sediment surface. During a measurement, the side of the chamber is illuminated with a second high powered LED (nm Thorlabs M455L3, not shown in fig 1) for sec. Photographing the illuminated sheet through a nm high pass filter allows one to visualize the gradient in dye fluorescence and thus the oxygen gradient. Despite the TiO2 insulation, scattering of light off of sediment behind the detector introduces small variations in the measured oxygen concentration Measuring the oxygen gradient with a Clark type microelectrode Revsbech and Jørgensen (1986) (Unisense OX-100) provides independent confirmation of the gradients.
Indeed, we observe the front forms (fig 1c) near the oxic-anoxic interface at an oxygen concentration of % atmospheric concentration. Given a diffusion coefficient of oxygen cm2, the observed slope corresponds to an oxygen flux m M/sec. After 40 hours, the increase in microbial activity reduces the penetration depth to only mm. The gradient then remains constant. The scales of these gradients are typical of natural sediments Revsbech et al. (1983).
The front, which extends the width of the chamber, moves towards the surface with a constant velocity of m sec-1. Remarkably, the entire front moves with the same speed and does not develop fingering instabilities Pelcé (2004).. During the motion towards the surface, we observe transient fluctuations in the shape of the front. The typical amplitude of these fluctuation is m, equivalent to front widths.
The front comes to rest at a depth of mm regardless of the depth at which it formed. The trajectories of fronts in six different experiments are shown in figure 2.
Notice that front in one experimental run overshot its steady state depth despite moving without inertia (Reynolds number Re). In this overshot experiment, we observed the transient formation of a second, much fainter front parallel to the first (figs. 2 and 3b). Notably, the second front appeared mm above the stable front. It persisted for hours before vanishing. The return of the original front to its steady-state depth was coincident with the disappearance of the transient front. The presence of these double fronts in field observations has previously been attributed to two populations of sulfur-oxidizing microbes, a fast population that moves with the changing gradients and a slow population that is left behind Garcia-Pichel et al. (1994). As the transient front appeared discontinuously above the moving front, rather than splitting from it, this explanation does not explain our result.
The flow of fresh media over the sediment surface is critical to the stability of the front. When the flow stops, the front moves from the sediment into the water and becomes unstable, immediately developing bioconvective plumes (figure 3c) Platt (1961). Such plumes form when the density of the upward swimming microbes in the front exceeds a critical value to develop gravity-driven flowsHillesdon and Pedley (1996); Hill and Pedley (2005). Viscous forces stabilize the front in the sedimentKuznetsov and Avramenko (2002); Kuznetsov and Jiang (2001).
It is surprising that a front can form and move coherently through this complex medium. Past work has shown that populations of identical bacteria form fronts in response to nutrient gradients Douarche et al. (2009). To account for this behavior, we consider how gradients of oxygen and H2S (sulfide) change in response to microbial metabolism and the resulting motion of the sulfur-oxidizing community.
We begin by considering the time evolution of these gradients around an arbitrary distribution of microbes. First-order kinetics for metabolism with oxygen and sulfide require
| (1) |
and
| (2) |
We take the diffusion coefficients of oxygen and sulfide in the sediment (compressed in the chamber) to be cm2/sec and cm2/sec, respectively, slightly smaller than their values in loose sand. is the metabolic rate per microbe per oxygen molecule. It varies in space with the local density of bacteria. The stoichiometry coefficient is the number of oxygen molecules required to oxidize a sulfide Kelly (1999).
To close these equations, one must include a model of aerotaxis to describe how the local metabolic rate constant change with the moving chemical gradients. Two approximations make this possible for an arbitrary community of sulfur-oxidizing microbes. First—because the front velocity msec is much slower than the range of speeds m/sec of swimming and gliding microbes Dworkin et al. (2006); Purcell (1977); Garcia-Pichel (1989)— the density of microbes and thus the metabolic rate evolves quasistatically. This separation of scales allows us to characterize the density and metabolic rate of microbes in the front with their steady-state values. Second, we assume that the steady-state distribution of microbes is only determined by the concentration of oxygen. This approximation is justified as sulfur-oxidizing microbes (and the associated protists) typically concentrate themselves near oxic-anoxic interface, at oxygen concentrations ranging from to atmospheric Fenchel and Bernard (1996); Jørgensen and Revsbech (1983); Garcia-Pichel et al. (1994). We describe this diversity of steady-state positions with a distribution , which is the fraction of microbes that concentrate at an oxygen concentration of . To mimic the natural range of tolerable oxygen concentrations in this model, we take to have mean atmospheric and variance . Combining these approximations, , where is the effective metabolic rate per oxygen molecule. This quasistatic approximation removes any explicit dependence of the front dynamics on the motion of bacteria in the gradients.
We observed that the front width, velocity, and steady-state depth are similar across all experiments despite differences in their initial conditions. We seek to understand how this surprising consistency arises from the length scales and timescales imposed by diffusion and metabolism. We begin by presenting scaling relations to estimate the width, velocity, and final front depth. We find these estimates to be roughly consistent with observations. We then solve equations (1) and (2) numerically to investigate the sensitivity of these dynamics to .
We begin with the front width. How is it that such a thin front can form despite being composed of diverse microbes? The quasistatic approximation allows one to understand how diverse microbes are forced together into a thin front by competition for oxygen (figure 4a inset). Metabolism sharpens oxygen gradients, leading to shorter distance between the highest and lowest tolerable oxygen concentrations; consequently the front thins to a width similar to the diffusive length scale , where is the rate at which oxygen is consumed in the front. To estimate , we balance the flux of oxygen mM/sec, measured from the oxygen profile in figure 1c, with metabolic flux . We find sec-1. The corresponding diffusive length m is indeed similar to the measured front width m.
Next, we estimate the front velocity from the aerotactic motion of microbes in the front. The front moves as a result of bacterial metabolism (fig. 4a inset), which depletes oxygen near the front, and the resulting quasistatic reorganization of bacteria in the gradient. As oxygen levels around the front fall, the bacterial front moves to remain concentrated at . Given a constant rate of oxygen consumption, the front moves with a constant velocity towards the surface, where the concentration is M (measured from the profile in figure 1c). This propagation is analogous to the front dynamics described by the Fisher-Kolmogorov equation, in which microbes consume a diffusing resource at a constant rate Pelcé (2004). However, unlike the microbial fronts described by this equation, the metabolic rate of the sulfur-oxidizing bacteria requires the presence of two nutrients, oxygen and sulfide, in opposing gradients. Balancing the oxygen consumed by the moving front as with the metabolic flux , we expect a velocity of m/sec. This value is a factor of larger than the observed velocity m/s.
Finally, we consider the equilibrium position of the sulfur-oxidizing bacteria. As the front approaches the surface, the increasing flux of oxygen causes it to slow. The front reaches a steady-state depth where the fluxes of oxygen and sulfide to the bacteria are both balanced by the metabolism. Requiring the ratio of these fluxes to be the stochiometric ratio and solving for , the steady-state depth is . We measure the sulfide flux from the concentration of sulfide M measured below the front (Lamotte colorimetric sulfide assay 4456-01). This concentration corresponds to a flux of M m/sec. Taking (oxidation of H2S to SO), we expect the front to come to rest at a depth mm. This estimate is roughly consistent with the observed depth mm. This closes our scaling analysis.
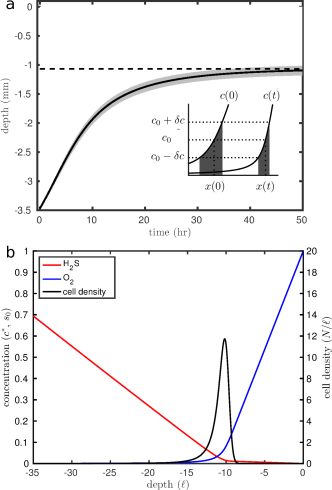
To evaluate the sensitivity of these dynamics to the composition of the microbial community, characterized by the distribution of preferred oxygen levels, we integrate equations (1) and (2) numerically. We initially take to be a Maxwell-Boltzmann distribution with mean atmospheric. We take the unknown parameters from the results of the scaling analysis with no fitted parameters. Comparing this solution (fig 4a) to the observed motion of fronts (fig 2), shows that this solution captures the motion of the front to the surface, its timescales, and length scales. Figure 4b shows the distribution of oxygen, sulfide, and bacteria at steady state. The front dynamics depend very weakly on the distribution of steady-state oxygen concentrations of the bacteria. The trajectories are similar if one takes to be normal, exponential, or uniformly distributed. They are similarly unchanged if one imposes conservation of cell number. The front width depends very weakly on the range of tolerable oxygen concentrations. Varying by a factor of —from atmospheric to atmospheric—results in fronts that vary in width by a factor of . Thus we conclude that these dynamics are relatively insensitive to . Rather the quasistatic motion of the front is determined by the sulfide flux and surface oxygen concentration.
In conclusion, we have observed the formation of a thin front of microbes at the oxic-anoxic interface and its constant-velocity motion to a steady-state depth. The front moves as the initial reservoir of oxygen (introduced to the sediment by loading the chamber) is consumed by the microbial population. The front width, velocity, and steady-state position vary little across experiments. We have shown their magnitudes are fixed by the metabolic timescale , diffusive length scale , sulfide flux , and concentrations of oxygen at the surface . We conclude that these dynamics arise from the coupling between diffusion, metabolism, and aerotaxis. The simplicity of this phenomenon is counterintuitive given the complexity of this system. Future work should proceed in three directions.
First, our observations have identified the transient formation of parallel fronts (fig 3b) that cannot currently be explained. Our model allows us to propose a hypothesis for this phenomenon: they arise from metabolic shifts in the constituent microbes. Notice that the steady-state depth of a front depends explicitly on stochiometric coefficient , the ratio of oxygen molecules consumed per sulfide molecule. The value of this coefficient is quantized by the oxidation state of the waste product. It takes values of or for oxidation to S0, SO, and SO, respectively. A front of bacteria that completely oxidize sulfur () comes to rest at a shallower depth than those that partially oxidize sulfur (e.g., to S0). Thus, if a sub-population in the front switch from partial to complete sulfur oxidation (or between intermediates), they would move discontinuously to a shallower depth. These two fronts would then compete for sulfur and oxygen. This hypothesis can be tested by extracting bacteria from each of the fronts and measuring the concentration of mRNA coding for the enzymes responsible for the different steps of sulfur oxidation. We leave this analysis for future work.
Second, to connect these results to natural environments, we must account for environmental fluctuations. Our results identifies a fundamental timescale hr for microbial community to come to steady state after a perturbation. Comparing this timescale to the frequency of environmental perturbations (e.g., by tides and storms), we find an important dimensionless number . If , as in salt marshes regularly disturbed by tides hr-1, the sediment never reaches steady state. We therefore expect that the decay of organics is strongly coupled to environmental fluctuations. To measure the relationship between organic decay and environmental fluctuations, we will modify this experiment (fig 1a) to include a variable flow of fresh media over the surface and measure resulting variability in gross metabolic rate.
Finally, we have only examined the dynamics of the oxic-anoxic interface in a fixed quantity of sediment. Including a sedimentation rate of at the surface, the sediment-water interface moves away from the microbial front. To examine the influence of this parameter, we will modify our experiment to include a flux of sediment and measure the gross metabolic rate. These dynamics may explain the observed variability of cell density with sedimentation rate in the sea Kallmeyer et al. (2012).
This work was supported by HFSP RGP0037. The authors declare that they have no competing financial interests. Correspondence and requests for materials should be addressed to A.P.P (email: apetroff@rockefeller.edu).
References
- Hayes and Waldbauer (2006) J. M. Hayes and J. R. Waldbauer, Philosophical Transactions of the Royal Society of London B: Biological Sciences 361, 931 (2006).
- Fenchel et al. (2012) T. Fenchel, H. Blackburn, and G. M. King, Bacterial biogeochemistry: the ecophysiology of mineral cycling (Academic Press, 2012).
- Lal (2008) R. Lal, Philosophical Transactions of the Royal Society B: Biological Sciences 363, 815 (2008).
- Bridgham et al. (2006) S. D. Bridgham, J. P. Megonigal, J. K. Keller, N. B. Bliss, and C. Trettin, Wetlands 26, 889 (2006).
- Catling and Claire (2005) D. C. Catling and M. W. Claire, Earth and Planetary Science Letters 237, 1 (2005).
- Dismukes et al. (2001) G. Dismukes, V. Klimov, S. Baranov, Y. N. Kozlov, J. DasGupta, and A. Tyryshkin, Proceedings of the National Academy of Sciences 98, 2170 (2001).
- Koven et al. (2011) C. D. Koven, B. Ringeval, P. Friedlingstein, P. Ciais, P. Cadule, D. Khvorostyanov, G. Krinner, and C. Tarnocai, Proceedings of the National Academy of Sciences 108, 14769 (2011).
- Wu and Libchaber (2000) X.-L. Wu and A. Libchaber, Physical Review Letters 84, 3017 (2000).
- Zhang et al. (2010) H.-P. Zhang, A. Be’er, E.-L. Florin, and H. L. Swinney, Proceedings of the National Academy of Sciences 107, 13626 (2010).
- Platt (1961) J. R. Platt, Science 133, 1766 (1961).
- Douarche et al. (2009) C. Douarche, A. Buguin, H. Salman, and A. Libchaber, Physical review letters 102, 198101 (2009).
- Petroff and Libchaber (2014) A. Petroff and A. Libchaber, Proceedings of the National Academy of Sciences 111, E537 (2014).
- Petroff et al. (2015) A. P. Petroff, X.-L. Wu, and A. Libchaber, Physical review letters 114, 158102 (2015).
- Robertson et al. (1992) L. A. Robertson, J. G. Kuenen, A. Balows, H. Truper, M. Dworkin, W. Harder, K. Schleifer, et al., The prokaryotes: a handbook on the biology of bacteria: ecophysiology, isolation, identification, applications, vol. I. , 385 (1992).
- Widdel et al. (1992) F. Widdel, T. Hansen, A. Balows, H. Truper, M. Dworkin, W. Harder, K. Schleifer, et al., The prokaryotes: a handbook on the biology of bacteria: ecophysiology, isolation, identification, applications, vol. I. , 582 (1992).
- Gregor et al. (1988) C. B. Gregor, R. M. Garrels, F. T. Mackenzie, and J. B. Maynard, Chemical Cycles in the Evolution of the Earth (Wiley New York, 1988).
- Garcia-Pichel et al. (1994) F. Garcia-Pichel, M. Mechling, and R. W. Castenholz, Applied and environmental microbiology 60, 1500 (1994).
- Nicholson et al. (1987) J. A. M. Nicholson, J. F. Stolz, and B. K. Pierson, FEMS Microbiology Ecology 3, 343 (1987).
- Buckley et al. (2008) D. H. Buckley, L. K. Baumgartner, and P. T. Visscher, Environmental Microbiology 10, 967 (2008).
- Pierson et al. (1987) B. Pierson, A. Oesterle, and G. L. Murphy, FEMS Microbiology Ecology 3, 365 (1987).
- Petroff et al. (2017) A. Petroff, F. Tejera, and A. Libchaber, Journal of Statistical Physics (2017).
- Saffman and Taylor (1958) P. G. Saffman and G. Taylor, in Proceedings of the Royal Society of London A: Mathematical, Physical and Engineering Sciences, Vol. 245 (The Royal Society, 1958) pp. 312–329.
- Goldman and McCarthy (1978) J. C. Goldman and J. J. McCarthy, Limnology and oceanography 23, 695 (1978).
- Glud et al. (1998) R. N. Glud, C. M. Santegoeds, D. De Beer, O. Kohls, and N. B. Ramsing, Aquatic Microbial Ecology 14, 223 (1998).
- Larsen et al. (2011) M. Larsen, S. M. Borisov, B. Grunwald, I. Klimant, and R. N. Glud, Limnology and Oceanography: Methods 9, 348 (2011).
- Klimant and Wolfbeis (1995) I. Klimant and O. S. Wolfbeis, Analytical chemistry 67, 3160 (1995).
- Revsbech and Jørgensen (1986) N. P. Revsbech and B. B. Jørgensen, in Advances in microbial ecology (Springer, 1986) pp. 293–352.
- Revsbech et al. (1983) N. P. Revsbech, B. B. Jorgensen, T. H. Blackburn, and Y. Cohen, Limnology and Oceanography 28, 1062 (1983).
- Pelcé (2004) P. Pelcé, New visions on form and growth: fingered growth, dendrites, and flames (Oxford University Press on Demand, 2004).
- Hillesdon and Pedley (1996) A. Hillesdon and T. Pedley, Journal of Fluid Mechanics 324, 223 (1996).
- Hill and Pedley (2005) N. Hill and T. Pedley, Fluid Dynamics Research 37, 1 (2005).
- Kuznetsov and Avramenko (2002) A. Kuznetsov and A. Avramenko, International communications in heat and mass transfer 29, 175 (2002).
- Kuznetsov and Jiang (2001) A. V. Kuznetsov and N. Jiang, International communications in heat and mass transfer 28, 877 (2001).
- Kelly (1999) D. P. Kelly, Archives of Microbiology 171, 219 (1999).
- Dworkin et al. (2006) M. Dworkin, S. Falkow, E. Rosenberg, K.-H. Schleifer, and E. Stackebrandt, The Prokaryotes: Vol. 6: Proteobacteria: Gamma Subclass (Springer Science & Business Media, 2006).
- Purcell (1977) E. M. Purcell, Am. J. Phys 45, 3 (1977).
- Garcia-Pichel (1989) F. Garcia-Pichel, Journal of bacteriology 171, 3560 (1989).
- Fenchel and Bernard (1996) T. Fenchel and C. Bernard, European Journal of Protistology 32, 55 (1996).
- Jørgensen and Revsbech (1983) B. B. Jørgensen and N. P. Revsbech, Applied and Environmental Microbiology 45, 1261 (1983).
- Kallmeyer et al. (2012) J. Kallmeyer, R. Pockalny, R. R. Adhikari, D. C. Smith, and S. D’Hondt, Proceedings of the National Academy of Sciences 109, 16213 (2012).