GRB 081024B and GRB 140402A: two additional short GRBs from binary neutron star mergers
Abstract
Theoretical and observational evidences have been recently gained for a two-fold classification of short bursts: 1) short gamma-ray flashes (S-GRFs), with isotropic energy erg and no BH formation, and 2) the authentic short gamma-ray bursts (S-GRBs), with isotropic energy erg evidencing a BH formation in the binary neutron star merging process. The signature for the BH formation consists in the on-set of the high energy (– GeV) emission, coeval to the prompt emission, in all S-GRBs. No GeV emission is expected nor observed in the S-GRFs. In this paper we present two additional S-GRBs, GRB 081024B and GRB 140402A, following the already identified S-GRBs, i.e., GRB 090227B, GRB 090510 and GRB 140619B. We also return on the absence of the GeV emission of the S-GRB 090227B, at an angle of from the Fermi-LAT boresight. All the correctly identified S-GRBs correlate to the high energy emission, implying no significant presence of beaming in the GeV emission. The existence of a common power-law behavior in the GeV luminosities, following the BH formation, when measured in the source rest-frame, points to a commonality in the mass and spin of the newly-formed BH in all S-GRBs.
Subject headings:
Gamma Ray Bursts – Neutron Stars1. Introduction
Gamma-ray bursts (GRBs) have been historically divided into a two-fold classification based on the observed duration of their prompt emission: short GRBs with s and long GRBs with s (Mazets et al., 1981; Klebesadel, 1992; Dezalay et al., 1992; Kouveliotou et al., 1993; Tavani, 1998).
The progenitor systems of short bursts are traditionally identified with binary neutron star (NS)and NS-black hole (BH) mergers (see, e.g., Goodman, 1986; Paczynski, 1986; Eichler et al., 1989; Narayan et al., 1991; Meszaros & Rees, 1997; Rosswog et al., 2003; Lee et al., 2004; Belczynski et al., 2006; Berger, 2014). This assumption has received observational supports by their localization, made possible by the X-ray emission of the afterglow, with large off-sets from their hosts galaxies, both late and early type galaxies with no star formation evidence (see, e.g., Fox et al., 2005; Gehrels et al., 2005; Berger, 2014).
A vast activity of numerical work on relativistic magnetohydrodynamical (MHD) simulation using the largest facilities in the world (equipped by supercomputers with peak performances of PFLOPS111The acronym PFLOPS means Peta () Floating Point Operations per second., see Siegel et al. 2014, PFLOPS, see Ruiz et al. 2016, and PFLOPS, see Kiuchi et al. 2014) have been developed with the declared goal of finding a jetted emission which they considered, without convincing observational support, to be a necessary step to develop short GRB models in merging binary NS-NS or binary BH-NS systems (see, e.g., Rezzolla et al., 2011; Shibata et al., 2011; Kiuchi et al., 2014; Siegel et al., 2014; Paschalidis et al., 2015; Ruiz et al., 2016). It is interesting that they themselves recognized the shortcoming of their approach: “…there is microphysics that we do not model here, such as the effects of a realistic hot, nuclear EOS [equation of state] and neutrino transport” (see, e.g., Ruiz et al., 2016). They also expected such models would be further confirmed by the observation associated with gravitational waves (GWs) of aLIGO (see, e.g., Brown et al., 2004).
There is no observational signature for the role of MHD activities in GRBs, nor, as we show in this paper, for jetted emission in the X- and -rays, as well as in the ultrarelativistic GeV emission of short bursts (see Sec. 5). On the contrary, also in the case of short GRBs we have strong evidence for the necessary occurrence of hypercritical accretion process as already shown in long GRBs with the fundamental role of neutrino emission (Zel’dovich et al., 1972; Ruffini & Wilson, 1973; Rueda & Ruffini, 2012; Fryer et al., 2014) and the value of the NS critical mass (Rotondo et al., 2011a, b; Rueda et al., 2011, 2014; Rueda & Ruffini, 2013; Belvedere et al., 2012, 2014, 2015; Cipolletta et al., 2015, see also Fryer et al., 2014; Becerra et al., 2015; Fryer et al., 2015b; Becerra et al., 2016). We also established firm upper limits on the observation of GWs from short GRBs by aLIGO (Oliveira et al., 2014; Ruffini et al., 2015, 2016c).
Our approach is markedly different from the traditional ones. Since Ruffini et al. (2001a, b, c) we started:
-
a)
daily systematic and independent analyses of the GRB data in the X-, -rays and GeV emission from Beppo-SAX (see, e.g., Frontera, 2015), Swift (Barthelmy et al., 2005), Fermi (Meegan et al., 2009), Konus-WIND (Aptekar et al., 1995), and AGILE (Tavani et al., 2009). We extended our data analysis to the optical and radio data.
-
b)
We have developed theoretical and astrophysical models based on quantum and classical relativistic field theories.
-
c)
At every step we have verified that the theoretical considerations be consistent with the observational data.
In this article we mainly address the study of NS–NS mergers and only at the end we refer to BH–NS binaries.
In Ruffini et al. (2015) a further division of the short bursts into two different sub-classes has been proposed, and specific observable criteria characterizing this division have been there given:
-
1.
The first sub-class of short bursts is characterized by isotropic energies erg and rest-frame spectral peak energies MeV (Zhang et al., 2012; Calderone et al., 2015). In this case the outcome of the NS–NS merger is a massive NS (MNS) with additional orbiting material (Ruffini et al., 2016b). An alternative scenario leads to a new binary system composed by a MNS and a less massive NS or a white dwarf (WD). For specific mass-ratios a stable mass-transfer process may occur from the less massive to the MNS (see, e.g., Clark & Eardley, 1977; Bildsten & Cutler, 1992, and references therein). Consequently, the donor NS moves outward by loosing mass and may also reach the beta-decay instability becoming a low-mass WD. In view of their moderate hardness and their low energetics, we have indicated such short bursts as short gamma-ray flashes (S-GRFs, see Ruffini et al., 2016b). There, the local rate of S-GRFs has been estimated to be Gpc-3 yr-1.
-
2.
The second sub-class corresponds to the authentic short GRBs (S-GRBs) with erg and MeV (Zhang et al., 2012; Calderone et al., 2015). In this system the NS–NS merger leads to the formation of a Kerr BH with additional orbiting material, in order to conserve energy and angular momentum (Ruffini et al., 2016a, b). A further characterizing feature of S-GRBs absent in S-GRFs is the presence of the – GeV emission, coeval to their prompt emission and evidencing the activity of the newly-born BH. In Ruffini et al. (2016b) the local rate of this S-GRB has been estimated to be Gpc-3 yr-1. The impossibility of detecting the observed short GRB 140619B from LIGO was evidenced (see Fig. in Ruffini et al., 2015). We return again in this article on the issue of non-detectability of GWs for S-GRBs.
The above relative rate of these two sub-classes of short bursts has been discussed and presented in Ruffini et al. (2016b). There, it has been shown that the S-GRFs are the most frequent events among the short bursts. This conclusion is in good agreement with the NS–NS binaries observed within our Galaxy: only a subset of them has a total mass larger than and can form a BH in their merging process (Ruffini et al., 2015). There, in Fig. , it has been assumed for a non-rotating NS, imposing global charge neutrality and using the NL3 nuclear model (see, e.g., Cipolletta et al., 2015). Similar conclusions have been also independently reached by Fryer et al. (2015a) and Lawrence et al. (2015).
We have identified three authentic S-GRBs: GRB 090227B (Muccino et al., 2013), GRB 090510 (Ruffini et al., 2016a), and GRB 140619B (Ruffini et al., 2015). All of them populate the high energy part of the – relation for short bursts (Zhang et al., 2012; Calderone et al., 2015; Ruffini et al., 2016a) and have erg. We have analyzed the above three S-GRBs within the fireshell model (see e.g., Ruffini et al., 2010). The transparency emission of the plasma (the P-GRB emission), the on-set of the prompt emission, the correlation between the spike emission of the prompt and CBM inhomogeneities have led to the most successful test and applicability of the fireshell model.
A further and independent distinguishing feature between S-GRFs and S-GRBs has been found thank to the Fermi data: when these three S-GRBs fall within the Fermi-LAT field of view (FoV), a GeV emission occurs, starting soon after the P-GRB emission, related to the emission from a newly-born BH.
In this paper, we present two additional S-GRBs: GRB 081024B and GRB 140402A. The S-GRB 081024 is historically important since that source gave the first clear detection of a GeV temporal extended emission from a short burst (Abdo et al., 2010). From the application of the fireshell model to this S-GRB we theoretically derived its redshift and, therefore, erg, MeV, and erg. For the S-GRB 140402A, we theoretically derived a redshift which provides erg and MeV. A long-lived GeV emission within s has been reported (Bissaldi et al., 2014). The total energy of the brightest GeV emission is erg.
We also updated the analysis of the GeV emission of the S-GRB 090227B. The apparent absence of the GeV emission has been already discussed in Ruffini et al. (2015), recalling that this source was outside the nominal LAT FoV, and only photons in the LAT low energy (LLE) channel and a single transient-class event with energy above MeV were associated with this GRB (Ackermann et al., 2013). A further updated analysis would indicate that, in view of the missing observations, in no way the absence of the GeV emission before s in the source rest-frame can be inferred.
From the analyses of the two additional S-GRB 081024B and S-GRB 140402A and the further check for the GeV emission associated to the S-GRB 090227B, we conclude that all S-GRBs correlate to the high energy emission implying no significance presence of beaming in the GeV emission.
In Sec. 2 we briefly recall the fireshell model and its implications for S-GRBs. In Secs. 3 and 4 we report the data analyses of the S-GRBs 081024B and 140402A, respectively, and show their theoretical interpretation within the fireshell model: from the theoretical inference of their cosmological redshift, their transparency emission parameters, to the details of the circumburst media where they occurred. In Sec. 5 we summarize the properties of the GeV emission of all S-GRBs and show the characteristic common power-law behavior of ther rest-frame – GeV luminosity light curves. We discuss also the minimum Lorentz factor of the GeV emission obtained by requiring that the outflow must be optically thin to GeV photons (namely to the pair creation process), as well as its possible energy source, i.e., the matter accretion onto the new formed BH. In Sec. 6 we indicate that there is no evidence in favor or against a common behavior of the X-ray afterglows of the S-GRBs in view of the limited observations. In Sec. 7 we shortly address the issue of the possible emission of short bursts from BH-NS binaries leading to the ultrashort GRBs (U-GRBs, see Fryer et al., 2015b; Ruffini et al., 2016b) In Sec. 8 we infer our conclusions.
2. The fireshell model
In the fireshell model (Ruffini et al., 2001a, b, c), the GRB acceleration process consists in the dynamics of an optically thick plasma of total energy – the fireshell. Its expansion and self-acceleration is due to the gradual annihilation, which has been described in Ruffini et al. (1999). The effect of baryonic contamination on the dynamics of the fireshell has been then considered in Ruffini et al. (2000), where it has been shown that even after the engulfment of a baryonic mass , quantified by the baryon load , the fireshell remains still optically thick and continues its self-acceleration up to ultrarelativistic velocities (Aksenov et al., 2007, 2009). The dynamics of the fireshell in the optically thick phase up to the transparency condition is fully described by and (Ruffini et al., 2000). In the case of long bursts, it is characterized by (Izzo et al., 2012; Patricelli et al., 2012; Penacchioni et al., 2012, 2013), while for short bursts we have (Muccino et al., 2013; Ruffini et al., 2015, 2016a).
The fireshell continues its self-acceleration until the transparency condition is reached; then a first flash of thermal radiation, the P-GRB, is emitted (Ruffini et al., 1999, 2000, 2001b). The spectrum of the P-GRB is determined by the geometry of the fireshell which is dictated, in turn, by the geometry of the pair-creation region. In the case of the spherically symmetric dyadosphere, the P-GRB spectrum is generally described by a single thermal component in good agreement with the spectral data (see, e.g., Muccino et al., 2013; Ruffini et al., 2015). In the case of an axially symmetric dyadotorus, the resulting P-GRB spectrum is a convolution of thermal spectra of different temperatures which resembles more a power-law spectral energy distribution with an exponential cutoff (Ruffini et al., 2016a).
After transparency, the accelerated baryons (and leptons) propagates through the circum-burst medium (CBM). The collisions with the CBM, assumed to occur in fully radiative regime, give rise to the prompt emission (Ruffini et al., 2001b). The spectrum of these collisions, in the comoving frame of the shell, is modeled with a modified BB spectrum, obtained by introducing an additional power-law at low energy with a phenomenological index which describes the departure from the purely thermal case (see Patricelli et al., 2012, for details). The structures observed in the prompt emission of a GRB depend on the CBM density and its inhomogeneities (Ruffini et al., 2004), described by the fireshell filling factor . This parameter is defined as the ratio between the effective fireshell emitting area and the total visible area (Ruffini et al., 2002, 2005). The profile determines the temporal behavior (the spikes) of the light curve. The observed prompt emission spectrum results from the convolution of a large number of modified BB spectra over the surfaces of constant arrival time for photons at the detector (EQuiTemporal Surfaces, EQTS, Bianco & Ruffini, 2005a, b) over the entire observation time. Each modified BB spectrum is deduced from the interaction with the CBM and it is characterized by decreasing temperatures and Lorentz and Doppler factors.
The duration and, consequently, the moment at which the burst emission stops are determined by the dynamics of the plasma. The short duration is essentially due to the low baryon load of the plasma and the high Lorentz factor (see Fig. 2 in Ruffini et al. 2001b and Fig. 4 in Muccino et al. 2013.
The description of both the P-GRB and the prompt emission, requires the appropriate relative spacetime transformation paradigm introduced in Ruffini et al. (2001c): it relates the observed GRB signal to its past light cone, defining the events on the worldline of the source that is essential for the interpretation of the data. This requires the knowledge of the correct equations relating the comoving time, the laboratory time, the arrival time, and the arrival time at the detector corrected by the cosmological effects.
It is interesting to compare and contrast the masses, densities, thickness and distances from the BH of the CBM clouds, both in short and long bursts. In S-GRBs we infer CBM clouds with masses of – g and size of – cm, at typical distances from the BH of – cm (see Secs. 3.2.2 and 4.2.2 and Ruffini et al. 2016a), indeed very similar to the values inferred in long GRBs (see, e.g., Izzo et al., 2012). The different durations of the spikes in the prompt emission of S-GRBs and long bursts depend, indeed, only on the different values of of the accelerated baryons and not on the structure of the CBM: in long bursts we have – (see, e.g., Izzo et al., 2012), while in S-GRBs it reaches the value of (see, e.g., Ruffini et al., 2016a) (see Secs. 3.2.2 and 4.2.2).
The evolution of an optically thick baryon-loaded pair plasma, is generally described in terms of and and it is independent of the way the pair plasma is created. This general formalism can also be applied to any optically thick plasma, like the one created via mechanism in a NS merger as described in Narayan et al. (1992), Salmonson & Wilson (2002), and Rosswog et al. (2003).
Only in the case in which a BH is formed, an additional component to the fireshell emission occurs both in S-GRBs and in the binary-driven hypernovae (BdHNe, long GRBs with erg, details in Ruffini et al. 2017 at the end of the P-GRB phase: the GeV emission observed by Fermi-LAT and AGILE. As outlined in this article, this component has a Lorentz factor and, as we will show in Sec. 5, it appears to have an universal behavior common to S-GRBs and BdHNe. It is however important to recall that the different geometry present in S-GRBs and BdHNe leads, in the case of BdHNe, to the absorption of the GeV emission in some specific cases (Ruffini et al., 2017).
3. The S-GRB 081024B
3.1. Observations and data analysis
The short hard GRB 081024B was detected on 2008 October 24 at 21:22:41 (UT) by the Fermi-GBM (Connaughton & Briggs, 2008). It has a duration s long and exhibits two main peaks, the first one lasting s. Its location (J2000) is consistent with that reported by the Fermi-LAT (Omodei, 2008). The LAT recorded events with energy above MeV within from the position of the burst and within s from the trigger time (Abdo et al., 2010). Emission up to GeV was seen within s after the trigger (Omodei, 2008).
GRB 081024B also triggered the Suzaku-WAM, showing a double peaked light curve with a duration of s (Hanabata et al., 2008). Swift-XRT began observing the field of the Fermi-LAT ks after the trigger, in Photon Counting (PC) mode for ks (Guidorzi et al., 2008b). Three uncatalogued sources were detected within the Fermi-LAT error circle (Guidorzi et al., 2008b), but a series of follow-up observations established that none of them could be the X-ray counterpart because they were not fading (Guidorzi & Margutti, 2008; Guidorzi et al., 2008a; Guidorzi, 2008).
The above possible associations have been also discarded by the optical observations performed in the -band (Fatkhullin et al., 2008). Consequently, no host galaxy has been associated to this burst and, therefore, there no spectroscopic redshift has been determined.
3.1.1 Time-integrated spectral analysis of the Fermi-GBM data
We analyzed the data from the Fermi-GBM detectors, i.e., the NaI-n6 and n9 (– keV) and the BGO-b1 (– MeV), and LAT data 222http://fermi.gsfc.nasa.gov/ssc/data/analysis/documentation/Cicerone/ in the energy range – GeV. In order to obtain detailed Fermi-GBM light curves we analyzed the TTE (Time-Tagged Events) files 333ftp://legacy.gsfc.nasa.gov/fermi/data/gbm/bursts with the RMFIT package. 444http://fermi.gsfc.nasa.gov/ssc/data/analysis/rmfit/vc_rmfit_tutorial.pdf
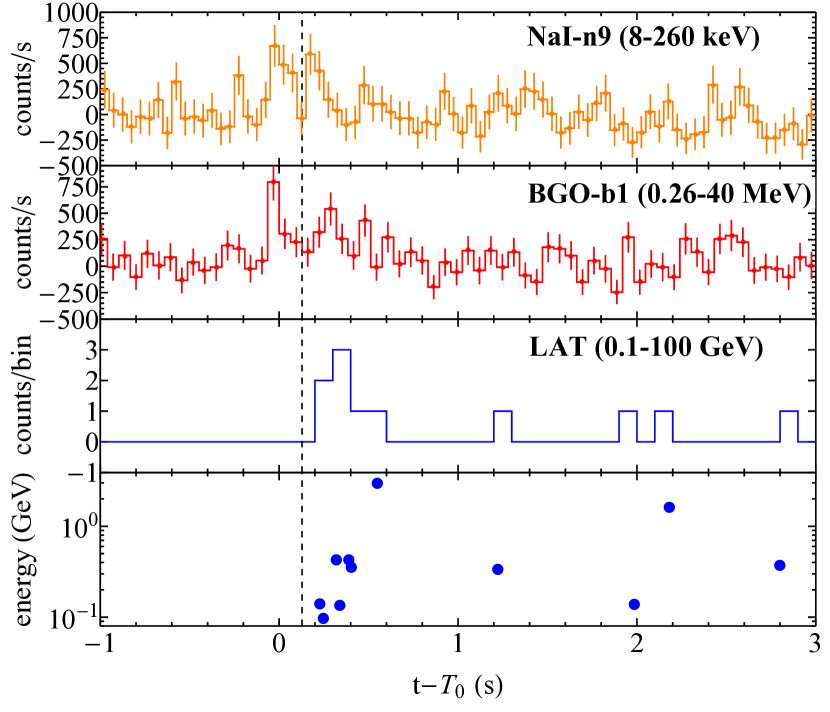
In Fig. 1 we reproduced the ms binned GBM light curves corresponding to the NaI-n9 ( – keV, top panel) and the BGO-b1 ( – MeV, second panel) detectors. We also reproduced the ms binned LAT light curve ( – GeV, third panel) and the corresponding high energy detected photons (bottom panel), both consistent with those reported in Abdo et al. (2010). All the light curves are background subtracted. The GBM light curves show one narrow spike of about s, followed by a longer pulse lasting around s.
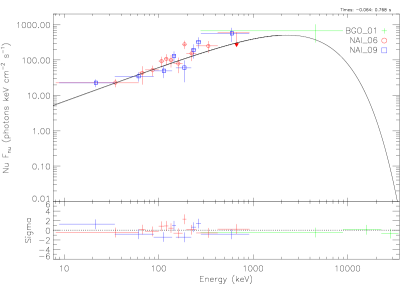
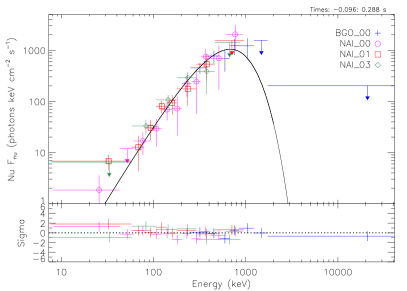
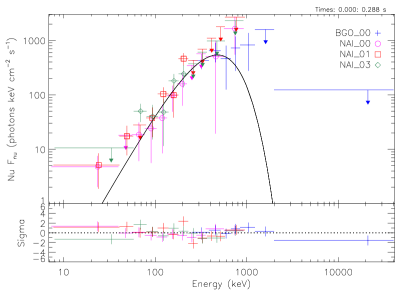
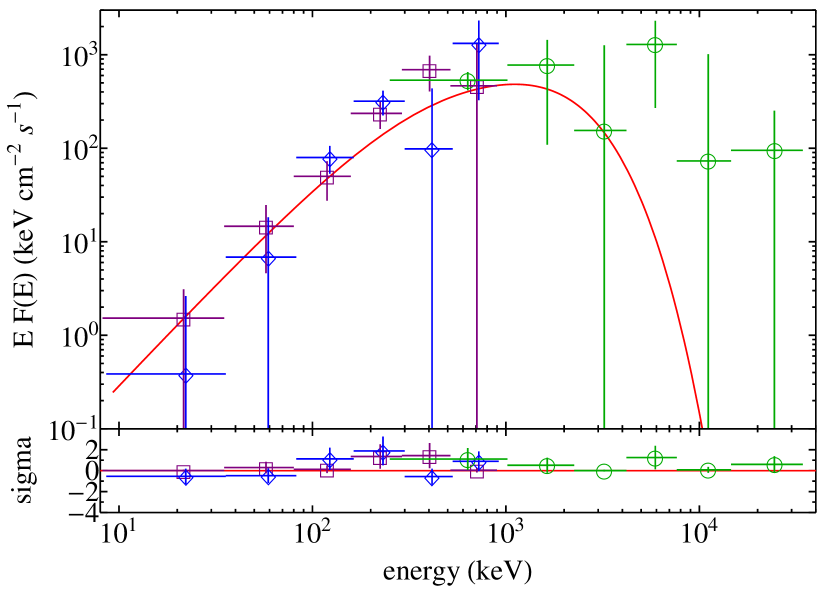
The time-integrated analysis was performed in the time interval from s to s which corresponds to duration of the burst and is the trigger time. We have fitted the corresponding spectrum with two spectral models: Comptonized (Compt, i.e., a power-law model with an exponential cutoff) and Band (Band et al., 1993), see Fig. 2 and Tab. 1. The Compt and the Band models provide similar values of the C-STAT (see Tab. 1). Therefore, the best-fit is the Compt model because it has one parameter less than the Band one.
| S-GRB 081024B | ||||||||
|---|---|---|---|---|---|---|---|---|
| Model | (ph keV-1 cm-2s-1) | (keV) | (MeV) | (erg cm-2s-1) | C-STAT/DOF | |||
| Compt | ||||||||
| Band | ||||||||
| BB | ||||||||
| Compt | ||||||||
| PL | ||||||||
| Compt | (unc) | |||||||
3.1.2 Time-resolved spectral analysis of the Fermi-GBM data
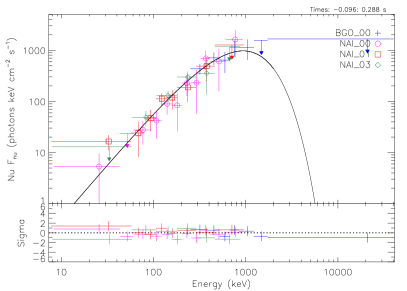
We have also performed the time-resolved analysis by using ms bins. After the rebinning the GBM light curves still exhibit two pulses: the first pulse observed before the LAT emission on-set, from s to s, and the following emission, from s to s, hereafter dubbed as and time intervals, respectively.
As proposed in Ruffini et al. (2015), the emission before the on-set of the LAT emission corresponds to the P-GRB emission, while the following emission is attributed to the prompt emission (see Sec. 2).
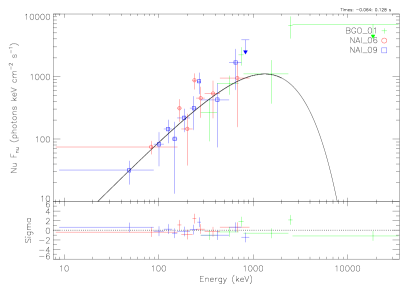
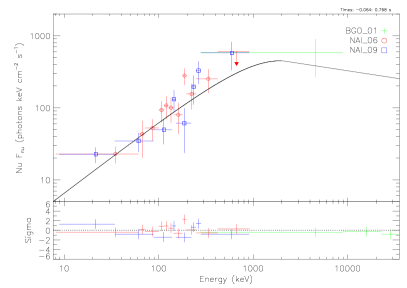
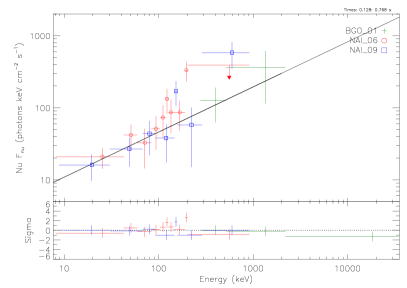
The spectrum of the time interval, which can be interpreted as the P-GRB emission, is equally best-fit, among all the possible models, by a black body (BB) and a Compt spectral models. Fig. 3 and Table 1 illustrate the results of this time-resolved analysis. From the difference in the C-STAT values between the BB and the Compt models (C-STAT, see Tab. 1), we conclude that the simpler BB model can be excluded at confidence level. Therefore the best fit is the Compt model.
As in the case of GRB 090510, a Compt spectrum for the P-GRB emission can be interpreted as the result of the convolution of BB spectra at different Doppler factors arising from the a spinning BH (see Sec. 2 and Ruffini et al., 2016a).
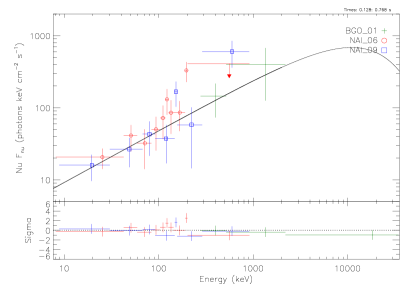
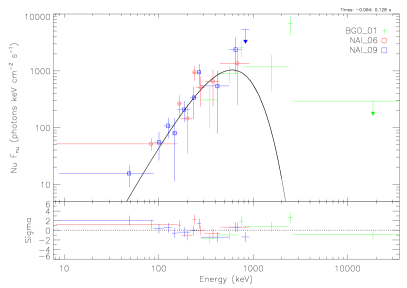
The spectrum of the time interval, which can be interpretated as the prompt emission, is equally best-fit by a power-law (PL) and a Compt spectral models (see Fig. 4 and Table 1). The PL and the Compt models are equivalent, though Compt model slightly improves the C-STAT statistic. However, because of the unconstrained value for the peak energy of the Compt model , we conclude that the PL model represents an acceptable fit to the data.
3.2. Theoretical interpretation within the fireshell model
We proceed to the interpretation of the data analysis performed in Sec. 3.1 within the fireshell model.
3.2.1 The estimate of the redshift
The identification of the P-GRB and of the prompt emission is fundamental in order to estimate the source cosmological redshift and, consequently, to determine all the physical properties of the plasma at the transparency point (Muccino et al., 2013; Ruffini et al., 2015). The method introduced in Muccino et al. (2013) allows to determine the source redshift from two main observational constraints: the observed P-GRB temperature , related to the theoretically-computed rest-frame temperature , and the ratio between the P-GRB fluence and the total one , which represents a good redshift independent approximation for the ratio (see Tab. 1). A trial and error procedure is then started, using various set of values for and to reproduce the observational constraints. Each of these set of values provides various possible values for the redshift from the relation between and . The closure condition is represented by the , where is computed taking into account the -correction on (Schaefer, 2007). The redshift verifying the last condition and the corresponding values of and are the correct one for the source. The theoretical redshift together with all the other quantities so far determined are summarized in Tab. 2 (for further details on the method see, e.g., Ruffini et al., 2015). The analogy with the prototypical source GRB 090227B (, Muccino et al., 2013), GRB 140619B (, Ruffini et al., 2015), and GRB 090510 (, Ruffini et al. 2016a) is very striking.
3.2.2 Analysis of the prompt emission
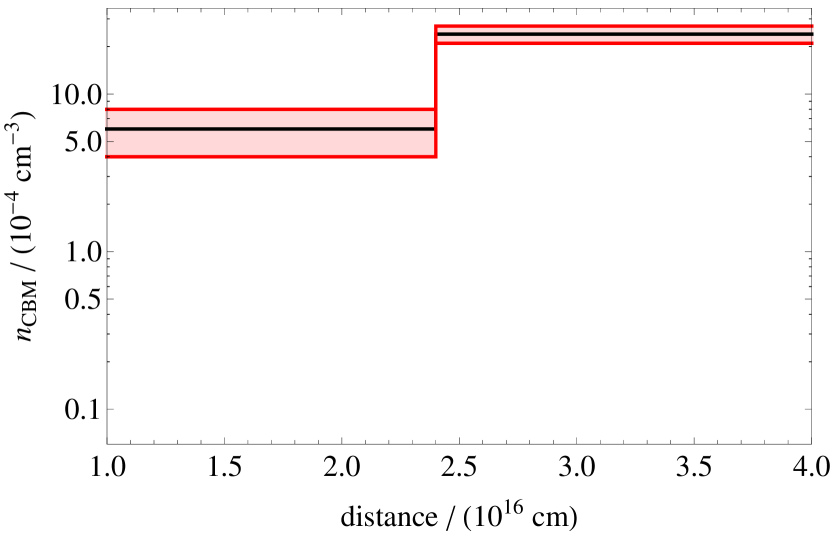
In the fireshell model, the prompt emission light curve is the result of the interaction of the accelerated baryons with the CBM (see above and, e.g., Ruffini et al., 2002, 2006; Patricelli et al., 2012). After the determination of the initial conditions for the fireshell, i.e., and (see Tab. 2), to simulate the prompt emission light curve of the S-GRB 081024B (see Figs. 1) and its corresponding spectrum, we derived the CBM number density and the filling factor distributions and the corresponding attached errors (see Tab. 2 and Fig. 5, top panel). The average CBM number density inferred from the prompt emissions of GRB 081024B is (see Tab. 2), and is larger than those of GRB 140619B, cm-3 (Ruffini et al., 2015), and GRB 090227B, cm-3 (Muccino et al., 2013), but still typical of the S-GRB galactic halo environments.
| P-GRB | |||||||
| ( erg) | ( M⊙) | () | ( cm) | (MeV) | |||
| Prompt | |||||||
| Cloud | (cm) | (cm) | ( cm-3) | ( g) | (cm) | ||
| average | |||||||
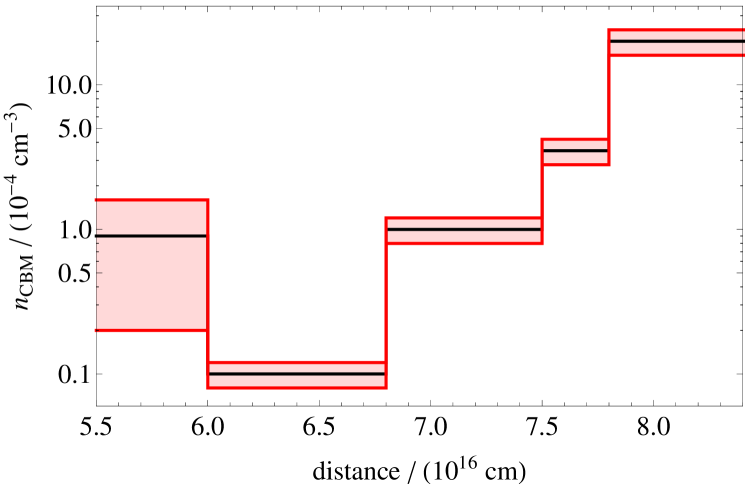
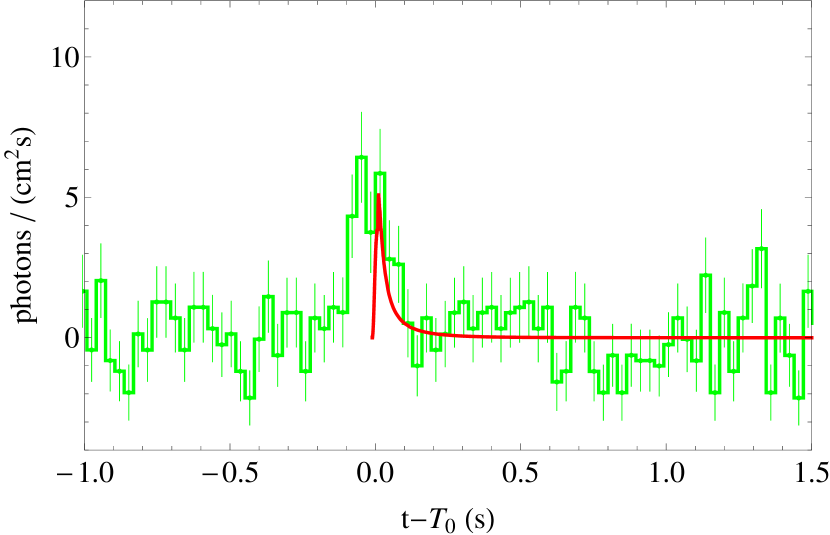
The simulation of the prompt emission light curve of the NaI-n9 ( – keV) data of GRB 081024B is shown in Fig. 5 (middle panel). The short time scale variability observed in the S-GRB light curves is the result of the large values of the Lorentz factor (, see Tab. 2). Under these conditions the total transversal size of the fireshell visible area, , is smaller than the thickness of the inhomogeneities ( cm, see the values indicated in Tab. 2), justifying the spherical symmetry approximation (Ruffini et al., 2002, 2006; Patricelli et al., 2012) and explaining the no significant “broadening” in arrival time of the luminosity peaks.
The corresponding spectrum is simulated by using the spectral model described in Patricelli et al. (2012) with phenomenological parameters . The rebinned data within the time interval agree with the simulation, as shown by the residuals around the fireshell simulated spectrum (see Fig. 5, bottom panel).
4. The S-GRB 140402A
4.1. Observations and data analysis
The short hard GRB 140402A was detected on 2014 April 2 at 00:10:07.00 (UT) by the Fermi-GBM (Jenke & Yu, 2014). The duration of this S-GRB in the – keV is s. It was also detected by the Fermi-LAT (Bissaldi et al., 2014) with a best on-ground location (J2000), consistent with the GBM one. More than photons were detected above MeV and within from the GBM location, which spatially and temporally correlates with the GBM emission with high significance (Bissaldi et al., 2014).
This burst was also detected by the Swift-BAT (Cummings, 2014), with a best location (J2000). No source was detected in the Swift-XRT data (Pagani, 2014a) after two pointings in PC mode, from ks to ks and from ks to ks, respectively. These two observation set are within the -sigma upper limit of the count rate of counts/s and counts/s, respectively (Pagani, 2014a). Optical exposures at the full refined BAT position (Cummings, 2014) took by the Swift-UVOT (during both the XRT pointings, Breeveld & Pagani, 2014) and by Magellan (at days after the burst, Fong et al., 2014) showed no optical afterglow. This allowed to set, respectively, -sigma upper limits of mag and of mag. Consequently, no host galaxy has been associated to this burst and, therefore, no spectroscopic redshift has been determined.
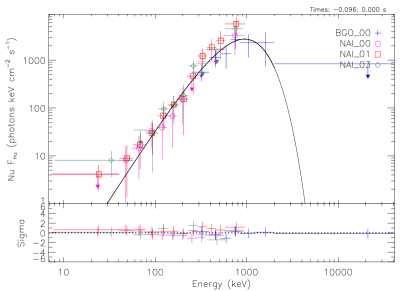
4.1.1 Time-integrated spectral analysis of the Fermi-GBM data
In Fig. 6 we reproduced the ms binned GBM light curves corresponding to detectors NaI-n3 ( – keV, top panel) and BGO-b0 ( – MeV, second panel), and the s binned high-energy light curve ( – GeV, bottom panel). Also for this burst all the light curves are background subtracted.
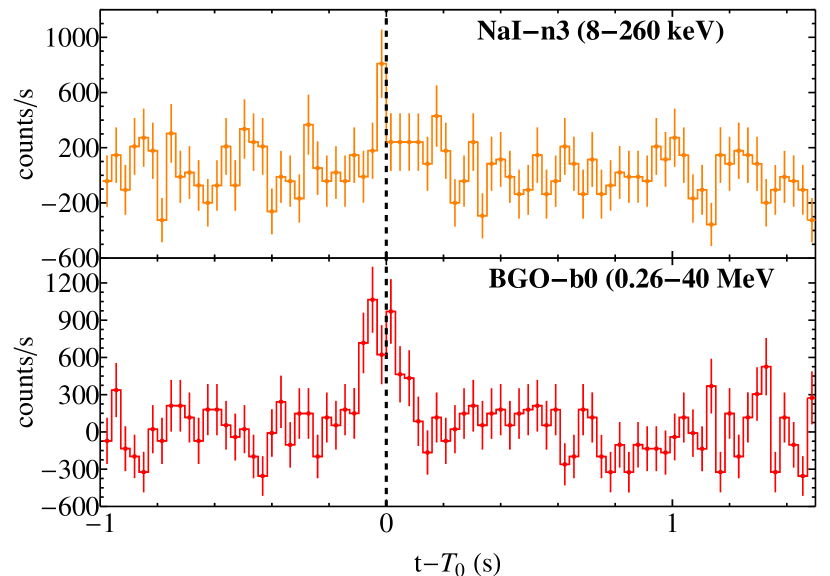
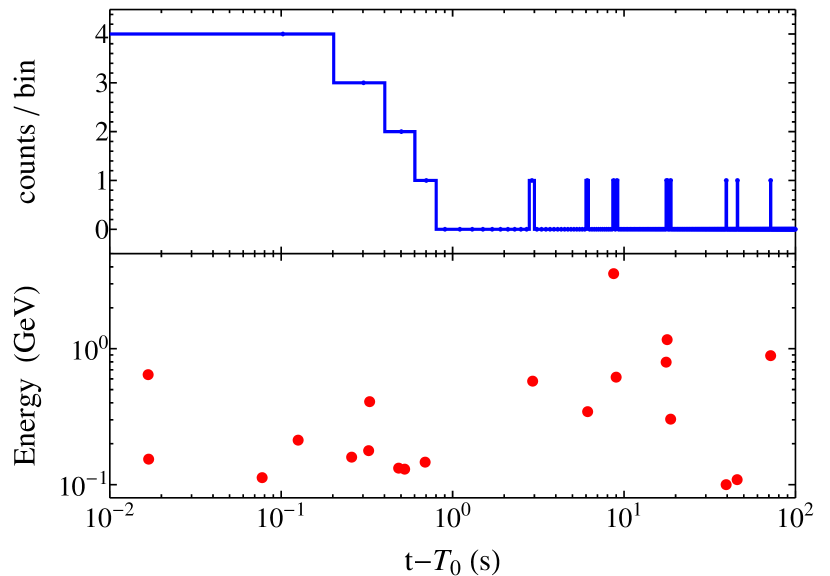
The NaI light curve shows a very weak and short pulse, almost at the background level, while the BGO signal exhibit two sub-structures with a total duration of s. The vertical dashed line in Fig. 6 represents the on-set of the LAT emission, soon after the first pulse seen in both the GBM light curves. The background subtracted LAT light curve within s after the GBM trigger and the corresponding photons with energies higher than GeV are shown in Fig. 7.
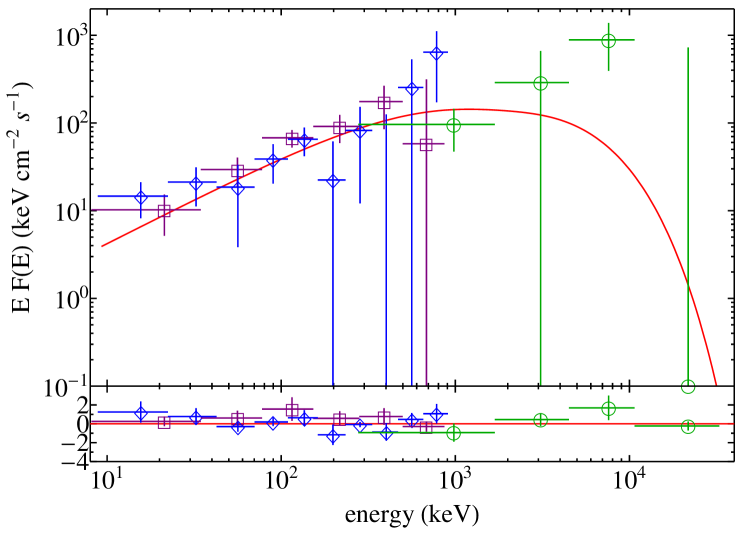
We performed the time-integrated spectral analysis in the time interval from s to s (hereafter ). To increase the poor statistics at energies keV, we included also the data from the NaI–n0 and n1 detectors in the spectral analysis. Among all the possible models, BB and Compt equally best-fit the above data (see Fig. 8 and the results listed in Tab. 3). From the value C-STAT between the above two models (see Tab. 3), we conclude that the Compt model is an acceptable fit to the data. Similar to the GRB 140619B (Ruffini et al., 2015), also in the case of GRB 140402A the low-energy index of the Compt model is consistent with . From theoretical and observational considerations on the on-set of the GeV emission (see Sec. 2 and Fig. 6), we investigate the presence of a spectrum consistent with a BB one, which corresponds to the signature of the P-GRB emission for moderately spinning BH (see Ruffini et al., 2016a).
| S-GRB 140402A | ||||||||
|---|---|---|---|---|---|---|---|---|
| Model | (ph keV-1 cm-2s-1) | (keV) | (MeV) | (erg cm-2s-1) | C-STAT/DOF | |||
| BB | ||||||||
| Compt | ||||||||
| BB | ||||||||
| Compt | ||||||||
| BB | ||||||||
| Compt | ||||||||
4.1.2 Time-resolved spectral analysis of the Fermi-GBM data
The first spike (see Fig. 6), observed before the on-set of the GeV, emission extends from s to (hereafter ). Again BB and Compt spectral models equally best-fit the above data. As it is shown in Fig. 9 and Tab. 3, the above two models are almost indistinguishable, with the low-energy index of the Compt model being consistent within almost 1- level with the low energy index of a BB (). We conclude that the BB model is an acceptable fit to the data and identify the first pulse in the light curve with the P-GRB emission.
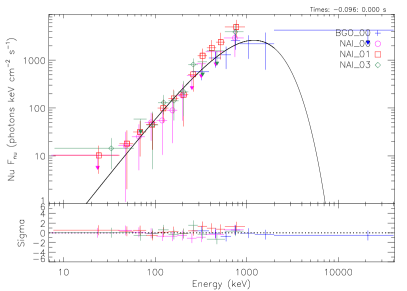
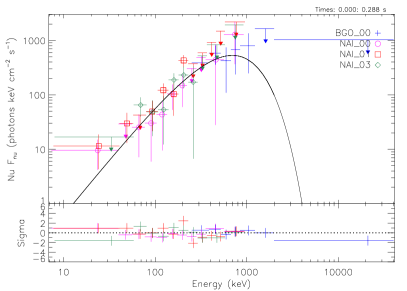
The spectrum of the emission in the time interval from to s (hereafter ) reveals that a Compt model fits slightly better the data points at MeV and its low-energy index indicates that the energy distribution is somehow broader than that of a BB model (see Fig. 10 and Tab. 3). The Compt model is consistent with the modified BB spectrum adopted in the fireshell model for the prompt emission (Patricelli et al., 2012). Therefore we identify the time interval with the prompt emission.
4.2. Theoretical interpretation within the fireshell model
We proceed to the interpretation of the data analysis performed in Sec. 4.1 within the fireshell model.
4.2.1 The estimate of the redshift
After having identified of the P-GRB emission of the S-GRB 140402A (see Sec. 4.1.2), we follow the same loop procedure recalled in Sec. 3.2.1 to infer the redshift, and of the source. The results of this method are summarized in Tab. 4. In particular the theoretically derived redshift for this source is . Again, the analogy with the S-GRBs 081024B (see Sec. 3.1.2), GRB 090227B (Muccino et al., 2013), 140619B (Ruffini et al., 2015), and 090510 (Ruffini et al., 2016a) is very striking.
4.2.2 Analysis of the prompt emission
Similarly to the case of the S-GRB 081024B (see Sec. 3.2.2), to simulate the prompt emission light curve of the S-GRB 140402A (see Fig. 6) and its corresponding spectrum, we derived the CBM number density and the filling factors distributions (see Tab. 4 and Fig. 11, top panel). Also in this case the inferred values fully justify the adopted spherical symmetry approximation (Ruffini et al., 2002, 2006; Patricelli et al., 2012) and explain the negligible “dispersion” in arrival time of the luminosity peak.
| P-GRB | |||||||
| ( erg) | ( M⊙) | () | ( cm) | (MeV) | |||
| Prompt | |||||||
| Cloud | (cm) | (cm) | ( cm-3) | ( g) | (cm) | ||
| average | |||||||
The average CBM number density in the case of GRB 140402A is (see Tab. 4), which is similar to that inferred from GRB 081024B. The simulation of the prompt emission light curve of the BGO-b0 ( – MeV) data of GRB 140402A is shown in Fig. 11 (middle panel). The simulation of the corresponding spectrum requires a phenomenological parameter . Fig. 11 (bottom panel), displays the agreement between the rebinned data from the time interval with the simulation.
5. The GeV emission in S-GRBs
Before going into more details on the general properties of the S-GRB GeV emission, we briefly summarize the observational features and the data analysis of the high energy emission of the S-GRBs 081024B and 140402A, and then we turn back to a new analysis on the absence of the GeV emission in the S-GRBs 090227B.
5.1. The GeV emission of the S-GRBs 081024B and 140402A
We downloaded the LAT event and spacecraft data555http://fermi.gsfc.nasa.gov/cgi-bin/ssc/LAT/LATDataQuery.cgi selecting the observational time, the energy range and the source coordinates (Bissaldi et al., 2014).
We then made cuts on the dataset time and energy range, position (Bissaldi et al., 2014), region of interest (ROI) radius (typically), and maximum zenith angle.666The maximum zenith angle selection excludes any portion of the ROI which is too close to the Earth’s limb, resulting in elevated background levels.
Within the event selection recommendations for the analysis of LAT data using the Pass 8 Data (P8R2) we adopted the burst and transient analysis (for events lasting s) with an energy selection of – GeV, a ROI-based zenith angle cut of , an event class , and the instrument response function P8R2_TRANSIENT020_V6.777http://fermi.gsfc.nasa.gov/ssc/data/analysis/documentation/Cicerone/
Cicerone_Data_Exploration/Data_preparation.html
The additional selection of the good time intervals (GTIs) when the data quality is good (DATA_QUAL>0) is introduced to exclude time periods when some spacecraft event has affected the quality of the data (in addition to the time selection to the maximum zenith angle cut introduced above).
In the case of the S-GRB 081024B, we obtained the GeV light curve and the observed photon energies showed in Fig. 1 (third and fourth panels), which are in agreement with those reported in Ackermann et al. (2013). In the case of the S-GRB 140402A, we obtained the GeV light curve showed in Fig. 7 (upper plot). About photons with energies higher than GeV have been detected within s after the GBM trigger (see Fig. 7, lower panel). The highest energy photon is a GeV event which is observed at s.
Then, we built up the rest-frame – GeV light curve of the S-GRBs 081024B and 140402A. For the S-GRB 081024B, we rebinned its GeV emission luminosity light curve into two bins, as displayed in Ackermann et al. (2013). For the S-GRB 140402A, we rebinned it into two time bins with enough photons to perform a spectral anlysis: from to s, and from s to s.
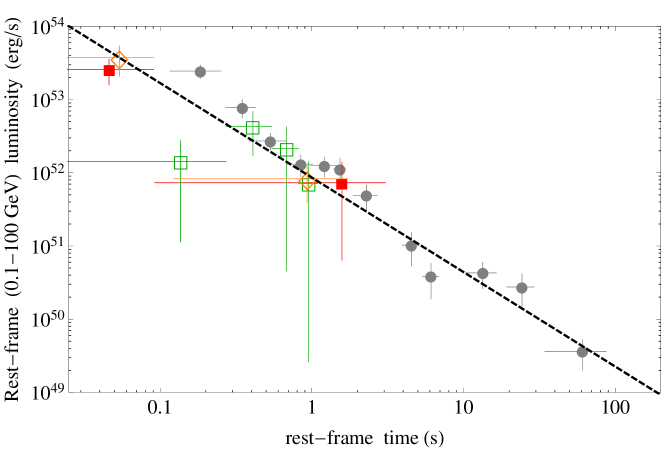
The resulting luminosity light curves follow a common power-law trend with the rest-frame time which goes as (see dashed black line in Fig. 12). All the light curves are shown from the burst trigger times on, while in the case of the S-GRB 090510 it starts after the precursor emission, i.e., from the P-GRB emission on (see Ruffini et al., 2016a, for details). The GeV emission of the S-GRB 140402A is the second longest in time duration after GRB 090510, which exhibits a common behavior with the light curves of the other S-GRBs after s rest-frame time (see Fig. 12).
Tab. 5 lists the redshift, , (in the rest-frame energy band – keV), and the GeV isotropic emission energy in the rest-frame energy band – GeV of the five authentic S-GRBs discussed here. These values of are simply obtained by multiplying the average luminosity in each time bin by the corresponding rest-frame duration and, then, by summing up all the contributions for each bin. However, these estimates represent lower limits to the actual GeV isotropic emission energies, since at late times the observations of GeV emission could be prevented due to instrumental threshold of the LAT.
| GRB | z | |||||||
|---|---|---|---|---|---|---|---|---|
| (MeV) | ( erg) | (GeV) | ( erg) | (M⊙) | (M⊙) | |||
| 081024B | ||||||||
| 090227B | – | – | – | – | – | |||
| 090510 | ||||||||
| 140402A | ||||||||
| 140619B |
5.2. Reanalyzing the GeV emission of the S-GRB 090227B
We performed the unbinned likelihood analysis method,888https://fermi.gsfc.nasa.gov/ssc/data/analysis/scitools/lat_grb_analysis.html which is preferred when the number of events is expected to be small, for the S-GRB 090227B. We took spectra within s, s, s, and s, after the burst trigger. The background point like sources and diffuse (galactic and extragalactic) emission within from the GRB position are taken from LAT 4-year Point Source Catalog (3FGL). The test statistic (TS) computed from the above likelihood analysis is TS in each time interval ( corresponds to 5- of significance), therefore, no significant GeV emission can be associated to this GRB. A single GeV photon with energy GeV at time s after the trigger and within from the GRB has been found. Considering the above background models, we computed the probability for this photon to belong to this GRB. The likelihood analysis gives a probability of this photon to correlate to GRB 090227B of , while its probability of being a photon from the diffuse background is .
The results of this analysis are in agreement with those reported in Ackermann et al. (2013). There, it is also stated that an autonomous repoint request by the Fermi-GBM brought the LAT down to after s and, therefore, the source entered in the optimal LAT FoV. By using the S-GRB common power-law trend (see dashed black line in Fig. 12), we computed the expected energy fluxes of the GeV emission of the S-GRB 090227B , at the time of s when the source entered the LAT FoV, and , at s when the diffuse background photon was detected. We assumed a power-law spectrum with a typical value of the photon index of and obtained erg cm-2s-1 and erg cm-2s-1. These computed fluxes are within the Fermi-LAT sensitivity of the Pass 8 Release 2 Version 6 Instrument Response Functions, 999http://www.slac.stanford.edu/exp/glast/groups/canda/lat_Performance_files/broadband_flux_sensitivity_p8r2_source_v6_all_10yr_zmax100_n03.0_e1.50_ts25.png which is approximately erg cm-2s-1. Therefore, we can conclude that the GeV emission associated to the S-GRB 090227B ceased before s, when the source entered the LAT FoV.
5.3. Lower limits on the GeV emission Lorentz factors in S-GRBs
Following Lithwick & Sari (2001), it is possible to derive a lower limit on the Lorentz factor of the GeV emission by requiring that the outflow must be optically thin to high energy photons, namely to the pair creation process. Using the maximum GeV photon observed energy in Tab. 5, for each S-GRB various lower limits on the GeV Lorentz factors can be derived from the time resolved spectral analysis. For each S-GRB we estimate lower limits in each time interval of the GeV luminosity light curves in Fig. 12. Then, for each S-GRB has been then determined as the largest among the inferred lower limits (see Tab. 5). The GeV photons are produced in ultrarelativistic outflows with .
5.4. The energy budget of the GeV emission in S-GRBs
Ruffini et al. (2016a) proposed that the – GeV in S-GRBs (see Fig. 12) is produced by the mass accretion onto the newborn KNBH. The amount of mass that remains bound to the BH is given by the conservation of energy and angular momentum from the merger moment to the BH birth. We can estimate lower limits of the needed mass to explain the energy requirements in Tab. 5 by considering the above accretion process onto a maximally rotating Kerr BH. In this case, depending whether the infalling material is in co- or counter-rotating orbit with the spinning BH, the maximum efficiency of the conversion of gravitational energy into radiation is or , respectively (see Ruffini & Wheeler 1969, in problem of 104 in Landau & Lifshitz 2003). Therefore, can be expressed as
| (1) |
where is the beaming factor which depends on the geometry of the GeV emission, and is the amount of accreted mass corresponding to the choice of the efficiency . The observational evidence that the totality of S-GRBs exhibit GeV emission and that its absence is due instrumental absence of alignment between the LAT and the source at the time of the GRB emission (see Sec. 5.2) suggest that no beaming is necessary in Eq. 1. Therefore, in the following we set . The corresponding estimates of in our sample of S-GRBs are listed in Tab. 5.
6. On the detectability of the X-ray emission of S-GRBs
GRB 090510 is the only S-GRB with a complete X-ray afterglow (see Fig. 13(a) and Ruffini et al., 2016a). Only upper limits exist for the X-ray afterglow emission of the other S-GRBs and no special features are identifiable.
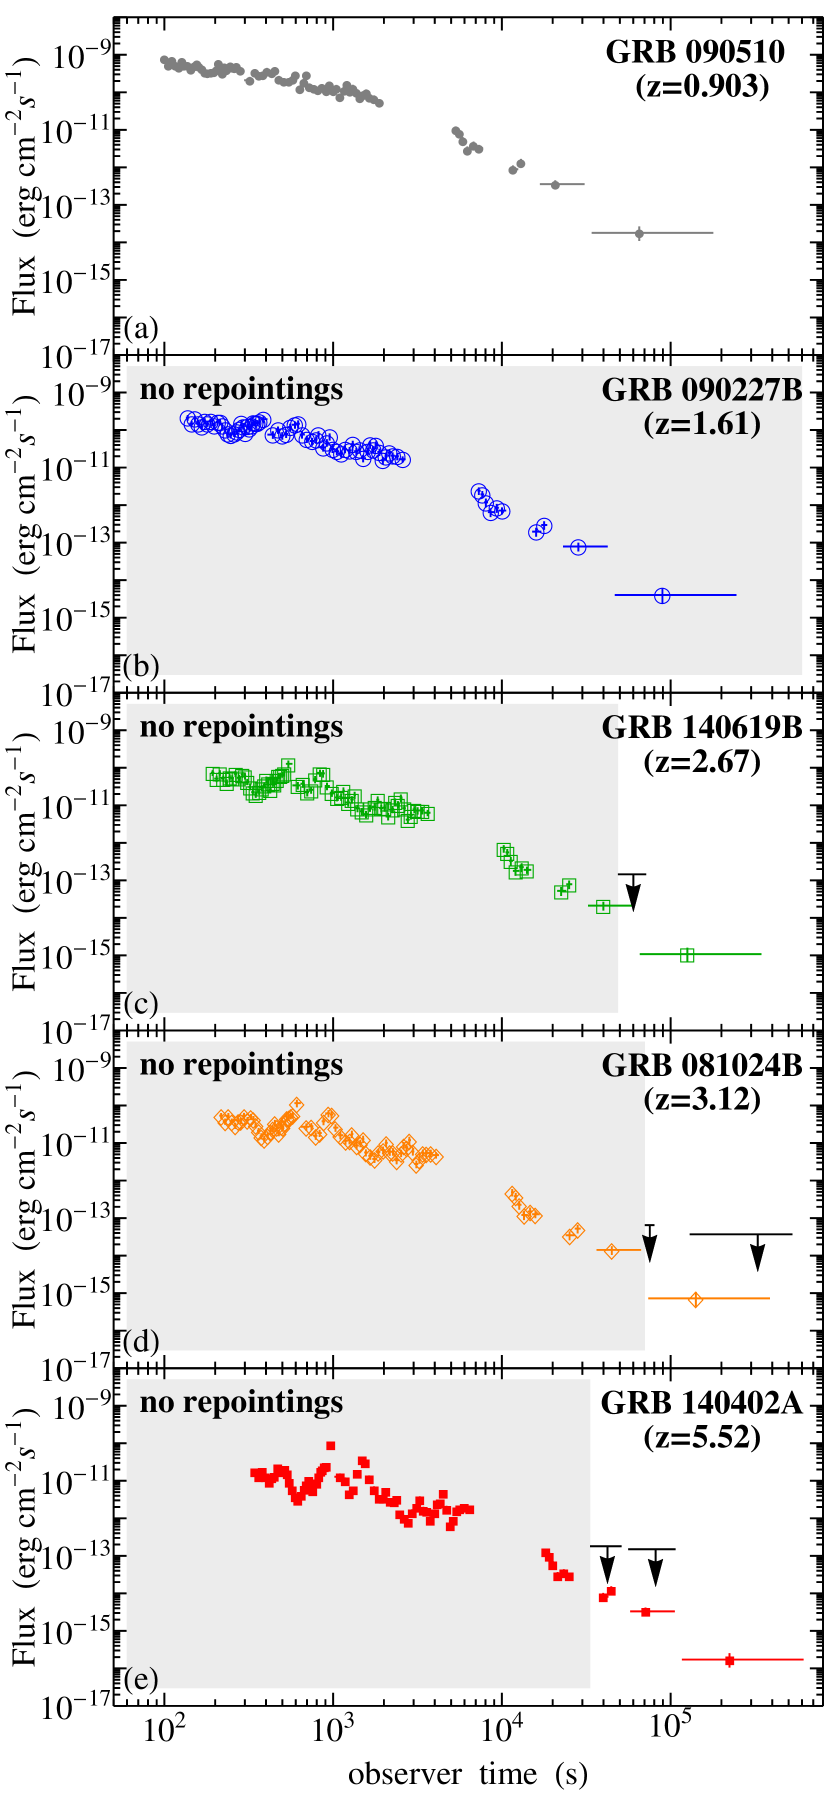
As an example to evidence the difficulty of measuring the X-ray afterglow in S-GRBs, we computed the observed X-ray flux light curve of GRB 090510, actually observed at , as if it occurred at the redshifts of the other S-GRBs, i.e., , , , and . This can be attained through four steps.
-
(1)
In each time interval of the X-ray flux light curve of GRB 090510, we assume that the best fit to the spectral energy distribution is a power-law function with photon index , i.e., .
-
(2)
In the rest-frame of GRB 090510, we identify the spectral energy range for a source at redshift which corresponds to the – keV observed by Swift-XRT, i.e.,
-
(3)
We rescale the fluxes for the different luminosity distance . Therefore, the observed – keV X-ray flux light curve for a source at redshift is given by
(2) -
(4)
We transform the observational time of GRB 090510 at into the observational time for a source at by taking into account the time dilation due to the cosmological redshift effect, i.e.,
(3)
Fig. 13 shows that all the computed flux light curves are well below the observational upper limits provided by the Swift-XRT repointings.
-
-
S-GRB 090227B, no repointings (see Fig. 13(b)).
- -
-
-
S-GRB 081024B, two repointings within the flux light curve in Fig. 13(d). Each upper limit was set by using the lowest count rate among those of the uncatalogued sources within the LAT FoV, later on confirmed as not being the burst X-ray counterparts: the first one at ks after the trigger for ks with a count rate of counts/s (Guidorzi et al., 2008b); the second one from to days with an average count rate of counts/s (Guidorzi et al., 2008a).
- -
We converted the above count rate upper limits in fluxes by multiplying for a typical conversion factor erg/cm2/counts (see, e.g., Pagani, 2014b).
We conclude that there is no evidence in favor or against a common behavior of the X-ray afterglows of the S-GRBs in view of the limited observations.
7. On the short bursts originating in BH–NS mergers
As pointed out in Fryer et al. (2015b), Ruffini et al. (2016b) and Ruffini et al. (2016c), U-GRBs are expected to originate in the BH–NS binaries produced by the further evolution of the BdHNe (see, e.g., Becerra et al., 2016; Ruffini et al., 2016b). We recall that BdHN progenitor systems are composed of a carbon-oxygen core (COcore) and a NS in a close binary system. When the COcore explodes as a supernova (SN) Ib/c, its ejecta starts a hypercritical accretion process onto the companion NS, pushing its mass beyond the value , and leading to the formation of a BH. This BH, together with the new NS (NS) produced out of the SN event, leads to the progenitor systems of the U-GRBs.
The orbital velocities of the BH–NS binaries formed from BdHNe are high and even large kicks are unlike to make these systems unbound (Fryer et al., 2015b). U-GRBs represent a new family of BH–NS binaries unaccounted for in current standard population synthesis analyses (see, e.g., Fryer et al., 2015b).
U-GRBs are expected to lead to harder and shorter bursts in -rays, which explains the lack of their observational identification (Fryer et al., 2015b), and pose a great challenge possibly to be considered to emit fast radio bursts. They also could manifest themselves, before the merging, as pulsar-BH binaries (see, e.g., Tauris et al., 2015, and references therein).
8. Conclusions
We have first recalled the division of short bursts into two different sub-classes (Ruffini et al., 2015): the S-GRFs, with erg, MeV and no GeV emission, and the authentic S-GRBs, with erg, MeV and with the presence of the GeV emission, always detected by Fermi-LAT, when operative (Ruffini et al., 2015).
We then focus on two additional examples of S-GRBs: GRB 081024B, with erg and MeV (see Sec. 3), and GRB 140402A, with erg and MeV (see Sec. 4).
We perform time-integrated and time-resolved spectral analyses on both these sources (see Secs. 3.1.1–3.1.2 and Secs. 4.1.1–4.1.2) and infer their cosmological redshifts ( for the S-GRB 081024B and for the S-GRB 140402A, see Secs. 3.2.1 and 4.2.1, respectively). We also identify their P-GRB spectral emission. The P-GRB emission of S-GRB 081024B exhibit the convolution of BB spectra at different Doppler factors arising from a spinning BH, in total analogy with S-GRB 090510 (see Sec. 2 and 3.1.2 and Ruffini et al., 2016a). The P-GRB emission of S-GRB 140402A is consistent with a single BB, expected to occur for a moderately spinning BH (see Sec. 4.1.2 Ruffini et al., 2016a).
The baryon load mass MB, the Lorentz factor and the properties of the CBM clouds are in agreement with those of the other S-GRBs: M M⊙, (see Secs 3.2.1 and 4.2.1), distances of the CBM clouds cm and CBM densities cm-3 (see Secs 3.2.2 and 4.2.2), typical of galactic halos environment (see, e.g., Muccino et al., 2013; Ruffini et al., 2015).
In analogy to the other S-GRBs we confirm that the turn-on of the GeV emission starts after the P-GRB emission and is coeval with the occurrence of the prompt emission (see Sec. 5). All these coincidences point to the fact that the GeV emission originates from the on-set of the BH formation (see the space-time diagrams in Fig. 3 of Ruffini et al., 2016a).
Most noteworthy, the existence of a common power-law behavior in the rest-frame – GeV luminosities (see Fig. 12 in Sec. 5), following the BH formation, points to a commonality in the mass and spin of the newly-formed BH in all these S-GRBs. This result is explainable with the expected mass of the merging NSs, each one of – (Özel & Freire, 2016), and the expected range of the non-rotating NS critical mass M– M⊙ leading to a standard value of the BH mass and of its Kerr parameter (Ruffini et al., 2015).
Finally, in all S-GRBs the energetic of the GeV emission implies the accretion of – or – for co- or counter-rotating orbits with a maximally rotating BH, respectively (see Sec. 5). This accretion process, occurring both in S-GRBs and also BdHNe (Becerra et al., 2016), is currently being analyzed for the occurrence of r-process (Ruffini et al., 2014; Becerra et al., 2016).
In all the identified S-GRBs, within the Fermi-LAT FoV, GeV photons are always observed (Ruffini et al., 2016a, b). This implies that no intrinsic beaming is necessary for the S-GRB GeV emission. The Lorentz factor of the GeV emission is .
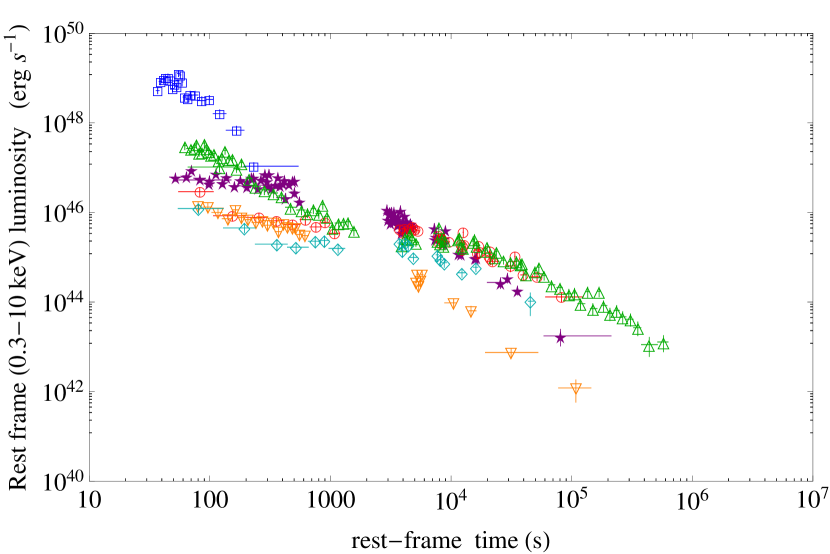
From Fig. 13 for the S-GRBs and from Fig. 14 for S-GRFs we conclude that in both systems there is no evidence for the early X-ray flares observed in BdHNe Ruffini et al. (2017).
Before closing, we return to the issue of the GW detectability by aLIGO from S-GRBs. We have already evidenced their non detectability in GRB 090227B (Oliveira et al., 2014) and GRB 140619B (Ruffini et al., 2015) by aLIGO by computing the signal to noise ratio S/N up to the contact point of the binary NS components. In both cases each NS has been assumed to have mass . There, it has been concluded that the GW signals emitted in such systems were well below the value S/N needed for a positive detection.
These considerations have been extended in Ruffini et al. (2016c) to all S-GRBs. It was there concluded that such signals might be detectable for sources located at (i.e., at distances smaller than the GW detection horizon of Mpc) for the aLIGO run. GRB 090510, to date the closest S-GRB, is located at (i.e., Mpc) and, therefore, it is outside such a GW detection horizon. We can then conclude that for sources at distances larger than that of GRB 090510, like GRB 081024B (at ) and GRB 140402A (at ) analyzed in this paper, no GW emission can be detected.
References
- Abdo et al. (2010) Abdo, A. A., Ackermann, M., Ajello, M., et al. 2010, ApJ, 712, 558
- Ackermann et al. (2013) Ackermann, M., Ajello, M., Asano, K., et al. 2013, ApJS, 209, 11
- Aksenov et al. (2007) Aksenov, A. G., Ruffini, R., & Vereshchagin, G. V. 2007, Physical Review Letters, 99, 125003
- Aksenov et al. (2009) —. 2009, Phys. Rev. D, 79, 043008
- Aptekar et al. (1995) Aptekar, R. L., Frederiks, D. D., Golenetskii, S. V., et al. 1995, Space Sci. Rev., 71, 265
- Band et al. (1993) Band, D., Matteson, J., Ford, L., et al. 1993, ApJ, 413, 281
- Barthelmy et al. (2005) Barthelmy, S. D., Chincarini, G., Burrows, D. N., et al. 2005, Nature, 438, 994
- Becerra et al. (2016) Becerra, L., Bianco, C. L., Fryer, C. L., Rueda, J. A., & Ruffini, R. 2016, ApJ, 833, 107
- Becerra et al. (2015) Becerra, L., Cipolletta, F., Fryer, C. L., Rueda, J. A., & Ruffini, R. 2015, ApJ, 812, 100
- Belczynski et al. (2006) Belczynski, K., Perna, R., Bulik, T., et al. 2006, ApJ, 648, 1110
- Belvedere et al. (2014) Belvedere, R., Boshkayev, K., Rueda, J. A., & Ruffini, R. 2014, Nuclear Physics A, 921, 33
- Belvedere et al. (2012) Belvedere, R., Pugliese, D., Rueda, J. A., Ruffini, R., & Xue, S.-S. 2012, Nuclear Physics A, 883, 1
- Belvedere et al. (2015) Belvedere, R., Rueda, J. A., & Ruffini, R. 2015, ApJ, 799, 23
- Berger (2014) Berger, E. 2014, ARA&A, 52, 43
- Bianco & Ruffini (2005a) Bianco, C. L., & Ruffini, R. 2005a, ApJ, 633, L13
- Bianco & Ruffini (2005b) —. 2005b, ApJ, 620, L23
- Bildsten & Cutler (1992) Bildsten, L., & Cutler, C. 1992, ApJ, 400, 175
- Bissaldi et al. (2014) Bissaldi, E., Vianello, G., & Chiang, J. 2014, GRB Coordinates Network, 16069, 1
- Breeveld & Pagani (2014) Breeveld, A. A., & Pagani, C. 2014, GRB Coordinates Network, 16077, 1
- Brown et al. (2004) Brown, D. A., Babak, S., Brady, P. R., et al. 2004, Classical and Quantum Gravity, 21, S1625
- Calderone et al. (2015) Calderone, G., Ghirlanda, G., Ghisellini, G., et al. 2015, MNRAS, 448, 403
- Cipolletta et al. (2015) Cipolletta, F., Cherubini, C., Filippi, S., Rueda, J. A., & Ruffini, R. 2015, ArXiv e-prints
- Clark & Eardley (1977) Clark, J. P. A., & Eardley, D. M. 1977, ApJ, 215, 311
- Connaughton & Briggs (2008) Connaughton, V., & Briggs, M. 2008, GRB Coordinates Network, 8408
- Cummings (2014) Cummings, J. R. 2014, GRB Coordinates Network, 16073, 1
- Dezalay et al. (1992) Dezalay, J.-P., Barat, C., Talon, R., et al. 1992, in American Institute of Physics Conference Series, Vol. 265, American Institute of Physics Conference Series, ed. W. S. Paciesas & G. J. Fishman, 304–309
- Eichler et al. (1989) Eichler, D., Livio, M., Piran, T., & Schramm, D. N. 1989, Nature, 340, 126
- Fatkhullin et al. (2008) Fatkhullin, T., Moskvitin, A., & Castro-Tirado, A. J. 2008, GRB Coordinates Network, 8456
- Fong et al. (2014) Fong, W., Ehlert, S., Osip, D., et al. 2014, GRB Coordinates Network, 16080, 1
- Fox et al. (2005) Fox, D. B., Frail, D. A., Price, P. A., et al. 2005, Nature, 437, 845
- Frontera (2015) Frontera, F. 2015, in Thirteenth Marcel Grossmann Meeting: On Recent Developments in Theoretical and Experimental General Relativity, Astrophysics and Relativistic Field Theories, ed. K. Rosquist, 33–53
- Fryer et al. (2015a) Fryer, C. L., Belczynski, K., Ramirez-Ruiz, E., et al. 2015a, ApJ, 812, 24
- Fryer et al. (2015b) Fryer, C. L., Oliveira, F. G., Rueda, J. A., & Ruffini, R. 2015b, Physical Review Letters, 115, 231102
- Fryer et al. (2014) Fryer, C. L., Rueda, J. A., & Ruffini, R. 2014, ApJ, 793, L36
- Gehrels et al. (2005) Gehrels, N., Sarazin, C. L., O’Brien, P. T., et al. 2005, Nature, 437, 851
- Goodman (1986) Goodman, J. 1986, ApJ, 308, L47
- Guidorzi (2008) Guidorzi, C. 2008, GRB Coordinates Network, 8513
- Guidorzi et al. (2008a) Guidorzi, C., Mao, J., & Margutti, R. 2008a, GRB Coordinates Network, 8454
- Guidorzi & Margutti (2008) Guidorzi, C., & Margutti, R. 2008, GRB Coordinates Network, 8416
- Guidorzi et al. (2008b) Guidorzi, C., Margutti, R., & Mao, J. 2008b, GRB Coordinates Network, 8410
- Hanabata et al. (2008) Hanabata, Y., Uehara, T., Takahashi, T., et al. 2008, GRB Coordinates Network, 8444
- Izzo et al. (2012) Izzo, L., Ruffini, R., Penacchioni, A. V., et al. 2012, A&A, 543, A10
- Jenke & Yu (2014) Jenke, P. A., & Yu, H.-F. 2014, GRB Coordinates Network, 16070, 1
- Kiuchi et al. (2014) Kiuchi, K., Kyutoku, K., Sekiguchi, Y., Shibata, M., & Wada, T. 2014, Phys. Rev. D, 90, 041502
- Klebesadel (1992) Klebesadel, R. W. 1992, in Gamma-Ray Bursts - Observations, Analyses and Theories, ed. C. Ho, R. I. Epstein, & E. E. Fenimore (Cambridge University Press), 161–168
- Kouveliotou et al. (1993) Kouveliotou, C., Meegan, C. A., Fishman, G. J., et al. 1993, ApJ, 413, L101
- Landau & Lifshitz (2003) Landau, L. D., & Lifshitz, E. M. 2003, The classical theory of fields (Butterworth-Heinemann (Oxford), 4th rev. engl. ed.)
- Lawrence et al. (2015) Lawrence, S., Tervala, J. G., Bedaque, P. F., & Miller, M. C. 2015, ApJ, 808, 186
- Lee et al. (2004) Lee, W. H., Ramirez-Ruiz, E., & Page, D. 2004, ApJ, 608, L5
- Lithwick & Sari (2001) Lithwick, Y., & Sari, R. 2001, ApJ, 555, 540
- Maselli & D’Avanzo (2014) Maselli, A., & D’Avanzo, P. 2014, GRB Coordinates Network, 16424, 1
- Mazets et al. (1981) Mazets, E. P., Golenetskii, S. V., Ilinskii, V. N., et al. 1981, Ap&SS, 80, 3
- Meegan et al. (2009) Meegan, C., Lichti, G., Bhat, P. N., et al. 2009, ApJ, 702, 791
- Meszaros & Rees (1997) Meszaros, P., & Rees, M. J. 1997, ApJ, 482, L29
- Muccino et al. (2013) Muccino, M., Ruffini, R., Bianco, C. L., Izzo, L., & Penacchioni, A. V. 2013, ApJ, 763, 125
- Narayan et al. (1992) Narayan, R., Paczynski, B., & Piran, T. 1992, ApJ, 395, L83
- Narayan et al. (1991) Narayan, R., Piran, T., & Shemi, A. 1991, ApJ, 379, L17
- Oliveira et al. (2014) Oliveira, F. G., Rueda, J. A., & Ruffini, R. 2014, ApJ, 787, 150
- Omodei (2008) Omodei, N. 2008, GRB Coordinates Network, 8407
- Özel & Freire (2016) Özel, F., & Freire, P. 2016, ARA&A, 54, 401
- Paczynski (1986) Paczynski, B. 1986, ApJ, 308, L43
- Pagani (2014a) Pagani, C. 2014a, GRB Coordinates Network, 16078, 1
- Pagani (2014b) —. 2014b, GRB Coordinates Network, 16075
- Paschalidis et al. (2015) Paschalidis, V., Ruiz, M., & Shapiro, S. L. 2015, ApJ, 806, L14
- Patricelli et al. (2012) Patricelli, B., Bernardini, M. G., Bianco, C. L., et al. 2012, ApJ, 756, 16
- Penacchioni et al. (2013) Penacchioni, A. V., Ruffini, R., Bianco, C. L., et al. 2013, A&A, 551, A133
- Penacchioni et al. (2012) Penacchioni, A. V., Ruffini, R., Izzo, L., et al. 2012, A&A, 538, A58
- Pisani et al. (2016) Pisani, G. B., Ruffini, R., Aimuratov, Y., et al. 2016, ApJ, 833, 159
- Rau et al. (2009) Rau, A., McBreen, S., & Kruehler, T. 2009, GRB Coordinates Network, 9353, 1
- Rezzolla et al. (2011) Rezzolla, L., Giacomazzo, B., Baiotti, L., et al. 2011, ApJ, 732, L6
- Rosswog et al. (2003) Rosswog, S., Ramirez-Ruiz, E., & Davies, M. B. 2003, MNRAS, 345, 1077
- Rotondo et al. (2011a) Rotondo, M., Rueda, J. A., Ruffini, R., & Xue, S.-S. 2011a, Phys. Rev. C, 83, 045805
- Rotondo et al. (2011b) —. 2011b, Physics Letters B, 701, 667
- Rueda & Ruffini (2012) Rueda, J. A., & Ruffini, R. 2012, ApJ, 758, L7
- Rueda & Ruffini (2013) —. 2013, International Journal of Modern Physics D, 22, 1360007
- Rueda et al. (2014) Rueda, J. A., Ruffini, R., Wu, Y.-B., & Xue, S.-S. 2014, Phys. Rev. C, 89, 035804
- Rueda et al. (2011) Rueda, J. A., Ruffini, R., & Xue, S.-S. 2011, Nuclear Physics A, 872, 286
- Ruffini et al. (2006) Ruffini, R., Bernardini, M. G., Bianco, C. L., et al. 2006, in American Institute of Physics Conference Series, Vol. 836, Gamma-Ray Bursts in the Swift Era, ed. S. S. Holt, N. Gehrels, & J. A. Nousek, 103
- Ruffini et al. (2005) Ruffini, R., Bernardini, M. G., Bianco, C. L., et al. 2005, in American Institute of Physics Conference Series, Vol. 782, XIth Brazilian School of Cosmology and Gravitation, ed. M. Novello & S. E. Perez Bergliaffa, 42
- Ruffini et al. (2002) Ruffini, R., Bianco, C. L., Chardonnet, P., Fraschetti, F., & Xue, S. 2002, ApJ, 581, L19
- Ruffini et al. (2001a) Ruffini, R., Bianco, C. L., Fraschetti, F., Xue, S.-S., & Chardonnet, P. 2001a, ApJ, 555, L117
- Ruffini et al. (2001b) —. 2001b, ApJ, 555, L113
- Ruffini et al. (2001c) —. 2001c, ApJ, 555, L107
- Ruffini et al. (2004) Ruffini, R., Bianco, C. L., Xue, S.-S., et al. 2004, International Journal of Modern Physics D, 13, 843
- Ruffini et al. (2000) Ruffini, R., Salmonson, J. D., Wilson, J. R., & Xue, S. 2000, A&A, 359, 855
- Ruffini et al. (1999) Ruffini, R., Salmonson, J. D., Wilson, J. R., & Xue, S.-S. 1999, A&A, 350, 334
- Ruffini et al. (2010) Ruffini, R., Vereshchagin, G., & Xue, S. 2010, Phys. Rep., 487, 1
- Ruffini & Wilson (1973) Ruffini, R., & Wilson, J. 1973, Physical Review Letters, 31, 1362
- Ruffini et al. (2014) Ruffini, R., Muccino, M., Bianco, C. L., et al. 2014, A&A, 565, L10
- Ruffini et al. (2015) Ruffini, R., Muccino, M., Kovacevic, M., et al. 2015, ApJ, 808, 190
- Ruffini et al. (2016a) Ruffini, R., Muccino, M., Aimuratov, Y., et al. 2016a, ApJ, 831, 178
- Ruffini et al. (2016b) Ruffini, R., Rueda, J. A., Muccino, M., et al. 2016b, ApJ, 832, 136
- Ruffini et al. (2016c) Ruffini, R., Rodriguez, J., Muccino, M., et al. 2016c, ArXiv e-prints
- Ruffini et al. (2017) Ruffini, R., Wang, Y., Aimuratov, Y., et al. 2017, ArXiv e-prints
- Ruiz et al. (2016) Ruiz, M., Lang, R. N., Paschalidis, V., & Shapiro, S. L. 2016, ApJ, 824, L6
- Salmonson & Wilson (2002) Salmonson, J. D., & Wilson, J. R. 2002, ApJ, 578, 310
- Schaefer (2007) Schaefer, B. E. 2007, ApJ, 660, 16
- Shibata et al. (2011) Shibata, M., Suwa, Y., Kiuchi, K., & Ioka, K. 2011, ApJ, 734, L36
- Siegel et al. (2014) Siegel, D. M., Ciolfi, R., & Rezzolla, L. 2014, ApJ, 785, L6
- Tauris et al. (2015) Tauris, T. M., Kaspi, V. M., Breton, R. P., et al. 2015, Advancing Astrophysics with the Square Kilometre Array (AASKA14), 39
- Tavani (1998) Tavani, M. 1998, ApJ, 497, L21
- Tavani et al. (2009) Tavani, M., Barbiellini, G., Argan, A., et al. 2009, A&A, 502, 995
- Zel’dovich et al. (1972) Zel’dovich, Y. B., Ivanova, L. N., & Nadezhin, D. K. 1972, Soviet Ast., 16, 209
- Zhang et al. (2012) Zhang, F.-W., Shao, L., Yan, J.-Z., & Wei, D.-M. 2012, ApJ, 750, 88