Particle-in-Cell Simulations of Electron Beam Production from Infrared Ultra-intense Laser Interactions
Abstract
Advances in ultra-intense laser technology are enabling, for the first time, relativistic intensities at mid-infrared (mid-IR) wavelengths. Anticipating further experimental research in this domain, we present high-resolution two dimensional Particle-in-Cell (PIC) simulation results using the Large-Scale Plasma (LSP) code that explore intense mid-IR laser interactions with dense targets. We present the results of thirty PIC simulations over a wide range of intensities () and wavelengths (780 nm, 3 µm, and 10 µm). Earlier studies, limited to 780 nm and Orban et al. (2015); Ngirmang et al. (2016), identified super-ponderomotive electron acceleration in the laser specular direction for normal-incidence laser interactions with dense targets. We extend this research to mid-IR wavelengths and find a more general result that normal-incidence super-ponderomotive electron acceleration occurs provided that the laser intensity is not highly relativistic () and that the pre-plasma scale length is similar to or longer than the laser wavelength. Under these conditions, ejected electron angular and energy distributions are similar to expectations from an analytic model used in Ngirmang et al. (2016). We also find that, for , the mid-IR simulations exhibit a classic ponderomotive steepening pattern with multiple peaks in the ion and electron density distribution. Experimental validation of this basic laser-plasma interaction process will be possible in the near future using mid-IR laser technology and interferometry.
I Introduction
While advances in laser technology have allowed ultra-intense laser interactions at near-IR wavelengths to be thoroughly explored, and it is only more recently that ultra-intense laser interactions at mid-IR wavelengths have become experimentally possible las . A variety of groups are beginning to examine what may be learned from experiments at these wavelengths and how phenomena observed in the near-IR may scale to longer wavelengths MUR (a). Some of this interest stems from the existence of atmospheric “windows” in the mid-IR Elder and Strong (1953), while other groups consider how the longer length scale of mid-IR interactions allows subtle phenomena to be more easily probed MUR (b). Another interesting value of intense mid-IR interactions is in examining the physics of laser damage Austin et al. (2015, 2016).
To the best of our knowledge, despite recent interest in mid-IR ultra-intense laser interactions, the literature has not focused much attention on intense mid-IR laser interactions with dense (i.e. solid or liquid density) targets. These interactions are interesting for a variety of reasons, among them the favorable scaling of the ponderomotive electron energy with laser wavelength (). However, given the complexity of ultra-intense interactions with dense targets, these scaling arguments can only offer an order-of-magnitude expectation for the results of detailed simulations and experiments in this regime. With experimental capabilities still maturing in the mid-IR, the present work offers a simulation survey of energetic electron ejection from mid-IR laser irradiated dense targets.
The work presented here is motivated in part by earlier investigations of normal-incidence ultra-intense laser interactions with liquid targets at the Air Force Research Lab which found much larger than expected conversion efficiencies from laser energy to ejected electron energy Morrison et al. (2015). These experimental results prompted simulation work by Orban et al. (2015); Ngirmang et al. (2016). Orban et al. (2015) presented 2D(3) Particle-in-Cell (PIC) simulations showing significant electron ejection at superponderomotive energies and emphasized that ultra-intense laser interactions at the W cm-2 ( for nm) intensities present in the experiment should create strong standing-wave fields near the target. Ngirmang et al. (2016) performed 3D PIC simulations of these targets and provided an analytic model to explain both the energies and angular distribution of ejected electrons. More recently, Feister et al. (2015) have reported direct experimental measurements of the ejected electron energies, confirming the existence of multi-MeV electrons in the experiment and from this reinforcing conclusions that the conversion efficiency in the experiment is large compared to other ultra-intense laser experiments. An interesting question, then, is whether superponderomotive electron ejection occurs even with intense mid-IR laser interactions.
The other motivator for this project is the plan to purchase and upgrade an intense 3 µm wavelength laser system at the Air Force Research Laboratory. The upgraded laser system will be able to produce mJ scale laser pulses and a peak intensity near W/cm2. We explore a much wider range of laser energies and intensities in an effort to examine the physics of mid-IR laser interactions with dense targets.
Sec. II describes our simulation setup. Sec. III describes our results. Finally, Sec. V provides a summary and conclusions.
| Wavelength (µm) | Intensity Range (W/cm2) | Gaussian Radius (µm) | Pulse FWHM (fs) | Scaled Pre-Plasma Scale (µm) | Simulation Timestep (fs) | Simulation Spatial Resolution (µm) |
| 10 | 1.64101.641018 | 27.5 | 513 | 19.2 | 0.5 | 0.25 |
| 3 | 6.08106.081019 | 8.5 | 154 | 5.77 | 0.15 | 0.1 |
| 0.78 | 3.46103.461021 | 0.15 | 40 | 1.5 | 0.1 | 0.033 |
II Particle-In-Cell Simulations
We performed 30 different high-resolution 2D(3) PIC simulations with the LSP code Welch et al. (2004). For all simulations the initial conditions included a liquid-density water slab target with some assumed pre-plasma scale length similar to earlier studies Orban et al. (2015); Ngirmang et al. (2016). In all simulations, a laser is normally incident onto the water slab. We use the following Cartesian coordinate system for these simulations: the positive -axis is the direction of the laser, the -axis is the polarization direction, and -axis is the axis of the water column, which is assumed to be the axis of symmetry in the 2D(3) PIC simulations.
The simulations involved a normally incident, spatially Gaussian, sine-squared envelope pulse with 780 nm, 3 µm, and 10 µm wavelengths (denoted ). These simulations extend the results of earlier investigations with 780 nm laser pulses Orban et al. (2015); Ngirmang et al. (2016) by examining the same phenomena with long infrared(IR) wavelengths. For convenience we will often refer to the set of all simulations performed with a particular laser wavelength incident by saying, for example, “the 3 µm simulations”, and likewise for the other wavelengths. All the 780 nm simulations had a laser pulse with a 2.15 µm Gaussian radius and a 40 fs temporal full-width-half-maximum (FWHM) pulse duration (similar to the laser system described in Morrison et al. (2015); Orban et al. (2015); Ngirmang et al. (2016)). The 3 µm simulations have laser pulses with 8.25 µm Gaussian radius and 158 fs FWHM pulse duration, and the 10 µm simulations had laser pulses with 27.5 µm Gaussian radii and 510 fs. These Gaussian radii and pulse durations were chosen so that the ratio of the wavelength to Gaussian radius and the number of optical periods in a pulse were fixed across all simulations regardless of laser wavelength. For each wavelength we simulated a range of pulse energies from J, 1 mJ , 10 mJ, 1 J, to 10 J. Since the Gaussian radius and pulse duration were fixed for each wavelength this was done by changing the intensity. Simulation parameters for each wavelength simulation are summarized in Table 1.
The target in all simulations consisted of free electrons, protons, and O+ ions, with number densities set in relative proportion to make the target match water’s chemical composition and to ensure charge neutrality (O+ to p+ to e- ratio of 1:2:3). In all simulations, the plasma density only varied along the direction. In the “target” region the density is constant and in the “pre-plasma” region the density profile is exponentially decreasing in away from the target region.
For every intensity and wavelength considered we perform a simulation with a 1.5 µm scale-length, for direct comparison with previous studies Orban et al. (2015); Ngirmang et al. (2016) which employed a such a scale length pre-plasma. For 3 µm and 10 µm wavelengths, we also perform simulations where the pre-plasma scale length is a constant multiple of the wavelength (), so that we performed 3 µm simulations with a 5.77 µm scale length and 10 µm simulations with a 19.2 µm scale-length. We refer to these scale lengths are the “scaled” scale lengths. The 780 nm and 3 µm simulations had a target region electron density of cm-3, which with the O+ to p+ to e- ratio mentioned earlier correspondent to the mass density of g/cm3 as one would expect for liquid water. The 10 µm simulations with a 1.5 µm scale length also had a target region with this same cm-3 electron density into the target. However, the 10 µm simulations with a 19.2 µm scale-length had a target region electron density of cm-3 in order to reduce the size of the target in order to reduce computational requirements. The 780 nm simulations used a target that was 20 µm wide in the direction, the 3 µm simulations used a 100 µm wide target, and the 10 µm simulations used a 220 µm wide target. All targets had a initial temperature of 1 eV. All simulations had absorbing boundaries with 10 µm between the initial target and the simulation boundaries.
The classical formula for the critical electron density is . For the 780 nm, 3 µm, and 10 µm wavelengths, this corresponds to 1.741021 cm-3, 1.241020 cm-3, and 1.111019 cm-3 respectively. In all simulations, the laser focus was chosen to coincide with the critical density in the pre-plasma layer. For the 780 nm simulations, a spatial resolution with spacing of 33 nm (roughly 23 cells per wavelength) was used and timesteps of 0.1 fs was used. For the 3 µm simulations a spacing of 100 nm and temporal resolution of 0.15 fs was used. Finally, the 10 µm simulations utilized a spatial resolution of 250 nm and temporal resolution of 0.5 fs. Although these simulations do not resolve the Debye length in every cell (since there are cells with near-solid densities with sub-nanometer Debye lengths), the phenomena of interest is electron acceleration in the underdense pre-plasma extending from the target where the Debye length is much larger and more easily resolved. The implicit algorithm in LSP avoids grid-heating issues associated with the Debeye instability so that the behavior of near-solid density regions in the simulation does not ruin the overall energy conservation of the simulation. All simulations had 27 macro-particles per cell per species (free electrons, protons, and O+ ions). As in earlier work Orban et al. (2015), the O+ ions in this simulation can be further ionized by strong electric fields according to the Ammisov-Delone-Krainov rate Ammosov et al. (1986). In the simulation electron macroparticles scatter by a Monte-Carlo algorithm as in Kemp et al. (2004) with a scattering rate determined by a Spitzer model Spitzer (1963) except at low temperatures where the scattering rate is limited by the timestep. The 1.5 µm scale-length simulations were run for three times the duration of the simulated laser pulse (i.e. three times the full-width full max duration of the pulse). The scaled simulations were run for 3.5 times the duration of the simulated laser pulse because these were larger targets with a more extended pre-plasma.
The number of pulse energies investigated, the various scale lengths assumed with the three laser wavelengths add up to a total of 30 2D(3) simulations. The parameters of all simulations are listed in the appendix, and parameters common across given wavelength simulations are summarized in Table 1.
III Results
III.1 Ejected Electron Energies
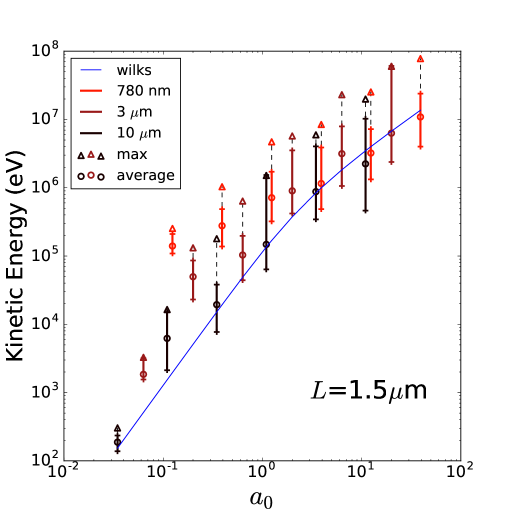
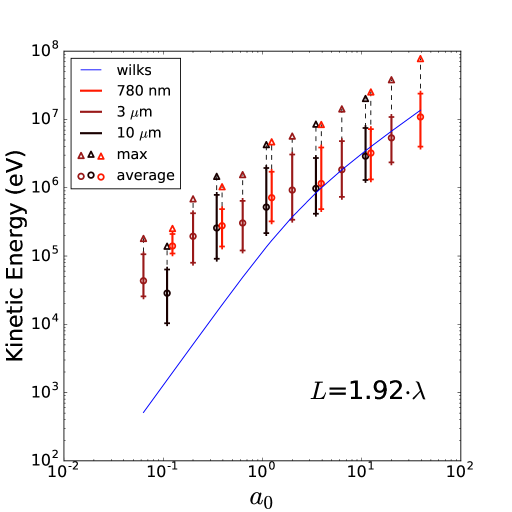
Fig. 1 shows the energy spectra of back-accelerated electrons for all the simulations performed. The left panel of Fig. 1 shows the results of the simulations with a 1.5 µm scale-length pre-plasma, while the right panel plots the results of the scaled scale-length simulations where the scale-length is proportional to the wavelength (). These figures plot the mean and maximum energy of escaping electrons on the -axis as a function of the normalized vector potential of the incident laser. Here, , with the peak electric field value of the incident pulse is denoted , is the speed of light, is the mass of an electron, and is the angular frequency of the laser beam. The mean electron energy is determined by taking the average energy of electrons that reach the boundary of the simulation. Since we are concerned here with back directed electrons only those electrons with a momentum angle within of the incident laser are counted.
These results are found to scale with the Wilks scaling estimate from Wilks et al. (1992),
| (1) |
While there are a number of other formulae that describe the typical energy of electrons interacting with an intense laser field, we choose to compare with Wilks scaling because it is an analytically motivated formula that is reasonably representative of the various scaling models in this regime Beg et al. (1997). The Wilks model also reduces to the classical ponderomotive energy of an electron in a monochromatic plane wave in the low limit. A binomial approximation yields
for small values of . This is why, on Fig.1, one sees an dependence for Eq. 1 at low that transitions to linear dependence (i.e. ) for .
Comparing Eq. 1 to the simulation data in the left panel of Fig. 1 yields an interesting result that the 10 µm wavelength simulations fall closest to the Wilks scaling model prediction. The 3 µm and 780 nm wavelength simulations lie significantly above the prediction, especially for low values. The 780 nm wavelength simulations have the most energetic electrons, exceeding Eq. 1 by 1-2 orders of magnitude. Thus we say that the ejected electrons in the 780 nm simulations are highly ”superponderomotive”.
As identified earlier, the right panel of Fig. 1 shows the results of the ”scaled” simulations. The 780 nm simulations with 1.5 µm scale-length appear in both panels of Fig. 1, but the longer wavelength simulations shown in the right panel of Fig. 1 all assume a longer scale length than in the left panel. Remarkably, in the right panel the results from all three wavelengths seem to follow roughly the same trend and exceed the Wilks prediction by 1-2 orders of magnitude.
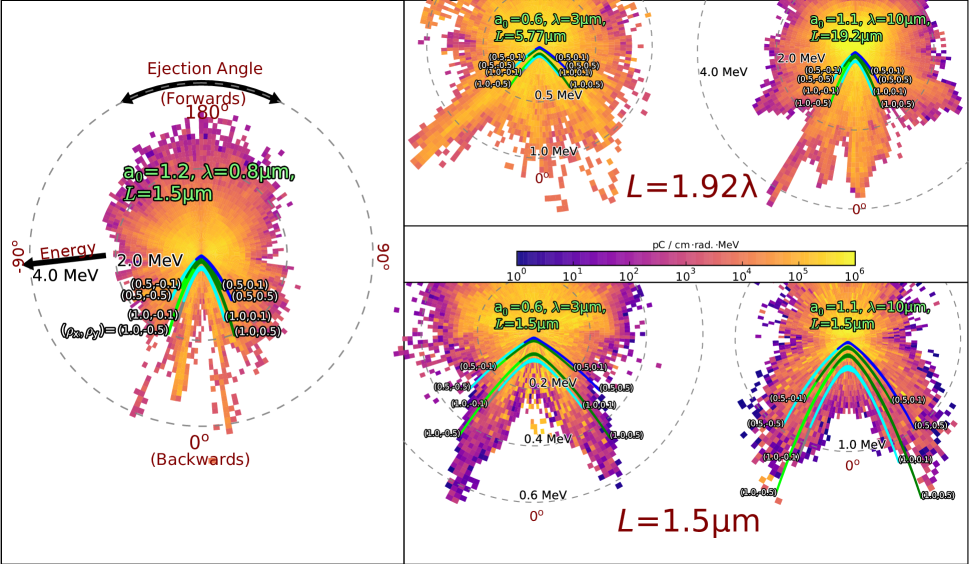
Fig. 2 presents detailed information on the energies and ejection angles of electrons that leave the simulation volume. Fig. 2 shows results from the three different wavelengths, highlighting intensities with and the mid-IR simulations with . We also overplot with solid lines the results from an analytic model described in Ngirmang et al. (2016). This model considers that the back-directed electrons are ejected at high speed into a pulsed plane wave that approximates the reflected laser pulse. Because of the similarity to earlier work in Ngirmang et al. (2016), it is unsurprising that the model compares favorably to the 780 nm results shown in Fig. 2. What is more remarkable is that the model predictions compare similarly well to the mid-IR simulations.
III.2 Electron density profiles
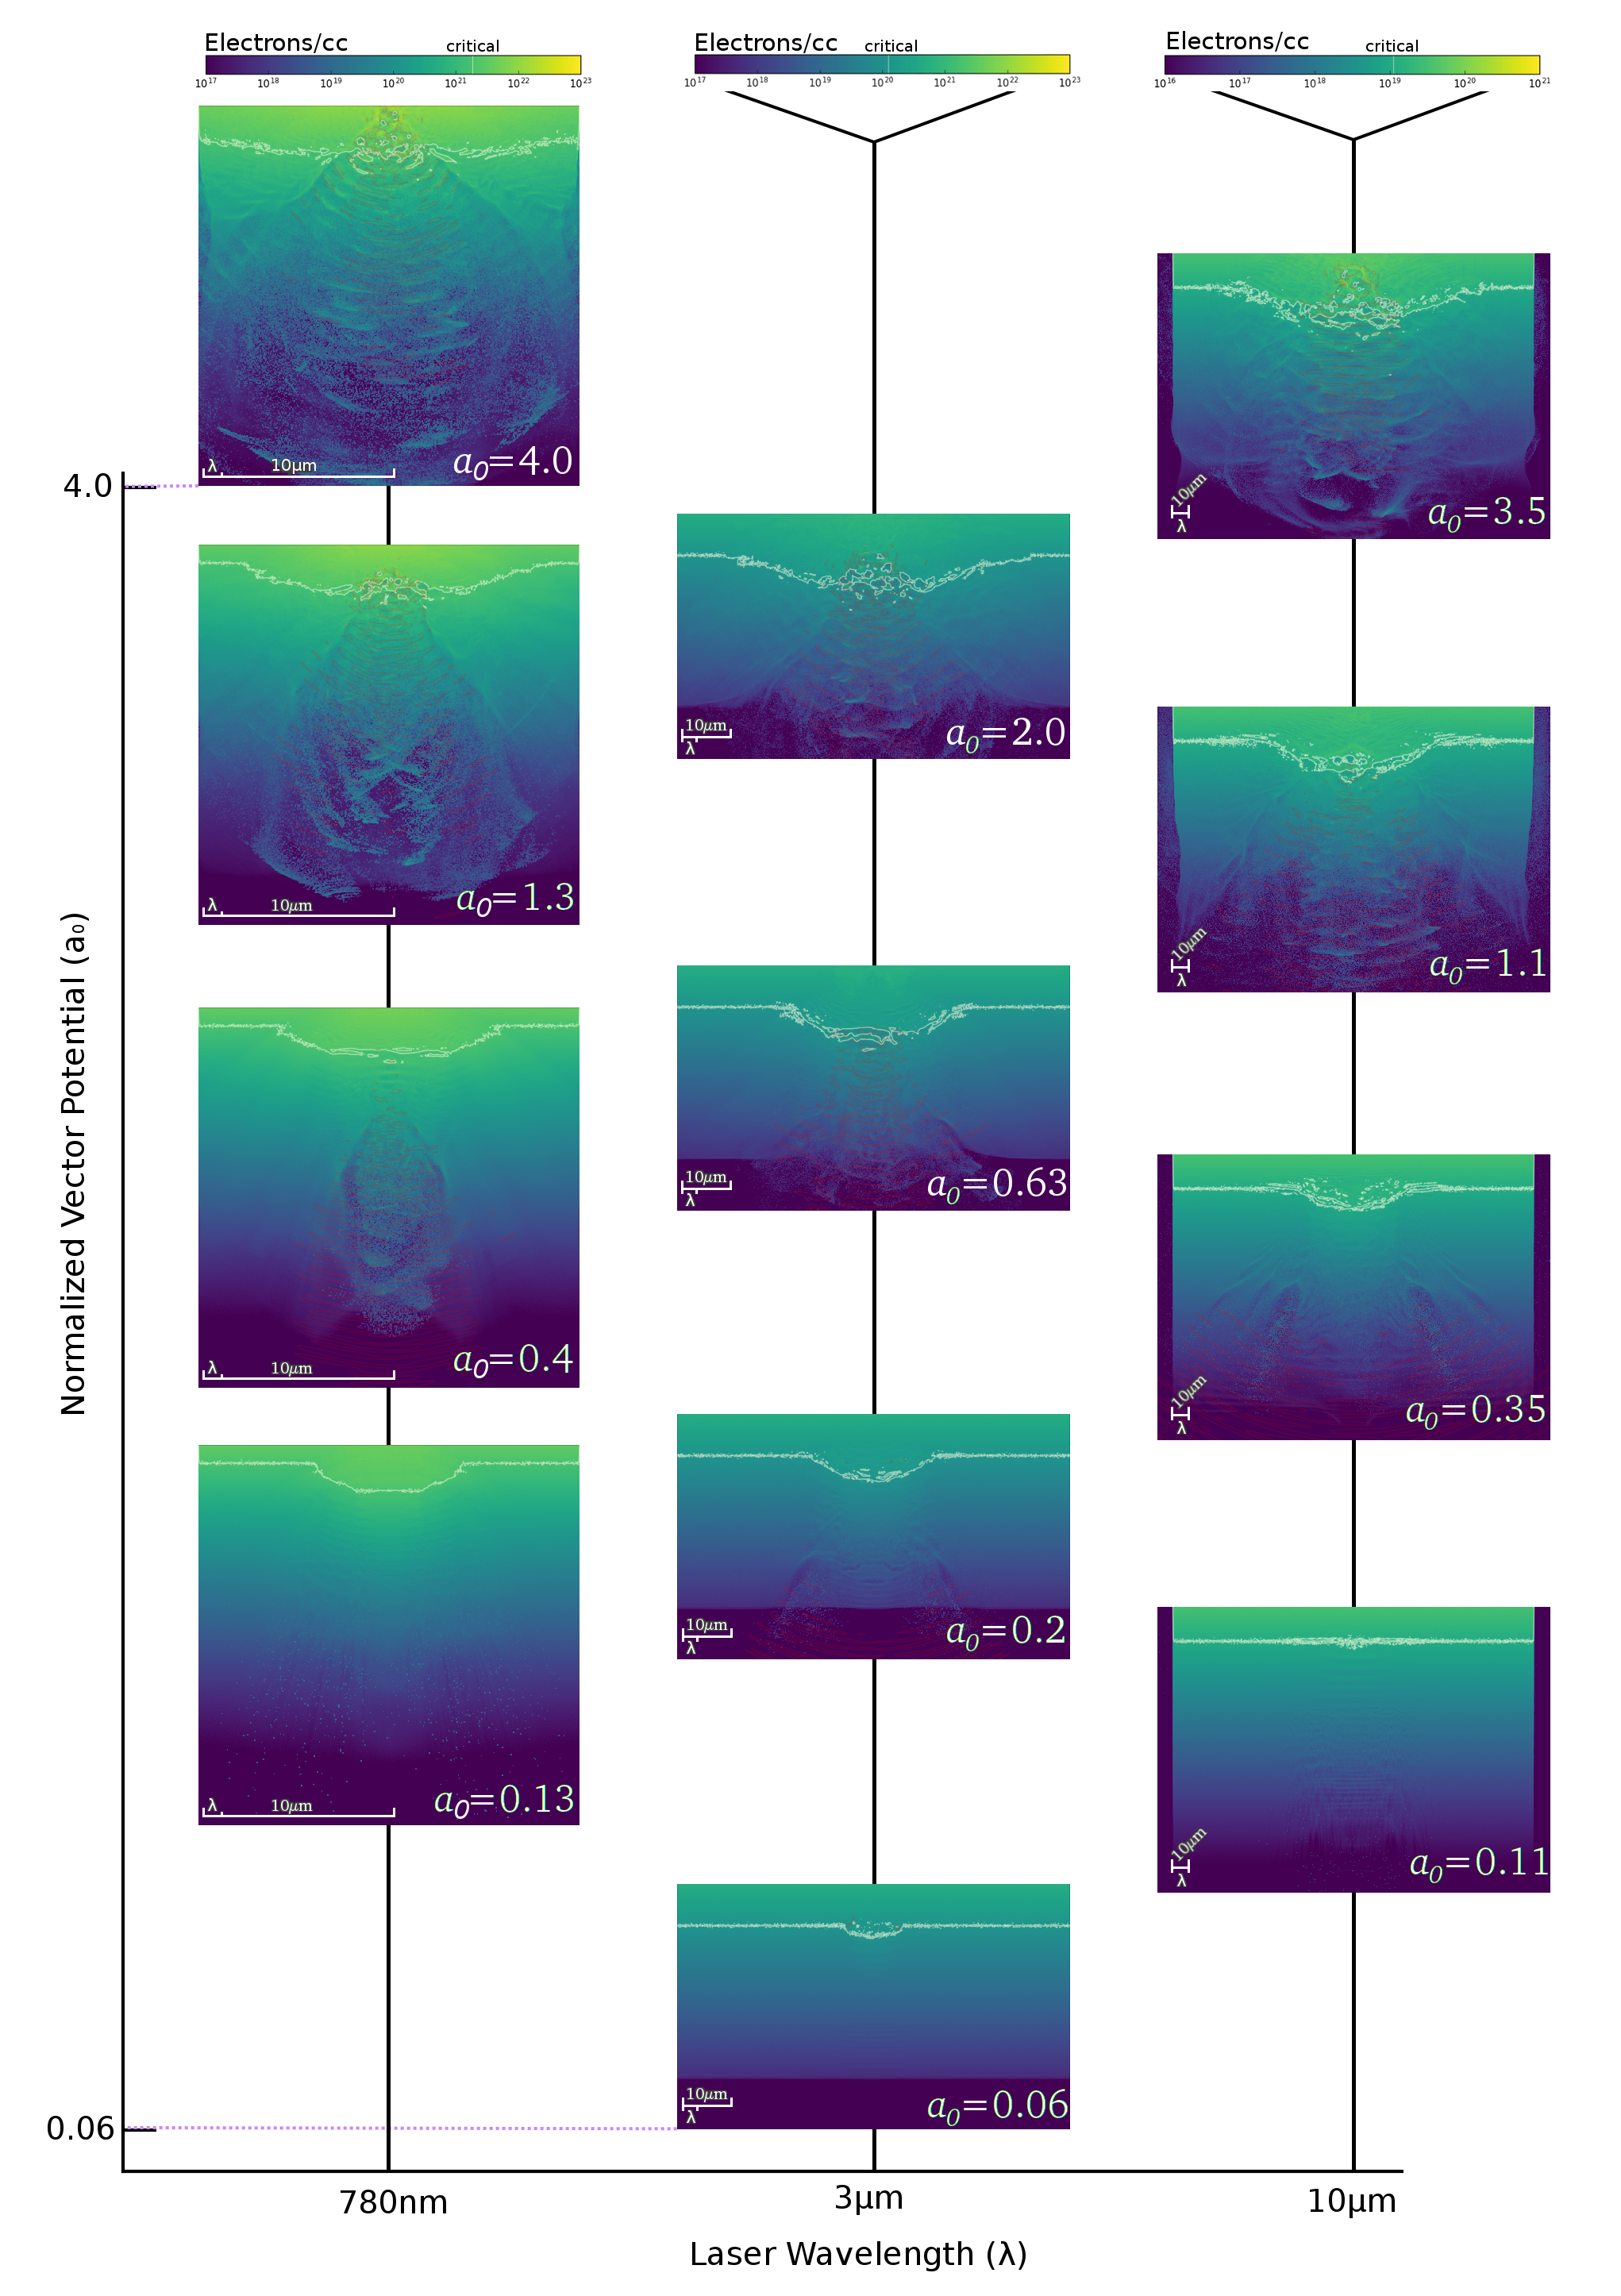
Fig. 3 provides snapshots of the electron density in the simulation after the reflection of the laser (not more than two pulse-lengths in time later) but while electrons are still moving away from the target. The figure demonstrates that the onset of plasma wave phenomena is dependent on the value of the incident laser pulse, and not only the laser wavelength or laser intensity independently. For for all wavelengths, the escaping electrons are not spatially bunched, and the pre-plasma layer is perturbed less relative to the more intense cases. With values between 0.2 and 0.4, the backwards accelerated electrons break apart the pre-plasma layer as they escape. At values near and above, ejected electrons exhibit bunching, a pattern that becomes more pronounced as becomes larger. As discussed in Orban et al. (2015), this arises because electrons are only deflected away from the target during two specific moments during the laser cycle. In these simulations, it has been observed that the onset of these bunches is preceded in the process of reflection by a significant electron density hole created by the ponderomotive force, which manifest only as nears and exceeds unity. As exceeds 2.0, as shown in the top two plots, the laser begins to penetrate beyond the (non-relativistic) critical density surface due to relativistic transparency. Hole-boring Gong et al. (2016) does not occur in this case due to the ultrashort pulse in all cases, and the laser pulse begins to penetrate only when the last few cycles of the main pulse are present on the non-relativistic critical density surface.
To comment on another aspect of the plots in Fig. 3, in essentially all of the plots shown () the laser ionizes the target, moving the critical density (white contour) towards the incoming laser, especially along the laser axis. Because the laser intensity decreases away from the laser axis according to a gaussian spatial profile, this causes the critical density to assume a curved shape as seen in the figure.
III.3 Ponderomotive Steepening
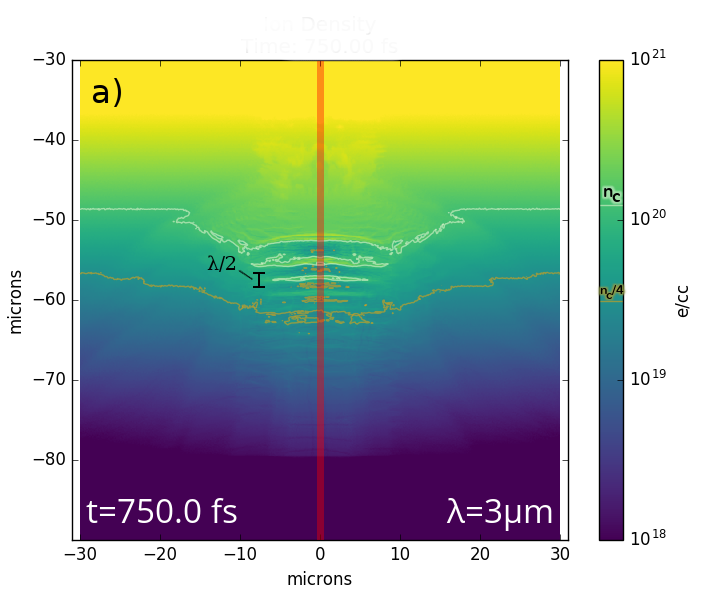

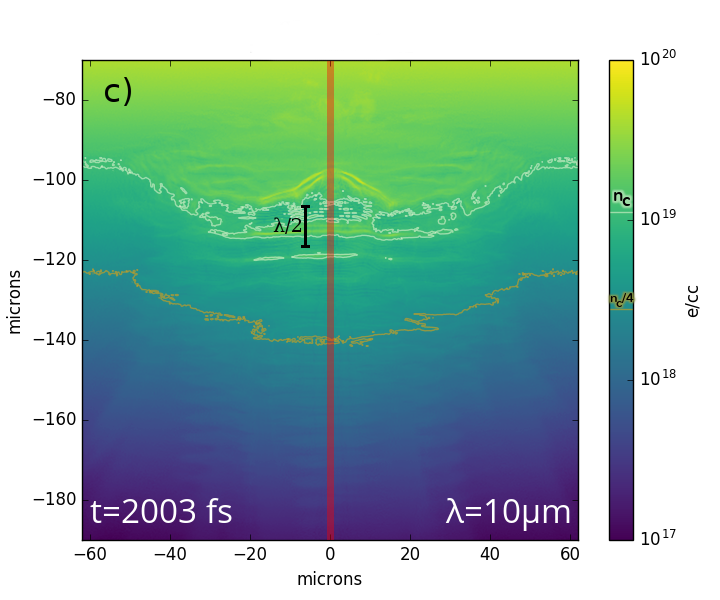

While fig. 3 demonstrates that the onset of plasma wave phenomena is determined by the value of the incident laser, it also demonstrates that at a given , plasma features observed scale in physical size with the incident laser wavelength. This finding can be used to scale the physical size the laser plasma interaction to facilitate experimental observation of phenomena which would not be observable with short wavelength pulses. One such phenomenon is ponderomotive steepening, a well-known laser-plasma interaction process where the radiation pressure from the laser modifies the electron density profile, which, over time, will substantially modify the ion density profile Estabrook and Kruer (1983) on the scale of half the wavelength. A related process is ”hole boring” which has been studied theoretically and experimentally (e.g. Gong et al., 2016, and references therein). Unlike hole boring, ponderomotive steepening, as originally described by Estabrook and Kruer (1983), involves a series of peaks in the ion density profile. Ponderomotive steepening has been observed in a number of PIC simulations in the literature (e.g. Orban et al., 2015) but to the best of our knowledge it has never been experimentally observed given the size of such features would be on the sub micron scale. To be able to see this phenomenon, one needs an intense laser and high spatial resolution interferometry of the target that can resolve half-wavelength-scale features. Mid-IR lasers therefore significantly relax the spatial resolution requirements of such an experiment compared to lasers in the near-IR.
With this in mind we looked for ponderomotive steepening in our simulations and found that both the 3 µm wavelength simulation with and µm and the 10 µm wavelength simulation with and µm do exhibit a classic ponderomotive steepening pattern with multiple peaks in both the ion and electron density as shown in Fig. 4. Ponderomotive steepening was noticed earlier in 800 nm wavelength simulations presented in (Orban et al., 2015, c.f. Fig.12). Ponderomotive steepening was also present in simulations that we published in Ngirmang et al. (2016), although for brevity we did not highlight this result. Fig. 4 provides essentially the first compelling evidence that this effect should persist in mid-IR experiments of this kind.
IV Discussion
We present 30 high-resolution PIC simulations, which comprise a parameter scan over laser wavelengths, intensities, and target scale-lengths, designed to explore the physics of intense, normally-incident near-IR (780 nm wavelength) and mid-IR (3 µm and 10 µm wavelength) laser plasma interactions in the creation of superponderomotive elections. The simulations support three major findings. The first major conclusion is that the backwards acceleration of elections in the sub-relativisitic regime is more efficient when the scale length is longer than the wavelength, expressed by the condition that the ratio of the scale length to the wavelength . Second, the onset of plasma phenomenon scales with the value of the incident pulse, which of course takes contributions from both the intensity of the incident light and its wavelength. Finally, the physical scale of plasma phenomena scales with the wavelength, facilitating the experimental observation of features such as ponderomotive steepening.
The importance of the condition is found from comparing the energies of near-IR and mid-IR simulations with similar values and scale lengths determined by , shown on the right panel of Fig. 1 to simulations with similar values on the left panel with a fixed scale length µm. In the sub-relativistic regime (), we find that the “scaled” scale length simulations with produce ejected electrons that happen to lie well above expectations from Wilks et al. (1992) and that they also exceed that estimate by a greater amount than the corresponding fixed µm simulations (with similar value lasers) exceed that estimate. Moreover, from examining just the simulations with a fixed µm, one finds that longer wavelength simulations produce less energetic electrons than shorter wavelength simulations. The longer wavelength cases represent values of for 3 µm,10 µm, respectively. This further reinforces the idea that the ratio needs to be unity or greater for back-directed electron acceleration to be effective in this regime.
The wilks scaling estimate is linear in in the regime where and quadratic in in the non-relativistic case (), as discussed earlier. The scaling of energies for backwards accelerated elections for the simulations with an extended pre-plasma appears to have a linear power law that extends below the non-relativistic limit at and thus exceed the classical ponderomotive scaling in the sub-relativistic regime, demonstrated by the bifurcation of the Wilks scaling and the trend for backwards-accelerated elections at on the right panel of Fig. 1. As mentioned in the caption of that figure, the lowest simulation did not have accelerated electrons that reached the edge of the simulation space by the end of the simulation, so it is doubtful that this power law extends to values well below , but this lower energy regime will be the focus of future work.
Regarding the ejected electron energy and angle spectra shown in Fig. 2, the analytic model actually corresponds more closely to the 1.5 µm scale length results for the mid-IR simulations (bottom panel) than the results (upper panel) which are quite a bit more energetic than expected from the model. A careful look at the upper and lower panels of Fig. 2 plot shows that there is a larger total number of ejected electrons as well for the simulations. As explained in Ngirmang et al. (2016), this model is purely electromagnetic, without considering plasma effects which become more important as the ratio increases.
The importance of the ratio could be due to a number of factors. It is well known that intense laser interactions are highly sensitive to the assumed scale length; from a physics perspective (c.f. Gibbon, 2005) one expects that if , then the laser will reflect off a sharp interface (much like a mirror) and only accelerate electrons that reside on the surface of the target. If instead , then the laser will interact with a more extended region of near-critical plasma that provides a more suitable environment for accelerating large numbers of electrons in the back direction, as we consider here. It should also be emphasized that the “scaled” scale length targets are significantly larger than the µm targets and this extended pre-plasma can decrease the electrostatic potential at the edge of the target where the electrons are ejected. A large pre-plasma layer can also provide a larger return current for escaping elections. These are possible explanation for both the increased energy for the simulations where as well as for the larger number of ejected electrons, as discussed earlier and shown in Fig. 2. Finally, the ratio is relevant especially in the sub-relativistic regime (), and as discussed in Section III.2 and Fig. 3, different plasma phenomena is observed different across regimes. These effects, as well as the confluence of the value with the ratio , will be investigated in future work.
Finally, as discussed in the previous section and shown in Fig. 4, we anticipated the scaling of plasma features with the indicident laser wavelength, and observed ponderomotive steepening in the longer wavelength IR simulations with with multiple peaks in the density distribution. While it is out of the scope of this paper to design in detail a mid-IR experiment that would create these conditions and convincingly detect these density modulations using interferometry, the result is very encouraging from an experimental perspective. We comment here to say (1) that high-resolution interferometric systems have been demonstrated with soft X-ray wavelengths and used productively for research (e.g. Grava et al., 2008) and (2) high repetition rate laser experiments with rapidly recovering, highly-reproducible liquid targets can potentially be used with a high acquisition rate interferometric system (e.g. Feister et al., 2014) to study how these features develop over time. To be clear, this is not a comment on a particular laser system, but rather an invitation for experimental groups to consider the problem. It remains beyond the scope of this paper to determine how capable the the high repetition rate 3 µm wavelength ultra-intense laser system recently purchased by AFRL would be for detecting these density modulations when used with the existing 100 Hz acquisition rate interferometric system Feister et al. (2014) and coupled to the existing liquid target setup there.
V Conclusions
In anticipation of future experiments utilizing ultra-intense, mid-infrared laser pulses and their interaction with dense targets, we used LSP 2D(3v) simulations to explore these interactions over a range of intensities and wavelengths. Similar to earlier investigations with near-IR light Orban et al. (2015); Ngirmang et al. (2016), we find that intense longer IR wavelength interactions also produce highly superponderomotive electrons. Moreover, the acceleration is much more effective when the pre-plasma scale length is in similar scale to the laser wavelength, or longer. In some cases the typical ejected electron energies exceed ponderomotive expectations by orders of magnitude.
The longer IR simulations also indicate that ponderomotive steepening should occur in experiments of this kind when and the pre-plasma scale length is again similar in scale to the laser wavelength. This likewise extends earlier results in the near-IR Orban et al. (2015) where this phenomena was noticed in simulations. Importantly, ponderomotive steepening can create multiple peaks and valleys in the ion and electron density profile in the pre-plasma that are well known to be spaced by peak-to-peak. To our knowledge these density modulations have never been observed experimentally. Intense longer IR laser systems coupled with high-resolution interferometry techniques should provide a promising venue for demonstrating this basic laser-plasma interaction process.
Acknowledgements.
This research was sponsored by the Air Force Office of Scientific Research (AFOSR) through program managers Dr. Enrique Parra and Dr. Jean-Luc Cambier. The authors acknowledge significant support from the Department of Defense High Performance Computing Modernization Program (DOD HPCMP) Internship Program and the AFOSR summer faculty program. Supercomputer time was used on the DOD HPC Armstrong and Garnet supercomputers. The authors would also like to thank The Ohio State Department of Physics Information Technology support, specifically, Keith A. Stewart.References
- Orban et al. (2015) C. Orban, J. T. Morison, E. D. Chowdhury, J. A. Nees, K. Frische, and W. M. Roquemore, Physics of Plasmas (2015).
- Ngirmang et al. (2016) G. K. Ngirmang, C. Orban, S. Feister, J. T. Morrison, K. D. Frische, E. A. Chowdhury, and W. M. Roquemore, Physics of Plasmas 23, 043111 (2016), eprint 1510.05000.
- (3) Mid-ir lasers: Power and pulse capability ramp up for mid-ir lasers, accessed: 2017-1-1, URL http://www.laserfocusworld.com/articles/print/volume-50/issue-05/features/mid-ir-lasers-power-and-pulse-capability-ramp-up-for-mid-ir-lasers.html.
- MUR (a) Muri mid-infrared strong-field interaction, http://muri-mir.osu.edu, accessed: 2017-1-1.
- Elder and Strong (1953) T. Elder and J. Strong, Journal of the Franklin Institute 255, 189 (1953), ISSN 0016-0032, URL http://www.sciencedirect.com/science/article/pii/0016003253900027.
- MUR (b) Muri mid-infrared strong-field interaction, research thrusts, http://muri-mir.osu.edu/node/13/##research, accessed: 2017-1-1.
- Austin et al. (2015) D. R. Austin, K. R. P. Kafka, S. Trendafilov, G. Shvets, H. Li, A. Y. Yi, U. B. Szafruga, Z. Wang, Y. H. Lai, C. I. Blaga, et al., Opt. Express 23, 19522 (2015), URL http://www.opticsexpress.org/abstract.cfm?URI=oe-23-15-19522.
- Austin et al. (2016) D. R. Austin, K. R. P. Kafka, Y. H. Lai, Z. Wang, K. Zhang, H. Li, C. I. Blaga, A. Y. Yi, L. F. DiMauro, and E. A. Chowdhury, Journal of Applied Physics 120, 143103 (2016), eprint 1606.08836.
- Morrison et al. (2015) J. T. Morrison, E. A. Chowdhury, K. D. Frische, S. Feister, V. M. Ovchinnikov, J. A. Nees, C. Orban, R. R. Freeman, and W. M. Roquemore, Physics of Plasmas 22, 043101 (2015), eprint 1501.02261.
- Feister et al. (2015) S. Feister, D. R. Austin, J. T. Morrison, K. D. Frische, C. Orban, G. Ngirmang, A. Handler, M. Schillaci, E. A. Chowdhury, R. R. Freeman, et al., ArXiv e-prints (2015), eprint 1508.07374.
- Welch et al. (2004) D. R. Welch, D. V. Rose, R. E. Clark, T. C. Genoni, and T. P. Hughes, Computer Physics Communications 164, 183 (2004).
- Ammosov et al. (1986) M. Ammosov, N. B. Delone, and V. P. Krainov, Sov. Phys. JETP 64, 1191 (1986).
- Kemp et al. (2004) A. J. Kemp, R. E. W. Pfund, and J. Meyer-Ter-Vehn, Physics of Plasmas 11, 5648 (2004).
- Spitzer (1963) L. Spitzer, American Journal of Physics 31, 890 (1963).
- Wilks et al. (1992) S. C. Wilks, W. L. Kruer, M. Tabak, and A. B. Langdon, Physical Review Letters 69, 1383 (1992).
- Beg et al. (1997) F. N. Beg, A. R. Bell, A. E. Dangor, C. N. Danson, A. P. Fews, M. E. Glinsky, B. A. Hammel, P. Lee, P. A. Norreys, and M. Tatarakis, Physics of Plasmas 4, 447 (1997).
- Gong et al. (2016) C. Gong, S. Y. Tochitsky, F. Fiuza, J. J. Pigeon, and C. Joshi, Phys. Rev. E 93, 061202 (2016), URL http://link.aps.org/doi/10.1103/PhysRevE.93.061202.
- Estabrook and Kruer (1983) K. Estabrook and W. L. Kruer, Physics of Fluids 26, 1888 (1983).
- Gibbon (2005) P. Gibbon, Short Pulse Laser Interactions with Matter: An Introduction (Imperial College Press, 2005), ISBN 9781860941351, URL https://books.google.com/books?id=AlJDBqs0KaMC.
- Grava et al. (2008) J. Grava, M. A. Purvis, J. Filevich, M. C. Marconi, J. J. Rocca, J. Dunn, S. J. Moon, and V. N. Shlyaptsev, Phys. Rev. E. 78, 016403 (2008).
- Feister et al. (2014) S. Feister, J. A. Nees, J. T. Morrison, K. D. Frische, C. Orban, E. A. Chowdhury, and W. M. Roquemore, Review of Scientific Instruments 85, 11D602 (2014), eprint 1406.3639.
Appendix A Exhaustive list of simulations
The following is an exhaustive list of the 2D(3) PIC simulations presented in this paper.
| Wavelength (µm) | Intensity (W/cm2) | Gaussian Radius (µm) | Pulse FWHM (fs) | Laser Energy (J) | Pre-Plasma Scale (µm) | Target Density (cm-3) | Simulation Timestep (fs) | Simulation Spatial Resolution (µm) | |
| 10 | 1.64 1013 | 0.0346 | 27.5 | 513 | 10-4 | 1.5 | 1023 | 0.5 | 0.25 |
| 10 | 1.64 1013 | 0.0346 | 27.5 | 513 | 10-4 | 19.2 | 1021 | 0.5 | 0.25 |
| 3 | 6.08 1014 | 0.0632 | 8.25 | 154 | 10-4 | 1.5 | 1023 | 0.15 | 0.1 |
| 3 | 6.08 1014 | 0.0632 | 8.25 | 154 | 10-4 | 5.77 | 1023 | 0.15 | 0.1 |
| 10 | 1.64 1014 | 0.109 | 27.5 | 513 | 10-3 | 1.5 | 1023 | 0.5 | 0.25 |
| 10 | 1.64 1014 | 0.109 | 27.5 | 513 | 10-3 | 19.2 | 1021 | 0.5 | 0.25 |
| 0.78 | 3.46 1016 | 0.124 | 2.15 | 40 | 10-4 | 1.5 | 1023 | 0.1 | 0.033 |
| 3 | 6.08 1015 | 0.200 | 8.25 | 154 | 10-3 | 1.5 | 1023 | 0.15 | 0.1 |
| 3 | 6.08 1015 | 0.200 | 8.25 | 154 | 10-3 | 5.77 | 1023 | 0.15 | 0.1 |
| 10 | 1.64 1015 | 0.346 | 27.5 | 513 | 10-2 | 1.5 | 1023 | 0.5 | 0.25 |
| 10 | 1.64 1015 | 0.346 | 27.5 | 513 | 10-2 | 19.2 | 1021 | 0.5 | 0.25 |
| 0.78 | 3.46 1017 | 0.392 | 2.15 | 40 | 10-3 | 1.5 | 1023 | 0.1 | 0.033 |
| 3 | 6.08 1016 | 0.632 | 8.25 | 154 | 10-2 | 1.5 | 1023 | 0.15 | 0.1 |
| 3 | 6.08 1016 | 0.632 | 8.25 | 154 | 10-2 | 5.77 | 1023 | 0.15 | 0.1 |
| 10 | 1.64 1016 | 1.09 | 27.5 | 513 | 10-1 | 1.5 | 1023 | 0.5 | 0.25 |
| 10 | 1.64 1016 | 1.09 | 27.5 | 513 | 10-1 | 19.2 | 1021 | 0.5 | 0.25 |
| 0.78 | 3.46 1018 | 1.24 | 2.15 | 40 | 10-2 | 1.5 | 1023 | 0.1 | 0.033 |
| 3 | 6.08 1017 | 2.00 | 8.25 | 154 | 10-1 | 1.5 | 1023 | 0.15 | 0.1 |
| 3 | 6.08 1017 | 2.00 | 8.25 | 154 | 10-1 | 5.77 | 1023 | 0.15 | 0.1 |
| 10 | 1.64 1017 | 3.46 | 27.5 | 513 | 1 | 1.5 | 1023 | 0.5 | 0.25 |
| 10 | 1.64 1017 | 3.46 | 27.5 | 513 | 1 | 19.2 | 1021 | 0.5 | 0.25 |
| 0.78 | 3.46 1019 | 3.92 | 2.15 | 40 | 10-1 | 1.5 | 1023 | 0.1 | 0.033 |
| 3 | 6.08 1018 | 6.32 | 8.25 | 154 | 1 | 1.5 | 1023 | 0.15 | 0.1 |
| 3 | 6.08 1018 | 6.32 | 8.25 | 154 | 1 | 5.77 | 1023 | 0.15 | 0.1 |
| 10 | 1.64 1018 | 10.9 | 27.5 | 513 | 10 | 1.5 | 1023 | 0.5 | 0.25 |
| 10 | 1.64 1018 | 10.9 | 27.5 | 513 | 10 | 19.2 | 1021 | 0.5 | 0.25 |
| 0.78 | 3.46 1020 | 12.4 | 2.15 | 40 | 1 | 1.5 | 1023 | 0.1 | 0.033 |
| 3 | 6.08 1019 | 20.0 | 8.25 | 154 | 10 | 1.5 | 1023 | 0.15 | 0.1 |
| 3 | 6.08 1019 | 20.0 | 8.25 | 154 | 10 | 5.77 | 1023 | 0.15 | 0.1 |
| 0.78 | 3.46 1020 | 39.2 | 2.15 | 40 | 10 | 1.5 | 1023 | 0.1 | 0.033 |