Soft phonon modes in the vicinity of the structural quantum critical point
Abstract
The quasi-skutterudite superconductors Sn13 (=Sr, Ca; =Ir, Rh, Co) are highly tunable featuring a structural quantum critical point. We construct a temperature-lattice constant phase diagram for these isovalent compounds, establishing Ca3Rh4Sn13 and Ca3Co4Sn13 as members close to and far away from the structural quantum critical point, respectively. Deconvolution of the lattice specific heat and the electrical resistivity provide an approximate phonon density of states and the electron-phonon transport coupling function for Ca3Rh4Sn13 and Ca3Co4Sn13, enabling us to investigate the influence of the structural quantum critical point. Our results support the scenario of phonon softening close to the structural quantum critical point, and explain the enhancement of the coupling strength on approaching structural instability.
I Introduction
The investigation of the interplay between structural instability and superconductivity has a long history. Early example includes A-15 compounds Nb3Sn and V3Si in which an enhancement of the superconducting critical temperature () was reported with the suppression of structural transition temperature Chu1973 ; Chu1974 . More recently, the material base has been expanded to include transition metal dichalcogenides derived from IrTe2 Yang2012 ; Pyon2012 ; Fang2013 ; Kamitani2016 ; Kudo2016 as well as Ni- and Fe-based superconductors Cruz2008 ; Yoshizawa2012 ; Niedziela2011 ; Kudo2012 ; Hirai2012 , in which superconductivity emerges at the first-order structural transition boundary. These studies explicitly highlight the role of structural instability on the stabilization of the superconductivitiy.
The stannide superconductors with a chemical composition Sn13 (=Ca, Sr, La; =Ir, Rh, Co) have recently been studied with a wide range of probes Klintberg2012 ; Goh2015 ; Yu2015 ; Hou2016 ; Kuo2014 ; Kuo2015 ; Yang2010 ; Gerber2013 ; Liu2013 ; Slebarski2014 ; Fang2014 ; BChen2015 ; Mazzone2015 ; Wang2012 ; Biswas2014 ; Wang2015 ; Kase2011 ; Hayamizu2011 ; Zhou2012 ; Sarkar2015 ; Biswas2015 ; Slebarski2013 ; Thomas2006 ; Slebarski2015 ; Neha2016 ; Tompsett2014 ; XChen2015 ; Cheung2016 ; Lue2016 ; Luo2016 ; Wang2017 ; Cheung2017 . The superconducting gap symmetry has been established to be of a conventional -wave type Kase2011 ; Hayamizu2011 ; Zhou2012 ; Wang2012 ; Biswas2014 ; Wang2015 ; Sarkar2015 . In certain compositions, a structural phase transition occurs upon cooling. For instance, Sr3Ir4Sn13 and Sr3Rh4Sn13 with a space group of at room temperature ( phase) Kase2011 ; Klintberg2012 undergo a structural phase transition at = 147 K and 138 K respectively, below which superlattice reflections were observed at the point, which corresponds to and the symmetry equivalents ( phase) Goh2015 ; Lue2016 . The structural transition has been shown to be of second order by the shape of the specific heat jump Yu2015 ; Cheung2017 , the absence of hysteresis in resistivity Goh2015 ; Klintberg2012 ; Cheung2017 and a continuous growth of superlattice reflection Lue2016 ; Cheung2017 around . Crucially, the structural transition temperature is highly controllable: can be suppressed to 0 K at a structural quantum critical point (QCP) via a suitable combination of hydrostatic pressure and chemical substitution Klintberg2012 ; Goh2015 , giving rise to phase diagrams in which the role of the structural quantum criticality and its influence on the superconductivity can be explored in a systematic manner.
(CaxSr1-x)3Ir4Sn13 Klintberg2012 , (CaxSr1-x)3Rh4Sn13 Goh2015 ; Yu2015 , and Ca3(Ir1-yCoy)4Sn13 Hou2016 are several substitution series that have been investigated recently. In (CaxSr1-x)3Rh4Sn13, it has been shown that can be driven to 0 K solely by calcium substitution. In the vicinity of the structural QCP, i.e. in (CaxSr1-x)3Rh4Sn13Goh2015 ; Yu2015 , the resistivity is linear in temperature, the Debye temperature is a minimum, takes the maximum value, and the superconducting state is of a strong-coupling nature, as benchmarked by a substantially enhanced gap-to- ratio and normalized specific heat jump Carbotte1990 ; Yu2015 . These observations can all be explained by considering the softening of the relevant phonon mode due to the second-order structural transition. Indeed, calculations have found the softening of phonon modes at the point Tompsett2014 ; Goh2015 , which was subsequently confirmed by inelastic neutron scattering in Ca3Ir4Sn13 Mazzone2015 . For Sr3Ir4Sn13, phonon softening was observed on approaching from below by ultrafast spectroscopy Luo2016 .
Recently, Hou et al. investigated Ca3(Ir1-yCoy)4Sn13 Hou2016 for low Co concentrations (). For this series, Ca3(Ir0.91Co0.09)4Sn13 appears to be at the part of the phase diagram where extrapolates to 0 K. Following a well-established method of analyzing specific heat and electrical resistivity Hou2016 ; Lortz2006 ; Lortz2008 ; Lortz2005 ; Junod1983 ; Teyssier2008 , the approximate phonon density of states and the electron-phonon transport coupling function of Ca3(Ir0.91Co0.09)4Sn13 were obtained, leading to the conclusion of phonon-mediated strong-coupling superconductivity, consistent with the observation of Yu et al. and Biswas et al. in relevant series Yu2015 ; Biswas2015 . To gain further insights into the role of structural instability, it is desirable to extend the work of Hou et al. to study a composition which is far away from the structural QCP, and this composition should not undergo a structural transition. As we will establish in this manuscript, Ca3Co4Sn13 ( K from resistivity, space group ) is a good candidate. In this work, we report and of Ca3Co4Sn13, and for a comparative study, of Ca3Rh4Sn13 which is very close to the structural QCP. Both Ca3Co4Sn13 and Ca3Rh4Sn13 are in the phase with no structural transition observed down to the lowest attainable temperature.
II Method
Single crystals of Ca3Rh4Sn13 and Ca3Co4Sn13 were synthesized by a tin flux method following similar steps as described elsewhere Yang2010 . The heat capacity was measured using a standard pulse relaxation method. The mass of the Ca3Rh4Sn13 and Ca3Co4Sn13 are 24.72 mg and 1.08 mg, respectively. Electrical resistivity was measured using the four-contact method. The low temperature and high magnetic field environment were provided by a Physical Property Measurement System (Quantum Design).
III Results and Discussion
The temperature-pressure phase diagrams constructed for (CaxSr1-x)3Rh4Sn13 Goh2015 and (CaxSr1-x)3Ir4Sn13 Klintberg2012 have established the role of Ca as a provider of chemical pressure in both isovalent substitution series. Furthermore, the two phase diagrams bear a close resemblance, hinting at more universal tuning parameters. Inspired by these observations, we plot in Fig. 1 the and of the two series against their room-temperature lattice constants. Since Co, Rh and Ir are from the same group in the periodic table, the chemical substitution of the site in Sn13 with these elements is also isovalent. Therefore, it is natural to include Ca3(Ir0.91Co0.09)4Sn13 and Ca3Co4Sn13 in the phase diagram. From Fig. 1, it is immediately clear that Ca3Co4Sn13 is far away from the structural QCP. Moreover, decreases under pressure with an initial slope 0.4 K/GPa Logg2014 , which follows the trend of on this part of the phase diagram. Therefore, Ca3Co4Sn13 is an ideal composition to investigate the right hand part of the phase diagram. Aliovalent stannides such as La3Co4Sn13 are excluded from this analysis.

The normal state specific heat of (Ca0.9Sr0.1)3Rh4Sn13, Ca3Rh4Sn13, and Ca3Co4Sn13 were measured from 2 K to 300 K. The Sommerfeld coefficient was first extracted from the specific heat at low temperature following the standard procedure (e.g. as described in detail in Ref. Yu2015 for both (Ca0.9Sr0.1)3Rh4Sn13 and Ca3Rh4Sn13). This allows us to subtract the electronic contribution from the total heat capacity. In the inset of Fig. 1, the phonon contribution to the specific heat divided by temperature, , is plotted. Additionally, the data for Ca3(Ir0.91Co0.09)4Sn13 were digitized from Ref. Hou2016 for comparison. It is clear that Ca3Co4Sn13 behaves differently from the others at low temperature. Note that we have avoided the compositions with structural transition, so that no Fermi surface reconstruction occurs and can be regarded as temperature independent.
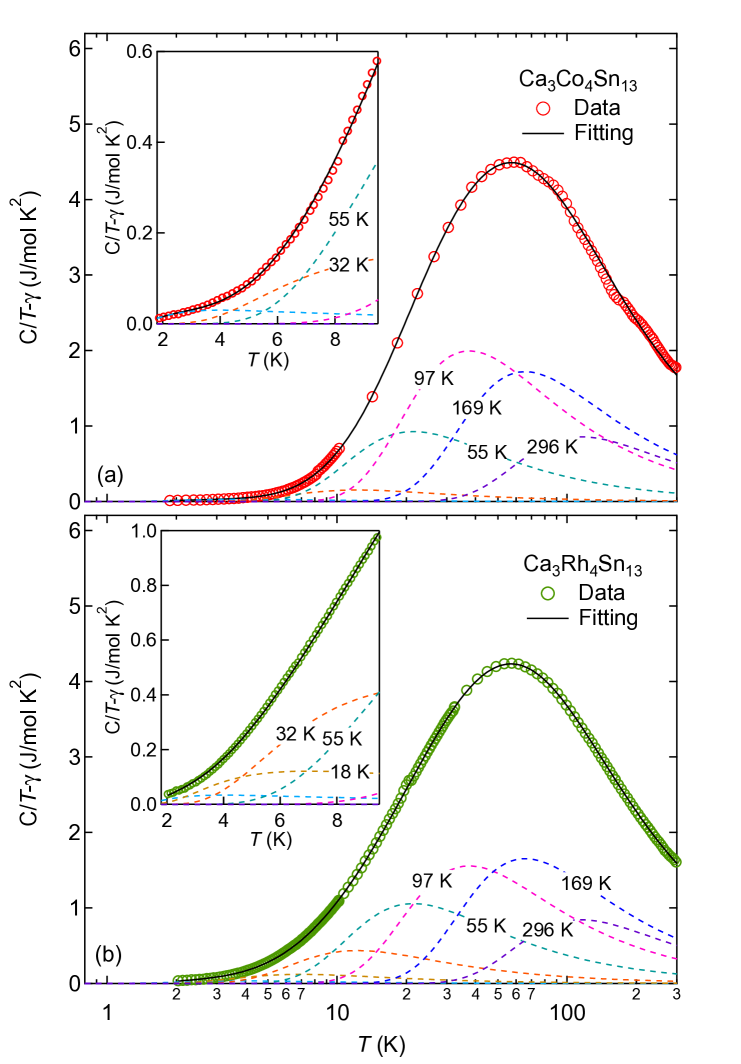
For quantitative comparison, we represent the phonon density of states using a basis of Einstein modes: with , where and are the Einstein temperature and the weight of the Einstein component, respectively. The corresponding specific heat is Hou2016 ; Lortz2006 ; Lortz2008 ; Lortz2005 ; Junod1983 ; Teyssier2008
| (1) |
where , is the Avogadro’s number, and is the Boltzmann constant. Fig. 2 presents the results for Ca3Co4Sn13 and Ca3Rh4Sn13, and the insets display a close-up at low temperature. With seven Einstein modes, equally spaced in the logarithmic scale such that 1.75, where the first term K, we successfully describe the lattice specific heat of both Ca3Co4Sn13 and Ca3Rh4Sn13 over the entire temperature range, with a sufficient resolution to identify the key difference between the two compounds.

In an analogous manner, we can study the spectral electron-phonon transport coupling function , where is dimensionless, from the decomposition of the total electrical resistivity into discrete components which can be described by the Bloch-Grüneisen formula Hou2016 ; Lortz2006 ; Lortz2008 ; Lortz2005 ; Junod1983 ; Teyssier2008 :
| (2) |
where , is the plasma frequency, and is the dielectric constant. The same set of Einstein modes used in specific heat analysis are employed for the analysis of the resistivity. Above 50 K, the resistivity starts to exhibit a negative curvature, suggesting a saturation behaviour at higher temperature. Following the empirical parallel-resistor model Wiesmann1977 , which was developed when the system approaches the Mott limit Adler1978 ; Mott1977 , our measured resistivity is analyzed with the following equation,
| (3) |
where is the fitted saturation resistivity. The value of is 368 cm and 169 cm for Ca3Co4Sn13 and Ca3Rh4Sn13, respectively. The results are shown in Fig. 3.
For both Ca3Co4Sn13 and Ca3Rh4Sn13, there are primarily three Bloch-Grüneisen components contributing to the resistivity. With the plasma frequency unknown, only the relative weight of can be obtained from the fitting. However, the electron-phonon coupling constant, , can be written as . From Ref. Hayamizu2011 , and 1.62 for Ca3Co4Sn13 and Ca3Rh4Sn13, respectively. Hence, the absolute value of , and consequently can be obtained.

The extracted and are plotted in Fig. 4, which provides key insight to the understanding of this material system. Comparing first obtained for both compounds whose weight distribution is represented as a histogram, it is clear that there are more low-energy phonon modes in Ca3Rh4Sn13 than in Ca3Co4Sn13. For example, while the contribution of the meV ( K) mode is negligible in Ca3Co4Sn13, it is finite in Ca3Rh4Sn13. Note that for both Ca3Co4Sn13 and Ca3Rh4Sn13 is close to 60 (Table I), which is the expected total number of phonon modes per formula unit since there are 20 atoms in each formula unit. This verifies the reliability of our data and the accuracy of our analysis. By inspecting () for (Ca0.9Sr0.1)3Rh4Sn13 and Ca3(Ir0.91Co0.09)4Sn13 (inset of Fig. 1), we can expect very similar to that of Ca3Rh4Sn13. These results reveal that part of the spectra weight of higher energy modes intrinsically transfer to lower energy as one tunes towards the structural QCP.
| Ca3Co4Sn13 | Ca3Rh4Sn13 | |||||||
| (K) | (meV) | |||||||
| 10.3 | 0.89 | 0.03 | 0 | 0.03 | 0 | |||
| 18.0 | 1.55 | 0 | 0 | 0.11 | 0 | |||
| 31.5 | 2.72 | 0.14 | 0.20 | 0.40 | 0.19 | |||
| 55.2 | 4.76 | 0.85 | 0.21 | 0.97 | 1.35 | |||
| 96.6 | 8.32 | 1.83 | 0.75 | 1.43 | 0.08 | |||
| 169 | 14.6 | 1.58 | 0.01 | 1.51 | 0 | |||
| 296 | 25.5 | 0.79 | 0 | 0.77 | 0 | |||
| 3.96 | 3.80 | |||||||
| Hayamizu2011 | 1.17 | 1.62 | ||||||
| 62.63 | 59.54 | |||||||
Turning to , it can be seen that the electrical resistivity of Ca3Rh4Sn13 is dominated by a mode at 4.76 meV (55 K). This is in contrast to the situation in Ca3Co4Sn13 where modes at higher energies play a more significant role in its electrical transport. In Table I, we tabulate the numerical values of the key parameters extracted from our analysis. Comparing with Ca3Co4Sn13, Ca3Rh4Sn13 has a smaller but larger , which is . This demonstrates how the coupling strength can be enhanced through coupling to soft phonon modes. In fact, linear resistivity has been reported below 50 K for (Ca0.9Sr0.1)3Rh4Sn13, which was established to be at the QCP, due to the coupling of the electron and the soft modes Goh2015 . Similar behaviour was observed in Ca3Ir4Sn13 at 18 kbar Klintberg2012 . Interestingly, Ca3(Ir0.91Co0.09)4Sn13 does not show a linear resistivity at low temperature even though it is located near the structural QCP. There, a large contribution from a mode at 12 meV was detected, together with a weaker contribution of a mode at 4 meV Hou2016 . To find out if other modes are softened on approaching structural instability in Ca3(Ir1-yCoy)4Sn13, it is important to investigate more members of the series, e.g. .
To further strengthen the claim that enhancement in coupling strength for Ca3Rh4Sn13 is due to the coupling to the soft mode, we investigate the scaled of Ca3Rh4Sn13 at 20.6 kbar and (Ca0.9Sr0.1)3Rh4Sn13 for comparison. As shown in Fig. 4(b), (Ca0.9Sr0.1)3Rh4Sn13, which is the closest to the QCP, exhibits an overall softening of (open triangles) when compared with the case of Ca3Rh4Sn13. Conversely, Ca3Rh4Sn13 at 20.6 kbar, which locates away from the QCP, shows an overall hardening of . The systematic change in highlights the importance of coupling to the phonon modes that are become softer as the system is tuned closer to the structural QCP.
In summary, we have established the universal phase diagram of the isovalent substitution series Sn13 (=Sr, Ca; =Ir, Rh, Co), and probed the influence of the structural QCP. Through our specific heat and electrical resistivity data, we extracted the phonon density of states and the electron-phonon transport coupling function, and directly compared these parameters in Ca3Rh4Sn13 and Ca3Co4Sn13, where the former compound is close to while the latter is far from the structural QCP. Near the QCP, an enhanced coupling to the low-lying phonon modes is clearly observed. Our work provides key support to models based on soft phonon modes that have been proposed for explaining the novel properties observed in these systems thus far.
Acknowledgements.
This work was supported by National Science Foundation China (No. 11504310), Research Grant Council of Hong Kong (ECS/24300214), CUHK Direct Grant (No. 3132719, No. 3132720), CUHK Startup (No. 4930048), and Grant-in-Aids for Scientific Research from Japan Society for the Promotion of Science (No. 16H04131).References
- (1) C. W. Chu and L. R. Testardi, Phys. Rev. Lett. 32, 766 (1974).
- (2) C. W. Chu, Phys. Rev. Lett. 33, 1283 (1974).
- (3) J. J. Yang, Y. J. Choi, Y. S. Oh, A. Hogan, Y. Horibe, K. Kim, B. I. Min, and S.-W. Cheong, Phys. Rev. Lett. 108, 116402 (2012).
- (4) S. Pyon, K. Kudo, and M. Nohara, J. Phys. Soc. Jpn 81, 053701 (2012).
- (5) A. F. Fang, G. Xu, T. Dong, P. Zheng, and N. L. Wang, Sci. Rep. 3, 1153 (2013).
- (6) M. Kamitani, H. Sakai, Y. Tokura, and S. Ishiwata, Phys. Rev. B 94, 134507 (2016).
- (7) K. Kudo, H. Ishii, and M. Nohara, Phys. Rev. B 93, 140505 (2016).
- (8) C. de la Cruz, Q. Huang, J. W. Lynn, J. Li, W. R. II, J. L. Zarestky, H. A. Mook, G. F. Chen, J. L. Luo, N. L. Wang, and P. Dai, Nature 453, 899 (2008).
- (9) M. Yoshizawa, D. Kimura, T. Chiba, S. Simayi, Y. Nakanishi, K. Kihou, C.-H. Lee, A. Iyo, H. Eisaki, M. Nakajima, and S. Uchida, J. Phys. Soc. Jpn 81, 024604 (2012).
- (10) J. L. Niedziela, D. Parshall, K. A. Lokshin, A. S. Sefat, A. Alatas, and T. Egami, Phys. Rev. B 84, 224305 (2011).
- (11) K. Kudo, M. Takasuga, Y. Okamoto, Z. Hiroi, and M. Nohara, Phys. Rev. Lett. 109, 097002 (2012).
- (12) D. Hirai, F. von Rohr, and R. J. Cava, Phys. Rev. B 86, 100505 (2012).
- (13) L. E. Klintberg, S. K. Goh, P. L. Alireza, P. J. Saines, D. A. Tompsett, P. W. Logg, J. Yang, B. Chen, K. Yoshimura, and F. M. Grosche, Phys. Rev. Lett. 109, 237008 (2012).
- (14) S. K. Goh, D. A. Tompsett, P. J. Saines, H. C. Chang, T. Matsumoto, M. Imai, K. Yoshimura, and F. M. Grosche, Phys. Rev. Lett. 114, 097002 (2015).
- (15) W. C. Yu, Y. W. Cheung, P. J. Saines, M. Imai, T. Matsumoto, C. Michioka, K. Yoshimura, and S. K. Goh, Phys. Rev. Lett. 115, 207003 (2015).
- (16) J. Hou, C. H. Wong, R. Lortz, R. Sibille, and M. Kenzelmann, Phys. Rev. B 93, 134505 (2016).
- (17) C. N. Kuo, H. F. Liu, C. S. Lue, L. M. Wang, C. C. Chen, and Y. K. Kuo, Phys. Rev. B 89, 094520 (2014).
- (18) C. N. Kuo, C. W. Tseng, C. M. Wang, C. Y. Wang, Y. R. Chen, L. M. Wang, C. F. Lin, K. K. Wu, Y. K. Kuo, and C. S. Lue, Phys. Rev. B 91, 165141 (2015).
- (19) J. Yang, B. Chen, C. Michioka, and K. Yoshimura, J. Phys. Soc. Jpn 79, 113705 (2010).
- (20) S. Gerber, J. L. Gavilano, M. Medarde, V. Pomjakushin, C. Baines, E. Pomjakushina, K. Conder, and M. Kenzelmann, Phys. Rev. B 88, 104505 (2013).
- (21) H. F. Liu, C. N. Kuo, C. S. Lue, K.-Z. Syu, and Y. K. Kuo, Phys. Rev. B 88, 115113 (2013).
- (22) A. Ślebarski, M. Fijałkowski, M. M. Maśka, M. Mierzejewski, B. D. White, and M. B. Maple, Phys. Rev. B 89, 125111 (2014).
- (23) A. F. Fang, X. B. Wang, P. Zheng, and N. L. Wang, Phys. Rev. B 90, 035115 (2014).
- (24) B. Chen, J. Yang, Y. Guo, and K. Yoshimura, Europhys. Lett. 111, 17005 (2015).
- (25) D. G. Mazzone, S. Gerber, J. L. Gavilano, R. Sibille, M. Medarde, B. Delley, M. Ramakrishnan, M. Neugebauer, L. P. Regnault, D. Chernyshov, A. Piovano, T. M. Fernández-Díaz, L. Keller, A. Cervellino, E. Pomjakushina, K. Conder, and M. Kenzelmann, Phys. Rev. B 92, 024101 (2015).
- (26) K. Wang and C. Petrovic, Phys. Rev. B 86, 024522 (2012).
- (27) P. K. Biswas, A. Amato, R. Khasanov, H. Luetkens, K. Wang, C. Petrovic, R. M. Cook, M. R. Lees, and E. Morenzoni, Phys. Rev. B 90, 144505 (2014).
- (28) L. M. Wang, C.-Y. Wang, G.-M. Chen, C. N. Kuo, and C. S. Lue, New J. Phys. 17, 033005 (2015).
- (29) N. Kase, H. Hayamizu, and J. Akimitsu, Phys. Rev. B 83, 184509 (2011).
- (30) H. Hayamizu, N. Kase, and J. Akimitsu, J. Phys. Soc. Jpn 80, SA114 (2011).
- (31) S. Y. Zhou, H. Zhang, X. C. Hong, B. Y. Pan, X. Qiu, W. N. Dong, X. L. Li, and S. Y. Li, Phys. Rev. B 86, 064504 (2012).
- (32) R. Sarkar, F. Brückner, M. Günther, K. Wang, C. Petrovic, P. K. Biswas, H. Luetkens, E. Morenzoni, A. Amato, and H.-H. Klauss, Physica B 479, 51 (2015).
- (33) P. K. Biswas, Z. Guguchia, R. Khasanov, M. Chinotti, L. Li, K. Wang, C. Petrovic, and E. Morenzoni, Phys. Rev. B 92, 195122 (2015).
- (34) A. Ślebarski and J. Goraus, Phys. Rev. B 88, 155122 (2013).
- (35) E. L. Thomas, H.-O. Lee, A. N. Bankston, S. MaQuilon, P. Klavins, M. Moldovan, D. P. Young, Z. Fisk, and J. Y. Chan, J. Solid State Chem. 179, 1642 (2006).
- (36) A. Ślebarski, M. M. Maśka, M. Fijałkowski, C. A. McElroy, and M. B. Maple, J. Alloy Compd. 646, 866 (2015).
- (37) P. Neha, P. Srivastava, R. Jha, Shruti, V. P. S. Awana, and S. Patnaik, J. Alloy Compd. 665, 333 (2016).
- (38) D. A. Tompsett, Phys. Rev. B 89, 075117 (2014).
- (39) X. Chen, S. K. Goh, D. A. Tompsett, W. C. Yu, L. Klintberg, S. Friedemann, H. Tan, J. Yang, B. Chen, M. Imai, K. Yoshimura, M. B. Gamza, F. M. Grosche, and M. L. Sutherland, Phys. Rev. B 93, 235121 (2016).
- (40) Y. W. Cheung, J. Z. Zhang, J. Y. Zhu, W. C. Yu, Y. J. Hu, D. G. Wang, Y. Otomo, K. Iwasa, K. Kaneko, M. Imai, H. Kanagawa, K. Yoshimura, and S. K. Goh, Phys. Rev. B 93, 241112 (2016).
- (41) C. S. Lue, C. N. Kuo, C. W. Tseng, K. K. Wu, Y.-H. Liang, C.-H. Du, and Y. K. Kuo, Phys. Rev. B 93, 245119 (2016).
- (42) C. W. Luo, P. C. Cheng, C. M. Tu, C. N. Kuo, C. M. Wang, and C. S. Lue, New J. Phys. 18, 073045 (2016).
- (43) H. -T. Wang et al., Sci. Rep. 7, 40886 (2017).
- (44) Y. W. Cheung et al., J. Phys.: Conf. Ser. 807, 032002 (2017).
- (45) J. P. Carbotte, Rev. Mod. Phys. 62, 1027 (1990).
- (46) R. Lortz, Y. Wang, U. Tutsch, S. Abe, C. Meingast, P. Popovich, W. Knafo, N. Shitsevalova, Y. B. Paderno, and A. Junod, Phys. Rev. B 73, 024512 (2006).
- (47) R. Lortz, R. Viennois, A. Petrovic, Y. Wang, P. Toulemonde, C. Meingast, M. M. Koza, H. Mutka, A. Bossak, and A. S. Miguel, Phys. Rev. B 77, 224507 (2008).
- (48) R. Lortz, Y. Wang, S. Abe, C. Meingast, Y. B. Paderno, V. Filippov, and A. Junod, Phys. Rev. B 72, 024547 (2005).
- (49) A. Junod, T. Jarlborg, and J. Muller, Phys. Rev. B 27, 1568 (1983).
- (50) J. Teyssier, R. Lortz, A. Petrovic, D. van der Marel, V. Filippov, and N. Shitsevalova, Phys. Rev. B 78, 134504 (2008).
- (51) P. W. Logg, Superconductivity in the proximity of a quantum critical point, PhD thesis, University of Cambridge, 2014.
- (52) H. Wiesmann, M. Gurvitch, H. Lutz, A. Ghosh, B. Schwarz, M. Strongin, P. B. Allen, and J. W. Halley, Phys. Rev. Lett. 38, 782 (1977).
- (53) D. Adler, H. K. Henisch, and S. N. Mott, Rev. Mod. Phys. 50, 209 (1978).
- (54) N. F. Mott, Contemp. Phys. 18, 225 (1977).