The role of environment on the star formation history of disc galaxies
Abstract
NGC 2403, NGC 300 and M33 are three nearby pure-disc galaxies with similar stellar mass in different environments, they are benchmarks for understanding late-type spiral galaxies in different environments. The chemical evolution and growth of their discs are investigated by using the simple chemical evolution model, in which their discs are assumed to originate and grow through the accretion of the primordial gas, and the gas outflow process is also taken into account. Through comparative study of the best-fitting model predicted star formation histories for them, we hope to derive a picture of the local environment on the evolution and star formation histories of galaxies and whether or not the isolated galaxies follow similar evolution history. Our results show that these three galaxies accumulated more than 50 percent of their stellar mass at . It can be also found that the metallicity gradients in isolated spiral galaxies NGC 2403 and NGC 300 are similar and obviously steeper than that in M33, when the metallicity gradients are expressed in . The similar metallicity gradients in NGC 2403 and NGC 300 indicate that they may experience similar chemical evolutionary histories. The principal epoch of star formation on the discs of NGC 2403 and NGC 300 is earlier than that on the disc of M33, and the mean age of stellar populations along the discs of both NGC 2403 and NGC 300 is older than that of M33. Our results indicates that the evolution and star formation history of a galaxy indeed depends on its local environment, at least for galaxies with stellar mass of .
keywords:
galaxies: evolution – galaxies: individual (NGC 2403, NGC 300 and M33) – galaxies: spiral1 Introduction
Understanding the effect of environment on galaxy formation and evolution is a central topic in extragalactic astronomy (Gupta et al., 2016). An influence of environment on the evolution of late-type galaxies has been studied by many groups, but no unanimous conclusion has been reached. Some studies thought that galaxy environment has an important impact on the physical properties of galaxies (Spitzer & Baade, 1951; Davis & Geller, 1976). For instance, compared to field galaxies, the clustered spiral galaxies are appeared to be redder (Dressler, 1980; Kennicutt, 1983), and the evolution timescale from blue star-forming to red passive galaxies is shorter in dense environments (Wilman et al., 2005; Cooper et al., 2006; Poggianti et al., 2006; Iovino et al., 2010). Spiral galaxies in the cluster also have systematically higher metallicity than comparable field galaxies (Shields et al., 1991; Cooper et al., 2008). However, many recent studies suggest the effect of the environment is much weaker than previously claimed. The evolution of late-type galaxies is driven mainly by their intrinsic properties and is largely independent of their environment over a large rang of local galaxy densities (Mouhcine et al., 2007; Ellison et al., 2009; Hughes et al., 2013; Goddard et al., 2017; Pilyugin et al., 2017, and references therein). Therefore, there exists some disagreement about whether or not the environment plays a significant role in shaping the evolution of galaxies.
On the other hand, isolated spirals are characterized by similar abundance gradients, regardless of the morphology, incidence of bars, absolute magnitude and mass, when normalized to either the exponential disc scale-length or the isophotal radius () (Zaritsky et al., 1994; Garnett et al., 1997; Henry & Worthey, 1999; Prantzos & Boissier, 2000; Muñoz-Mateos et al., 2011; Pilyugin et al., 2014; Sánchez et al., 2014; Ho et al., 2015). Since the gas-phase oxygen abundance provides a fossil record of the formation and evolution history of galaxies, the existence of a universal metallicity gradient implies that all isolated disc galaxies may follow very similar chemical evolution when growing their discs.
Individualized and comparative studies of the local spiral galaxies may help us understand the environment effect on the evolutionary history of galaxies and whether or not the isolated disc galaxies experience similar chemical evolution. However, most discs are difficult to study in detail due to the complexities of their bulges (Byun & Freeman, 1995). Fortunately, there are three undisturbed and bulgeless (pure-disc) spiral galaxies (NGC 2403, NGC 300 and M33) with different environments (see Figure 1 of Williams et al., 2013) in the nearby universe (). Due to the proximity, large angular sizes and low inclinations for them, they are excellent targets for detailed observations of their cold gas, star formation rate (SFR), metallicity and stellar populations, thus providing abundant observational constraints for the model of galaxy formation and evolution. In addition, these three galaxies are similar in stellar mass (i.e., luminosity) and morphology, and their basic observational properties are summarized in Table 1.
Among the three members, NGC 2403 is the most isolated one, and it is an outlying member of the M81 group. Its Hi rotation curve is extremely regular (de Blok et al., 2008), showing no warps (Williams et al., 2013). NGC 300 is a relatively isolated member on the Sculptor filaments with a nearby low-mass companion (NGC 55), and its outer Hi disc shows a severe warp (Puche et al., 1990), but there are no strong commonalities between NGC 300 and NGC 55 (Hillis et al., 2016). Thus, NGC 300 is undisturbed and nearly the same as the isolated disc galaxy NGC 2403 (Hillis et al., 2016). Compared to the above mentioned two objects, M33 is the least isolated one with a warped Hi disc between its disc and M31 (Karachentsev et al., 2004; Putman et al., 2009), indicating they interacted with each other in the past (Braun & Thilker, 2004; Bernard et al., 2012), and the Hi gas streams exist along the axis between them, which are potential fuel for future star formation in M33 and M31 (Wolfe et al., 2013). Above all, the stellar surface brightness profiles of both NGC 2403 and NGC 300 follow a pure exponential form, while that of M33 has a break at about (Bland-Hawthorn et al., 2005; Ferguson et al., 2007; Barker et al., 2007; Barker et al., 2011; Barker et al., 2012; Hillis et al., 2016). All the aforementioned information indicates that NGC 2403, NGC 300 and M33 are ideal laboratories to explore the local environment on the evolution of galaxies and whether or not the isolated spiral galaxies follow the similar chemical evolutionary histories. Thus, it is necessary to make a comparative study of the evolution and star formation history (SFH) of these three disc galaxies.
| Property | NGC 2403 | NGC 300 | M33 |
|---|---|---|---|
| Morphology | SAB(s)cda,b | SA(s)da,b | SA(s)cda,b |
| Distance(Mpc) | 3.2c,d | 2.0c | 0.8e |
| Scale-length (kpc) | 1.6i | 1.29j | 1.4j |
| Rotation velocity() | 136k | 91k | 110k |
The simple chemical evolution model is a fruitful tool to explore the formation and evolution of disc galaxies (Tinsley, 1980), and it has been successfully applied to investigate the evolution and SFHs of nearby disc galaxies (for instance, Chang et al., 1999, 2012; Chiappini et al., 2001; Prantzos & Boissier, 2000; Yin et al., 2009; Kang et al., 2012, 2016). The goal of this work is to provide a picture of the local environment on the evolution of galaxies and whether or not the isolated spiral galaxies experience similar chemical evolutionary histories. We have investigated the evolution and SFHs of M33 and NGC 300 in previous work by using the simple chemical evolution model (Kang et al., 2012, 2016). Thus, before making a comparative study of these three galaxies, we should use the simple chemical evolution model to explore the evolution and SFH of NGC 2403 first. As a result, the outline of this paper is organized as follows. The observational constraints of NGC 2403 are presented in Section 2. The main ingredients of our model are described in Section 3. In Section 4, we focus on investigating the evolution and SFH of NGC 2403 in spatial and temporal detail. In section 5, we compare the SFH of NGC 2403 with those of NGC 300 and M33, to explore the role of environment played in producing their differences and whether NGC 2403 and NGC 300 follow similar SFHs or not. Section 6 presents a summary of our results.
2 Observational data
| Property | Value | Refs. |
|---|---|---|
| Stellar mass | 1 | |
| Hi mass | 1, 2, 3, 4, 5, 6 | |
| H2 mass | 1, 2, 3 | |
| Gas fraction | this paper | |
| 2, 7, 8 | ||
| Total SFR | 1, 3, 4, 9 | |
| sSFR | 10 |
Since a successful galaxy chemical evolution model, especially one involving free parameters, should reproduce as many observational constraints as possible. The observed present-day cold gas, star-formation rate (SFR) and metallicity are crucial constraints on the galactic evolution model. Therefore, in this Section, we summarize the current available observations for the disc of NGC 2403, including the radial distribution and global constraints.
2.1 Radial distribution of Hi, SFR and metallicity
Leroy et al. (2008) and Schruba et al. (2011) derived the radial distribution of Hi gas mass surface density for NGC 2403 by using Very Large Array (VLA) maps of the 21 cm line, which is carried out by the National Radio Astronomy Observatory (NRAO). de Blok et al. (2014) presented deep Hi observations of NGC 2403 obtained with the Green Bank Telescope of NRAO.
The SFR surface density, , was obtained from combinations of far-ultraviolet (FUV) with maps (Leroy et al., 2008) and with maps (Schruba et al., 2011). Williams et al. (2013) estimated the recent radial profiles of from the resolved stars. The radio-continuum emission was used to derive by Heesen et al. (2014).
Oxygen is the most abundant heavy element in the Universe (Korotin et al., 2014; Zahid et al., 2014), and it is always using as a proxy for the production of all heavy elements in galaxies (Zahid et al., 2014). Furthermore, in the research of galaxies, metallicity is defined as the amount of oxygen relative to hydrogen, . Searle (1971) was the first to find that disc galaxies might possess radial metallicity gradient. Subsequently, a number of authors confirmed his interpretation that the gas-phase metallicity decreases with radius (e.g., McCall et al., 1985; Zaritsky et al., 1994; Rosolowsky & Simon, 2008; Bresolin et al., 2009; Moustakas et al., 2010; Pilyugin et al., 2014). Importantly, the observed abundance gradient is one of the important constraints on the galaxy chemical evolution model (Boissier & Prantzos, 2000; Mollá & Díaz, 2005; Chang et al., 2012; Kang et al., 2012, 2016). The radial distribution of gas-phase oxygen abundance () along the disc of NGC 2403 has been derived by several authors (McCall et al., 1985; Zaritsky et al., 1994; Garnett et al., 1997, 1999; van Zee et al., 1998; Bresolin et al., 1999; Moustakas et al., 2010; Berg et al., 2013; Pilyugin et al., 2014), and those adopted to constrain our model are including from Berg et al. (2013), Pilyugin et al. (2014) and Moustakas et al. (2010, e.g., using the empirical calibrated method in ()).
All the above mentioned radial profiles of Hi, SFR and will be used in Figure 1 to constrain the model for selecting the best-fitting model for NGC 2403.
2.2 Global properties of Hi, SFR and metallicity
NGC 2403 is a Hi-dominated, low-mass spiral galaxy, and its Hi gas disc extends beyond its optical disc. The atomic hydrogen mass of NGC 2403 has been calculated to be (Garnett, 2002; Kennicutt et al., 2003; Thilker et al., 2007; Leroy et al., 2008; Wiegert & English, 2014). Its molecular gas mass is (Garnett, 2002; Kennicutt et al., 2003; Leroy et al., 2008). Leroy et al. (2008) estimated the total stellar mass and disc scale-length of NGC 2403 from Spitzer maps, and the corresponding values are and , respectively. Therefore, we can easily get the gas fraction , which is defined as , and its value is .
Using different tracers, the current total SFR for the NGC 2403 disc has been measured by several groups, from emission by Kennicutt et al. (2003), from a combination of FUV with maps by Leroy et al. (2008), from emission and from FUV luminosity calibrated by Karachentsev & Kaisina (2013), and derived jointly from TIR and UV luminosities by Thilker et al. (2007). Muñoz-Mateos et al. (2007) used FUV color to calculate specific SFR (sSFR), and derived that the value of sSFR for NGC 2403 is . sSFR is defined as , which represents the ratio of young to old stars and shows what fraction of total star formation have been occurred recently.
The gas-phase metallicity of a galaxy is usually represented by the value of oxygen abundance at the effective radius of the disc, (Zaritsky et al., 1994; Garnett, 2002; Sánchez et al., 2013). is defined as the radius at which the integrated flux is half of the total one, and it is equal to 1.685 times the radial scale-length of the disc. The oxygen abundance for the disc of NGC 2403 has been measured using different calibrated methods (Zaritsky et al., 1994; Garnett, 2002; Moustakas et al., 2010; Pilyugin et al., 2014). A summery of the global properties for the disc of NGC 2403 is displayed in Table 2, which will be used to constrain the model in Section 4.
3 The Model
In this section, we briefly introduce the basic assumptions and main ingredients of the model. We assume that the NGC 2403 disc is progressively built up by continuous infall of primordial gas () from its halo, and it is composed of a set of independently evolved concentric rings with the width 500 pc. Infalls of primordial gas, star formation, metal production via stellar evolution, stellar mass return, and outflows of metal enriched gas are considered in our model, both instantaneous recycling assumption (IRA) and instantaneous mixing of the ISM with stellar ejecta are also assumed in our model. For simplicity, neither radial gas flows nor stellar migration is taken into account in our model. We adopt a standard flat cosmology with , , and the Hubble constant in this work, and the adopted solar metallicity is (Asplund et al., 2009).
Following Kang et al. (2012, 2016), the classical set of integro-differential equations from Tinsley (1980) are adopted to express the chemical evolution in each ring of the disc for NGC 2403. Since the return fraction and the nucleosynthesis yield in the chemical evolution model mainly depend on the adopted stellar initial mass function (IMF). We obtain and after taking stellar IMF from Chabrier (2003).
Bigiel et al. (2014) identified clear inflow signatures from the study of Hi velocity fields for NGC 2403. The cold gas infall rate (, in units of ), as a function of space and time, is adopted as that in Kang et al. (2012) and Kang et al. (2016):
| (1) |
where is the gas infall timescale, and it is a free parameter in our model. The are a set of separate quantities constrained by the present-day stellar mass surface density , and is the cosmic age. we set according to the standard flat cosmology. That is, are iteratively calculated by requiring the model predicted equal to its observed value (Chang et al., 2012; Kang et al., 2012, 2016). The present-day stellar mass surface density of NGC 2403 is well described by a simple exponential profile (Cepa et al., 1988; Barker et al., 2012; Williams et al., 2013),
| (2) |
where is the present-day value of disc scale-length. is the present-day central stellar mass surface density, and it can be easily obtained from . Here, we adopt the stellar mass and disc scale-length of NGC 2403 as and , which are obtained from the luminosity (Leroy et al., 2008).
The SFR surface density, , describes the total mass of newly born stars in unit time and area. At each radius and time , depends on the local molecular gas surface density (Leroy et al., 2008; Leroy et al., 2013; Chang et al., 2012; Kang et al., 2012, 2016; Kubryk et al., 2015), and is linearly proportional to :
| (3) |
where is the molecular gas depletion time, and its value is adopted as in this work (Leroy et al., 2008; Leroy et al., 2013). The reader is referred to Kang et al. (2012, 2016) for a more indepth description for the calculation of the molecular hydrogen to atomic hydrogen gas surface density in a galaxy disc, as well as the reason that we adopt the correlated star formation law.
In general, low-mass galaxies have low escape velocities due to their shallower gravitational potentials, which make them more susceptible to losing their ISM through supernova feedback (Hunter & Thronson, 1995; Thuan et al., 1999; Tremonti et al., 2004). In addition, galaxies with rotation speed may expel a large part of their supernova ejecta to the circumgalactic medium (Garnett, 2002). NGC 2403 is a fairly low-mass disc galaxy with stellar mass (Leroy et al., 2008) and with a rotation speed about (Garnett, 2002), thus the gas-outflow process has a significant influence on the chemical enrichment during its evolution history.
The outflowing gas is assumed to not fall again to the disc, and it has the same metallicity as the ISM when the outflow process occurred (Chang et al., 2010; Kang et al., 2012, 2016; Ho et al., 2015). Following the method of Recchi et al. (2008), the gas outflow rate (in units of ) is assumed to be proportional to , that is:
| (4) |
where is the outflow efficiency, and it is the other free parameter in our model.
In summary, there are two free parameters, the infall time-scale and the outflow efficiency , left in our model. Moreover, there exists degeneracy between and in that the model adopting a higher need a larger to reproduce the observed metallicity profile. Thanks to the fact that the reasonable range of is small compared with the large possible rang of , we can constrain using the observed abundance distribution.
4 Results
| (mag) | (mag) | SFR () | sSFR () | ||||
|---|---|---|---|---|---|---|---|
| -21.94 | -18.73 | 0.797 | 3.28 | 0.469 | 0.418 | -10.042 | 8.529 |
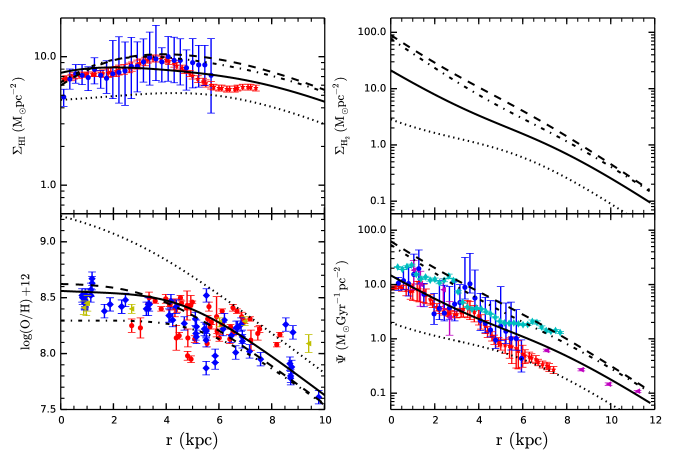
As has been mentioned in Section 3 that there are two free parameters, the gas infall timescale and the outflow efficiency , in the model, here we investigate the free parameters on the model results through comparing the model predictions with observations. Figure 1 demonstrates the comparisons between the model predicted radial profiles and the observations. The dotted line, dashed line and dot-dashed line are corresponding to three limiting cases of , and , respectively. Comparisons among dotted line, dashed line and dot-dashed line show that the model predictions are very sensitive to the adopted infall timescale , while the outflow efficiency mainly influence the shape of metallicity. This is mainly due to the fact that the infall timescale mainly determines the gas supply during the whole evolutionary history of a galaxy, while the outflow efficiency takes a fraction of metals away from the disc.
It can be seen from Figure 1 that almost all the observational constraints locate between the dotted line and the dot-dashed line, which implies that we can certainly find a model that can reproduce the main observational data along the disc of NGC 2403. Figure 1 also shows that the metallicity in the central region is high than that in the outmost region, and the observed results certify that the disc of NGC 2403 follows an inside-out formation scenario (Muñoz-Mateos et al., 2007). Like the method in our previous work (Kang et al., 2012, 2016), we assume the form of infall timescale is (Chiosi, 1980; Matteucci & Francois, 1989), where a and b are the coefficients for . Including another free parameter , there are three free parameters (a, b and ) in our model that we should determine.
In order to select the best-fitting model for NGC 2403, we should first search for the best combination of free parameters a, b and . Thus, we use the classical technique through comparing the model predicted profiles with the corresponding observational data, such as the radial profiles of Hi, SFR and (like the method adopted in Kang et al., 2016). The boundary conditions of a, b and for NGC 2403 are separately assumed to be , and . In practice, we calculate the value of by comparing our model predictions with the observed data, i.e., the combination of the radial profiles of Hi, SFR and . For each pair of a and b, we vary the value of to search for the minimum value of . The minimum value of is corresponding to the best combination of a, b and , and we obtain (a, b, )= (0.2, 3.2, 0.6). That is, is defined as the best-fitting model, and its results are shown as solid lines in Fig. 1. It can be found that the solid lines almost reproduce all the observed data, which means that this parameter group may reasonably describe the crucial ingredients of the main physical processes that regulate the formation and evolution of NGC 2403.
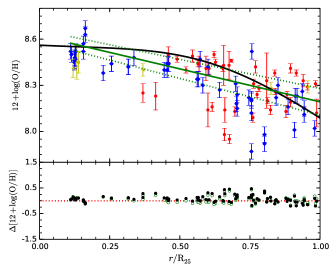
The metallicity provides an important indicator of the evolutionary history of a galaxy, therefore we use to further state the best-fitting model can nicely describe the formation and evolution of NGC 2403. Comparisons of the best-fitting model predicted present-day distributions (black solid line) with the observational data (points) are displayed in the upper panel of Figure 2 when the galactocentric are normalized to . The deviations of the observed points from our best-fitting model predicted are shown as the black filled circles in the lower panel of Figure 2, which are obtained from the best-fitting model predictions minus the observational data. We also find the linear best fit to the observed data within the optical radius. The linear best fit and the uncertainty are also shown in the upper panel of Figure 2 by the green solid line and green dotted lines, respectively. The deviations of the observed points from the corresponding linear best fit are denoted as the green open circles in the lower panel of Figure 2. The lower panel of Figure 2 reveals that the black solid circles almost coincide with the green open circles. The mean values of deviations for the black filled circles and the green open circles are 0.12 and 0.11, respectively.
Recently, Kudritzki et al. (2015) derived the present-day radial profile of for NGC 2403 through , and is obtained from the following equation,
| (5) |
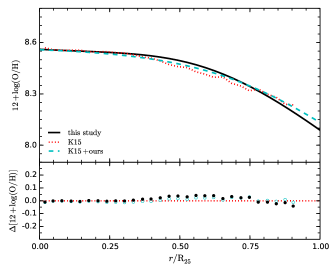
where and , and are the mass-loss and the mass-gain loading factors respectively, and and for NGC 2403. The return fraction and the oxygen yield are adopted. and are the observed present-day stellar mass and total gas mass surface density from Schruba et al. (2011), and the total gas mass surface density is defined as (More information about the derivation of the models and equation 5 are in Kudritzki et al. (2015)). Here, we compare the radial profile of predicted by our best-fitting model with that of Kudritzki et al. (2015), which are plotted in Fig. 3 by black solid line and red dotted line, respectively. It can be found that our results are basically agreement with their results. Using the radial profile of along the disc of NGC 2403 predicted by our model and that predicted by the recent model of Kudritzki et al. (2015) to calculate the deviations of for NGC 2403, which are denoted as black filled circles in the lower panel of Fig.3, we further demonstrate there is no significant difference between the two predictions.
In order to further certify our results, we also use our best-fitting model predicted and to replace the observed and in equation 5, and other parameters in the equation 5 are the same as those of Kudritzki et al. (2015). The result is displayed as cyan dashed line in Fig. 3. It can be seen that the cyan dashed line and the red dotted line are nearly the same, and their corresponding deviations of are displayed as cyan open circles in the lower panel of Fig.3. Most important of all, the mean value of deviation for the results of Kudritzki et al. (2015) (red dotted line in the upper panel of Fig.3) from the observed data (points in the upper panel of Fig.2) is , and the mean deviation value for Kours (cyan dashed line in the upper panel of Fig.3) from the observed data (points in the upper panel of Fig.2) is also . This information reinforces our results that our model predicted and can also nicely reproduce the observed values from Schruba et al. (2011).
In Table 3, we also display the best-fitting model predicted present-day total quantities of NGC 2403, such as the absolute and band magnitude and , Hi mass, gas fraction , total SFR, sSFR and characteristic (defined as the oxygen value at the effective radius ). It can be found that the physical quantities in Table 3 are basically agreement with the corresponding observed ones in Table 1 and Table 2 considering the observed uncertainties.
5 Comparison with NGC 300 and M33
| Individual | NGC 2403 | NGC 300 | M33 | ||
| Input physical properties | Total stellar mass () | 5.0 | 1.928 | 4.0 | |
| Scale-length (kpc) | 1.6 | 1.29 | 1.4 | ||
| Star formation law | Molecular gas depletion time | 1.9 | 1.9 | 0.46 | |
| Infall rate | Infall time-scale (Gyr) | ||||
| Outflow rate | Outflow efficiency | 0.6 | 0.9 |
In order to provide a picture of the local environment on the evolution of galaxies and whether or not the isolated spiral galaxies follow similar evolution histories, we will compare the SFH of NGC 2403 with those of nearby morphological twins NGC 300 and M33 in this section. Table 4 summarizes the main input properties and the best-fitting parameters for them. Physical details of the model description and searching for the best-fitting models for NGC 300 and M33 are in Kang et al. (2016) and in Kang et al. (2012), respectively. Through comparative studying the metallicity gradient and mean age gradient, along with cosmic evolution of disc scale-length, stellar mass and SFR for these three galaxies, we hope to investigate the impact of local environment on the evolution and SFH of these three galaxies, as well as whether or not the isolated spiral galaxies experience similar evolution histories.
5.1 The metallicity gradient
Rupke et al. (2010) found that the gas-phase oxygen abundance gradients in interacting disc galaxies are shallower than that in isolated disc galaxies, and the median metallicity gradient in interacting and isolated galaxies is and , respectively. Furthermore, Pilyugin et al. (2014) measured the metallicity gradients of 130 nearby late-type galaxies, and derived the universal metallicity gradients of for 104 of their field galaxies (i.e., excluding mergers and close pairs). Ho et al. (2015) also studied the integral field unit (IFU) observations of 49 isolated spiral galaxies with absolute magnitudes , and found evidence for a common metallicity gradient among their galaxies when the slope is expressed in units of the isophotal radius , i.e., .
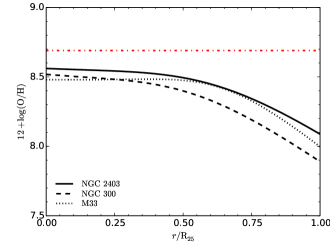
The aforementioned information indicates the necessity to explore the metallicity gradients for the discs of NGC 2403, NGC 300 and M33. The best-fitting model predicted present-day gas-phase oxygen abundance profiles of NGC 2403 (solid line), NGC 300 (dashed line) and M33 (dotted line) are plotted in Fig. 4. The best-fitting model predicted present-day central oxygen abundance are 8.560 for NGC 2403, 8.518 for NGC 300 and 8.480 for M33, consistent with the observed central value of them in Pilyugin et al. (2014), i.e., for NGC 2403, for NGC 300 and for M33, taking into account the observed uncertainties and the calibration for determining metallicity.
It can be seen from Fig. 4 that the metallicity gradients of NGC 2403 and NGC 300 are similar, while the metallicity gradient of M33 in the inner region () is obviously shallower than that of NGC2403 and NGC 300, when the metallicity gradients are expressed in . The model predicted present-day metallicity gradients in the central parts (up to their break radii) are for NGC 2403, for NGC 300 and for M33. This is mainly because the interactions between M33 and M31 drive large gas flows towards the central region, carrying less enriched gas from the outskirts of M33 into its central region, diluting the central region metallicity, and change its metallicity gradient.
Compared to the inner regions, the model predicted present-day metallicity gradients in the outer parts (after their break radii) are similar for them, e.g., for NGC 2403, for NGC 300 and for M33. Our model predicted present-day metallicity gradients for these three target galaxies are in contradiction with the recent results of Toribio San Cipriano et al. (2016), who carried out the deep spectrophotometry of HII regions in NGC 300 and M33, and found that the gradients of oxygen abundances (derived from the collisionally excited lines) in NGC 2403, NGC 300 and M33 are close to each other. Fortunately, our results are in line with the previous observed results of Pilyugin et al. (2014), that is, the global gradients of oxygen abundances in M33 is shallower than that of NGC 2403 and NGC 300. Furthermore, the similar metallicity gradients in both NGC 2403 and NGC 300 indicate that they may experience similar chemical evolutionary histories (Prantzos & Boissier, 2000; Ho et al., 2015).
5.2 The evolution of the scale-length
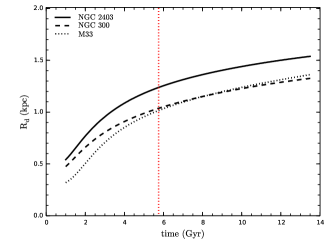
To derive the scale-length of the disc at each time bin, we fit an exponential law to the total stellar mass surface density profile. The left panel of Fig. 5 shows the temporal evolution of the disc scale-lengths for the three galaxies, NGC 2403 (solid line), NGC 300 (dashed line) and M33 (dotted line), and the vertical red dotted line denotes the galaxy evolutionary age at . It can be seen that increases with time in all cases, and the growth of the three discs seems to be approximately linear since . Then the disc scale-length growth rate can be expressed as the mean temporal disc growth rate, that is, . Therefore, the stellar disc scale-length growth rate between and predicted by their own best-fitting models are for NGC 2403, for NGC 300 and for M33, fairly consistent with the statistic results of Muñoz-Mateos et al. (2011) that the scale-length of late-type discs appear to grow at a rate of .
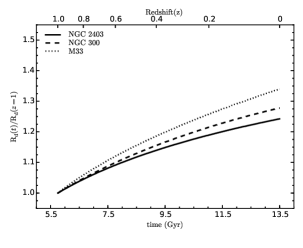
Rather than using the absolute growth rate in unit of to describe the evolution of galaxy discs, it should be more illustrative to focus on their relative size increase. The evolution of relative disc scale-lengths of these three galaxies predicted by their own best fitting models are shown in the right panel of Fig. 5, normalized to their sizes at . It can be seen that the disc size of them show clear growth since , and the relative increase is 1.242 for NGC 2403, 1.2778 for NGC 300, and 1.3396 for M33, respectively. That is, compared to M33, the scale-lengths of both NGC 2403 and NGC 300 have less growth (Hillis et al., 2016). Our results are in perfect agreement with the relative disc growth rate estimated by Muñoz-Mateos et al. (2007) and Muñoz-Mateos et al. (2011). In addition, it indicates that, even though the absolute growth rate of NGC 2403 is high, it will not have a significant increase in its scale-length.
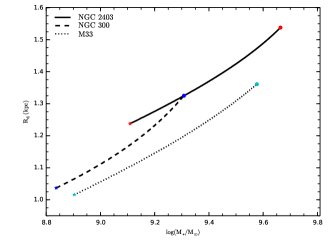
Figure 6 plots the evolution of stellar-mass–scale-length relation from to for NGC 2403 (solid line), NGC 300 (dashed line) and M33 (dotted line). The step and step is marked with filled circle and with filled asterisk, respectively. From Figure. 6, it can be seen that both stellar mass and scale-length simultaneously increase as time goes by, which reinforces the result of the previous studies (e.g., Brooks et al., 2011; Muñoz-Mateos et al., 2011; Brook et al., 2012, and references therein).
5.3 The evolution of the stellar mass
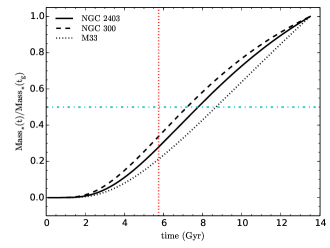
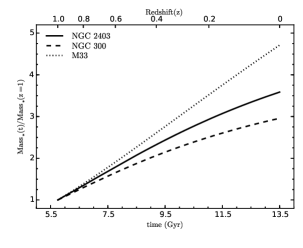
The left panel of Fig. 7 displays the best-fitting model predicted evolution of the stellar mass for NGC 2403 (solid line), NGC 300 (dashed line) and M33 (dotted line). To make the growth history of more visible, stellar masses are normalized to their present-day values; and to compute the growth rate, the horizontal dot-dashed line in the panel marks when the stellar mass achieves 50% of its final value. It can be seen that all of them have been steadily increasing to their present-day values. Furthermore, these three galaxies gained more than 50% of their total stellar mass in the past (i.e., since ), consistent with the previous results that late-type galaxies with stellar mass appear to gain most of their stellar mass at (Leitner & Kravtsov, 2011; Sachdeva et al., 2015).
To show the accumulation of stellar mass for them more vividly, we also plot the relative accumulated history of stellar mass since () in the right panel of Fig. 7, here normalized to the value at . The line types are the same as that in the left panel. It can be found that all the three galaxies become more massive with time, and we derive that the ratio between present-day value of stellar mass and the value at , , is for NGC 2403, for NGC 300, and for M33, respectively. It suggests that the principal time of star formation on the disc of M33 is later than that in NGC 2403 and NGC 300, indicating that the mean age of stellar population in M33 may be younger than that in NGC 2403 and NGC 300.
5.4 The evolution of SFR and sSFR
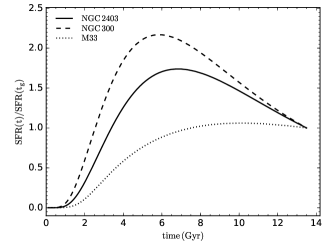
The SFHs of the three galaxies are displayed in the left panel of Fig. 8, and the different line types correspond to different galaxies: solid line for NGC 2403, dashed line for NGC 300 and dotted line for M33. Fig. 8 shows the SFH of NGC 2403 is similar to that of NGC 300, and both NGC 2403 and NGC 300 reach their peaks earlier than M33, that is, the principal time of star formation on the discs of NGC 2403 and NGC 300 is earlier than that on the disc of M33.
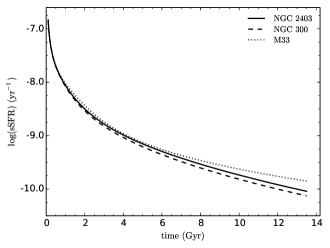
The temporal evolution of sSFR is shown in right panel of Fig. 8, and the line types are the same as that in the left panel. It can be found from the right panel of Fig. 8 that the sSFR of all the three galaxies decreases with time, and both NGC 2403 and NGC 300 have lower sSFR than that in M33 during their whole histories. Furthermore, the difference among them increases with time and reaches the maximum now. All these indicate that the star formation activity in M33 is more intense than that in other two isolated galaxies, and both observations and simulations indeed shown that interaction can lead to high star formation efficiencies (Schuster et al., 2007). Indeed, previous authors have concluded that star formation activity in the case of M33 is slightly different, that is, M33 is more efficient in forming stars than other spirals in the local Universe, especially for large spirals (Gardan et al., 2007; Gratier et al., 2010). The corresponding values of present-day sSFR predicted by their own best-fitting models are for NGC 2403, for NGC 300 and for M33. Meanwhile, Muñoz-Mateos et al. (2007) used FUV color as a proxy for sSFR, and derived that the values of sSFR for NGC 2403, NGC 300 and M33 are , and , respectively. Thus, our best-fitting model predicted sSFR values are in good agreement with the observed values of Muñoz-Mateos et al. (2007), considering the the observed uncertainties.
5.5 The age gradient
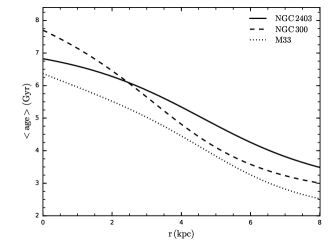
In order to display clearly the property of the stellar age of the three galaxies, we plot the mean stellar age along the discs of them, predicted by their own best-fitting models, with the solid line for NGC 2403, dashed line for NGC 300 and dotted line for M33 in Fig. 9. It can be seen that there exists radial age gradient in all of them, and the age gradient of NGC 2403 is shallower than those of NGC 300 and M33. The best-fitting model predicted stellar population mean age in the central region is 6.82 Gyr for NGC 2403, 7.70 Gyr for NGC 300 and for M33, and that at is 3.44 Gyr, 2.97 Gyr and 2.48 Gyr in the corresponding discs. We obtain the age gradient of NGC 2403 is , consistent with the previous observational work for the age distribution along the disc of NGC 2403 (Barker et al., 2012; Williams et al., 2013). This further confirms the above results that the mean age of stellar populations along the whole discs of both NGC 2403 and NGC 300 is older than that in M33. Meanwhile, it also indicates that recently there are more gas infall onto the disc of M33 and more star formation occurred along the M33 disc than that in the other two galaxies. This is mainly due to the fact that there exists an Hi bridge between M33 and M31, which is responsible for the future star formation in their discs (Wolfe et al., 2013).
6 Summary
In this work, we analyse the evolution and SFH for the disc of NGC 2403 by constructing a simple model, which is assumed that the disc of NGC 2403 originates and builds up through the accretion of the primordial gas, and the gas outflow process is also considered in the model. Our results show that the model results are very sensitive to the adopted gas infall timescale, while the outflow process mainly determined the shape of gas-phase metallicity distribution along the disc of NG 2403.
To provide a picture of the local environment on the evolution of galaxies and whether or not the isolated disc galaxies experience similar chemical evolution history, we compare our results of NGC 2403 with those of nearby morphological twins M33 and NGC 300, which are studied in our previous work (Kang et al., 2012, 2016). We found that these three galaxies gained more than 50 percent of their stellar mass in the past (i.e., at ). Our results also show that the metallicity gradient in M33 seems to be flatter than that in isolated galaxies NGC 2403 and NGC 300, and the metallicity gradient in NGC 2403 and NGC 300 are similar, when the metallicity gradients are expressed in , which implies that both NGC 2403 and M33 may follow similar chemical evolutionary histories. The principal epoch of star formation on the discs of NGC 2403 and NGC 300 is earlier than that on the disc on M33, and the mean age of stellar populations along the whole discs of both NGC 2403 and NGC 300 is older than that of M33. The local environment plays an important role on the evolution and SFH of a galaxy, at least for galaxies with stellar mass of .
Although we obtain the reasonable results about the environment on the evolution and SFH of spiral galaxies, we only focus on three spiral galaxies (NGC 2403, NGC 300 and M33) in the work. The sample size is small now, we will investigate large sample in the near future work, and IFU surveys provide large observational sample size for our future study.
Acknowledgements
We thank the anonymous referee whose comments and suggestions have improved the quality of this paper greatly. Xiaoyu Kang and Fenghui Zhang are supported by the National Natural Science Foundation of China (NSFC, No. 11573062, 11403092, 11390374 and 11521303), the YIPACAS Foundation (No. 2012048), and the Yunnan Foundation (No. 2011CI053). Ruixiang Chang is supported by the NSFC (No. 11373053 and 11390373), and Strategic Priority Research Program "The Emergence of Cosmological Structures" of the Chinese Academy of Sciences (CAS, No. XDB09010100). Xiaoyu Kang thanks Rolf-Peter Kudritzki in University of Hawaii for helpful suggestions during revision.
References
- Asplund et al. (2009) Asplund M., Grevesse N., Sauval A. J., Scott P., 2009, ARA&A, 47, 481
- Barker et al. (2007) Barker M. K., Sarajedini A., Geisler D., Harding P., Schommer R., 2007, AJ, 133, 1125
- Barker et al. (2011) Barker M. K., Ferguson A. M. N., Cole A. A., Ibata R., Irwin M., Lewis G. F., Smecker-Hane T. A., Tanvir N. R., 2011, MNRAS, 410, 504
- Barker et al. (2012) Barker M. K., Ferguson A. M. N., Irwin M. J., Arimoto N., Jablonka P., 2012, MNRAS, 419, 1489
- Berg et al. (2013) Berg D. A., Skillman E. D., Garnett D. R., Croxall K. V., Marble A. R., Smith J. D., Gordon K., Kennicutt Jr. R. C., 2013, ApJ, 775, 128
- Bernard et al. (2012) Bernard E. J., et al., 2012, MNRAS, 420, 2625
- Bigiel et al. (2014) Bigiel F., Cormier D., Schmidt T., 2014, Astronomische Nachrichten, 335, 470
- Bland-Hawthorn et al. (2005) Bland-Hawthorn J., Vlajić M., Freeman K. C., Draine B. T., 2005, ApJ, 629, 239
- Boissier & Prantzos (2000) Boissier S., Prantzos N., 2000, MNRAS, 312, 398
- Braun & Thilker (2004) Braun R., Thilker D. A., 2004, A&A, 417, 421
- Bresolin et al. (1999) Bresolin F., Kennicutt Jr. R. C., Garnett D. R., 1999, ApJ, 510, 104
- Bresolin et al. (2009) Bresolin F., Gieren W., Kudritzki R.-P., Pietrzyński G., Urbaneja M. A., Carraro G., 2009, ApJ, 700, 309
- Brook et al. (2012) Brook C. B., et al., 2012, MNRAS, 426, 690
- Brooks et al. (2011) Brooks A. M., et al., 2011, ApJ, 728, 51
- Byun & Freeman (1995) Byun Y. I., Freeman K. C., 1995, ApJ, 448, 563
- Cepa et al. (1988) Cepa J., Prieto M., Beckman J., Munoz-Tunon C., 1988, A&A, 193, 15
- Chabrier (2003) Chabrier G., 2003, ApJ, 586, L133
- Chang et al. (1999) Chang R. X., Hou J. L., Shu C. G., Fu C. Q., 1999, A&A, 350, 38
- Chang et al. (2010) Chang R. X., Hou J. L., Shen S. Y., Shu C. G., 2010, ApJ, 722, 380
- Chang et al. (2012) Chang R. X., Shen S. Y., Hou J. L., 2012, ApJ, 753, L10
- Chiappini et al. (2001) Chiappini C., Matteucci F., Romano D., 2001, ApJ, 554, 1044
- Chiosi (1980) Chiosi C., 1980, A&A, 83, 206
- Cooper et al. (2006) Cooper M. C., et al., 2006, MNRAS, 370, 198
- Cooper et al. (2008) Cooper M. C., Tremonti C. A., Newman J. A., Zabludoff A. I., 2008, MNRAS, 390, 245
- Dalcanton et al. (2009) Dalcanton J. J., Williams B. F., Seth A. C., Dolphin A., Holtzman J., Rosema K., Skillman E. D., Quinn T., 2009, ApJS, 183, 67
- Davis & Geller (1976) Davis M., Geller M. J., 1976, ApJ, 208, 13
- Dressler (1980) Dressler A., 1980, ApJ, 236, 351
- Ellison et al. (2009) Ellison S. L., Simard L., Cowan N. B., Baldry I. K., Patton D. R., McConnachie A. W., 2009, MNRAS, 396, 1257
- Ferguson et al. (2007) Ferguson A., Irwin2 M., Chapman S., Ibata R., Lewis G., Tanvir N., 2007, Resolving the Stellar Outskirts of M31 and M33. p. 239, doi:10.1007/978-1-4020-5573-7_39
- Freedman et al. (2001) Freedman W. L., et al., 2001, ApJ, 553, 47
- Gardan et al. (2007) Gardan E., Braine J., Schuster K. F., Brouillet N., Sievers A., 2007, A&A, 473, 91
- Garnett (2002) Garnett D. R., 2002, ApJ, 581, 1019
- Garnett et al. (1997) Garnett D. R., Shields G. A., Skillman E. D., Sagan S. P., Dufour R. J., 1997, ApJ, 489, 63
- Garnett et al. (1999) Garnett D. R., Shields G. A., Peimbert M., Torres-Peimbert S., Skillman E. D., Dufour R. J., Terlevich E., Terlevich R. J., 1999, ApJ, 513, 168
- Goddard et al. (2017) Goddard D., et al., 2017, MNRAS, 465, 688
- Gogarten et al. (2010) Gogarten S. M., et al., 2010, ApJ, 712, 858
- Gratier et al. (2010) Gratier P., et al., 2010, A&A, 522, A3
- Gupta et al. (2016) Gupta A., Yuan T., Tran K.-V. H., Martizzi D., Taylor P., Kewley L. J., 2016, ApJ, 831, 104
- Heesen et al. (2014) Heesen V., Brinks E., Leroy A. K., Heald G., Braun R., Bigiel F., Beck R., 2014, AJ, 147, 103
- Henry & Worthey (1999) Henry R. B. C., Worthey G., 1999, PASP, 111, 919
- Hillis et al. (2016) Hillis T. J., Williams B. F., Dolphin A. E., Dalcanton J. J., Skillman E. D., 2016, ApJ, 831, 191
- Ho et al. (2015) Ho I.-T., Kudritzki R.-P., Kewley L. J., Zahid H. J., Dopita M. A., Bresolin F., Rupke D. S. N., 2015, MNRAS, 448, 2030
- Hughes et al. (2013) Hughes T. M., Cortese L., Boselli A., Gavazzi G., Davies J. I., 2013, A&A, 550, A115
- Hunter & Thronson (1995) Hunter D. A., Thronson Jr. H. A., 1995, ApJ, 452, 238
- Iovino et al. (2010) Iovino A., et al., 2010, A&A, 509, A40
- Jarrett et al. (2003) Jarrett T. H., Chester T., Cutri R., Schneider S. E., Huchra J. P., 2003, AJ, 125, 525
- Kang et al. (2012) Kang X., Chang R., Yin J., Hou J., Zhang F., Zhang Y., Han Z., 2012, MNRAS, 426, 1455
- Kang et al. (2016) Kang X., Zhang F., Chang R., Wang L., Cheng L., 2016, A&A, 585, A20
- Karachentsev & Kaisina (2013) Karachentsev I. D., Kaisina E. I., 2013, AJ, 146, 46
- Karachentsev et al. (2004) Karachentsev I. D., Karachentseva V. E., Huchtmeier W. K., Makarov D. I., 2004, AJ, 127, 2031
- Kennicutt (1983) Kennicutt Jr. R. C., 1983, AJ, 88, 483
- Kennicutt et al. (2003) Kennicutt Jr. R. C., et al., 2003, PASP, 115, 928
- Korotin et al. (2014) Korotin S. A., Andrievsky S. M., Luck R. E., Lépine J. R. D., Maciel W. J., Kovtyukh V. V., 2014, MNRAS, 444, 3301
- Kubryk et al. (2015) Kubryk M., Prantzos N., Athanassoula E., 2015, A&A, 580, A126
- Kudritzki et al. (2015) Kudritzki R.-P., Ho I.-T., Schruba A., Burkert A., Zahid H. J., Bresolin F., Dima G. I., 2015, MNRAS, 450, 342
- Lee et al. (2011) Lee J. C., et al., 2011, ApJS, 192, 6
- Leitner & Kravtsov (2011) Leitner S. N., Kravtsov A. V., 2011, ApJ, 734, 48
- Leroy et al. (2008) Leroy A. K., Walter F., Brinks E., Bigiel F., de Blok W. J. G., Madore B., Thornley M. D., 2008, AJ, 136, 2782
- Leroy et al. (2013) Leroy A. K., et al., 2013, AJ, 146, 19
- Matteucci & Francois (1989) Matteucci F., Francois P., 1989, MNRAS, 239, 885
- McCall et al. (1985) McCall M. L., Rybski P. M., Shields G. A., 1985, ApJS, 57, 1
- Mollá & Díaz (2005) Mollá M., Díaz A. I., 2005, MNRAS, 358, 521
- Mouhcine et al. (2007) Mouhcine M., Baldry I. K., Bamford S. P., 2007, MNRAS, 382, 801
- Moustakas et al. (2010) Moustakas J., Kennicutt Jr. R. C., Tremonti C. A., Dale D. A., Smith J.-D. T., Calzetti D., 2010, ApJS, 190, 233
- Muñoz-Mateos et al. (2007) Muñoz-Mateos J. C., Gil de Paz A., Boissier S., Zamorano J., Jarrett T., Gallego J., Madore B. F., 2007, ApJ, 658, 1006
- Muñoz-Mateos et al. (2011) Muñoz-Mateos J. C., Boissier S., Gil de Paz A., Zamorano J., Kennicutt Jr. R. C., Moustakas J., Prantzos N., Gallego J., 2011, ApJ, 731, 10
- Pilyugin & Thuan (2005) Pilyugin L. S., Thuan T. X., 2005, ApJ, 631, 231
- Pilyugin et al. (2014) Pilyugin L. S., Grebel E. K., Kniazev A. Y., 2014, AJ, 147, 131
- Pilyugin et al. (2017) Pilyugin L. S., Grebel E. K., Zinchenko I. A., Nefedyev Y. A., Mattsson L., 2017, MNRAS, 465, 1358
- Poggianti et al. (2006) Poggianti B. M., et al., 2006, ApJ, 642, 188
- Prantzos & Boissier (2000) Prantzos N., Boissier S., 2000, MNRAS, 313, 338
- Puche et al. (1990) Puche D., Carignan C., Bosma A., 1990, AJ, 100, 1468
- Putman et al. (2009) Putman M. E., et al., 2009, ApJ, 703, 1486
- Recchi et al. (2008) Recchi S., Spitoni E., Matteucci F., Lanfranchi G. A., 2008, A&A, 489, 555
- Rosolowsky & Simon (2008) Rosolowsky E., Simon J. D., 2008, ApJ, 675, 1213
- Rupke et al. (2010) Rupke D. S. N., Kewley L. J., Chien L.-H., 2010, ApJ, 723, 1255
- Sachdeva et al. (2015) Sachdeva S., Gadotti D. A., Saha K., Singh H. P., 2015, MNRAS, 451, 2
- Sánchez et al. (2013) Sánchez S. F., Rosales-Ortega F. F., Jungwiert B., Iglesias-Páramo J., Vílchez J. M., Marino R. A., Bomans D., Califa Collaboration 2013, A&A, 554, A58
- Sánchez et al. (2014) Sánchez S. F., et al., 2014, A&A, 563, A49
- Schruba et al. (2011) Schruba A., et al., 2011, AJ, 142, 37
- Schuster et al. (2007) Schuster K. F., Kramer C., Hitschfeld M., Garcia-Burillo S., Mookerjea B., 2007, A&A, 461, 143
- Shields et al. (1991) Shields G. A., Skillman E. D., Kennicutt Jr. R. C., 1991, ApJ, 371, 82
- Spitzer & Baade (1951) Spitzer Jr. L., Baade W., 1951, ApJ, 113, 413
- Thilker et al. (2007) Thilker D. A., et al., 2007, ApJS, 173, 538
- Thuan et al. (1999) Thuan T. X., Izotov Y. I., Foltz C. B., 1999, ApJ, 525, 105
- Tinsley (1980) Tinsley B. M., 1980, Fundamentals Cosmic Phys., 5, 287
- Toribio San Cipriano et al. (2016) Toribio San Cipriano L., García-Rojas J., Esteban C., Bresolin F., Peimbert M., 2016, MNRAS, 458, 1866
- Tremonti et al. (2004) Tremonti C. A., et al., 2004, ApJ, 613, 898
- Wiegert & English (2014) Wiegert T., English J., 2014, New Astron., 26, 40
- Williams et al. (2009) Williams B. F., Dalcanton J. J., Dolphin A. E., Holtzman J., Sarajedini A., 2009, ApJ, 695, L15
- Williams et al. (2013) Williams B. F., Dalcanton J. J., Stilp A., Dolphin A., Skillman E. D., Radburn-Smith D., 2013, ApJ, 765, 120
- Wilman et al. (2005) Wilman D. J., et al., 2005, MNRAS, 358, 88
- Wolfe et al. (2013) Wolfe S. A., Pisano D. J., Lockman F. J., McGaugh S. S., Shaya E. J., 2013, Nature, 497, 224
- Yin et al. (2009) Yin J., Hou J. L., Prantzos N., Boissier S., Chang R. X., Shen S. Y., Zhang B., 2009, A&A, 505, 497
- Zahid et al. (2014) Zahid H. J., Dima G. I., Kudritzki R.-P., Kewley L. J., Geller M. J., Hwang H. S., Silverman J. D., Kashino D., 2014, ApJ, 791, 130
- Zaritsky et al. (1994) Zaritsky D., Kennicutt Jr. R. C., Huchra J. P., 1994, ApJ, 420, 87
- de Blok et al. (2008) de Blok W. J. G., Walter F., Brinks E., Trachternach C., Oh S.-H., Kennicutt Jr. R. C., 2008, AJ, 136, 2648
- de Blok et al. (2014) de Blok W. J. G., et al., 2014, A&A, 569, A68
- de Vaucouleurs et al. (1991) de Vaucouleurs G., de Vaucouleurs A., Corwin Jr. H. G., Buta R. J., Paturel G., Fouque P., 1991, Sky & Telesc., 82, 621
- van Zee et al. (1998) van Zee L., Salzer J. J., Haynes M. P., O’Donoghue A. A., Balonek T. J., 1998, AJ, 116, 2805