Neurogenesis and multiple plasticity mechanisms enhance associative memory retrieval in a spiking network model of the hippocampus
Abstract
Hippocampal CA3 is crucial for the formation of long-term associative memory. It has a heavily recurrent connectivity, and memories are thought to be stored as memory engrams in the CA3. However, despite its importance for memory storage and retrieval, spiking network models of the CA3 to date are relatively small-scale, and exist as only proof-of-concept models. Specifically, how neurogenesis in the dentate gyrus affects memory encoding and retrieval in the CA3 is not studied in such spiking models. Our work is the first to develop a biologically plausible spiking neural network model of hippocampal memory encoding and retrieval, with at least an order-of-magnitude more neurons than previous models. It is also the first to investigate the effect of neurogenesis on CA3 memory encoding and retrieval. Using such a model, we first show that a recently developed plasticity model is crucial for good encoding and retrieval. Next, we show how neural properties related to neurogenesis and neuronal death enhance storage and retrieval of associative memories in the CA3. In particular, we show that without neurogenesis, increasing number of CA3 neurons are recruited by each new memory stimulus, resulting in a corresponding increase in inhibition and poor memory retrieval as more memories are encoded. Neurogenesis, on the other hand, maintains the number of CA3 neurons recruited per stimulus, and enables the retrieval of recent memories, while forgetting the older ones. Our model suggests that structural plasticity (provided by neurogenesis and apoptosis) is required in the hippocampus for memory encoding and retrieval when the network is overloaded; synaptic plasticity alone does not suffice. The above results are obtained from an exhaustive study in the different plasticity models and network parameters.
Introduction
It is well known that the brain region called the hippocampus is heavily involved in long-term memory storage and retrieval [16]. In particular, a sub-region of the hippocampus known as the CA3 is crucial for the formation of long-term declarative memory, which includes both spatial [11] and episodic [19] memory. CA3 has heavily recurrent connectivity (i.e. CA3 neurons form many synaptic connections with other CA3 neurons), more so than any other brain area [13], and memories are thought to be stored as pattern of synaptic weights in the CA3, typically referred to as memory engrams.
However, despite the well-known importance of the CA3 for memory storage and retrieval, to date, spiking neural network models studying such a role exist as only small-scale models. These models, while useful for illustrating certain computational principles, contain only up to 30 CA3 neurons (e.g. [4, 17]). Moreover, they lack biological realism. There is hence a need for developing a computational model of the CA3 utilizing spiking neural networks to facilitate further studies of its functionality. Such a model should be organized as a recurrent network, with mutually connected excitatory and inhibitory populations, whilst the neurons are effectively in the fluctuation-driven regime, with near threshold mean membrane potential.
Our work is the first to develop a biologically realistic spiking neural network model of hippocampal memory encoding and retrieval, with over two orders-of-magnitude as many neurons in the CA3 compared to previous models. It is also only a recent development whereby a combination of different plasticity models (using spike timing dependent plasticity, STDP) acting on different time-scales are shown to form long-lasting memory engrams in a biologically realistic spiking neural network; while previous works have consistently failed to form long-lasting memory engrams of a reasonable number without interference [5, 9].
Other studies have used feedforward, rate-based models of CA3, which are less realistic. It is therefore not clear how well their findings generalize to recurrent spiking networks, which the CA3 is one such network. Such networks have very different properties from simpler networks, and one major challenge is their stability [22, 1]. Neurogenesis (neuron birth) and neural apoptosis (neuron death) in the dentate gyrus add further complexity, whose role in memory formation in the CA3 has yet to be investigated in realistic models. We further note that among models of neurogenesis, most use rate-based neurons, with [2] the only exception (using spiking neurons). However, they do not model the CA3 region.
In [22], new plasticity mechanisms are developed to enable stable encoding of memories in plastic recurrent networks that can be retrieved hours (network time) later. However, the plasticity mechanisms have yet to be shown to be reliable for memories of a realistic number. Also, it is not clear what role neurogenesis plays in memory formation, given a plastic spiking network encoding a reasonable number of memories. Thus, our paper is the only work that investigates the effect of neurogenesis on a plastic spiking model of CA3.
Using our model, we first show that a novel plasticity rule [22] is crucial for good encoding and retrieval. Next, we show how properties related to neurogenesis (i.e. increased excitability of newborn neurons) in the dentate gyrus enhances memory encoding and retrieval in the CA3, while keeping the dentate gyrus population to a constant size (neuronal death is simulated whereby neurons are recycled to encode new memories). From our model, we discover that with increasing number of memories encoded, the network without neurogenesis fails to retrieve any of the previously encoded memories, while neurogenesis allows the more recent memories to be retrieved.
Methods
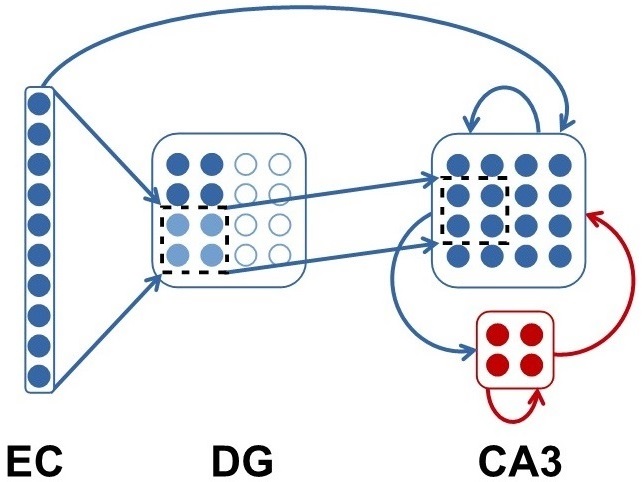
To study encoding and retrieval of associative memories in the hippocampus, we construct a three-layer spiking neuron network model of the hippocampus (Fig. 1). The three layers are respectively the entorhinal cortex (EC), the dentate gyrus (DG) and CA3. For simplicity, we do not model CA1, which is thought to perform a simple comparator or decoding role [19, 13, 14]. Incoming memories are simulated by stimulating a randomly selected subset of the EC neurons, which would trigger spiking activity that cascades to the other two layers via different pathways. Using three different sets of STDP models (see Plasticity models), we compare which of these would enable the stable encoding and retrieval of these memories. In this section, we describe first the hippocampal network setup, next the various plasticity rules, the different simulation settings and finally the measures to quantify memory retrieval for our study.
Network setup
The hippocampal network is made up of adaptive integrate-and-fire (AIF) neurons [22]. The entorhinal cortex is modeled using standalone AIF neurons, which receive no other inputs other than the memory stimuli. The DG is modeled using standalone AIF neurons. Depending on the simulation settings, the size of the DG network can be neurons. The CA3 network is a recurrent one, comprising of excitatory neurons and inhibitory neurons. In the recurrent network, the neurons are connected to each other with a Gaussian connectivity profile, such that neurons that are close to each other have a higher connectivity probability. EC neurons are connected to the CA3 excitatory neurons with a connection probability of . All DG and CA3 neurons receive fluctuating Poisson inputs to achieve a low firing rate of and a mean membrane potential of below spiking threshold. EC-CA3 connections (with plastic weights) are formed at the beginning of each simulation, while EC-DG and DG-CA3 connections (with static weights) are only formed prior to each new memory to be encoded during the simulation, to emulate structural plasticity Figure 1 on page 1.
Plasticity models
We have three classes of plasticity models in our study, namely short term plasticity [18], STDP plasticity for excitatory synapses and STDP plasticity for inhibitory synapses impinging on excitatory neurons [20]. All three are needed for successful encoding and retrieval [22]. There are three different types of excitatory plasticity in our study, namely pair STDP [15], triplet STDP [12], and unified plasticity, which is a simplified version of the plasticity model described in [22], which incorporates Hebbian, heterosynaptic and transmitter-induced plasticity mechanisms and was shown to reliably form memory engrams that can be retrieved with little interference.
In all network settings, the synaptic connections between EC-CA3 excitatory population and CA3-CA3 excitatory populations are plastic ( with different learning rates, using one of the three excitatory plasticity rules, plus short-term plasticity), the CA3 excitatory to CA3 inhibitory population synaptic connections are plastic (short-term plasticity) and the CA3 inhibitory to CA3 excitatory population synaptic connections are plastic (inhibitory plasticity).
The dynamics of short term plasticity together with the neuron dynamics are described in [22]; the other plasticity mechanisms are now described. The dynamics of pair STDP is described by:
whereby the time evolution of the pre-synaptic variable and postsynaptic variable are respectively described by and and are the learning rates. The dynamics of the triplet plasticity rule is described by:
whereby synaptic variables evolve as per synaptic variables described for paired STDP, are the learning rates and ensures that weight update is done prior to spike times. The unified plasticity model is described by:
whereby synaptic weight tends towards , and every pre-synaptic spike induces a small increase in synaptic weight. All synaptic variables and weight change amplitudes are as described earlier. The inhibitory plasticity is described by:
whereby is the depressing factor. The values for the different plasticity parameters are listed in Section Supplementary materials.
Simulation settings
Our simulations have two phases: the encoding phase and the retrieval phase. During the encoding phase, out of the DG neurons are selected to receive output spikes from , or randomly selected EC neurons which are stimulated as a new memory to be encoded. In the non-neurogenesis setting, to simulate the case whereby the stimulus can be encoded by any mature DG neuron, these DG neurons are randomly selected. In the neurogenesis (NG) setting, in the beginning, to simulate the case whereby newborn DG neurons are solely responsible for encoding a new memory stimulus, the entire excitatory DG population is divided into blocks of , where each block is targeted by a new memory stimulus. In addition, under the neurogenesis setting, the newborn DG neurons are also more excitable [6, 2], which are simulated by decreasing the spiking threshold of the neurons targeted by the randomly selected EC neurons for the duration of the encoding phase of each stimulus (). More precisely, by “newborn neurons”, we are emulating the remaining newborn DG cells after NG and subsequent cell death of a fraction of these cells due to inactivity.
When all the available blocks of DG neurons have been assigned (e.g. after stimuli, requiring DG neurons), we “recycle” the DG neurons, under the assumption of “turnover homeostasis”, whereby the rate of neuron birth and death is relatively balanced [10], hence maintaining the network size of the DG population. For each new stimulus to be encoded henceforth, out of the DG neurons are randomly selected. The synaptic weights of incoming (from EC) and outgoing (to CA3) connections are then set to (simulating neural death) in the neurogenesis case, but retained in the non-neurogenesis case. In the NG case, the spiking threshold is again lowered to emulate greater excitability. These DG neurons are then used to encode the new stimulus from a group of randomly selected EC neurons. We have simulated up to a total of memories.
To represent a memory in the EC, , or out of the EC neurons (these numbers are chosen for completeness in simulation settings) are randomly selected at the start of each encoding phase to receive a memory stimulus. They are then connected to the selected DG neurons. The selected DG neurons are then randomly connected to a cluster of CA3 excitatory neurons ,which emulate the memory engram “selected” after memory encoding in the CA3 has stabilized, akin to the DG neurons selected per memory. The randomly selected EC neurons are then stimulated with spikes each over a duration of . Spiking activities would then cascade down to the CA3 region via the EC-CA3 pathway and the newly formed EC-DG-CA3 pathway. The encoding phase involves stimulating the network with up to memory stimuli, each lasting for ( of stimulation, then letting the network activity settle for another ).
After all stimuli have been encoded, they are then retrieved in chronological order. The retrieval process is very similar to encoding (e.g. same set of , or EC neurons for each memory is stimulated in the same way), except that during retrieval, only the EC-CA3 pathway is active, while the EC-DG-CA3 pathway is inactive (synaptic weight set to ), a phenomenon observed biologically and common in models [3, 21, 8].
In all, there are two aspects in which different simulation settings are investigated and vary, namely 1) the different excitatory plasticity models (pair STDP, triplet STDP, unified plasticity), and 2) how DG neurons are selected to encode memories (with or without neurogenesis).
The network is simulated with a range of different learning rates on the two excitatory plastic connections: EC-CA3 (feed-forward, FF) and CA3-CA3 (recurrent, REC), so as to investigate the robustness of the results. Network parameters are given in Section Supplementary materials. All simulations are done on the NEST simulator [7].
Measures: Signal-to-Noise Ratio (SNR)
After a simulation with for instance memories to be encoded and retrieved, we next proceed to analyze the quality of the retrieved memory engrams in the CA3. To quantify how well each encoded memory is retrieved, a signal-to-noise ratio () measure is devised. For each simulation, we know precisely when the stimulus for each memory to be encoded is introduced into the network. Likewise for the stimulus to retrieve an encoded memory. We also know which set of CA3 excitatory neurons are stimulated during encoding in the time window of , which we denote as . For each memory retrieval, we systematically vary the size of the set of retrieved CA3 excitatory neurons by scanning through a range of spike counts, and compute its corresponding (see 1) for each retrieval. After this has been done for all memory retrievals, we pick the maximum , based on a single value for spike count for CA3 excitatory neurons across all retrievals, and note down the mean size of across all retrievals.
,
If ,
else,
The is normalized to an interval of , since it is only in the extreme cases (such as network spiking activities are highly synchronized and persistent due to high learning rates in the REC plasticity) that , given that the network is in a fluctuation driven regime with low firing rate of . Hence the is unlikely to go below , as confirmed by our data collected. Therefore, a score of most likely means that , a score of must mean that , and a score of must mean that , whereby there are as many signal neurons as there are noise neurons in (i.e. retrieval is as good as random), one special case being .
Results
In this section, we first present results for the comparison of all plasticity rules using single memory encoding and retrieval within a certain parameter range of feedforward and recurrent plasticity learning rates, and show that the unified plasticity model has the best retrieval results consistently. After which, using only the full plasticity model, we further justify that the range of learning rates can be narrowed down, and switched from a linear to logarithmic scale based on simulation results of memory encoding and retrieval of stimuli. Third, using stimuli (hence fully utilizing the entire dentate gyrus population), we explore the full parameter space (of different learning rates, number of EC neurons per stimulus, with and without NG) and determine the parameters that give the best . In particular we investigate under what parameter space does neurogenesis enables better memory retrieval compared to without neurogenesis. Fourth, as the results in the third set of simulations are not perfect (i.e. ), we investigate the sources of noise in the network, and study how each of them affects memory retrieval. In all, noise sources are identified and their effect on memory retrieval are systematically investigated. Finally, using learning rates with the best (for both FF plasticity only, and FF+REC plasticity; and EC neurons per stimulus) from the third set of simulations, we investigate how the network would perform for memory retrieval of up to memories ( times overloading of the dentate gyrus). Retrieval of memories is also conducted using only partial retrieval such that only a fraction of the encoding EC neurons are stimulated during retrieval. For comparison, the same set of simulations are re-run but without NG. The purpose of the above simulations is to investigate whether NG improves results, and how it interacts with FF and REC plasticity. For large number of memories (), we show that NG enables the retrieval of recent memories while without NG, memory retrieval is as good as random. We further investigate the underlying mechanisms behind this observation. The results presented below are for the case with NG unless otherwise stated.
Comparison of plasticity models
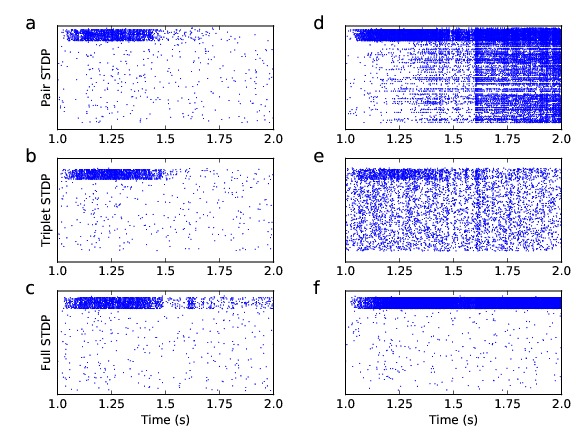
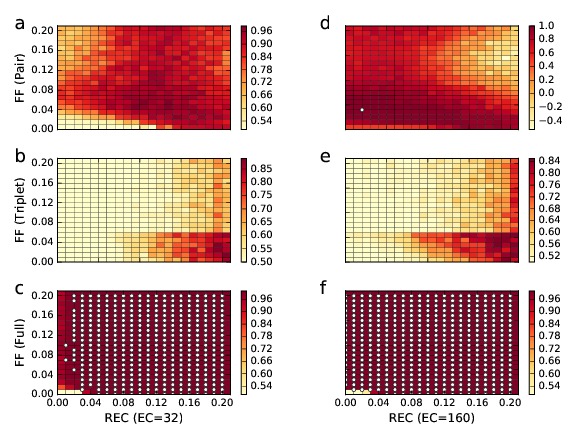
In this first set of simulations, we investigate across a set of parameters (number of EC neurons per stimulus, with and without NG, range of FF and REC learning rates), how the different plasticity models compare using as a metric. We use a range of learning rates, from to , with an interval of . From Figure 2 on page 2, we observe that the full plasticity model, at low learning rates and EC neurons per stimulus, is able to trigger sufficient spiking activities during retrieval (Figure 2 on page 2c), as opposed to the other plasticity models (Figure 2 on page 2a,b). At higher learning rates and EC neurons per stimulus, the pair and triplet plasticity models are also able to retrieve the memory encoded to some extent but in the process generate considerable amount of background noise such that their suffer (see Figure 2 on page 2d,e). On the other hand, the full plasticity model is able to retrieve the encoded memory without generating much background noise (see Figure 2 on page 2f). This demonstrates how the homeostatic terms in the model operate on a similar time-scale as the STDP terms and help to balance network activities. However, spiking activities from memory encoding last beyond the usual time window of and continue into the retrieval time window. Hence, from this set of simulations with different plasticity models, we confirm that the full plasticity models outperform the other models in memory encoding and retrieval across a broad range of parameters (Figure 3 on page 3), but persistent activities at high learning rates (present in all plasticity models) can become a problem for simulation with multiple memories. We investigate this in the next set of simulations using stimuli, whilst using the same parameters. All subsequent simulations are performed using the full plasticity model.
Defining parameter space for learning rates
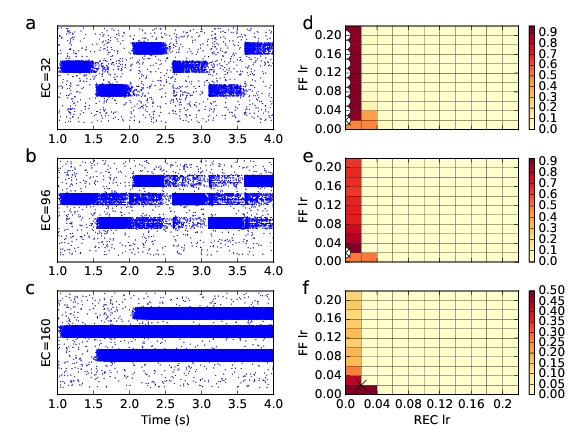
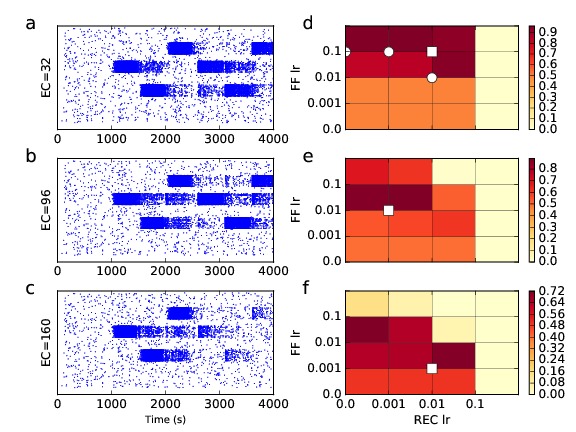
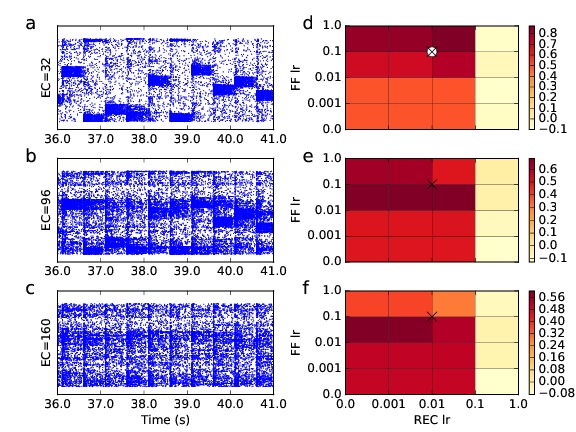
Here, by increasing the number of stimuli to , we further investigate how the full plasticity model would perform given the same set of parameters as in Comparison of plasticity models. As observed, in the case of EC neurons per stimulus, retrieval of memories encoded achieves good (see Figure 4 on page 4a,d) for the case of FF plasticity only. When REC plasticity is included, spiking activities from memory encoding phase persist into the retrieval phase, adversely affecting the (see Figure 4 on page 4b,c). This observation can also be made in the colormaps for the learning rates under all EC population sizes . The space of FF learning rates with better retrieval is larger in the case of EC neurons per stimulus as compared to larger ( and ) number of EC neurons per stimulus (see Figure 4 on page 4d-f). This is mainly due to the fact that with more EC neurons per stimulus, there are more FF synaptic connections on the EC-CA3 pathway potentiated which increase overall excitation of the CA3 population, leading to poorer overall. REC plasticity under all EC population sizes lead to persistent spiking activities of encoding CA3 neurons. Hence, scanning over the results in the current range of learning rates (lr), we observe that using a logarithmic scale for the learning rates () and with a smaller range, is sufficient and capture learning rates that give better , as show by the raster plots in Figure 5 on page 5a-c, and colormaps in Figure 5 on page 5d-f. We further observe that for high REC , spiking activities in the encoding phase persist into the retrieval phase for all EC sizes (Figure 5 on page 5d-f), regardless of FF learning rates. This also happens for high FF , when the EC size per stimulus is (Figure 5 on page 5c,f), regardless of REC learning rates. To discover what the optimal set of parameters are for memory encoding and retrieval, we repeat the above simulations using stimuli (fully utilizing the whole DG network), with both FF and REC .
Determining the best parameters
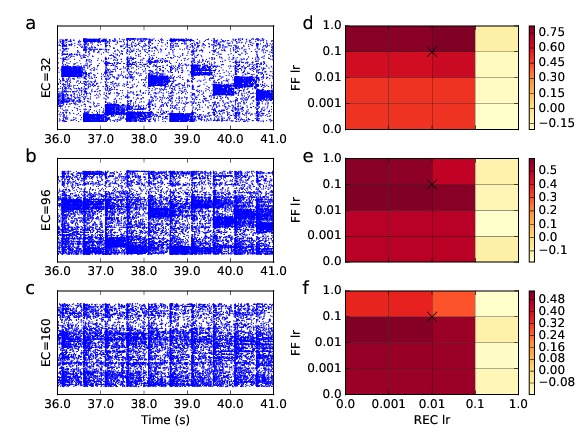
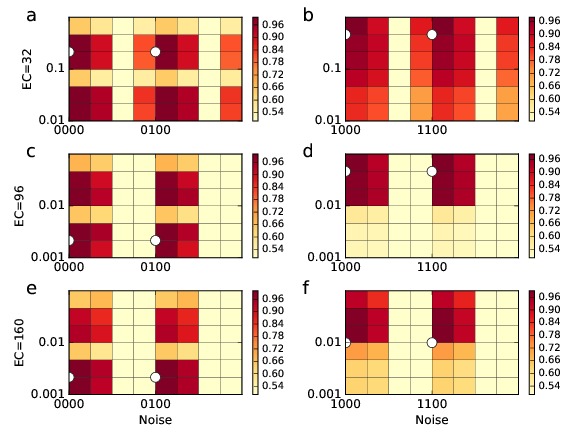
In this set of simulations, the learning rates used are . As shown in Figure 6 on page 6a-c, increased number of EC neurons per stimulus not only increase background activities, but is also more prone to triggering spiking activities in other CA3 memory engrams. This is because the EC neurons are randomly picked and maybe involved in several memory encoding. Hence, during retrieval, the increased overlap of EC neurons across memories would also trigger spiking activities in the other memory engrams in CA3. The also deteriorate with the number of stimuli (compare and stimuli). The colormaps for the different number of EC neurons with NG are shown in Figure 6 on page 6d-f. The corresponding figure for simulation settings without neurogenesis is shown in Figure 7 on page 7. We further notice that memory retrieval is consistently better for the case of NG than without and that memory retrieval is better for less EC neurons (compare Figure 6 on page 6 and Figure 7 on page 7, see also Table 1 on page 1). For the case of EC neurons per stimulus, FF and REC plasticity give better than just FF alone. But these two modes of plasticity give similar results for more EC neurons per stimulus. While previously, with EC neurons, both signal and noise neurons are more numerous in the FF+REC case than the FF case (with proportionally more signal neurons), resulting in a higher , this effect is drowned out by the increased background noise ( and EC neurons per stimulus, see Table 1 on page 1) whereby the maximal for higher number of EC neurons is obtained at higher spike count. We further note that lower learning rates give the maximum for more EC neurons. We have also run further simulations such that 1) FF learning rate and REC learning rate and 2) FF learning rate and REC learning rate (not shown). Both set of simulation do not yield better than those above. In particular, for the second set of simulations, whereby FF learning rate , persistent spiking activities such as those in Figure 4 on page 4b occur at large REC learning rates, effectively drowning out spiking activities of retrieved memories. The learning rates (both FF and FF+REC) for maximum are later used for simulations of up to stimuli (those in red in Table 1 on page 1), loading the DG up to its designated capacity.
| With NG | Without NG | |||||||||||
|---|---|---|---|---|---|---|---|---|---|---|---|---|
| FF | FF+REC | FF | FF+REC | |||||||||
| * | ||||||||||||
Effect of noise on SNR
In the original network setup, there are main sources of noise, namely,
-
1.
DG and CA3 (both excitatory and inhibitory) networks receive both Poisson synaptic inputs and current input so as to be in the fluctuation driven regime, with a mean firing rate of when idle (Input noise)
-
2.
DG neurons have a spiking threshold of when not encoding new memories; hence they may still spike, introducing noise into the network (DG noise)
-
3.
EC neurons are randomly selected to encode each new memory; hence one EC neuron may be involved in more than one memory. During retrieval, they may then trigger several memory engrams in the CA3 (EC noise)
-
4.
CA3 neurons are randomly selected to encode each new memory. Hence, they may also overlap with previously encoded memories. During retrieval of a memory engram, it may trigger spiking activities in another overlapping memory engram (CA3 noise)
To investigate the effect of the above noise on the , we systematically switch them off, by
-
1.
Not introducing Poisson and current inputs into the network
-
2.
Setting DG neurons spiking threshold to when not encoding memories
-
3.
Modifying size of the EC network to , such that all memories use a new block of EC neurons respectively
-
4.
Changing the size of each memory engram in the CA3 to neurons, and using each such block for encoding a new memory without overlap
There are therefore in total () different noise settings. We run simulations of memories, for EC neurons per stimulus, with NG and and . To illustrate the effect of these different noise, we show only the raster plot and corresponding colormap for the case of EC neurons per stimulus,
- •
- •
- •
- •
DG noise has the least effect on the ; hence it is not shown. For all levels of noise, REC plasticity always enhances the .
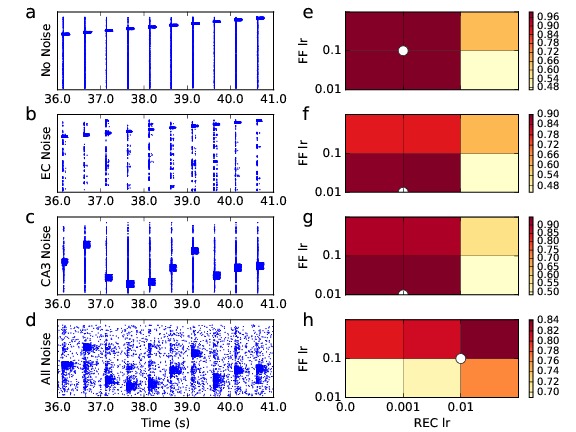
A summary of the results are shown in Figure 9 on page 9. We observe that good is obtained when all sources of noise are present only for the case of EC neurons (Figure 9 on page 9b,d,f). In the case whereby EC neurons per stimulus , we note that perfect retrieval () is obtained for the case of EC neurons per stimulus, and , and without noise source and (Figure 9 on page 9e). DG threshold ( or ) when not encoding memories does not matter. We further note that when the network is in the fluctuating regime (with input noise) and with more EC neurons per stimulus (), good is obtained with a higher (), as shown by 9d,f. Other than for 9f, the best for all other simulation settings is obtained when is non-zero. Hence, in contrast to results summarized in 1, for all EC sizes, when there is no noise in the network, FF+REC plasticity give better retrieval results than just FF plasticity alone, i.e. pattern completion. This clearly illustrates that in the noisy network (all noises present), the noise is amplified by the REC plasticity, and with larger EC sizes ( and ), the increased network noise cancels out the pattern completion effect of REC plasticity, resulting in on par with FF plasticity alone.
Robustness of results in DG overloading
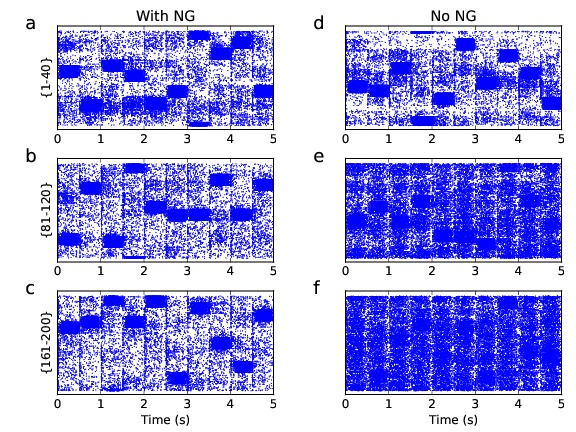
For this set of simulations, we select simulation settings in Table 1 on page 1 with red color font for overloading (with NG). Firstly, we tried simulations each with , , or numbers of stimuli and then retrieved the last encoded memories for each simulation. Next, we tried encoding memories and then retrieved them in batches of memories each: . Third, the second set of simulations are repeated with partial retrieval such that only , or of encoding EC neurons are stimulated during retrieval. In general, the observations made agree with those summarized in Table 1 on page 1. The results described below are for the case whereby there are EC neurons per stimulus, and , which gives the best . In the first simulations, more memories encoded result in poorer retrieval. For example, the for retrieving the last memories for , , and numbers of stimuli are respectively , , and . The for the retrieved memory batches in the second simulations () are respectively , , , and (Figure 10 on page 10a-c). Hence, older memories are “forgotten”. The for the third set of simulations (partial retrieval of encoded memories ) are respectively , and for , and of encoding EC neurons stimulated during retrieval. Hence, with only of EC neurons activated during retrieval, the retrieval results are comparable ( and ). The for the partial retrieval of encoded memories are respectively , and for , and of encoding EC neurons stimulated during retrieval. Hence, partial retrieval can be achieved but only for the more recent memories. In the above simulations, stimulating EC neurons give better results compared to EC neurons, and FF+REC plasticity perform better than just FF plasticity alone.
The above results are for the case of NG (reduced spiking threshold for encoding DG neurons during stimulation and randomly selected DG neurons are recycled, i.e. previous synaptic connections are set to , after the DG network is fully utilized). In the case of without neurogenesis (spiking threshold for encoding DG neurons remained the same and selected DG neurons keep their previous synaptic connections), the second set of simulations are repeated. The results for the case where there are EC neurons per stimulus, and , and memory batches are respectively (Figure 10 on page 10d-f). Without neurogenesis, as expected, DG neurons are involved in encoding of many more memories, and low is evenly spread across all stimuli, but with slightly better in retrieval of earlier batches, a trend different from the case of NG. We have also repeated the retrieval of the last encoded memories () in the second set of simulation for both with and without NG with a interval between encoding and retrieval. The are respectively also and , same as those without the interval.

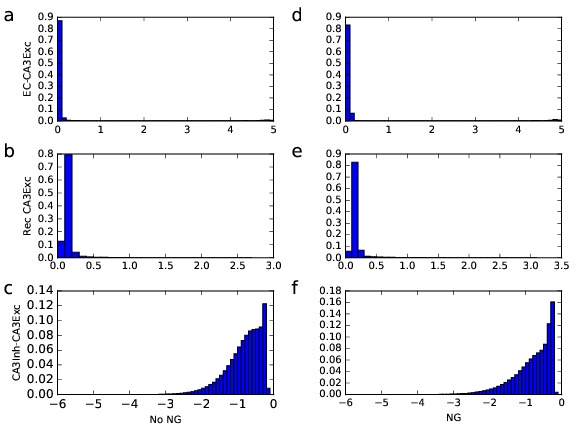
To investigate why memory retrieval for large number of memories are so different for the case of with and without neurogenesis, we look at the sums of weights of the different incoming synaptic connections in the CA3 excitatory population after encoding of Figure 11 on page 11 and Figure 12 on page 12 memories respectively. Firstly, we observe that there are more clusters of large sums of CA3 excitatory synapses in the case of NG than without for both after (Figure 11 on page 11b,e) and (Figure 12 on page 12b,e) encoded memories. Next, we observe that sums of inhibitory connections have increased much more in the case of no NG (compare Figure 11 on page 11c and Figure 12 on page 12c) than when there is NG (compare Figure 11 on page 11f and Figure 12 on page 12f) from to encoded memories. This is due to the fact that when new memories are encoded in the no NG case, EC-DG and DG-CA3 excitatory synaptic connections are not set to when DG neurons are reused. Hence for each new memory to be encoded, in the no NG case, increasingly more CA3 excitatory neurons are activated, in contrast, about the same number of CA3 neurons are activated in the NG case during encoding of all memories (Figure 13 on page 13). This leads to a much larger increase of noisy inputs in the CA3 excitatory population (compared to the case with NG), which must be counter-balanced by a larger increase in CA3 inhibitory connections so as to keep the CA3 populations stable. This large increase in network inhibition plays an active role in abolishing earlier encoded memories. This more active recruitment of inhibitory plasticity in the CA3 networks (in the no NG case) also leads to decrease in recurrent excitation (Figure 12 on page 12b). We further note that overall, for the CA3 population with NG, there is a bigger increase in the excitatory connections (EC-CA3 excitatory and CA3 excitatory-CA3 excitatory), than without NG, as more memories are encoded (from to memories, compare Figure 11 on page 11a,b,d,e and Figure 12 on page 12a,b,d,e). The above observations made using the colormaps agree with the synaptic weight histograms in Section Supplementary materials.
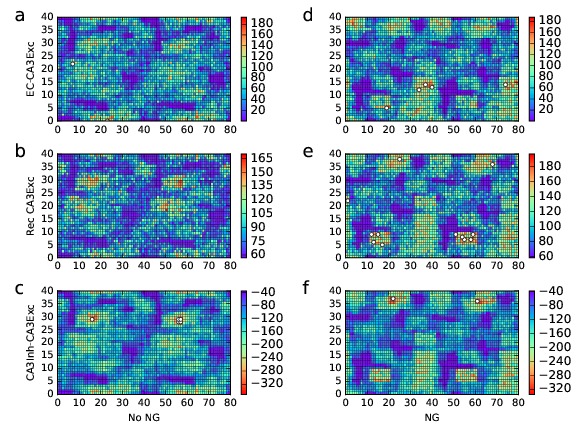

Hence, the above observations illustrate that, in the case of no NG, while the different plasticity mechanisms are able to maintain the stability of the network (a global network property), with more CA3 excitatory neurons activated with each new memory to be encoded, inhibitory plasticity loses its specificity. This results in the abolition of memories encoded in earlier batches. The “forgetting” observed in the NG and no NG cases are however due to different mechanisms. In the NG case, it is a direct consequence of deletion of connections. In the no NG case, it is due to increased inhibition. These could perhaps help to explain the different trends in the for the different batches.
Discussion
Using the network and simulation settings as described in Methods, we first investigate how the different models of plasticity perform under a wide range of parameters. Next, using the selected plasticity model (full plasticity model), we increase the number of memories encoded to , and as a result, arrive at a narrower range (logarithmic scale) of learning rates. Third, we further increase the number of memories to , so as to fully utilize the DG, and from the simulations performed, show that for all learning rates ( and ) and number of EC neurons per stimulus (), memory retrieval is better when there is NG. Also, for the case when there are EC neurons per stimulus, REC plasticity enhances the , as compare to just FF plasticity, illustrating the importance of REC plasticity for pattern completion. However, when the network has more noise (for instance, when number of EC neurons per stimulus ), REC plasticity leads to co-activation of overlapping memory engrams in the CA3, adversely affecting the , resulting in poorer retrieval results compared to just FF plasticity alone. This is further shown in the fourth set of simulations whereby FF+REC plasticity result in better retrieval for the case of EC neurons per stimulus when there is no noise in the network, as compared to just FF plasticity alone. There is therefore a fine balance between when recurrent plasticity plays an enhancing or diminishing role in memory retrieval. Finally, we perform simulations whereby up to memories are encoded and then retrieved. We show that with memories, NG enables the retrieval of the most recent set of encoded memories, while without NG, the signal strength of retrieved memories is roughly that of background noise (). This is mainly due to the fact that without NG, each new stimulus will excite ever more excitatory CA3 neurons, which in turn will result in increased inhibitory plasticity so as to maintain network stability, which effectively erases the memory encoded (even most recent ones). While with NG, each stimulus will excite about the same number of excitatory CA3 neurons as previous stimuli, and in turn, result in a more targeted (and less) increment in inhibitory plasticity, which helps to preserve the more recent stimuli encoded. Through NG, however, older memories encoded are erased through deletion of EC-DG and DG-CA3 connections.
Hence in our model, neurogenesis provides the structural plasticity (creation and deletion of connections) required for encoding and retrieval of memories when the network is overloaded. Synaptic plasticity, on its own, does not seem to be sufficient. Even if the EC-DG and DG-CA3 pathways have been plastic, the old connections would only potentiate with each new encoding memory, and more CA3 neurons would still spike with each new memory, as shown in the above simulations without neurogenesis. Specificity of memory engrams is thus lost in the process. In addition, to maintain network stability, inhibitory plasticity, operating on the same time-scale (necessarily so), effectively suppresses network activities, and any memory engram that may have formed is erased.
From our simulations, memory retrieval for up to encoded stimuli is achieved even when the plasticity is kept on during the retrieval phase, despite using a simplified version of the plasticity models in [22]. Retrieval is also shown to work equally well when there is an interval of between encoding and retrieval. For the case of both FF+REC plasticity, memory engrams formed using both the EC-CA3 pathways and REC CA3 connections. This gives better than just FF plasticity alone, while there is less network noise. Hence plastic recurrent connection plays a role in pattern completion (improving memory retrieval especially partial ones), but also amplifies the noise in the network (retrieving more than what is encoded); this warrants further studies. While REC plasticity alone may also encode memories, this occurs at high REC learning rates, whereby persistent spiking activities dominate the network. Hence, retrieved memory engrams are effectively drowned out by the persistent activities, leading to poor . The highly REC CA3 network hence operate best as an associative memory by sharing the task of encoding memory engrams between both the FF and REC synaptic connections, at a low noise level.
Memory retrieval deteriorates with increased encoded memories. This is primarily due to noise in the network, which can be attributed to main sources as shown in Effect of noise on SNR. For EC and CA3 noise, it is observed from Table 1 on page 1 how noise neurons are generally more in the FF+REC case as compared to just the FF case. We have systematically remove the above sources of noise in Effect of noise on SNR, which results in almost perfect retrieval with stimuli (no overloading). Such a setting is however biologically unrealistic as it would imply that there must be at least as many EC, DG and CA3 neurons as there are memories.
In reality, forgetting of older memories is natural. Also, spiking of other CA3 neurons other than those encoding the particular memory during retrieval may help to associate several related memories which maybe useful for downstream processing. Memories in the hippocampus are also further consolidated in the cortex, of which how they function as a complete system is still an active field of research. The model we have studied set up a framework for further extension in computational studies of the role of the hippocampus in memory encoding and retrieval.
Supplementary materials
| Short term plasticity | |
|---|---|
| probability of release | |
| Pair STDP | |
| Triplet STDP | |
| Full STDP | |
| Inhibitory plasticity | |
| EC (standalone neurons) | |
|---|---|
| neurons | AIF neurons |
| DG (standalone neurons) | |
| neurons | AIF neurons |
| Poisson excitatory input | |
| Poisson inhibitory input | |
| Current input | |
| synaptic weights | excitatory : , inhibitory : |
| CA3 excitatory (40*80 on topology layer) | |
| neurons | AIF neurons |
| Poisson excitatory input | |
| Poisson inhibitory input | |
| Current input | |
| synaptic weights | excitatory : , inhibitory : |
| CA3 inhibitory (20*40) on topology layer | |
| neurons | AIF neurons |
| Poisson excitatory input | |
| Poisson inhibitory input | |
| Current input | |
| synaptic weights | excitatory : , inhibitory : |
| CA3 network recurrent connections | |
| CA3 exc->CA3 exc | full plasticity; convergent (probability: |
| CA3 exc->CA3 inh | short term plasticity; convergent (probability: |
| CA3 inh->CA3 exc | inhibitory plasticity; convergent (probability: |
| CA3 inh->CA3 inh | static synapse; convergent (probability: |
| EC->CA3 exc connections | |
| EC->CA3 exc connections | full plasticity; divergent (fixed outdegree:, weight:, delay: |
| Encoding settings | |
| Stimulus | spikes with interval onto EC neurons, weight: |
| EC->DG connections | Convergent (fixed indegree:), weight: |
| DC->CA3 exc connections | Convergent (fixed indegree:), weight: |
| Retrieval settings | |
| Stimulus | spikes with interval onto EC neurons, weight: |
| EC->DG connections | Convergent (fixed indegree:), weight: |
| DC->CA3 exc connections | Convergent (fixed indegree:), weight: |

References
- Abbott and Nelson [2000] Abbott, L. F., and Nelson, S. B. 2000. Synaptic plasticity: taming the beast. 3(Supplement):1178–1183.
- Aimone, Wiles, and Gage [2009] Aimone, J. B.; Wiles, J.; and Gage, F. H. 2009. Computational influence of adult neurogenesis on memory encoding. Neuron 61(2):187–202.
- Becker, Macqueen, and Wojtowicz [2009] Becker, S.; Macqueen, G.; and Wojtowicz, J. M. 2009. Computational modeling and empirical studies of hippocampal neurogenesis-dependent memory: effects of interference, stress and depression. Brain Research 1299:45–54.
- Brijesh and Ravindran [2007] Brijesh, R., and Ravindran, G. 2007. A spiking neural network of the CA3 of the hippocampus can be a neural prosthesis for lost cognitive functions. Annual International Conference of the IEEE Engineering in Medicine and Biology Society 4755–4758.
- Chrol-Cannon and Jin [2015] Chrol-Cannon, J., and Jin, Y. 2015. Learning structure of sensory inputs with synaptic plasticity leads to interference. Frontiers in Computational Neuroscience 9:103.
- Finnegan and Becker [2015] Finnegan, R., and Becker, S. 2015. Neurogenesis paradoxically decreases both pattern separation and memory interference. Frontiers in Systems Neuroscience 9:136.
- Gewaltig, Morrison, and Plesser [2012] Gewaltig, M.; Morrison, A.; and Plesser, H. 2012. NEST by example: an introduction to the neural simulation tool NEST. Springer.
- Hasselmo and McGaughy [2004] Hasselmo, M., and McGaughy, J. 2004. High acetylcholine levels set circuit dynamics for attention and encoding and low acetylcholine levels set dynamics for consolidation. Prog Brain Res. 145:207–231.
- Kunkel, Diesmann, and Morrison [2011] Kunkel, S.; Diesmann, M.; and Morrison, A. 2011. Limits to the development of feed-forward structures in large recurrent neuronal networks. 4.
- Meltzer, Yabaluri, and Deisseroth [2005] Meltzer, L. A.; Yabaluri, R.; and Deisseroth, K. 2005. A role for circuit homeostasis in adult neurogenesis. Trends in Neurosciences 28(12):653–660.
- Moser, Kropff, and Moser [2008] Moser, E. I.; Kropff, E.; and Moser, M.-B. 2008. Place cells, grid cells, and the brain’s spatial representation system. Annu Rev Neurosci 31:69–89.
- Pfister and Gerstner [2006] Pfister, J.-P., and Gerstner, W. 2006. Triplets of spikes in a model of spike timing-dependent plasticity. 26:9673–9682.
- Rolls et al. [1997] Rolls, E. T.; Treves, A.; Foster, D.; and Perez-Vicente, C. 1997. Simulation studies of the CA3 hippocampal subfield modelled as an attractor neural network. Neural Networks 10(9):1559–1569.
- Rolls [1987] Rolls, E. T. 1987. Information representation, processing and storage in the brain: analysis at the single neuron level. The Neural and Molecular Bases of Learning 503–540.
- Song, Miller, and Abbott [2000] Song, S.; Miller, K. D.; and Abbott, L. F. 2000. Competitive Hebbian learning through spike-timing-dependent synaptic plasticity. 3(9):919–926.
- Squire [2009] Squire, L. R. 2009. Memory and brain systems: 1969–2009. J Neurosci 29(41):12711–6.
- Tan et al. [2013] Tan, C. H.; Tang, H.; Tan, K. C.; and Yuan, M. 2013. A hippocampus CA3 spiking neural network model for storage and retrieval of sequential memory. In 2013 IEEE Conference on Cybernetics and Intelligent Systems (CIS), 134–139. IEEE.
- Tsodyks, Uziel, and Markram [2000] Tsodyks, M.; Uziel, A.; and Markram, H. 2000. Synchrony generation in recurrent networks with frequency-dependent synapses. 20:RC1 (1–5).
- Tulving [2002] Tulving, E. 2002. Episodic memory: from mind to brain. Annu Rev Psychol 53(1):1–25.
- Vogels et al. [2011] Vogels, T.; Sprekeler, H.; Zenke, F.; Clopath, C.; and Gerstner, W. 2011. Inhibitory plasticity balances excitation and inhibition in sensory pathways and memory networks. Science 334(6062):1569–1573.
- Weisz and Argibay [2009] Weisz, V. I., and Argibay, P. F. 2009. A putative role for neurogenesis in neuro-computational terms: inferences from a hippocampal model. Cognition 112(2):229–240.
- Zenke, Agnes, and Gerstner [2015] Zenke, F.; Agnes, E. J.; and Gerstner, W. 2015. Diverse synaptic plasticity mechanisms orchestrated to form and retrieve memories in spiking neural networks. Nature Communications 6:6922.