The Intrinsic Far-infrared Continua of Type-1 Quasars
Abstract
The range of currently proposed active galactic nucleus (AGN) far-infrared templates results in uncertainties in retrieving host galaxy information from infrared observations and also undermines constraints on the outer part of the AGN torus. We discuss how to test and reconcile these templates. Physically, the fraction of the intrinsic AGN IR-processed luminosity compared with that from the central engine should be consistent with the dust-covering factor. In addition, besides reproducing the composite spectral energy distributions (SEDs) of quasars, a correct AGN IR template combined with an accurate library of star-forming galaxy templates should be able to reproduce the IR properties of the host galaxies, such as the luminosity-dependent SED shapes and aromatic feature strengths. We develop tests based on these expected behaviors and find that the shape of the AGN intrinsic far-IR emission drops off rapidly starting at and can be matched by an Elvis et al.-like template with a minor modification. Despite the variations in the near- to mid-IR bands, AGNs in quasars and Seyfert galaxies have remarkably similar intrinsic far-IR SEDs at -, suggesting a similar emission character of the outermost region of the circumnuclear torus. The variations of the intrinsic AGN IR SEDs among the type-1 quasar population can be explained by the changing relative strengths of four major dust components with similar characteristic temperatures, and there is evidence for compact AGN-heated dusty structures at sub-kiloparsec scales in the far-IR.
Subject headings:
galaxies:active — infrared:galaxies — quasars:general1. Introduction
The infrared (IR) emission of quasars opens an invaluable window to study the nature of the central active galactic nuclei (AGNs) as well as their host galaxies. It is now widely accepted that the AGN is powered by gas accretion onto the black hole and a substantial fraction of such accretion-released energy is absorbed by the surrounding dusty structures and re-emitted in the infrared (e.g., Rieke 1978; Neugebauer et al. 1986). In the past 30 years, with the launch and operation of each major space-based IR telescope, many papers have appeared with the goal of characterizing the IR spectral energy distributions (SEDs) of these systems, using data of improved quality and/or larger samples (e.g., Neugebauer et al. 1986; Sanders et al. 1989; Elvis et al. 1994 with the Infrared Astronomical Satellite in 1980s; e.g., Polletta et al. 2000; Haas et al. 2000, 2003; Alonso-Herrero et al. 2003 with the Infrared Space Observatory in 1990s; e.g., Richards et al. 2006; Polletta et al. 2007; Netzer et al. 2007; Shang et al. 2011; Mullaney et al. 2011; Mor & Netzer 2012 with the Spitzer Space Telescope in 2003-2009, e.g., Petric et al. 2015; García-González et al. 2016 with the Herschel Space Observatory in 2009-2013, and, e.g., Mor & Trakhtenbrot 2011; Petric et al. 2015 with the Wide-field Infrared Survey Explorer in the post-2010). Nonetheless, these intensive efforts have unexpectedly ended in significant disagreements about the appropriate template, especially for the far-IR (e.g., from 20 to 1000 m). This can be seen in Figure 1, where we provide a partial summary of the AGN empirical IR templates in the literature.
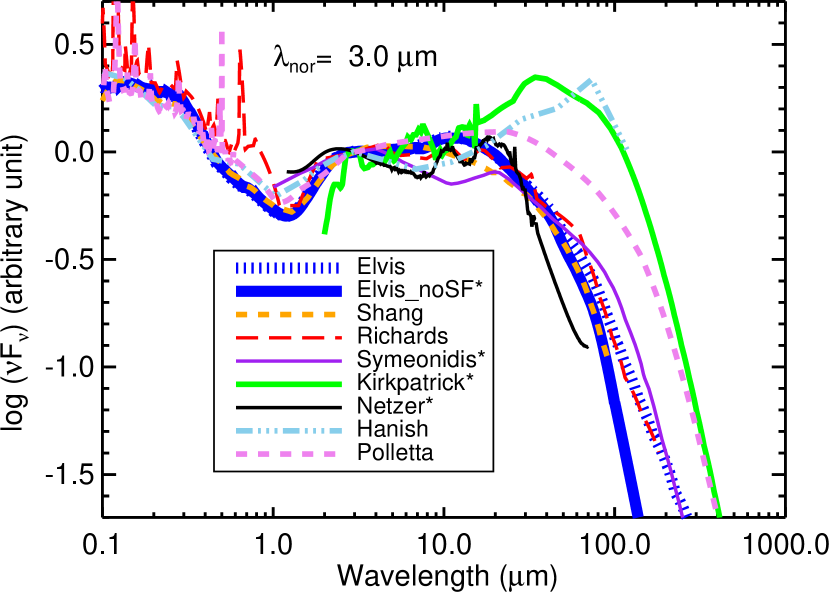
The possible different levels of contamination from the IR light emitted by the host galaxies could underlie the broad distribution of the far-IR SEDs among different templates. Several groups have attempted to remove this contamination from the AGN template (e.g., Netzer et al., 2007; Mullaney et al., 2011; Kirkpatrick et al., 2015; Xu et al., 2015; Symeonidis et al., 2016). However, there is still no consensus. These AGN “intrinsic” IR templates range from (1) the minimalist far-infrared output derived by Netzer et al. (2007) by subtracting a starburst-dominated ULIRG template from the average quasar IR SED under the assumption that the vast majority of the 50–100 emission is due to star formation, to (2) versions with substantially more far-infrared emission obtained, for example, by Kirkpatrick et al. (2015) who fitted the data with a combination of a galaxy mid-infrared spectrum, a power law in the same region for the AGN, and two black bodies at longer wavelengths. Most recently, based on a similar low- sample of optically selected bright quasars, Symeonidis et al. (2016) reported an “intrinsic” AGN IR template with more far-IR emission than that predicted by the classic quasar template from Elvis et al. (1994), where the latter did not even correct the contamination by host galaxy star formation.
The importance of identifying the correct far-IR behavior of AGNs cannot be overstated. As pointed out by Lutz (2014) and Netzer (2015), theoretical torus models have too much freedom to distribute dust in ways that may not reflect the real situations. In fact, given the wide range of observational results on AGN IR SEDs, no convincing observational tests can be made for these model templates in the far-IR. Determining which type of far-IR behavior is appropriate (or whether there is a broad range) will therefore have a direct impact on models of AGN tori, especially on their relation to the surrounding interstellar material. To measure the IR star formation rates (SFRs) of quasar host galaxies, a proper handling of the AGN far-IR contribution is critical. A number of papers have analyzed the quasar IR SEDs with a combination of the SED library from some torus model and templates/models for the host galaxies, and derived the host SFRs from the IR luminosities of the latter component (e.g., Delvecchio et al., 2014; Leipski et al., 2014; Dong & Wu, 2016; Netzer et al., 2016). However, since none of the torus models have been observationally well constrained in the far-IR, the accuracy of the SFR measurements is not always guaranteed, even if the fitting residuals are tiny. Recently, there have been concerns regarding whether the AGN contributes substantially to the heating of the surrounding interstellar medium (ISM; Schneider et al. 2015; Roebuck et al. 2016; Symeonidis 2017). The validity of such studies also rests on the knowledge of the complete SED of the intrinsic AGN IR emission.
As shown by our previous work (Lyu et al., 2017), it is clear that one single AGN IR template does not apply to all the type-1 quasar population (). Additionally, similar SED variations of the intrinsic AGN IR emission are seen among quasars from 0 to 6, suggesting that such behavior is common. Following that work, this paper examines the intrinsic far-IR SEDs of AGNs in detail with the focus mainly on the type-1 quasar population. Firstly, an energy balance argument is applied to test some proposed AGN SED templates in Section 2. Then we present an in-depth analysis of the far-IR emission of the Palomar–Green (PG) quasars based on the study of Lyu et al. (2017), clarify several issues regarding the derivation of a correct intrinsic AGN far-IR SED, and determine our preferred template in Section 3. In Section 4, we discuss whether the AGN far-IR intrinsic template based on quasars is applicable to other kinds of AGNs, as well as some implications for the obscuring structure from our results. A summary is given in Section 5. We provide the intrinsic templates for type-1 quasars in Appendix A.
2. Energy balance
2.1. Rationale
Luminous AGNs are believed to be powered by gas accretion onto the central supermassive black holes (Salpeter, 1964; Lynden-Bell, 1969; Shields, 1978). Various processes associated directly with such central engines dominate the X-ray to the optical far-red energy output of these systems. The continuum emission of the central engine should drop substantially at m as suggested from multiple theoretical studies (e.g., Kawaguchi et al., 2001; Cao, 2009; Liu et al., 2012) and confirmed by observations (Kishimoto et al., 2008). Under the precepts of AGN unification (e.g., Antonucci 1993; see the recent review by Netzer 2015), the central engine is surrounded by equatorial optically thick dusty structures that cause the nuclear photons to escape preferentially along the polar direction. Meanwhile, the energy of those “blocked” photons is absorbed by dust and reradiated into the near infrared to 10 m (and almost certainly beyond to at least 100 m) as a result of energy balance.
For a type-1 AGN viewed face-on, the SED crossover between the direct (intrinsic) emission from the accretion disk and the IR-processed emission by the dust obscuration is close to the spectral minimum at 1.3 . This basic hypothesis for the source emission was first suggested by SEDs (Rieke, 1978), then by detailed decomposition into spectral components demonstrating a reduction in the amplitude of the variability as one goes further into the infrared (Rieke & Lebofsky, 1981; Cutri et al., 1985; Neugebauer et al., 1989; Neugebauer & Matthews, 1999). It has been firmly established through reverberation mapping, which shows time lags in the infrared response to variations in the optical–ultraviolet output by roughly the time expected if the reradiating dust is at the distance from the nucleus where it is heated close to its sublimation temperature (e.g., Koshida et al., 2014; Gandhi et al., 2015; Lira et al., 2015; Pozo Nuñez et al., 2015; Schnülle et al., 2015).
If the infrared emission of quasars is reradiated energy absorbed from the central engine and accretion disk, a corollary is that the infrared luminosity must be less than that of the central source, or more accurately, less than the energy absorbed from the central source. The geometry of the torus is often estimated by comparing the energy emitted by the central engine at wavelengths 1.3 m with that emitted in the infrared, presuming that the central engine emits isotropically and that the infrared emission is dominated by energy absorbed in the torus. This approach is supported not only by the rapidly declining emission from the accretion disk going from the optical into the near-IR, but also by the low levels of absorption by silicate-rich interstellar dust in the red and near-IR (e.g., Corrales et al., 2016). Therefore, it is the optical blue, UV, and X-ray that are most effective in providing the energy input to the dust that obscures the nucleus. The portion of the total accretion disk emission that is reprocessed into the infrared is represented by the luminosity of the system between 1.3 and 1000 um, as seen in a type-1 AGN, that is . When the dust is optically thick, can be interpreted as the covering factor for the torus, . As discussed in Section 2.4, a more accurate way to interpret needs to take account of possible anisotropies in the accretion disk radiation and of radiative transfer in the torus (e.g., Runnoe et al., 2013; Stalevski et al., 2016).
As will be shown below, a number of recently proposed AGN SED templates with strong far-IR emission fail the requirements of energy balance between the accretion disk and the infrared luminosity.
2.2. Template for AGN Soft X-Ray/UV/Optical Emission
Since Elvis et al. (1994) published their SED template for unobscured type-1 (broad-line) quasars, there have been multiple studies that have confirmed the uncanny accuracy of this work (e.g., Richards et al., 2006; Shang et al., 2011; Runnoe et al., 2012; Hanish et al., 2013; Scott & Stewart, 2014; Lyu et al., 2017). As a result, we can take the intrinsic SED of a type-1 quasar to be well-understood from the soft X-ray to 10 m. Lusso et al. (2013) show that the torus is probably optically thin to X-rays more energetic than 1 keV, so they should not be included in this energy budget argument. Consequently, we can avoid concerns that the Elvis template may be biased toward being X-ray bright (Marconi et al., 2004).
The properties of AGNs show possible trends in SED behaviors from the most luminous quasars to the much less luminous low-ionization nuclear emission-line region (LINERs) galaxies (Ho, 1999, 2008). However, the Elvis et al. (1994) template has been developed on quasars with and all the following templates are also based on AGN samples with similar luminosity ranges. Thus, we adopt the Elvis et al. (1994) template to represent the accretion disk emission where some other template does not cover the soft X-ray to optical bands.
2.3. Energy Budget Calculations
Table 1 summarizes the sample properties, approaches to synthesize template SEDs, and calculations of the energy budgets for the proposed AGN templates listed below. Nearly every template needs some adjustment or extension for these energy budget determinations. Because the luminosity is a free parameter, we have normalized the results so the luminosity between 1.3 m and 1 keV is set to 1. As a result, the tabulated infrared luminosities indicate directly the reradiated fraction of the emission of the central engine.
| Template | Range | Sample Characteristics | Stack Method | SF Cor.? | Correction Base | ||
|---|---|---|---|---|---|---|---|
| (1) | (2) | (3) | (4) | (5) | (6) | (7) | (8) |
| Elvis | X-ray to Radio | optical-blue, X-ray bright quasars | 29 | Kaplan–Meier Mean, | N | – | 0.55 |
| Elvis_noSF | X-ray to Radio | optical-blue, X-ray bright quasars | 29 | Kaplan-Meier Mean, | Y | relation between 11.3 aromatic features and the IR 50-25 flux ratio of both quasars and SFGs | 0.53 |
| Richards | X-ray to Radio | mid-IR and optical color-selected quasars | 259 | Gap repair, luminosity matched | N | – | 0.65 |
| Shang | X-ray to Radio | UV/optical bright quasars | 27 | Median Mean, | N | – | 0.64 |
| Symeonidis | 0.4-500 | radio-quiet PG quasars | 47 | Arithmetic Mean, | Y | Matching the 11.3 aromatic feature-derived SFR with the SFG templates IR luminosity | 0.56 |
| Kirkpatrick AGN1 | 2-1000 | 0.80 (U)LIRGs w/ AGN dominated (100%) mid-IR spectra | 22 | Median Mean, normalized by the 5-15 luminosity | Y | Decomposition of the mid-IR spectra | 0.70-0.78 |
| Kirkpatrick AGN2 | 2-1000 | 1.03 (U)LIRGs w/ AGN dominated (93%) mid-IR spectra | 23 | Median Mean, normalized by the 5-15 luminosity | Y | Decomposition of the mid-IR spectra | 1.12-1.02 |
| Kirkpatrick AGN3 | 2-1000 | 1.65 (U)LIRGs w/ AGN dominated (94%) mid-IR spectra | 21 | Median Mean, normalized by the 5-15 luminosity | Y | Decomposition of the mid-IR spectra | 0.80-0.85 |
| Kirkpatrick AGN4 | 2-1000 | 1.96 (U)LIRGs w/ AGN dominated (93%) mid-IR spectra | 31 | Median Mean, normalized by the 5-15 luminosity | Y | Decomposition of the mid-IR spectra | 1.34-1.26 |
| Netzer | 1.2-70 | PG quasars, missing very high-luminosity objects | 29 | Arithmetic Mean, | Y | Assuming the 50-100 emission of the IR-weak and IR-strong quasar template is due to star formation | 0.46 |
| Hanish | 0.1-100 | SDSS spectroscopically selected quasars without strong optical reddening | 301 | Median Mean, normalized by the 0.2-1.0 luminosity | N | – | 0.91 |
| Polletta QSO1 | X-ray to mid-IR | Optically selected, spectroscopically confirmed type-1 quasars from SDSS | 35 | Mean weighted by luminosity, | N | – | 0.74 |
Note. — Column (4): the size of the sample from which the template was derived; Column (8): IR-processed light fraction of the template. . We calculate the 1 keV–1.25 luminosity of the AGN template as and the 1.25–1000 luminosity as . For the Kirkpatrick templates, we show the results for normalizing to the Elvis template between 2 and 10 m and then at 12 m.
Elvis et al. (1994): the procedure is most straightforward in the case of the Elvis et al. (1994) template. Table 1 shows two results, the first for the original form and the second for the star-formation-removed version from Xu et al. (2015).
Richards et al. (2006): it was necessary to fill out this template for frequencies log() above 17 and below 12.5; this was done by joining on sections of the original Elvis template.
Shang et al. (2011): this work updated the Elvis et al. (1994) SED with data from HST, FUSE, Spitzer, Chandra, and XMM. The silicate emission features in the mid-IR were reproduced thanks to the spectral data from Spitzer/IRS. Although the Elvis et al. (1994) SED was based on IRAS far-IR data with many upper limits, these two SED templates agreed remarkably well in the far-IR. There is no need to adjust this template.
Symeonidis et al. (2016): this template was completed for wavelengths short of 0.4 m by joining on an original Elvis template. The far-infrared behavior is similar to that of the Polletta template, but the lower fraction of reradiated luminosity results because the template is relatively bright in the 0.3–1.3 m range (see Figure 1).
Kirkpatrick et al. (2015): these templates were built according to the dominance of the AGN continuum contribution in mid-IR spectra from a study of 343 (ultra)luminous infrared galaxies at =0.3–2.8, without constraints on the AGN types. Since the Kirkpatrick templates are only given for 2–1000 m, to estimate the strength of the intrinsic disk accretion emission, we need to combine them with the Elvis template at shorter wavelengths with proper scalings. To do so, we forced the total luminosity between 2 and 10 m to be the same, and then added the Elvis template luminosity between 1.3 and 2 m to the reradiated total for the Kirkpatrick et al. (2015) template. Their sample probably includes some fraction of obscured or type-2 AGNs. Under the unified theory of AGNs, we expect these objects to have identical intrinsic X-ray/UV/optical and infrared reradiated SEDs to type-1 objects. However, if they have strong mid-infrared extinction, the normalization at 2–10 m could underestimate the nuclear emission. Nevertheless, considering the lack of strong silicate absorption features in the Kirkpatrick AGN templates, such extinction is unlikely to be significant (e.g., Shi et al., 2006; Hatziminaoglou et al., 2015). In addition, the rough agreement of the continuum in these templates with the Elvis one between 2 and 10 supports the normalization we have adopted to obtain an estimate of the X-ray/UV/optical luminoisty. Finally, it is believed that the Kirkpatrick templates may have a significant contamination from star formation in the host galaxy (see the AGN template in their Figure 13). We therefore subtracted their star forming template SFG2 until the long wavelength cutoff of the remaining SED fell similarly to the Elvis template, i.e., we attributed as much as possible of the far-infrared flux to star formation (see Figure 1 for an illustration). The maximal nature of this adjustment is clear since it made the resulting AGN-only template go negative at wavelengths longer than 400 m. The two other star forming templates in Kirkpatrick et al. (2015) are very similar in the far-infrared and using one of them would not have yielded any significant differences.
Netzer et al. (2007): since this template does not remove host galaxy emission in the near-IR, we replace it with the Elvis template at , where no spectral features exist and the host galaxy contamination is negligible. We also believe the SED rise starting at is non-physical, so we completed the template with a Rayleigh–Jeans tail with a wavelength-dependent emissivity proportional to at .
Hanish et al. (2013): the template was completed for wavelengths shorter than 0.1 m and longer than 120 m by joining on segments of the original Elvis template. The possibility of the far-infrared peak in the template arising through star formation is mentioned by the authors, but there has been no attempt to correct for it. It is therefore not surprising that there might be a significant far-infrared component not associated with the central engine.
Polletta et al. (2007): this template was completed for wavelengths short of 0.1 m with the Elvis template. There is no explicit step in the assembly of the Polletta templates to remove a star-formation-powered component in the far-infrared, so it would not be surprising if there is a significant one.
2.4. Analysis and Results
Assuming the standard AGN unification point of view that type-2 AGNs are the same as type-1 AGNs but obscured by dust, a dust-covering factor can be obtained from the relative fraction of type-2 (obscured) to type-1 (unobscured) objects. Schmitt et al. (2001) found that 70% of their far-IR-selected sample of 88 Seyfert galaxies are obscured. Since this sample is IR-selected, this value is probably biased high. Based on the optical spectra of SDSS galaxies, Hao et al. (2005) show that Seyfert 1 and Seyfert 2 galaxies have comparable numbers at low luminosity, while Seyfert 1 galaxies outnumber Seyfert 2 galaxies by a factor of two to four at high luminosity. Reyes et al. (2008) reported a type-2 quasar fraction in the SDSS sample within the range of 0.5–0.6. Considering the decreasing dust-covering factor with increasing AGN luminosity as first noted by Lawrence (1991) and confirmed by later works (e.g., Maiolino et al. 2007), plus the discussion in Stalevski et al. (2016), we adopt 0.65 as an upper limit for the dust-covering factor () in luminous AGNs.
Comparison of the value of the dust-covering factor with the ratio of the AGN infrared to optical–UV–X-ray luminosities is not straightforward because of anisotropies in the radiation field of the central engine. Stalevski et al. (2016) computed a grid of SEDs emitted by the dusty structures and studied how the relation between the covering fraction and the reradiated luminosity changes with different parameter values for the torus. When the accretion disk and the obscuring torus both emit isotropically, the IR-processed light fraction is a perfect proxy for the dust-covering factor with a one-to-one relation between these two quantities. In the more realistic case of anisotropic accretion disk emission and a torus that is optically thick in the mid-IR, their simulations suggest that these two quantities are in agreement at 0.65. They also provide polynomial fits to allow estimation of the expected values away from 0.65. Although somewhat bright in the mid-infrared and faint in the far-infrared, the Stalevski et al. (2016) model SEDs still match reasonably well relative to the Elvis et al. (1994)-like observational AGN template, suggesting their results are appropriate for our study. We have compared with the model results for of 3–10 since the resulting SEDs roughly match the templates. The corresponding upper limit to the ratio of reradiated to central engine luminosity (a.k.a. ) is then 0.75.
The templates from Elvis et al. (1994), Symeonidis et al. (2016), and Netzer et al. (2007) satisfy the upper limit for energy balance between the output of the central engine and the luminosity reradiated in the infrared. It appears that the quasar templates by Hanish et al. (2013) contain too much far-IR emission, possibly due to the contamination from the host galaxy star formation. The Polletta et al. (2007) template is also only marginally consistent with this constraint. Although the exact values of the IR-processed light fractions of the Kirkpatrick et al. (2015) templates have relatively large uncertainties, they are still more luminous in the infrared than expected. Consequently, from the perspective of energy balance, we suggest the Kirkpatrick et al. (2015) templates are unlikely to represent the intrinsic far-IR emission for common type-1 AGNs. One way to make these latter three template families more consistent with energy balance is if their soft X-ray emission is significantly stronger than indicated by the AGN templates. The energy balance argument is difficult to apply to other AGN types because their intrinsic X-ray/UV SEDs are hard to determine. In the case of the Kirkpatrick et al. (2015) templates, we would underestimate the available X-ray/UV luminosity only if there are enough obscured AGNs in the sample to suppress the mid-IR spectrum where we have normalized the Elvis template.
To reassure ourselves of the credibility of the energy balance arguments above, we have examined the behavior of NGC 4151, since (1) its UV continuum has been derived in detail (Alexander et al., 1999), (2) its flux variations have been exceptionally well monitored (e.g., Lyuty & Doroshenko, 1999; Doroshenko et al., 2001), and (3) its infrared SED is very well determined (e.g., Rieke & Lebofsky, 1981; McAlary et al., 1983; Deo et al., 2009; García-González et al., 2016). The energy balance test on this archetypal type-1 AGN seems to fail at very first glance: even if we take the UV continuum toward the upper range as derived by Alexander et al. (1999), the infrared luminosity is too large to be consistent with energy balance by 20% or more if we analyze the comparison for the simple case of isotropic emission. However, this conclusion is fallacious. Considering the diverse physical scales of the panchromatic emission and the time variability of the accretion disk emission, energy balance for a given AGN may not hold at a given time; the infrared output, particularly at the longer wavelengths, represents a time average of the input UV luminosity. If we normalize the Alexander et al. (1999) continuum to the average U-band brightness from 1968 through 2000 (Lyuty & Doroshenko, 1999; Doroshenko et al., 2001) - a factor of 1.62 higher than at the time of their study - ratios of 85% can be obtained but still with a UV continuum toward the upper range allowed (Alexander et al., 1999). This value is consistent with the escape fraction of 15.7% derived by Alonso-Herrero et al. (2011). Rather than raising the UV to the maximum allowed, another solution would be to increase the soft X-ray flux. However, since most of the energy is produced in the blue and UV, a substantial boost (by a factor of 3) would be necessary to make a significant difference in the energy balance. Besides the variability correction, we also need to consider the anisotropic nature of the accretion disk emission. If we analyze the results as in the models of Stalevski et al. (2016), the values become consistent with more probable fits to the UV continuum (Alexander et al., 1999) and without increasing the soft X-rays. As illustrated by this example, it is critical to apply the energy balance test on a time-averaged SED. (In fact, this requirement is satisfied by the construction of the AGN template.) The case of NGC 4151 also shows that the models by Stalevski et al. (2016) are appropriate to yield consistent energy balance results.
Finally, our emphasis has been the intrinsic AGN SED: the spectrum emitted by the central engine and circumnuclear torus that together appear to constitute a typical active nucleus. It is possible that an AGN heats the surrounding ISM, producing an additional emission component (e.g., Roebuck et al., 2016). Because the extent of this heating will depend on parameters such as the relative orientation of the circumnuclear torus and the host galaxy and on the amount of interstellar material in the host, the emission will differ significantly from one AGN to another and is likely to be insignificant in many cases. We therefore do not consider it to be part of the intrinsic SED, although it is an interesting phenomenon that should yield additional insights to AGN behavior.
3. Decomposition of the Quasar IR SEDs
We illustrate some issues in deriving intrinsic AGN IR SEDs by extending the discussion in Lyu et al. (2017) on the infrared SEDs of PG quasars.
3.1. The – Relation
The mid-IR spectral window preserves a lot of useful information about the star-forming activities in AGN host galaxies. With the aid of mid-IR spectral decompositions or measurements of the aromatic feaures, many authors have tried to remove the host galaxy contamination in the AGN far-IR emission (e.g., Mullaney et al., 2011; Kirkpatrick et al., 2012, 2015; Xu et al., 2015; Symeonidis et al., 2016).
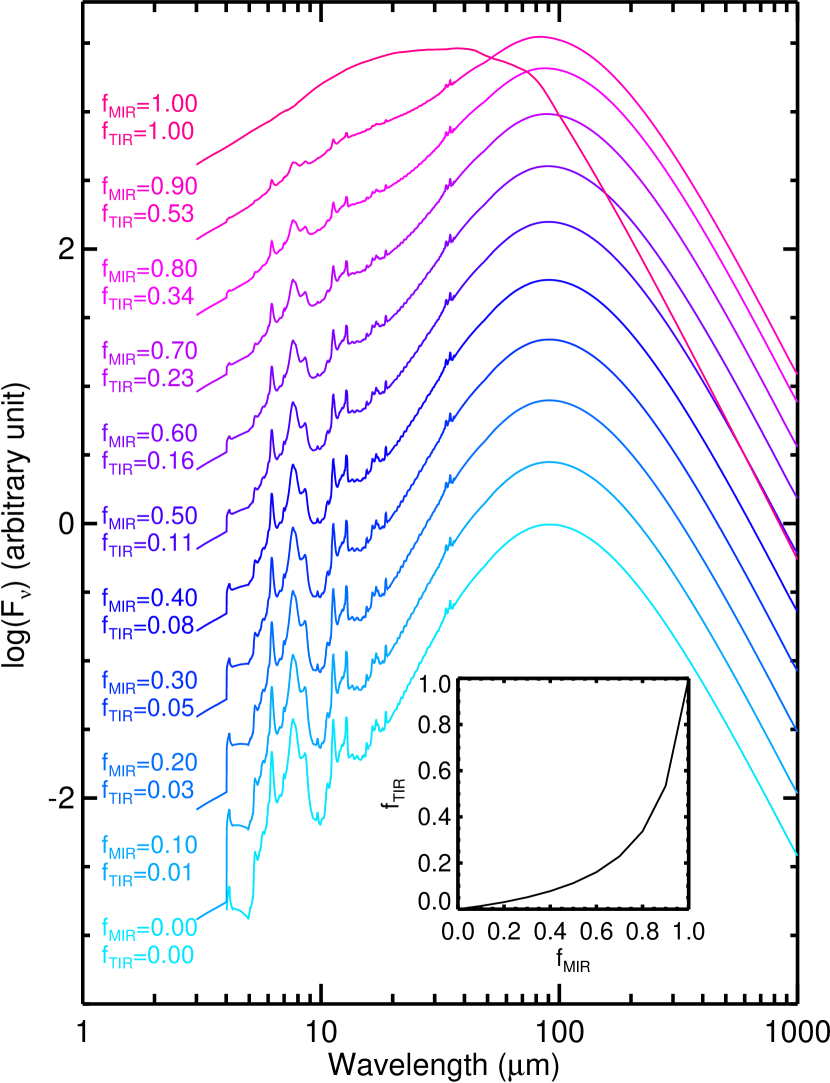
However, as suggested in Section 3.1 of Lyu et al. (2017), the host contribution in the infrared 8–1000 range could be underestimated by merely focusing on the mid-IR spectral features. This argument is based on the different IR SED behaviors of the AGN and the host galaxy: the IR output of an AGN is peaked in the mid-IR but drops quickly in the far-IR, while the galaxy emission is relatively weak in the mid-IR but strong in the far-IR. We illustrate this issue in Figure 2, which shows a series of mock galaxy SEDs derived by changing the relative contributions of the SF-corrected Elvis et al. (1994) template (Xu et al., 2015) and a Rieke et al. (2009) star-forming template. While the continua shapes of the 5–10 SEDs and the relative strengths of the aromatic features change drastically with the AGN contribution in the mid-IR, there is little modification in the far-IR. The zoom-in panel shows how the relative AGN contribution in the 8–1000 , , changes with that in the mid-IR (5–40), . The host galaxy still contributes 50% of the 8–1000 luminosity of the composite SED when the AGN provides 90% of the mid-IR emission. This result qualitatively matches the trend between the AGN relative contribution in the mid-IR emission and that in the total IR emission of the infrared luminous galaxies, as observationally determined by Kirkpatrick et al. (2015, Section 5).
For removing the host galaxy far-IR contribution based on relatively low S/N mid-IR spectra, such non-linear relations between and could cause an overestimation of the intrinsic AGN emission. In other words, although the mid-IR star formation feature may not be detected due to the low quality of the mid-IR data, substantial far-IR host galaxy contamination is still possible. This effect could be one of the reasons behind the strong far-IR emission in the Kirkpatrick et al. (2015) AGN templates. In addition, since their derivation was based on LIRGs and ULIRGs, there may be a selection bias toward cases where the AGN may be heating the galactic ISM, as suggested by Kirkpatrick et al. (2015) and Roebuck et al. (2016). Nonetheless, this situation is also subject to the energy balance constraint, which we have found to be an issue for these templates. In comparison, the study by Mullaney et al. (2011) simultaneously fitted the mid-IR spectra and the far-IR photometry of their X-ray selected sample, resulting in a far-IR AGN SED shape similar to the SF-corrected Elvis et al. (1994) template (see Section 4.1).
3.2. Using the Mid-IR Aromatic Features to Trace the SF Contribution to the Quasar Far-IR Emission
The 11.3 aromatic feature strength seems to be the only SFR-related spectral feature that is not strongly contaminated or influenced by the AGN (e.g., Diamond-Stanic & Rieke, 2010; Esquej et al., 2014; Alonso-Herrero et al., 2014). By matching the observed aromatic strength with a library of star-forming galaxy (SFG) templates, Shi et al. (2007, 2014) have constrained the host galaxy IR luminosities in quasars and these results have been used to derive the intrinsic AGN IR templates (Xu et al., 2015; Symeonidis et al., 2016).
With the mid-IR spectrum of good quality as an essential prerequisite, the key to correctly gauge the galaxy contribution to the quasar far-IR emission is the luminosity conversion factor between the aromatic features and the galaxy far-IR emission, which is dependent on the selection of the SFG template. Additionally, there is a possibility that some of the feature excitation is provided by the AGN. These two issues are addressed in this section. Finally, we note that the measurements of the aromatic features can have significant biases due to the method to quantify the mid-IR dust emission continuum: typically, the spectral decomposition approach (e.g., PAHFIT) with a model of several different dust components yields a factor of larger value of the 11.3 aromatic flux compared to the “interpolation continuum” approach of fitting some smooth function (e.g., spline or power law) to anchor points without strong aromatic emission (e.g., Smith et al., 2007). We will utilize the results from spectral decomposition similar to PAHFIT in Shi et al. (2014), except in Section 3.3.1.
3.2.1 Choosing the Proper Star-Forming Galaxy Templates
Many IR templates for SFGs are available in the literature (e.g., Chary & Elbaz 2001; Dale & Helou 2002; Lagache et al. 2003, 2004; Siebenmorgen & Krügel 2007; Rieke et al. 2009; see a review in Casey et al. 2014, as well as Ciesla et al. 2014). A critical issue is that the 11.3 m feature lies on the edge of the silicate absorption. If this absorption is strong, the apparent equivalent width (EW) of the 11.3 feature may be underestimated. This problem is particularly acute in deconvolving a composite AGN and star forming galaxy SED, where the apparent depth of the silicate absorption is masked by the AGN emission. It becomes increasingly important at high IR luminosities (e.g., LIRG/ULIRG; Stierwalt et al. 2013). Not all of the SFG template libraries include silicate absorption (e.g., Chary & Elbaz 2001; Dale & Helou 2002; see the discussion in Appendix 1.3 of Rieke et al. 2009). Consequently, if SFG templates that omit the effect of silicate absorptions were used, the far-IR emission from the galaxy can be underestimated by adopting the wrong conversion factors from the aromatic feature flux.
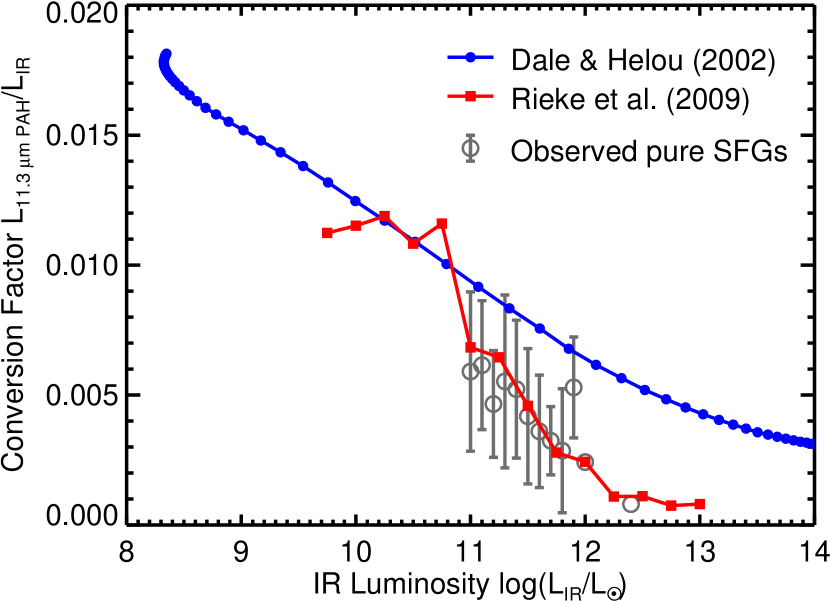
With a consistent treatment of IR spectra, photometry, and theoretical models, Rieke et al. (2009) developed IR templates for local galaxies based on Spitzer data that include the accompanying increasing silicate absorption with increasing IR luminosity. The accuracy of the Rieke et al. (2009) templates has been demonstrated in a number of works (e.g., Willmer et al., 2009; Calzetti et al., 2010) and their validity to represent SFGs extends to redshifts up to 3 (e.g., Rex et al., 2010; Rujopakarn et al., 2013; Sklias et al., 2014; Lyu et al., 2016). In Appendix B, we derive the conversion factors for pure SFGs in the Great Observatories All-sky LIRG Survey (GOALS; Armus et al. 2009). As shown in Figure 3, it is very clear that the Dale & Helou (2002) templates do not match the observations.111We note that the Dale & Helou (2002) templates were not designed for use at the highest luminosities in the figure. In contrast, the Rieke et al. (2009) templates are in good agreement with the observed trend just as expected. Compared with Rieke et al. (2009), the Dale & Helou (2002) SFG templates would result in significantly lower estimates of the SFRs and resulting far-infrared luminosities for galaxies with star forming luminosities of 1011 and higher.
For quasars, the discrepancy discussed here arises only if the host galaxy IR star forming luminosities are 1011 or more. The SFRs of most PG quasar host galaxies were found to be 10–100 (see Shi et al. 2014), putting them into the (U)LIRG category. Moreover, studies that assume Elvis-like intrinsic AGN SEDs and that the far-IR luminosity is dominated by star formation also suggest that many host galaxies are in this high-luminosity range (e.g., Xu et al., 2015; Lyu et al., 2016).
The significance of the effects on the derivation of the intrinsic AGN far-IR SED due to the selection of SFG templates will be demonstrated in Section 3.3.1.
3.2.2 The Luminosity Dependence of the Host Galaxy IR SEDs
According to the energy balance discussed in Section 2, it is not reasonable to assume the entire luminosities of far-IR-bright quasars are attributed to the central engine. A significant, perhaps dominant, part of the far-IR luminosity must arise from the host galaxy. To confirm that the Rieke et al. (2009) SFG templates can represent the quasar host galaxy IR emission and the aromatic emission observed in the quasar mid-IR spectra is indeed from the quasar host galaxy, in a statistical sense, (1) the fitted host galaxy IR luminosities should be consistent with the IR luminosities associated with the selected SFG templates from Rieke et al. (2009); (2) the 11.3 aromatic feature strengths observed in the mid-IR spectra should also agree with the values converted from the fitted galaxy template.
In Lyu et al. (2017), the mid- to far-IR SEDs of 87 PG quasars were fitted with the SF-corrected Elvis AGN template (as well as the dust-deficient AGN templates) and SFG templates with =9.75–12.0 from Rieke et al. (2009). Besides the well-sampled IR broadband SEDs, high-quality Spitzer/IRS mid-IR spectra are also available for the whole sample, enabling simultaneous tests on the ability of both the far-IR SEDs and the mid-IR spectral features of the Rieke et al. (2009) templates to represent the quasar host galaxy emission. However, not all members in this sample were suitable for this purpose. Firstly, for each quasar, we should be able to reveal the differences among the Rieke et al. (2009) templates. Thus, we require the quasar to either have a substantial host galaxy contribution (), where the shape of the infrared galaxy template becomes important to change the , or the Rieke et al. (2009) template with a similar luminosity as the observed value tends to a smaller at least by a factor of 1.5 compared with alternatives. 32 PG quasars meet this requirement. Additionally, there should be no nearby galaxy to pollute the Herschel photometry of the quasar far-IR emission, and two quasars failing this criteria have been dropped. Finally, poor fittings of the very far-IR SEDs may suggest dust heating by old stars, abnormal dust properties, confusion noise, or radio synchrotron emission contamination. In such cases, the radio-quiet AGN template combined with any selection of the SFG templates will be unreliable. Consequently, we dropped another six quasars due to their large fitting residuals ( dex) at . The final sample of the 24 PG quasars as well as their IR properties is listed in Table 2.
| ID | Source | ||||||||
|---|---|---|---|---|---|---|---|---|---|
| (1) | (2) | (3) | (4) | (5) | (6) | (7) | (8) | (9) | (10) |
| 4 | PG 0043+039 | 0.38 | 11.50 | 1.02 | 0.65 | 0.19 | 11.00 | 11.56 | |
| 6 | PG 0050+124 | 0.06 | 11.25 | 1.09 | 0.56 | 8.90 | 11.00 | 11.47 | |
| 10 | PG 0838+770 | 0.13 | 10.50 | 0.87 | 0.51 | 0.77 | 11.00 | 11.12 | |
| 14 | PG 0923+129 | 0.03 | 9.75 | 1.15 | 0.46 | 4.34 | 10.50 | 10.33 | |
| 15 | PG 0934+013 | 0.05 | 9.75 | 1.12 | 0.38 | 1.10 | 11.00 | 10.39 | |
| 20 | PG 1011040 | 0.06 | 10.00 | 0.88 | 0.53 | 0.86 | 11.00 | 10.45 | |
| 21 | PG 1012+008 | 0.19 | 10.00 | 0.92 | 0.76 | 0.23 | 11.00 | 10.96 | |
| 22 | PG 1022+519 | 0.05 | 10.00 | 1.03 | 0.35 | 0.87 | 11.00 | 10.29 | |
| 25 | PG 1049005 | 0.36 | 11.00 | 0.83 | 0.69 | 0.23 | 11.75 | 11.98 | |
| 31 | PG 1119+120 | 0.05 | 10.00 | 0.82 | 0.60 | 1.60 | 11.00 | 10.56 | |
| 34 | PG 1149110 | 0.05 | 9.75 | 0.26 | 0.44 | 1.32 | 11.00 | 10.47 | |
| 41 | PG 1244+026 | 0.05 | 9.75 | 0.91 | 0.58 | 0.69 | 11.00 | 10.19 | |
| 48 | PG 1341+258 | 0.09 | 9.75 | 1.26 | 0.65 | 0.28 | 11.00 | 10.34 | |
| 49 | PG 1351+236 | 0.05 | 10.50 | 1.10 | 0.21 | 2.21 | 11.00 | 10.70 | |
| 50 | PG 1351+640 | 0.09 | 11.25 | 0.91 | 0.65 | 2.06 | 11.00 | 11.20 | |
| 53 | PG 1402+261 | 0.16 | 10.75 | 0.98 | 0.76 | 0.41 | 11.50 | 11.21 | |
| 54 | PG 1404+226 | 0.10 | 10.00 | 1.28 | 0.67 | 0.37 | 10.75 | 10.32 | |
| 56 | PG 1415+451 | 0.11 | 10.75 | 1.09 | 0.66 | 0.46 | 11.00 | 10.74 | |
| 67 | PG 1519+226 | 0.14 | 10.25 | 1.10 | 0.85 | 0.30 | 10.75 | 10.55 | |
| 70 | PG 1543+489 | 0.40 | 10.50 | 0.87 | 0.55 | 0.35 | 11.75 | 12.27 | |
| 73 | PG 1612+261 | 0.13 | 10.50 | 1.19 | 0.60 | 0.77 | 11.25 | 11.14 | |
| 77 | PG 1700+518 | 0.28 | 13.00 | 0.88 | 0.74 | 0.38 | 11.75 | 11.95 | |
| 78 | PG 1704+608 | 0.37 | 11.25 | 1.09 | 0.81 | 0.12 | 12.00 | 11.78 | |
| 81 | PG 2209+184 | 0.07 | 10.00 | 1.33 | 0.57 | 0.58 | 09.75 | 10.20 |
Note. — Column (1): the object ID (see Table 2 in Lyu et al. 2017 for the list of the whole PG sample); Column (2): object name; Column (3): redshift; Column (4): the 11.3 aromatic feature flux (unit: erg s-1 cm-2) as measured by Shi et al. (2014); Column (5): the IR luminosity of the best-matched Rieke et al. (2009) template based on the 11.3 aromatic feature luminosity; Column (6): the scaling factor of the best-matched Rieke et al. (2009) template based on the 11.3 aromatic feature luminosity; Column (7): the AGN fractional contribution to the IR emission of each quasar; Column (8): the 11.3 aromatic feature flux (unit: erg s-1 cm-2) derived from the SED modeling; Column (9): the IR luminosity of the best-fitted Rieke et al. (2009) template from the SED modeling; Column (10): the observed IR luminosity of the host galaxy from the SED modeling.
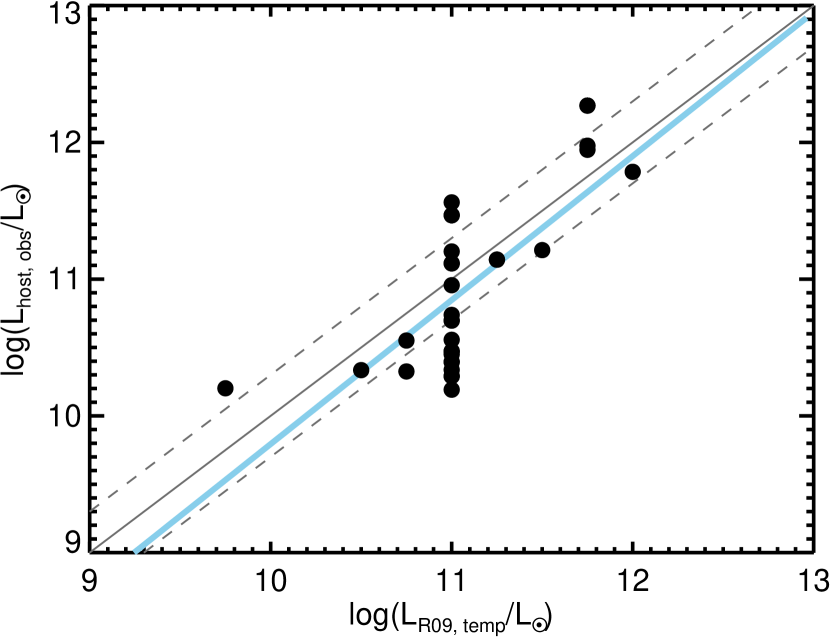
The far-infrared SEDs of star-forming galaxies show a consistent pattern of shapes as a function of the luminosity (e.g., Chary & Elbaz, 2001; Dale & Helou, 2002; Siebenmorgen & Krügel, 2007; Rieke et al., 2009). In Figure 4, we compare the derived host galaxy infrared luminosities from fitting the far-infrared SEDs with the luminosity of the template with the shape that gave the best fit for these 24 PG quasars. The luminosities of the optimally shaped templates are roughly consistent with the quasar host galaxy luminosities derived by integrating the fitted fluxes. With a linear fit, we find a slope between these two groups of luminosities to be 1.050.20 and an intercept of 0.732.13, consistent with the expected 1:1 relation.
3.2.3 The 11.3 Aromatic Strength from the SED Model
If the excitation of the 11.3 feature is dominated by star formation as represented by the Rieke et al. (2009) templates, we should expect the observed mid-IR aromatic feature strength to be consistent with the aromatic flux converted from the SFG template fitted to the SED photometry. If the AGN plays an important role in exciting the aromatic feature, we would expect the feature strength to be greater than that predicted by the star-forming template.
To derive the aromatic feature strengths of the Rieke et al. (2009) templates, we decomposed the 5–40 portion of the templates using the IDL program PAHFIT (Smith et al., 2007). In this code, the mid-IR dust continuum is fitted with multiple blackbody components with possible mid-IR extinction and the 11.3 aromatic feature is fitted with two Drude profiles centered at 11.23 and 11.33 . The 11.3 feature strength computed by PAHFIT was then compared with the 8.0–1000 integrated luminosity of each template. Finally, we ended up with the conversion factor for the 11.3 feature, varying from 0.011 at to 0.0024 at .
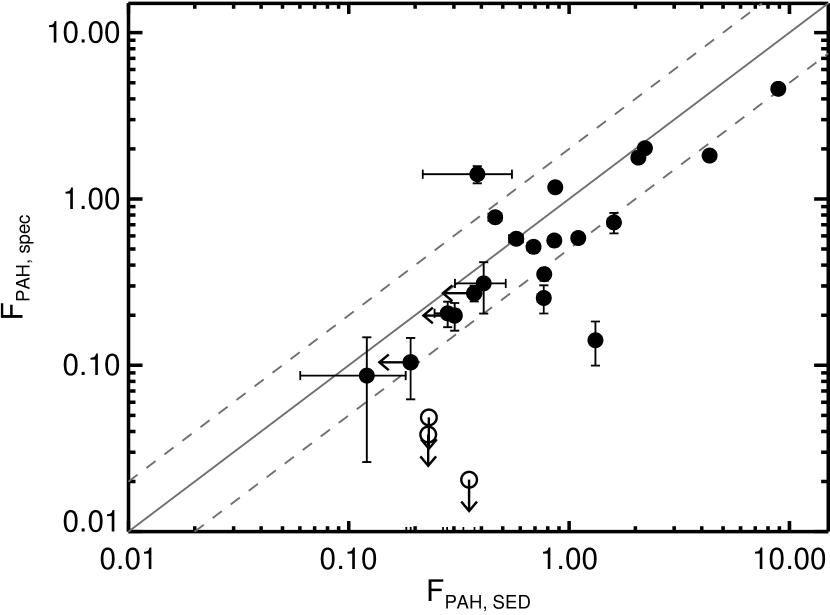
Figure 5 compares the 11.3 aromatic feature flux converted from the fitted Rieke et al. (2009) templates in Lyu et al. (2017) with the values measured from Spitzer/IRS spectra by Shi et al. (2014). Considering the measurement uncertainties, the results are consistent within 0.3 dex for most objects and show a strong correlation. There is only one case above the correlation that might be a candidate for an additional contribution through excitation by the nucleus. The consistent results between the SED model predications and the mid-IR spectral measurements indicate that the excitation of the 11.3 aromatic feature is dominated by star formation in most of these systems.
3.3. Testing Alternative AGN “Intrinsic” IR Templates
Given the consistent SFRs estimated from the SED models with the values measured by the 11.3 aromatic bands (Figure 9 in Lyu et al. 2017) and the successful reproduction of the host galaxy mid-IR to far-IR properties by the Rieke et al. (2009) templates shown above, the argument that the intrinsic AGN IR emission of most quasars can be represented by the SF-corrected Elvis et al. (1994) template is also validated. Here we discuss whether the other versions of AGN “intrinsic” IR templates, e.g., as proposed by Netzer et al. (2007), Kirkpatrick et al. (2015), and Symeonidis et al. (2016), are good alternative choices to the SF-corrected Elvis et al. (1994) template.
3.3.1 An Illustration of the Importance of SFG Template Selection
Recently, Symeonidis et al. (2016) derived an SF-corrected AGN template based on a sample of 47, radio-quiet PG quasars at . Even compared with the original Elvis et al. (1994) quasar template, the Symeonidis et al. (2016) template has much stronger far-IR emission. However, they used host galaxy luminosities derived from Shi et al. (2007), which were based on the Dale & Helou (2002) templates because replacements based on Spitzer data were not yet available. Recalling our comparisons of the Dale & Helou (2002) and the Rieke et al. (2009) SFG templates in Section 3.2.1, there is a risk that the cool SED component they found in the quasars is a result of underestimating the contribution of star formation to the quasar composite far-IR SED.
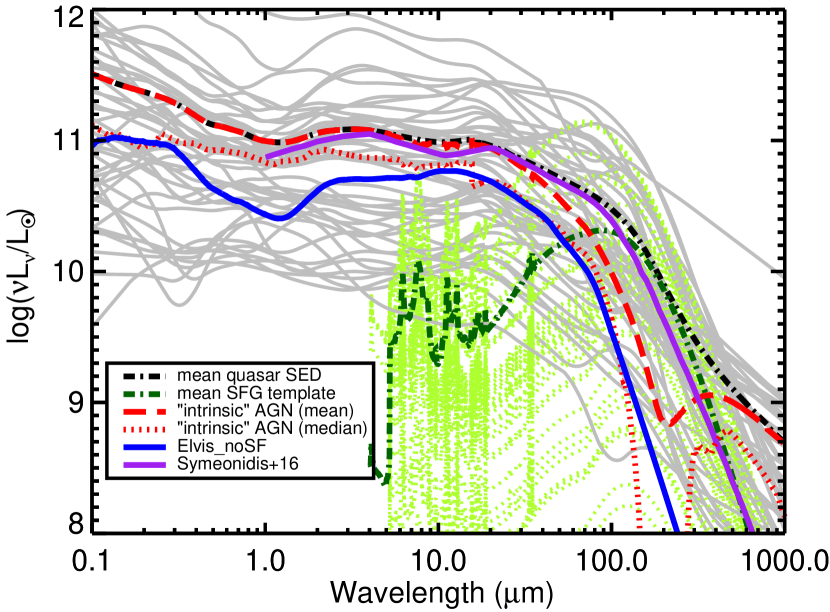
To test this possibility with the data described in Lyu et al. (2017), we made a similar derivation of the “intrinsic” AGN IR template based on the same sample as Symeonidis et al. (2016). To derive the quasar continuum, we interpolated the UV-to-IR photometry logarithmically and smoothed the SED with a boxcar.222We note that Symeonidis et al. (2016) fitted the quasar IR SEDs at with a greybody for the far-IR and a power law for the mid-IR (see their Section 3.1). For some quasars with strong host far-IR emission, a local SED minimal can be seen between and (see the SEDs of, e.g., PG 0052+251, PG 0844+349, PG 1114+445, and PG 1416129 in their Figure A3). In fact, this feature is common for many quasars but not always obvious due to the poorly constrained SEDs at these wavelengths (see our SED decompositions in Figure 5 of Lyu et al. 2017). The SED model used by Symeonidis et al. (2016) cannot reproduce such features due to the smoothly declining nature of their adopted function, leading to possible overestimations of the far-IR emission of many quasars. With the Rieke et al. (2009) template that gave the closest 11.3 aromatic luminosity as measured by Shi et al. (2007), we derived a host galaxy luminosity with the matched and scaled SFG template for each quasar. This host galaxy IR luminosity was then compared to the observed quasar IR luminosity to derive a relative scaling of the selected Rieke et al. (2009) template, as shown in Figure 6. For quasars with only upper limits to the aromatic flux, we scaled the matched SFG template by adopting one-half of the IR host template luminosity corresponding to the upper limit, as in Symeonidis et al. (2016). Then the composite mean SEDs of the quasar sample and the relatively scaled Rieke et al. (2009) templates were computed. By subtracting the mean host galaxy SED from the observed mean quasar SED, we derived a final version of the “intrinsic” AGN SED template but with the Rieke et al. (2009) SFG templates to represent the host galaxy emission. As shown in Figure 6, this newly derived “intrinsic” AGN template, which is based on the Symeonidis et al. (2016) sample but with the Rieke et al. (2009) SFG library to convert the 11.3 aromatic strengths to the host IR luminosities, presents much weaker far-IR emission compared with the version from Symeonidis et al. (2016). We also derived another version of the “intrinsic” AGN SED template by subtracting the composite median host galaxy SED from the median quasar SED. Normalized at 20 , its far-IR part matches the SF-corrected Elvis et al. (1994) template reasonably well up to 100 . Beyond 100 , our mean (or median) SFG SED has similar emission strength with the mean (or median) quasar SED, suggesting that the AGN contribution in the composite quasar emission is weak. A more realistic replacement of these AGN templates at is a Rayleigh-Jeans tail with emissivity proportional to , which would finally yield almost the same SED shape at 20–1000 as the SF-corrected Elvis et al. (1994) template.
Given this result, we suggest that the cooler “intrinsic” AGN IR SED derived by Symeonidis et al. (2016) is at the least a very uncertain conclusion and that a similar derivation using more appropriate star forming galaxy templates implies that this characteristic is not common. Consequently, it casts doubt on the argument of her following work (Symeonidis, 2017) that the AGN-heated dust emission would overwhelmingly contribute the far-IR emission of the most luminous quasars. Additionally, we further confirmed the validity of this SF-corrected Elvis et al. (1994) template by successfully reproducing a similar one with a different approach from Xu et al. (2015).
3.3.2 Tests Based on the Aromatic Band Behavior
As shown in Lyu et al. (2017), there is a range of intrinsic infrared SEDs for quasars. We limit this discussion to the confirmed 52 “normal” PG quasars as defined in that paper.
Since the EW reflects the relative strength of the emission feature, how the EW of the 11.3 aromatic feature changes with the AGN contribution to the quasar IR emission budget would provide a method to distinguish different AGN templates. In Figure 7, we compare the relations between the EW of the 11.3 feature and the relative AGN contribution in the total infrared emission derived from SED decomposition of the normal quasar sample and the relations derived from combining the AGN templates with the Rieke et al. (2009) =11.25 SFG template. The observation matches the SF-corrected Elvis et al. (1994) template reasonably well except for the cases where . In these cases, the AGN contribution is so dominant that the measurement of the aromatic features becomes difficult, so we are unsure if this discrepancy is real. In addition, many quasars with have host galaxy IR luminosities , in which case the =11.25 SFG template adopted here would underestimate the EW of the aromatic features (see Figure 3).
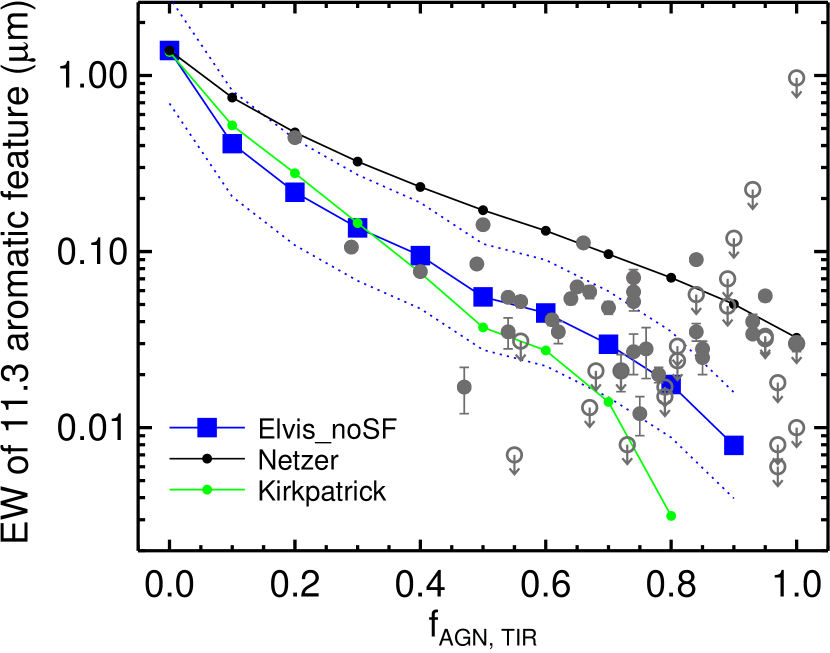
As shown in Figure 7, combining the Kirkpatrick et al. (2015) AGN template with the SFG template to fit the far-IR underpredicts the 11.3 aromatic feature EWs, which supports the idea of that the (Kirkpatrick et al., 2015) templates have substantial host galaxy contamination in the IR. In comparison, using the Netzer et al. (2007) AGN template overpredicts the aromatic feature EWs, suggesting that the host galaxy is over-subtracted from their quasar average SEDs. As a result, we suggest the assumption in Netzer et al. (2007) that 50–100 emission of quasars is entirely due to star formation is too aggressive. Consequently, the SF-corrected Elvis et al. (1994) template is preferred over these two alternatives.
4. Discussion
4.1. Does the normal quasar IR template apply to other populations of type-1 AGNs?
A natural question is whether most, if not all, AGNs have similar intrinsic IR SEDs. As shown by Lyu et al. (2017), among unobscured type-1 quasars, some 10% or more have a deficiency of the AGN intrinsic infrared emission, making their SEDs differ significantly from the normal cases. These dust-deficient quasars can be further grouped into the hot-dust-deficient (HDD) population and the warm-dust-deficient (WDD) population, possibly connected with different AGN properties. In addition, it is established that the AGN SED, including the IR part, changes from the most luminous quasars to less luminous AGNs in nearby galaxies (Ho, 1999, 2008; Prieto et al., 2010). Hence the idea of one single IR template that applies for all kinds of AGNs, even just for quasars, is not correct.
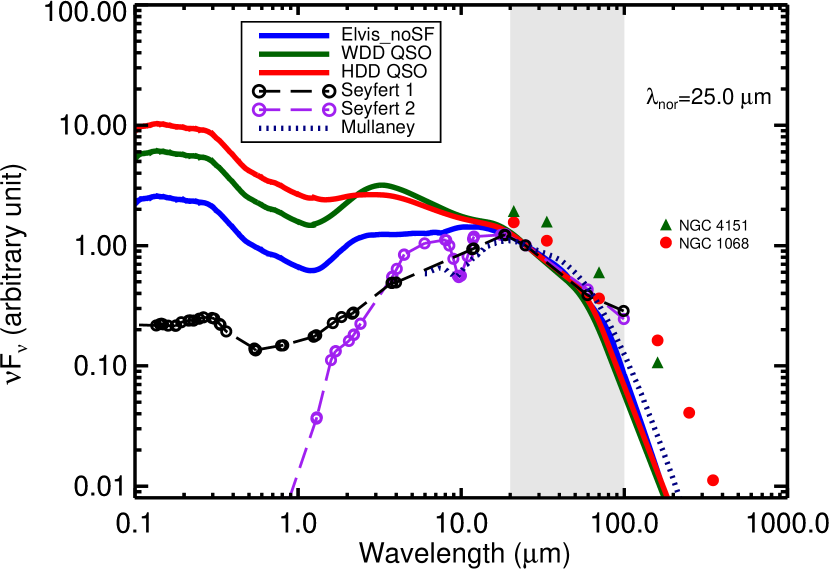
Surprisingly, despite the variations in the near- and mid-IR, the intrinsic SEDs of many different types of AGNs are roughly similar in the far-IR. In Figure 8, we compare the empirical templates for normal quasars and dust-deficient quasars (Lyu et al., 2017), the sub-arcsec resolution average templates derived for nearby Seyfert 1 and Seyfert 2 galaxies (Prieto et al., 2010), the IR intrinsic template of moderate-luminosity AGNs derived by Mullaney et al. (2011), and the observed SEDs with the smallest beams333Rieke & Low (1972, 1975a, 1975b) presented the smallest photometric beam measurements of NGC 1068 and NGC 4151 at wavelengths longer than (except for submillimeter and radio) so far at 21 and 34 (with a beam size 6″). For NGC 1068, we supplement the 14.3″aperture Herschel photometry at 70, 160, 250, 350, and 500 from (García-González et al., 2016) with a scaling factor of 5.7 to reduce the aperture effects with ground-based data. For NGC 4151, we plot the 10.2″aperture photometry at 70 and 160 from the same paper with a scaling factor of 1.44. of the archetypal Seyfert galaxies: NGC 1068 (type 2) and NGC 4151 (type 1). Firstly, all three quasar templates have surprisingly similar 20–100 SEDs with mean deviations of less than 0.07 dex. For Seyfert galaxies, due to their low AGN luminosities, the host galaxy dust emission still contaminates the far-IR AGN emission. However, all of the Seyfert AGN templates and SEDs show a decreasing trend of the far-IR SED right after 20 microns, similar to the behavior of the quasars. In fact, based on subtraction of host galaxy contamination from the mid-IR continua of Seyfert galaxies, Deo et al. (2009) also reported a similar turn-over at. Mullaney et al. (2011) derived their intrinsic AGN IR template by fitting both mid-IR spectral data and far-IR photometry of 11 nearby moderate-luminosity AGNs. We find it shares a similar far-IR SED as the quasar templates. For the Seyfert sample in Prieto et al. (2010), their 11.3 aromatic feature luminosities were found to be (Sturm et al., 2000; Hernán-Caballero & Hatziminaoglou, 2011), corresponding to the host IR luminosities . After subtracting a host galaxy template from the Prieto et al. (2010) Seyfert 1 and Seyfert 2 AGN templates in the far-IR, their 70 SED can easily match that of Mullaney et al. (2011). As argued at the end of the next subsection, such an SED similarity in the far-IR might be inherently expected from simple physics of dust grain emission in the optically thin limit.
4.2. Implications for the Obscuring Structure
With the complete characterization of the intrinsic infrared SED templates for quasars (Xu et al., 2015; Lyu et al., 2017) and the further confirmation as presented in this work, we can analyze the properties of the major dust components that determine the SED shape. Dust will sublimate at a temperature 1800 K in the innermost regions of the torus. Thus we use a blackbody with a fixed temperature at 1800 K to represent this hottest dust component. Additionally, we add three dust components to represent the hot, warm, and cold dust contributions; the first two components are assumed to be black bodies and the cold dust component is assumed to be a modified blackbody with emissivity . Unlike the hottest dust component, the temperatures of the other three components can be varied freely. The relative fractions of all the dust components are free parameters. The emission from the accretion disk is represented with a power-law component, which can be described as with a break to the Rayleigh-Jeans slope at 3 (Hönig & Kishimoto, 2010). We normalize this component to the template at 0.51. After subtracting the contribution of this broken power-law component, the 1.0–1000 SED template is fitted by the four-component dust model with parameters determined by minimizing the .
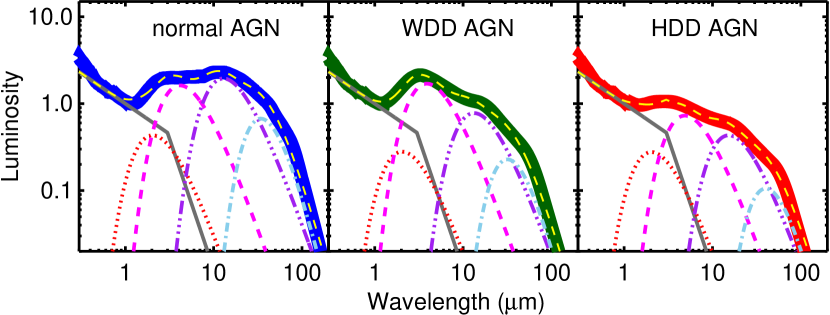
The template decomposition results are summarized in Figure 9 and Table 3. Our simple dust model fits reasonably well and confirms the deficiency of hot or warm dust emission in corresponding groups of AGNs. In Table 3, we quantify the emission strength of each dust component by its total luminosity, , normalized by the emission coming from the accretion disk, . The WDD AGNs and normal AGNs have similar hot dust emission strength with but the warm dust emission strength of the former is only about half of the latter. The HDD AGNs have weaker hot dust emission () and warm dust emission () compared with the normal AGNs. While the relative contributions differ in these AGN templates, the temperatures of each dust component have narrow ranges with the hot dust component at 700–1000 K, the warm dust component at 200–300 K and the cold dust component at 60–80 K. This result suggests that we are seeing the infrared emission of a number of components of these AGNs that are nearly always present but in modestly different amounts.
| Dust Component | ||
|---|---|---|
| (1) | (2) | (3) |
| Normal AGN template | ||
| Sublimating dust | 1800 K | 0.050.01 |
| Hot dust | 88349 K | 0.190.01 |
| Warm dust | 28512 K | 0.230.01 |
| Cold dust | 775 K | 0.060.01 |
| All dust | – | 0.53 |
| WDD AGN template | ||
| Sublimating dust | 1800 K | 0.030.02 |
| Hot dust | 94450 K | 0.210.01 |
| Warm dust | 27631 K | 0.100.01 |
| Cold dust | 8313 K | 0.020.01 |
| All dust | – | 0.36 |
| HDD AGN template | ||
| Subliminating dust | 1800 K | 0.030.01 |
| Hot dust | 75277 K | 0.100.01 |
| Warm dust | 24046 K | 0.060.01 |
| Cold dust | 6630 K | 0.010.01 |
| All dust | – | 0.20 |
Note. — Column (1): the hottest dust component corresponds the dust close to the sublimation distance; Column (2): dust temperature from the decomposition model; Column (3): IR-processed light fraction of each dust component. . We caculate the 1 keV–1.25 luminosity of the AGN template as and the 1.25–1000 luminosity as .
Given the decomposition results, we can also make order-of-magnitude estimations of the physical sizes of these dust components. Assuming blackbody emission with temperature , the dust emission luminosity can be approximated by the Stefan–Boltzmann law. Introducing a dust-covering factor and a characteristic physical scale , then we have
| (1) |
where is the Stefan–Boltzmann constant. The dust-covering factor of each component can be assumed to be . Substituting typical dust temperatures and the IR-processed light fractions of various dust components, for an AGN with luminosity , the characteristic physical scales of the hot, warm, and cold dust emission are of the order of 0.01–0.1, 1, and 10 pc. All these values scale with the square-root of AGN Luminosity (). The typical physical size of the hot dust emission estimated from the SED analysis is consistent with the estimation from dust sublimation (e.g., Laor & Draine, 1993), suggesting that the subliming dust and hot dust may be part of a continuous distribution. The relatively weak far-IR emission of quasars suggests a compact torus at sub-kiloparsec scales, which was originally suggested by Pier & Krolik (1992, 1993) from a theoretical analysis. Only for the most luminous quasars (), the dust far-IR emission heated by the AGN could extend into kiloparsec scales, but maybe only marginally so if the relatively decreasing mid-IR and far-IR emission of the AGN is common in these systems (see Section 6.3 of Lyu et al. 2017).
The results from the simple SED analysis above show that the AGN-heated dusty structures have a wide temperature distribution with diverse physical scales. Although the AGN obscuration structures are often pictured as a doughnut-like ring (or a torus), we are actually unsure of the size and structure of their outer part. In the mid-IR, high-resolution observations support a compact geometry of the mid-IR emission region for local AGNs (see, e.g., Asmus et al. 2014 and references therein). However, as suggested by, e.g., Antonucci (2015), one should be cautious when referring to a size of the torus since it depends on the observed wavelength. The Atacama Large Millimeter Array (ALMA) has the resolution to possibly image the torus structures in nearby systems (García-Burillo et al., 2016; Imanishi et al., 2016). Nevertheless, whether these dusty molecular clouds are obscuring the nuclei and heated up in the submillimeter bands by absorbing AGN emission is not easy to tell. The similar intrinsic far-IR SEDs of AGNs discussed in this work provide some observational constraints on this topic.
In the far-IR, the dust emission is expected to be in the optically thin limit. As suggested by Ivezic & Elitzur (1997), the SED shape under this condition is not sensitive to the geometry but the temperature of the dust grains (see their Section 5). If similar grain properties can be assumed, the identical equilibrium temperatures of optically thin dust, which would result in similar intrinsic AGN far-IR SEDs, are naturally expected once the spectral shape of the incoming radiation is settled (e.g., Laor & Draine, 1993). In fact, the incoming light that is absorbed by these dust grains in quasars and Seyfert nuclei share comparable SEDs (dominated by the emission of, e.g., the thin-disk accretion; Yuan & Narayan 2014). Meanwhile, the geometric structures of the torus, whose outer part could be potentially mixed with the galactic ISM, are allowed to be somewhat diverse.
5. Summary
The discrepancies in determinations of the intrinsic far-IR SED of luminous AGNs have been evaluated in this paper. We found that the SF-corrected Elvis et al. (1994)-like AGN template is the most-likely correct selection for most type-1 quasars. This conclusion is supported by the following evidence.
-
1.
Energy balance. We assumed the IR (1.3–1000 ) emission of the AGN comes from the dust-reprocessed black hole accretion emission at 0.0012 (1 keV)–1.3 and the IR-processed light fraction, , should be consistent with the observed dust-covering factor for luminous quasars. Adopting the Elvis et al. (1994) template to represent the SED of the accretion disk emission with a proper scaling, we found only a small number of empirical IR templates yielded a matched (e.g., 0.53-0.55 for Elvis et al. 1994 as well as its SF-corrected version, 0.56 for Symeonidis et al. 2016, 0.46 for Netzer et al. 2007). In comparison, the AGN templates proposed by Polletta et al. (2007), Hanish et al. (2013), and Kirkpatrick et al. (2015) have , suggesting that they are unlikely valid for luminous type-1 objects in general.
-
2.
SED decomposition of the PG quasars. Based on the results of Lyu et al. (2017), we found that (1) the far-IR SEDs of PG quasars are fitted well by the SF-corrected Elvis et al. (1994) AGN template combined with a Rieke et al. (2009) SFG template; (2) the best-matched SFG templates preserve the luminosity-dependent SED shapes as seen in IR-luminous star-forming galaxies; (3) the predicted 11.3 aromatic strengths from the SFG templates match the measurements from the quasar mid-IR spectra; (4) the observed relation between the EWs of the 11.3 aromatic feature and the AGN contributions to the total quasar infrared luminosities is also matched by the mock SED simulation by the SF-corrected Elvis et al. (1994) and the Rieke et al. (2009) templates.
Compared with the observations, the mock composite SEDs with the Netzer et al. (2007) AGN template overestimate the EW of the 11.3 aromatic feature, suggesting the assumption that the far-IR emission of quasars is totally SF-dominated is not completely true. Meanwhile, the cooler IR emission nature of the Symeonidis et al. (2016) intrinsic AGN template is a result of the questionable adoption of the Dale & Helou (2002) galaxy templates to relate the strengths of the aromatic feature to the galaxy far-IR emission for (U)LIRGs. The correct conversion between the aromatic flux and the galaxy far-infrared luminosity, plus high-quality mid-IR spectra, are required to avoid an underestimation of host galaxy contribution to the far-IR emission of quasars.
There is no one single IR template that can be applied to all kinds of AGNs, even just for type-1 quasars. Nevertheless, normal quasars, dust-deficient quasars and Seyfert nuclei have similar intrinsic AGN far-IR SED shapes at , which may indicate a similar emitting character in the outer part of the AGN-heated dusty structures. In fact, the similar intrinsic AGN far-IR emission SEDs for these objects are naturally expected when the responsible dust grains are in the optically thin limit.
Based on the decomposition of the intrinsic AGN IR templates for the type-1 quasar population, we found that four dust components with similar temperatures (1800, 700–1000, 200–300, and 60–80 K) can explain the diversity of the intrinsic AGN IR emission properties by changing their relative contributions. The weak emission of the AGN-heated cold dust component suggests a compact torus at sub-kiloparsec scales in the far-IR for most quasars.
The intrinsic AGN templates for normal quasars (Xu et al., 2015) and dust-deficient quasars (Lyu et al., 2017) are provided in the appendix.
Appendix A The AGN intrinsic SED templates
Xu et al. (2015) derived the intrinsic AGN template for normal quasars based on the Elvis et al. (1994) template. The validity of this template has been demonstrated for the most luminous quasars at (Lyu et al., 2016), type-1 AGNs at 0.7–2.5 (Xu et al., 2015), and PG quasars at (Lyu et al., 2017). In Lyu et al. (2017), we have derived the intrinsic AGN templates for WDD and HDD quasars and shown that these dust-deficient AGNs can be found at 0–6. In Table 4, we provide the 0.1–1000 SEDs of these three templates.
| (1) | (2) | (3) | (4) | (5) |
|---|---|---|---|---|
| -1.00 | 15.48 | 0.575 | 0.574 | 0.571 |
| -0.99 | 15.47 | 0.578 | 0.576 | 0.574 |
| -0.98 | 15.46 | 0.579 | 0.578 | 0.576 |
| -0.97 | 15.45 | 0.588 | 0.587 | 0.585 |
| -0.96 | 15.44 | 0.595 | 0.594 | 0.591 |
| … |
Note. — The template luminosities are normalized at 1.25 m. For all of the templates at , a modified blackbody with temperature at 118 K and dust emissivity 1.5 is scaled to match the observed SED. The 0.1–1.25 SEDs of the HDD and WDD templates are assumed to be the same as Elvis et al. (1994).
(This table is available in its entirety in machine-readable form. A portion is shown here for guidance regarding its form and content.)
Appendix B Pure star-forming galaxies in the GOALS sample
The Great Observatories All-sky LIRG Survey (GOALS; Armus et al. 2009) provided the community a comprehensive dataset for over 200 (U)LIRGs in the local Universe. We selected 101 pure star-forming galaxies from this sample by removing any objects with an X-ray cross-identification according to the NASA/IPAC Extragalactic Database (NED), identified as AGN in the literature, or presenting mid-IR [Ne V] emission lines. We obtained the Spitzer/IRS low-resolution spectra for all these objects from the Combined Atlas of Sources with Spitzer IRS Spectra (CASSIS; Lebouteiller et al. 2011). If necessary, we scaled the Short-Low (SL) module spectra to match the Long-Low (LL) module spectra to make a continuous mid-IR continuum. The final combined spectra were then analyzed by the IDL program PAHFIT (Smith et al., 2007). Finally, the flux of the 11.3 aromatic feature complex was derived for each object. Adopting the 8–1000 IR luminosities in Armus et al. (2009), we calculated the luminosity conversion factor from the 11.3 aromatic feature complex to the total IR emission for each star-forming galaxy and binned individual measurements as a function of the IR luminosity. The standard deviations are used to show the dispersions of the observed conversion factors in Figure 3. Our sample of pure SFGs in GOALS as well as corresponding measurements are presented in Table 5.
| Name | ||||
|---|---|---|---|---|
| (1) | (2) | (3) | (4) | (5) |
| RAS F19297-0406 | 0.0857 | 9.30 | 12.40 | 0.0008 |
| IRAS 19542+1110 | 0.0650 | 9.38 | 12.00 | 0.0024 |
| IRAS 17132+5313 | 0.0509 | 9.72 | 11.90 | 0.0066 |
| CGCG 448-020 | 0.0361 | 9.39 | 11.90 | 0.0031 |
| ESO 593-IG008 | 0.0487 | 9.70 | 11.90 | 0.0062 |
| … |
Note. — Column (1): the object name; Column (2): redshift from NED; Column (3): the luminosity of the 11.3 aromatic emission as measured from the mid-IR spectrum; Column (4): the IR luminosity of the object in Armus et al. (2009); Column (5): the luminosity conversion factor between the 11.3 aromatic emission and the total IR emission. .
(This table is available in its entirety in machine-readable form. A portion is shown here for guidance regarding its form and content.)
References
- Alexander et al. (1999) Alexander, T., Sturm, E., Lutz, D., et al. 1999, ApJ, 512, 204
- Alonso-Herrero et al. (2003) Alonso-Herrero, A., Quillen, A. C., Rieke, G. H., Ivanov, V. D., & Efstathiou, A. 2003, AJ, 126, 81
- Alonso-Herrero et al. (2011) Alonso-Herrero, A., Ramos Almeida, C., Mason, R., et al. 2011, ApJ, 736, 82
- Alonso-Herrero et al. (2014) Alonso-Herrero, A., Ramos Almeida, C., Esquej, P., et al. 2014, MNRAS, 443, 2766
- Antonucci (1993) Antonucci, R. 1993, ARA&A, 31, 473
- Antonucci (2015) —. 2015, ArXiv e-prints
- Armus et al. (2009) Armus, L., Mazzarella, J. M., Evans, A. S., et al. 2009, PASP, 121, 559
- Asmus et al. (2014) Asmus, D., Hönig, S. F., Gandhi, P., Smette, A., & Duschl, W. J. 2014, MNRAS, 439, 1648
- Calzetti et al. (2010) Calzetti, D., Wu, S.-Y., Hong, S., et al. 2010, ApJ, 714, 1256
- Cao (2009) Cao, X. 2009, MNRAS, 394, 207
- Casey et al. (2014) Casey, C. M., Narayanan, D., & Cooray, A. 2014, Phys. Rep., 541, 45
- Chary & Elbaz (2001) Chary, R., & Elbaz, D. 2001, ApJ, 556, 562
- Ciesla et al. (2014) Ciesla, L., Boquien, M., Boselli, A., et al. 2014, A&A, 565, A128
- Corrales et al. (2016) Corrales, L. R., García, J., Wilms, J., & Baganoff, F. 2016, MNRAS, 458, 1345
- Cutri et al. (1985) Cutri, R. M., Wisniewski, W. Z., Rieke, G. H., & Lebofsky, M. J. 1985, ApJ, 296, 423
- Dale & Helou (2002) Dale, D. A., & Helou, G. 2002, ApJ, 576, 159
- Delvecchio et al. (2014) Delvecchio, I., Gruppioni, C., Pozzi, F., et al. 2014, MNRAS, 439, 2736
- Deo et al. (2009) Deo, R. P., Richards, G. T., Crenshaw, D. M., & Kraemer, S. B. 2009, ApJ, 705, 14
- Diamond-Stanic & Rieke (2010) Diamond-Stanic, A. M., & Rieke, G. H. 2010, ApJ, 724, 140
- Dong & Wu (2016) Dong, X. Y., & Wu, X.-B. 2016, ApJ, 824, 70
- Doroshenko et al. (2001) Doroshenko, V. T., Lyuty, V. M., Bochkarev, N. G., et al. 2001, Astronomy Letters, 27, 65
- Elvis et al. (1994) Elvis, M., Wilkes, B. J., McDowell, J. C., et al. 1994, ApJS, 95, 1
- Esquej et al. (2014) Esquej, P., Alonso-Herrero, A., González-Martín, O., et al. 2014, ApJ, 780, 86
- Gandhi et al. (2015) Gandhi, P., Hönig, S. F., & Kishimoto, M. 2015, ApJ, 812, 113
- García-Burillo et al. (2016) García-Burillo, S., Combes, F., Ramos Almeida, C., et al. 2016, ApJ, 823, L12
- García-González et al. (2016) García-González, J., Alonso-Herrero, A., Hernán-Caballero, A., et al. 2016, MNRAS, 458, 4512
- Haas et al. (2000) Haas, M., Müller, S. A. H., Chini, R., et al. 2000, A&A, 354, 453
- Haas et al. (2003) Haas, M., Klaas, U., Müller, S. A. H., et al. 2003, A&A, 402, 87
- Hanish et al. (2013) Hanish, D. J., Teplitz, H. I., Capak, P., et al. 2013, ApJ, 768, 13
- Hao et al. (2005) Hao, L., Strauss, M. A., Fan, X., et al. 2005, AJ, 129, 1795
- Hatziminaoglou et al. (2015) Hatziminaoglou, E., Hernán-Caballero, A., Feltre, A., & Piñol Ferrer, N. 2015, ApJ, 803, 110
- Hernán-Caballero & Hatziminaoglou (2011) Hernán-Caballero, A., & Hatziminaoglou, E. 2011, MNRAS, 414, 500
- Ho (1999) Ho, L. C. 1999, ApJ, 516, 672
- Ho (2008) —. 2008, ARA&A, 46, 475
- Hönig & Kishimoto (2010) Hönig, S. F., & Kishimoto, M. 2010, A&A, 523, A27
- Imanishi et al. (2016) Imanishi, M., Nakanishi, K., & Izumi, T. 2016, ApJ, 822, L10
- Ivezic & Elitzur (1997) Ivezic, Z., & Elitzur, M. 1997, MNRAS, 287, 799
- Kawaguchi et al. (2001) Kawaguchi, T., Shimura, T., & Mineshige, S. 2001, ApJ, 546, 966
- Kirkpatrick et al. (2015) Kirkpatrick, A., Pope, A., Sajina, A., et al. 2015, ApJ, 814, 9
- Kirkpatrick et al. (2012) Kirkpatrick, A., Pope, A., Alexander, D. M., et al. 2012, ApJ, 759, 139
- Kishimoto et al. (2008) Kishimoto, M., Antonucci, R., Blaes, O., et al. 2008, Nature, 454, 492
- Koshida et al. (2014) Koshida, S., Minezaki, T., Yoshii, Y., et al. 2014, ApJ, 788, 159
- Lagache et al. (2003) Lagache, G., Dole, H., & Puget, J.-L. 2003, MNRAS, 338, 555
- Lagache et al. (2004) Lagache, G., Dole, H., Puget, J.-L., et al. 2004, ApJS, 154, 112
- Laor & Draine (1993) Laor, A., & Draine, B. T. 1993, ApJ, 402, 441
- Lawrence (1991) Lawrence, A. 1991, MNRAS, 252, 586
- Lebouteiller et al. (2011) Lebouteiller, V., Barry, D. J., Spoon, H. W. W., et al. 2011, ApJS, 196, 8
- Leipski et al. (2014) Leipski, C., Meisenheimer, K., Walter, F., et al. 2014, ApJ, 785, 154
- Lira et al. (2015) Lira, P., Arévalo, P., Uttley, P., McHardy, I. M. M., & Videla, L. 2015, MNRAS, 454, 368
- Liu et al. (2012) Liu, J. Y., Liu, B. F., Qiao, E. L., & Mineshige, S. 2012, ApJ, 754, 81
- Lusso et al. (2013) Lusso, E., Hennawi, J. F., Comastri, A., et al. 2013, ApJ, 777, 86
- Lutz (2014) Lutz, D. 2014, ARA&A, 52, 373
- Lynden-Bell (1969) Lynden-Bell, D. 1969, Nature, 223, 690
- Lyu et al. (2016) Lyu, J., Rieke, G. H., & Alberts, S. 2016, ApJ, 816, 85
- Lyu et al. (2017) Lyu, J., Rieke, G. H., & Shi, Y. 2017, ApJ, 835, 257
- Lyuty & Doroshenko (1999) Lyuty, V. M., & Doroshenko, V. T. 1999, Astronomy Letters, 25, 341
- Maiolino et al. (2007) Maiolino, R., Shemmer, O., Imanishi, M., et al. 2007, A&A, 468, 979
- Marconi et al. (2004) Marconi, A., Risaliti, G., Gilli, R., et al. 2004, MNRAS, 351, 169
- McAlary et al. (1983) McAlary, C. W., McLaren, R. A., McGonegal, R. J., & Maza, J. 1983, ApJS, 52, 341
- Mor & Netzer (2012) Mor, R., & Netzer, H. 2012, MNRAS, 420, 526
- Mor & Trakhtenbrot (2011) Mor, R., & Trakhtenbrot, B. 2011, ApJ, 737, L36
- Mullaney et al. (2011) Mullaney, J. R., Alexander, D. M., Goulding, A. D., & Hickox, R. C. 2011, MNRAS, 414, 1082
- Netzer (2015) Netzer, H. 2015, ARA&A, 53, 365
- Netzer et al. (2016) Netzer, H., Lani, C., Nordon, R., et al. 2016, ApJ, 819, 123
- Netzer et al. (2007) Netzer, H., Lutz, D., Schweitzer, M., et al. 2007, ApJ, 666, 806
- Neugebauer & Matthews (1999) Neugebauer, G., & Matthews, K. 1999, AJ, 118, 35
- Neugebauer et al. (1986) Neugebauer, G., Miley, G. K., Soifer, B. T., & Clegg, P. E. 1986, ApJ, 308, 815
- Neugebauer et al. (1989) Neugebauer, G., Soifer, B. T., Matthews, K., & Elias, J. H. 1989, AJ, 97, 957
- Petric et al. (2015) Petric, A. O., Ho, L. C., Flagey, N. J. M., & Scoville, N. Z. 2015, ApJS, 219, 22
- Pier & Krolik (1992) Pier, E. A., & Krolik, J. H. 1992, ApJ, 401, 99
- Pier & Krolik (1993) —. 1993, ApJ, 418, 673
- Polletta et al. (2000) Polletta, M., Courvoisier, T. J.-L., Hooper, E. J., & Wilkes, B. J. 2000, A&A, 362, 75
- Polletta et al. (2007) Polletta, M., Tajer, M., Maraschi, L., et al. 2007, ApJ, 663, 81
- Pozo Nuñez et al. (2015) Pozo Nuñez, F., Ramolla, M., Westhues, C., et al. 2015, A&A, 576, A73
- Prieto et al. (2010) Prieto, M. A., Reunanen, J., Tristram, K. R. W., et al. 2010, MNRAS, 402, 724
- Rex et al. (2010) Rex, M., Rawle, T. D., Egami, E., et al. 2010, A&A, 518, L13
- Reyes et al. (2008) Reyes, R., Zakamska, N. L., Strauss, M. A., et al. 2008, AJ, 136, 2373
- Richards et al. (2006) Richards, G. T., Lacy, M., Storrie-Lombardi, L. J., et al. 2006, ApJS, 166, 470
- Rieke (1978) Rieke, G. H. 1978, ApJ, 226, 550
- Rieke et al. (2009) Rieke, G. H., Alonso-Herrero, A., Weiner, B. J., et al. 2009, ApJ, 692, 556
- Rieke & Lebofsky (1981) Rieke, G. H., & Lebofsky, M. J. 1981, ApJ, 250, 87
- Rieke & Low (1972) Rieke, G. H., & Low, F. J. 1972, ApJ, 176, L95
- Rieke & Low (1975a) —. 1975a, ApJ, 200, L67
- Rieke & Low (1975b) —. 1975b, ApJ, 199, L13
- Roebuck et al. (2016) Roebuck, E., Sajina, A., Hayward, C. C., et al. 2016, ApJ, 833, 60
- Rujopakarn et al. (2013) Rujopakarn, W., Rieke, G. H., Weiner, B. J., et al. 2013, ApJ, 767, 73
- Runnoe et al. (2012) Runnoe, J. C., Brotherton, M. S., & Shang, Z. 2012, MNRAS, 426, 2677
- Runnoe et al. (2013) Runnoe, J. C., Shang, Z., & Brotherton, M. S. 2013, MNRAS, 435, 3251
- Salpeter (1964) Salpeter, E. E. 1964, ApJ, 140, 796
- Sanders et al. (1989) Sanders, D. B., Phinney, E. S., Neugebauer, G., Soifer, B. T., & Matthews, K. 1989, ApJ, 347, 29
- Schmitt et al. (2001) Schmitt, H. R., Antonucci, R. R. J., Ulvestad, J. S., et al. 2001, ApJ, 555, 663
- Schneider et al. (2015) Schneider, R., Bianchi, S., Valiante, R., Risaliti, G., & Salvadori, S. 2015, A&A, 579, A60
- Schnülle et al. (2015) Schnülle, K., Pott, J.-U., Rix, H.-W., et al. 2015, A&A, 578, A57
- Scott & Stewart (2014) Scott, A. E., & Stewart, G. C. 2014, MNRAS, 438, 2253
- Shang et al. (2011) Shang, Z., Brotherton, M. S., Wills, B. J., et al. 2011, ApJS, 196, 2
- Shi et al. (2014) Shi, Y., Rieke, G. H., Ogle, P. M., Su, K. Y. L., & Balog, Z. 2014, ApJS, 214, 23
- Shi et al. (2006) Shi, Y., Rieke, G. H., Hines, D. C., et al. 2006, ApJ, 653, 127
- Shi et al. (2007) Shi, Y., Ogle, P., Rieke, G. H., et al. 2007, ApJ, 669, 841
- Shields (1978) Shields, G. A. 1978, Nature, 272, 706
- Siebenmorgen & Krügel (2007) Siebenmorgen, R., & Krügel, E. 2007, A&A, 461, 445
- Sklias et al. (2014) Sklias, P., Zamojski, M., Schaerer, D., et al. 2014, A&A, 561, A149
- Smith et al. (2007) Smith, J. D. T., Draine, B. T., Dale, D. A., et al. 2007, ApJ, 656, 770
- Stalevski et al. (2016) Stalevski, M., Ricci, C., Ueda, Y., et al. 2016, MNRAS, 458, 2288
- Stierwalt et al. (2013) Stierwalt, S., Armus, L., Surace, J. A., et al. 2013, ApJS, 206, 1
- Sturm et al. (2000) Sturm, E., Lutz, D., Tran, D., et al. 2000, A&A, 358, 481
- Symeonidis (2017) Symeonidis, M. 2017, MNRAS, 465, 1401
- Symeonidis et al. (2016) Symeonidis, M., Giblin, B. M., Page, M. J., et al. 2016, MNRAS
- Willmer et al. (2009) Willmer, C. N. A., Rieke, G. H., Le Floc’h, E., et al. 2009, AJ, 138, 146
- Xu et al. (2015) Xu, L., Rieke, G. H., Egami, E., et al. 2015, ApJS, 219, 18
- Yuan & Narayan (2014) Yuan, F., & Narayan, R. 2014, ARA&A, 52, 529